∎
22email: olesya@icmp.lviv.ua 33institutetext: Yu. Holovatch 44institutetext: Institute for Condensed Matter Physics of the National Academy of Sciences of Ukraine, 1 Svientsitskii Str., 79011 Lviv, Ukraine 55institutetext: R. Kenna 66institutetext: Applied Mathematics Research Centre, Coventry University, Coventry, CV1 5FB, England 77institutetext: B. Berche 88institutetext: Université de Lorraine, Statistical Physics Group, IJL, UMR CNRS 7198, Campus de Nancy, B.P. 70239, 54506 Vandœuvre lès Nancy Cedex, France
Quantifying the evolution of a scientific topic: reaction of the academic community to the Chornobyl disaster
Abstract
We analyze the reaction of academic communities to a particular urgent topic which abruptly arises as a scientific problem. To this end, we have chosen the disaster that occurred in 1986 in Chornobyl (Chernobyl), Ukraine, considered as one of the most devastating nuclear power plant accidents in history. The academic response is evaluated using scientific-publication data concerning the disaster using the Scopus database to present the picture on an international scale and the bibliographic database “Ukrainika naukova” to consider it on a national level. We measured distributions of papers in different scientific fields, their growth rates and properties of co-authorship networks. The elements of descriptive statistics and the tools of the complex network theory are used to highlight the interdisciplinary as well as international effects. Our analysis allows to compare contributions of the international community to Chornobyl-related research as well as integration of Ukraine in the international research on this subject. Furthermore, the content analysis of titles and abstracts of the publications allowed to detect the most important terms used for description of Chornobyl-related problems.
Keywords:
topic evolution terms indentification bibliometric analysis authorship networks interdisciplinarity text mining Chornobyl disasterIntroduction
Tracing the evolution of scientific topics is a subject area which belongs to the general problem of mapping the structure of scientific knowledge. It is important for distribution of funds, detection of ‘hot topics’, strategic management and other objectives. Can we find the most promising areas for research? Is it possible to explain interest in particular topics or to predict one? How should one monitor the evolution of topics which discuss competitive solutions of a problem? Due to a complexity of science, these and many other questions remain open problems_1 ; problems_2 ; problems_3 . This case study is an attempt to contribute to the exploration of these problems.
Similar to studying public opinion on a particular topic by analysing news in mass media, a method to trace the usage of scientific concepts is to analyse published works. The first evidence for the emergence of a new topic is likely to be found in the journal papers. Therefore, bibliometrical data bases can be used to study the history of scientific topic evolution from its appearance and until its extinction or merger with other topics Zuccala11 . The results of such an analysis are presented in this paper: our aim is to show how the scientific community reacts to a particular problem, what are the collaboration profiles and the interdisciplinary landscape, and whether one can detect a fading or maintenance of interest to the problem. Unlike in Zuccala11 , where wide and continuously topical problem was chosen for analysis, here we concentrate on the discussion of a particular event, which occurred at a certain point in time. In this case we can precisely define the starting point of the emergence of the new topic. The fact that two of us are Ukrainian had some bearing on the choice of this study too. Of course, the reaction of society on particular events has been studied before as well. Several kinds of natural disasters including Chornobyl accident were considered as triggers to analyse the publication reaction in newspapers, Internet newsgroups, several kinds of scholar and technical bibliographic databases, etc., see Weessies07 ; Magnone12 . But different (more limited) set of tools were used in these studies. In particular, the analysis of reaction on Chornobyl accident in Weessies07 is more concentrated on the comparison of scholar and non-scholar data. Here we combine numerous technics to analyse academic response in more details including interdisciplinary and international effects. Moreover, different databases are used here: Scopus database, which is considered as more interdisciplinary and more international comparing to Web of Science, is used for bibliometric data collection on a world-level. The data, that correspond to the local region of the accident are gathered from the Ukrainian abstract database called Ukrainika naukova Ukrainika . Such an attention to a particular area, which is geographically close to the event epicenter, is not our invention – the same approach was used in Magnone12 to analyse the short-term effects in publishing activity after Japan’s triple disaster.
One of the most devastating nuclear accidents happened on April 26, 1986 at the Chornobyl nuclear power plant in Ukraine. Chornobyl-related problems have been discussed during the last 29 years by society, including, of course, the scientific community. The evolution of the corresponding topic is studied here. Our study is based on Scopus publication data, supplemented by bibliographic information retrieved from the Ukrainika naukova.
The description of our datasets along with the results of initial statistical analysis is given in the section 1. The international collaboration profile is examined in section 2, while the interdisciplinary landscape and subtopics diversity are discussed in sections 3 and 4, correspondingly. Some of our results were previously announced in Mryglod12 .
1 Datasets and their evolution
All the publications from Scopus, which contain any spelling of “Chornobyl” (chornobyl OR chornobyl’ OR chernobyl OR chernobyl’) in their titles, abstracts or keywords were chosen for analysis: above 9 500 records in total111The data collected during January–February 2015 are used in this research.. Only a very small number — just 19 papers — were published before the accident. This indicates that the vast majority of publications are related to this particular event and we consider to the publication period starting from 1986. The searching request for the Ukrainika naukova database was performed in a similar way: different spellings “Chornobyl” in English, Ukrainian and Russian were used to find the relevant publications. Although the latter is far from being complete, it is the best source of information about the Ukrainian- and Russian-language publications in local journals and books, especially for social sciences and humanities. At the end, 1 918 items, starting from 1997, were found. Another peculiarity of Ukrainika naukova is that single record can refer to not only single journal papers, but also to collection of publications, book or conference proceedings.
In Fig. 1 (a) the annual total number of Chornobyl-related records from Scopus and Ukrainika naukova are shown. The peaks which occurred due to an ‘anniversary effect’ can be instantly distinguished: in 1996 (10 years after the accident) for Scopus data, in 2006 and in 2011 (20th and 25th anniversaries, correspondingly) for both datasets – the same effect was observed earlier in Weessies07 . There is a smaller peak in the Scopus data in 2009 and we assume that this is partly attributable to a number of publications in the Annals of the New York Academy of Sciences translation which appeared as a collection of translated chapters of Russian book about Chornobyl, which was originally published in 2007. The corresponding publication peaks are also observed for the separate disciplines, as it will be seen further from Figs. 5 and 6 (see also Weessies07 ). This gives us a possibility to compare our results for Chornobyl accident case with the results, obtained for the other topic, which is not characterized by special time limits. In Zuccala11 the dynamics of poverty research is analysed and no particular peaks similar to those observed in Figs. 5, 6 can be observed in figure 1 from this paper. This allows to assume that such distinct patterns of publication activity are rather not characteristic to the gradually emerging topic, but more typical for particular event-related problems.
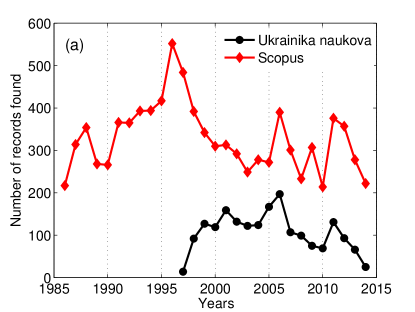
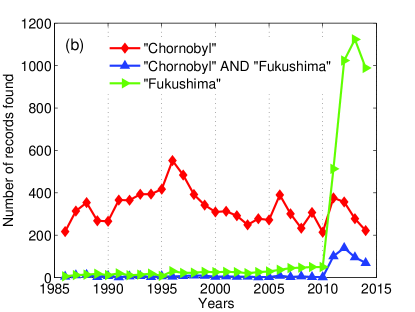
One notices also for Scopus data, that the decay after 2011 is less steep comparing to the ones which followed previous peaks (Fig. 1 (a) and (b)). This can be explained by the nuclear catastrophe in 2011 in Japan (Fukushima); the appearance of the competitive topic presumably provokes the number of comparative studies and the reactivation of interest to Chornobyl. On the other hand, the new problem naturally attracts more attention causing the fading of major interest in the older one. In Fig. 1 (b) one can clearly see the increased number of papers relevant to both Chornobyl and Fukushima in 2012, but the total number of Fukushima-related papers is much larger. Comparing the curves related to both accidents, it is easy to see that the same patterns appear at the very beginning: number of publications increases during the first three years after the trigger event and decreases afterwards.
2 International collaboration profile
The level of publication activity, analysed above, is an indicator of general interest in the Chornobyl topic. Let us look on it now in more details, specifying how this interest evolved in different countries. To this end, we use affiliation data of Chornobyl-related papers to investigate international collaboration patterns. Unfortunately, not all publication records contain the necessary information. The affiliation data are absent for the majority of documents found in the Ukrainika naukova. However, Scopus records are provided by such data and thus, we continue our analysis based only on this dataset.
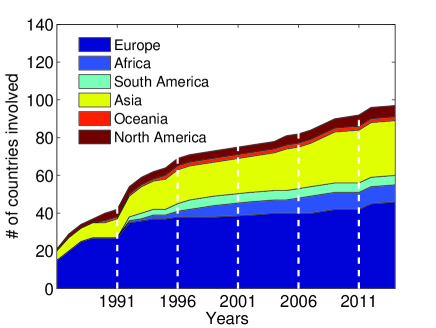
In Fig. 2 the cumulative numbers of countries from different parts of the world which contributed scientifically to the Chornobyl problem are shown for each year. Numerous European and Asian countries started to contribute into Chornobyl topic from the very beginning, while some countries joined after 1991 and then after 1995 (the small “jumps” of cumulative curves can be observed in figure for these years).
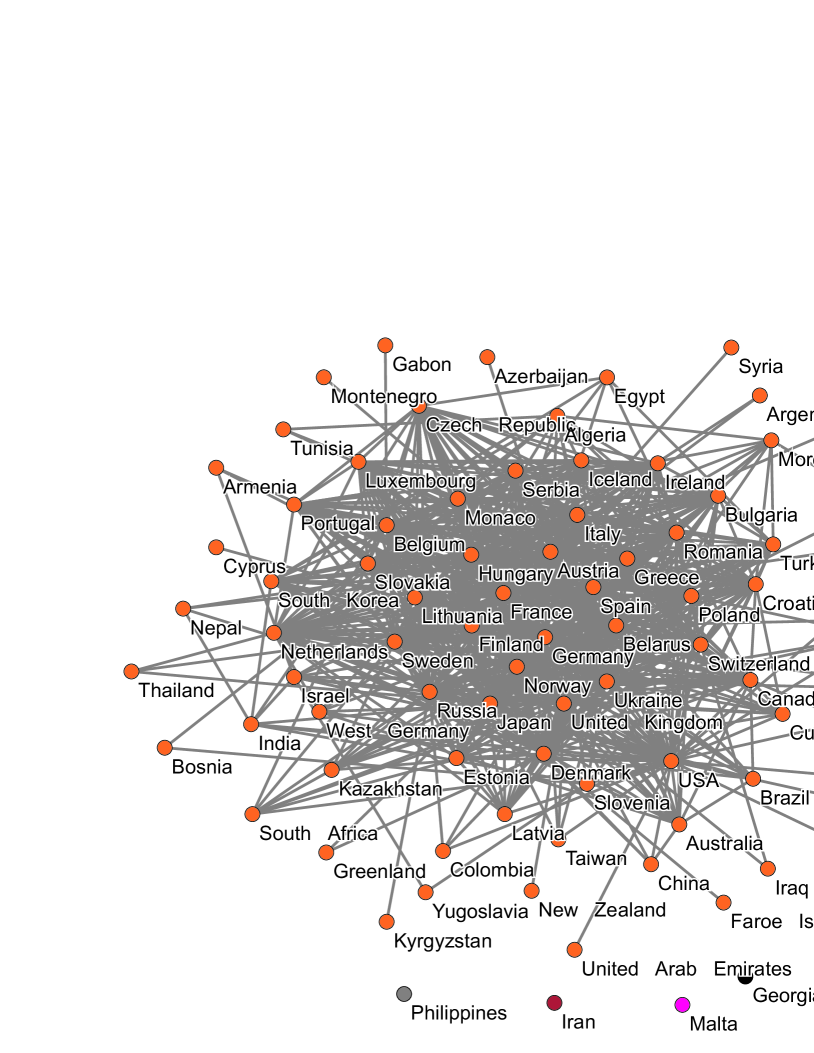
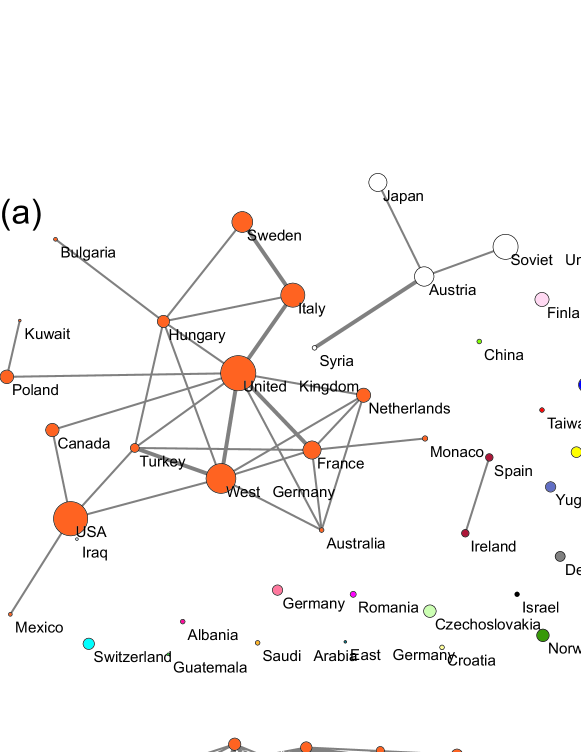
Affiliation data are used to build the co-authorship network on level of countries and, thus, to analyse the international collaboration patterns. Nodes in this network represent different countries, and these are deemed linked if a paper is co-authored by authors from the two corresponding countries. For the weighted variant of the network, the strength of each link is proportional to the number of common papers. The network is visualized in Fig. 3 applying Pajek network visualization software Pajek , which is widely used for visualising and analysing complex networks, see, e.g., Leydesdorff14 . It consists of 97 nodes, 80 of which (almost 83%) belong to a single connected (giant) component. Within this component it takes 2 steps on average to connect any pair of countries by collaboration links; the longest distance between two countries consists of 4 steps. The average node degree, i.e., number of adjacent links, is 15, which means that each country on average collaborates with 15 others. Among the hubs with more than 40 links two categories of countries can be identified – the developed ones, such as the USA, Germany, France, Austria, etc. and the countries close to the event epicenter such as Ukraine, Russia and Belarus. On the other hand, 17 isolated nodes correspond to the countries with no collaboration within Chornobyl topic. This includes a number of Asian and African countries, as well as countries that do not exist anymore as political ebtities, such as Czechoslovakia. The value of the network clustering coefficient, which shows the general tendency to create cliques222Fully connected graph (each node is connected with any other node) is characterized by clustering coefficient equals to 1, while value 0 characterize tree-like structure. (the fully connected network fragments), is close to 0.78. This value, together with short average shortest path between the pair of nodes and the fat-tailed degree distribution, tells us that the constructed network is not random – it is compact, but strongly correlated.
To take into account the historical circumstances and to see how the network dynamically changes in time, it is reasonable to study it within particular time windows. To give an example, the networks, generated for the first and the last five years after Chornobyl disaster, are shown in Fig. 4. The network in Fig. 4 (a) is less connected comparing to that Fig. 4 (b): the clustering coefficient is for the first period and for the second. Besides, the size of the largest component also increases, containing only 38% of nodes in the first instance and 82% in the second. The reason for such densification is not completely clear. It may be because science is becoming more collaborative (due to, e.g., an improved communication environment thanks to the Internet and numerous international exchanging projects). One can also suggest that the global consequences of the Chornobyl accident became more obvious even for remote countries and, therefore, more studied internationally after 20 years. To try to shed light on this and other patterns of publication activity associated with the Chornobyl problem, we study the interdisciplinary profile as well as thematic spectra in the following sections.
3 Interdisciplinary landscape
While the changing of the total number of Chornobyl-related publications shows the general interest to the topic, it is hard to say if the same dominant disciplines are ‘responsible’ for all publications peaks, or maybe interdisciplinary landscape is changing over time. In order to determine this, further we analyse the contribution of each discipline.
Since the problem of subject classification of scientific papers is far from being trivial, the widely adopted way to assign the disciplinary label is based on some metadata such as authors or editorial keywords, or thematic indices such as PACS or UDC numbers PACS ; UDC . Besides other drawbacks, this procedure usually deals not with individual documents, but with their collections: journals, books, etc. On the one hand, according to the Scopus classification scheme, each journal title is assigned to one or more subject categories. This gives us the opportunity to divide the set of papers among 27 disciplines. On the other hand, each record found in Ukrainika naukova is labeled by one or more special hierarchical subject indices, according to the inner classifications scheme with 34 disciplines defined. Using the implemented classification algorithms and having all these cautions in mind, we perform the analysis of the interdisciplinary landscape of Chornobyl-related publications.
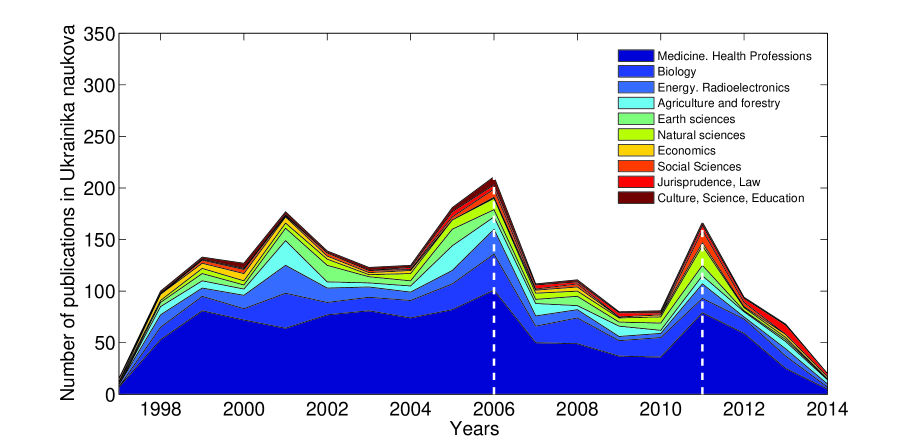
The current TOP5 list of disciplines by the total number of Chornobyl-related papers in Scopus contains: Medicine (3 635 papers); Environmental Science (3 156); Energy (1 470); Physics and Astronomy (1 437); Biochemistry, Genetics and Molecular Biology (1 198). The annual numbers of publications, assigned to these and the next five dominant disciplines in Scopus are presented in Fig. 5. Considering these data as representative sample which reflects the international scientific reaction, one can conclude that, naturally, the topics of highest interest relate to the most problematic consequences of Chornobyl disaster: impact on human health and the environment. A similar conclusion can be drawn from Fig. 6, where the annual numbers of documents in Ukrainika naukova are shown. Six dominant disciplines here also deal with medical and environmental problems. However, the next four subject categories can be attributed to the other dimensions of human life: Chornobyl-related problems in Economics, Social Sciences, Law and Culture are highly discussed on the local scale. The disproportion of Scopus database coverage of natural and social sciences on one hand and peculiarities of Ukrainian database on the other hand can play a role here. But obviously, territories which are close to the accident epicenter experience a higher diversity of perturbations in different spheres of human life.
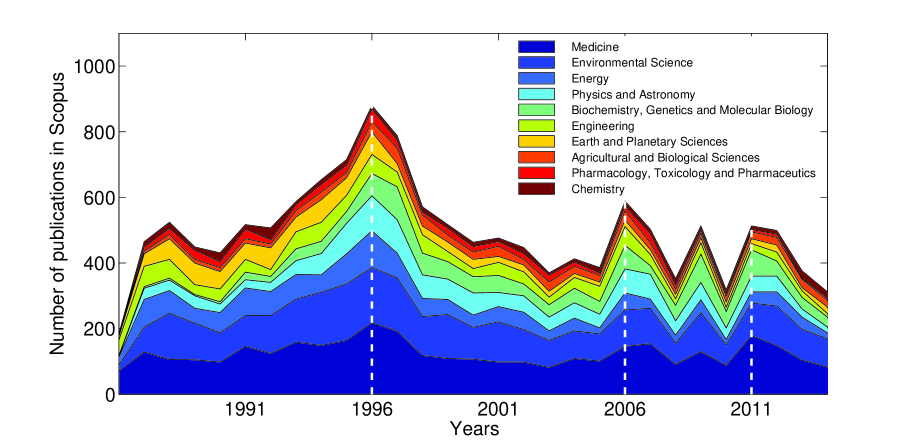
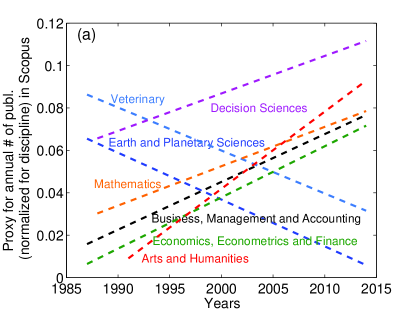
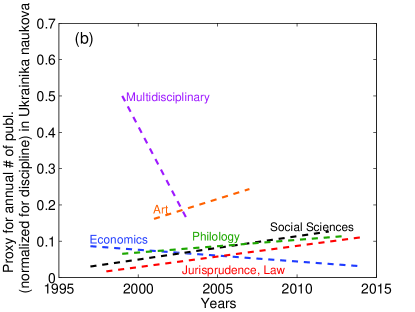
Figs. 5 and 6 also show that the total amount of publications for some disciplines, such as Medicine, remains essentially stable during the years, while the others, for example, Biochemistry, Genetics and Molecular Biology, start to develop later. In Fig. 1 one can notice that the annual total numbers of documents currently fluctuate on a certain level, indicating the sufficiently constant interest to the topic on average. Yet, it is interesting to investigate the tendencies within each particular discipline: each line in Fig. 7 is a linear fit for the annual number of published documents within a particular discipline, normalized on the total number of documents for this discipline333The years with no publications are not taken into account here.. The slopes of the lines indicate the ‘tendency’ within each particular discipline: negative one means that Chornobyl problem becomes less discussed and vice versa; small absolute value of slope indicates a stable interest in the topic. Eventually, the ‘immediate’ consequences of Chornobyl disaster become less discussed, while researchers switch to the study of ‘remote’ effects. To give an example, the initial interest to Chornobyl problems in Veterinary fades out during 25 years, while such disciplines as Arts or Economics become more and more relevant, see Fig. 7 (a). Another good example, which can be seen in Fig. 7 (b), is Law – supposedly, due to a legal issues connected with a huge number of Ukrainians moved from Chornobyl to the others regions and with the families of accident liquidators, the legal problems are highly discussed on a national scale.
Only 25% of disciplines are represented in Fig. 7. These have the most significant absolute values of slope. The rest, including Medicine, Environmental Science, Physics and Astronomy, demonstrate rather a more stable level of interest in Chornobyl problems. More detailed analysis such as an attempt to understand the topical spectra of Chornobyl-related publications within particular disciplines based on the content-analysis of titles or abstracts, is discussed in section 4.
4 Thematic spectrum
While the interdisciplinarity of Chornobyl-related research, discussed in the previous section, gives a general picture of the thematic structure, there are different approaches to investigate it at a finer level Schneider_thesis ; Eck_thesis ; Eck10 ; Anick99 . One possibility is to perform content analysis dealing with the full texts of publications, separate paragraphs, titles, abstracts and/or keywords Zuccala11 ; Pollack15 . Here we connect with scientometric problems called “mapping of science”, broadly described in the literature starting from the second half of last century mapping_old and continuing with the most recent research mapping_new . Such maps show the thematic structure of documents (scientific publications in our context) by grouping the terms in accordance to their similarity: the idea is that related or similar words appear close to each other on a map. The mapping problem is complex since similarity can be defined in different ways: based on the number of co-occurrences in the documents or its fragments, co-citations, or other data, Jaccard coefficient, Cosine similarity, Euclidean distance, or others proximity measures can be calculated (e.g., see Schneider_thesis ). On the other hand, the notion of term is not formalized so far. Usually, terms mean content words, which transmit the main ideas of the document unlike the functional ones, which are used rather as a ‘linguistic environment’ to carry out the content words Schneider_thesis ; Pazienza05 ; Kageura96 . It is not a trivial task to distinguish the former from the latter, therefore, various approaches can be considered, but often the idea of distributional differences between the content and functional words is explored Schneider_thesis ; Eck_thesis ; Eck10 ; Anick99 ; Kageura96 . For example, the distributions of occurrences or co-occurrences of words in documents (or in the selected groups of documents) can be compared. The higher values of the so-called termhood, which is usually the numerical representation of such a difference, allows one to label words as terms. Further we discuss this idea more in details.
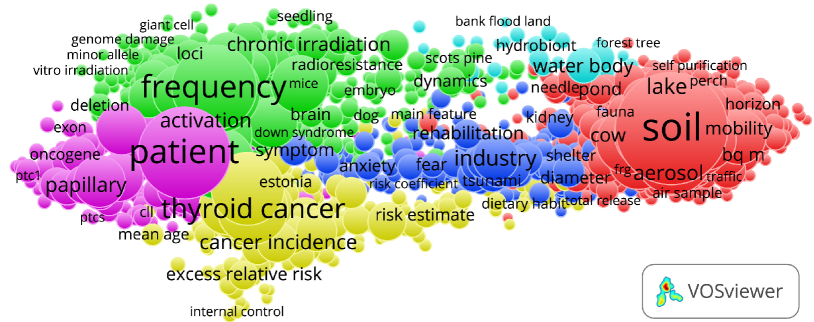
The terms map for Chornobyl-related papers within TOP5 disciplines (see section 3) found in Scopus database is shown in Fig. 8. This map is automatically generated by VOSviewer software VOS ; Eck_text and it is based on the analysis of co-occurrences of terms in the titles and abstracts (each pair of title and abstract is treated as a single document). There, the 60% most relevant terms444Only words and phrases, which occurred at least 10 times (default value) in different documents were considered as the candidates for terms. for Chornobyl publications in TOP5 disciplines are mapped. The clustering algorithm, implemented into the VOSviewer program Eck_community , allows us to see several groups of terms (different colors online): four large and two smaller ones. While these clusters do not correspond one-to-one to the list of disciplines, one can clearly distinguish two main areas of Chornobyl-related problems which were already mentioned above: impact on human health (three big clusters on the left-hand side, purple, yellow and green online) and the environmental consequences (large cluster on the right-hand side, red online). Moreover, the dominant subtopics can also be seen from the first glance at the map: cancer threats, genetic effects, different ways of contamination spreading.
Taking one step back, here we describe the key points of the term selection procedure we have chosen to analyze the Scopus set of Chornobyl-related publications.
-
i.
We analyse separately titles and abstracts, i.e., each title is treated as one document in the first case, while in the second case document contains only publication abstract. Scopus publication data for five dominant disciplines (Medicine – 3610 papers; Environmental Science – 3141; Energy – 1476; Physics and Astronomy – 1441; and Biochemistry, Genetics and Molecular Biology – 1192) and two additional ones (Arts and Humanities – 59 papers; Social Sciences – 310) were used.
-
ii.
Special linguistic software called tagger is used in the second step to label each word by the part of speech and to define its root form. As in Zuccala11 ; Eck10 , the freely available program TreeTagger Schmid94 ; Schmid95 ; TreeTagger is used.
-
iii.
Representing the ‘conceptual units’ of the text, terms usually are expressed in a form of noun phrases (single- or multiple-words) Schneider_thesis ; Eck_thesis ; Eck10 . Similarly to Eck10 , as candidates for terms we select all single nouns and sequences of words which satisfy the general rule:
*adjective *noun”. This general form means, that a phrase can start with any number of adjectives (optional) and ends with any number of nouns, e.g. ‘genetic effect’, ‘low-dose radiation exposure’, ‘invisible radioactive radiation’, etc. The listed noun phrases (both single- and multiple-words) – our candidates for terms – are called semantic units Eck_thesis ; Eck10 . In general, we get 80 094 semantic units for abstracts dataset and 15 020 for titles dataset. -
iv.
We use the binary way to count the number of occurrences of semantic units in the documents (each unit is counted once per document). For multi-word semantic units we count the number of occurrences not only for the entire semantic unit, but also for its constituent parts. In this way we are dealing with the so-called nested terms, which are terms that are part of other longer terms Eck_thesis . Example: for the semantic unit ‘chernobyl nuclear power plant accident’ we count the occurrences of ‘chernobyl nuclear power plant accident’; ‘nuclear power plant accident’; ‘power plant accident’; ‘plant accident’ and ’accident’.
Obtained in this way frequency-rank distributions for semantic units in abstracts and titles are shown in Figs. 9 (a), (b), correspondingly. One can notice the power-law nature of these distributions, which is typical for the distribution of words in natural texts Zipf_in_text1 ; Zipf_in_text2 . Moreover, the power-law exponents in Fig. 9 are relatively close to 1 (especially for the abstracts dataset), demonstrating the well-known Zipf’s law Zipf_def . This is not an obvious result, since Zipf’s law was formulated for the set of any words in the text, while here we operate only with noun phrases.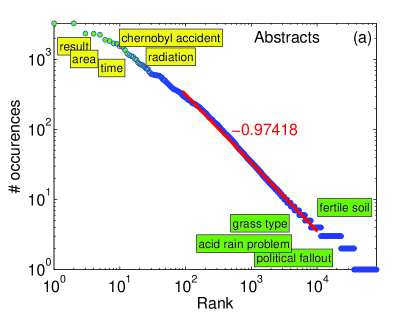
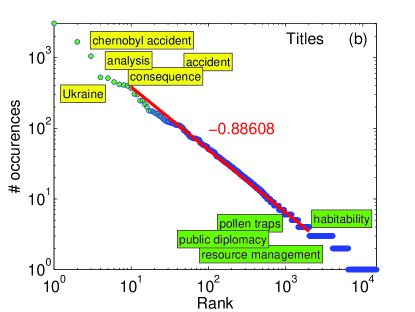
Figure 9: Frequency-rank distributions for semantic units in: (a) abstracts and (b) titles of Chornobyl-related publications within seven chosen disciplines based on the Scopus data. -
v.
The terms should be defined and screened out from the final list of semantic units. Contrary to the intuitive understanding, the specificity of the term is not directly correlated with its frequency (this can be also seen further in Fig. 11). It is known that the most frequent words, which are at the beginning of Zipf’s plot, are usually the most general ones such as ‘Chornobyl accident’ or ‘radiation’ in our datasets (see Fig. 9). The words with the lowest number of occurrences, which can be found in the tail of the distributions in Fig. 9, are naturally very specific, but no statistical conclusions can be drawn. The most probable candidates for terms correspond to the middle part of the frequency-rank distribution Schneider_thesis . Thus, we already apply the lower threshold for the number of occurrences : semantic units, which occurred in four or less documents, were excluded from the analysis on this step. The choice of the critical value was made because of an empirical observation that the number of semantic units with the number of occurrences above criticality decays slowly for and rapidly for .
Unlike a functional word, which can be distributed over topics or disciplines equally randomly, a content word or term is supposed to be specific. The variant of termhood, defined in Eck_thesis ; Eck10 , is used here to measure the specificity of each semantic unit, i.e., how much it is biased towards a particular discipline/disciplines. The termhood of a semantic unit is defined as Eck_thesis ; Eck10 a difference between two probability distributions and : shows the probability of any semantic unit to occur within discipline (), while provides the probability of semantic unit to occur within the discipline . We illustrate both distributions in Fig. 10 where obtained for the abstract dataset is accompanied by the distributions for two selected semantic units with high and low termhood. As the frequency of occurrences of term “population” within each discipline is close to the generally expected ones (the shape of is close the shape of ), we conclude that this particular term is not specific for any of disciplines considered. But the situation is different for the term “cold war”: as one can see, it occurred much more frequently in humanity papers, that it is expected. Therefore, we consider it as specific for “Arts and Humanities” for our database. In our opinion, these findings correspond to the intuitive speculations quite well. The general shape of is similar for the titles dataset too.
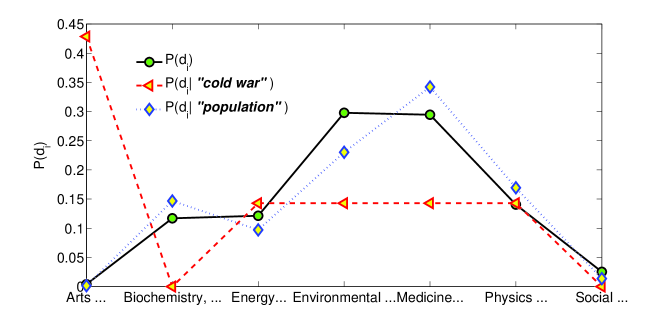
Figure 10: Probability distributions of semantic units occurrences within different disciplines . General distribution is accompanied by the distributions for two selected semantic units: “cold war” (high termhood) and “population” (low termhood). There are different methods of numerical comparison of two distributions but we continue to use the one suggested in Eck_thesis ; Eck10 . Thus, the termhood of semantic unit is calculated in a following way:
where
and .
The higher the value of a termhood, the more specific (more relevant to particular disciplines) term is. As one can see in Fig. 11, the compromise between the frequency and specificity of the term should be found, but a solution is not obvious. Therefore, any resulting list of terms will be provisional to some extent. But since text mining procedures usually requires expert evaluation on different stages, so we consider this as normal. We end here with the list of terms, which satisfies condition: , where is the 50th percentile (P50); and belongs to the TOP50 of the terms list, sorted by values (product of and , renormalized to fit them into [0..1] interval). Such a way of ordering was chosen to give additional preference to specificity of terms comparing to their frequency.
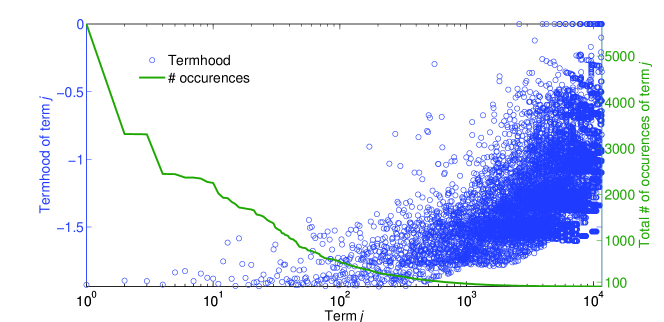
Figure 11: Termhood vs. total number of occurrences for semantic units in the abstracts dataset.
The final TOP20 list of terms (see Tables 1 and 2), obtained from abstracts and titles, contains mainly those, which are more specific for Biochemistry, Genetics and Molecular Biology, which occur at first time at the beginning of 90-ies. The selected environmental terms correspond to earlier years (1987–1991), while humanity dominant terms – to later period (2002–2006). This brings us again to the idea of non-synchronous development of Chornobyl topic within different disciplines, as it was already shown above (e.g., see Fig. 7). It is important to note, that much more interesting results could be obtained using cumulative data in order to perform the dynamical content analysis. Certainly, it would be useful to consider the occurrences frequency changes to see how particular terms become more or less topical in time. This can be done using larger database to operate with statistically sufficient numbers.
| Terms | Specific for Discipline: | Year of the 1st occurrence |
|---|---|---|
| carcinoma | Biochemistry, Genetics and Molec. Biology | 1992 |
| thyroid carcinoma | Biochemistry, Genetics and Molec. Biology | 1992 |
| tumor | Biochemistry, Genetics and Molec. Biology | 1994 |
| gene | Biochemistry, Genetics and Molec. Biology | 1987 |
| rearrangement | Biochemistry, Genetics and Molec. Biology | 1993 |
| papillary thyroid carcinoma | Biochemistry, Genetics and Molec. Biology | 1995 |
| ptc† | Biochemistry, Genetics and Molec. Biology | 1995 |
| papillary carcinoma | Biochemistry, Genetics and Molec. Biology | 1992 |
| science | Arts and Humanities | 2002 |
| carcinogenesis | Biochemistry, Genetics and Molec. Biology | 1994 |
| malignancy | Biochemistry, Genetics and Molec. Biology | 1992 |
| activity ratio | Environmental Science | 1987 |
| threat | Arts and Humanities | 2006 |
| metastasis | Biochemistry, Genetics and Molec. Biology | 1992 |
| surgery | Biochemistry, Genetics and Molec. Biology | 1994 |
| policy | Social Sciences | 1989 |
| cleanup worker | Biochemistry, Genetics and Molec. Biology | 1997 |
| high frequency | Biochemistry, Genetics and Molec. Biology | 1990 |
| nuclear disaster | Social Sciences | 1990 |
| discharge | Environmental Science | 1988 |
† ptc is the abbreviation of ‘papillary thyroid carcinoma’
| Terms | Specific for Discipline: | Year of the 1st occurrence |
|---|---|---|
| carcinoma | Biochemistry, Genetics and Molec. Biology | 1993 |
| thyroid carcinoma | Biochemistry, Genetics and Molec. Biology | 1993 |
| patient | Biochemistry, Genetics and Molec. Biology | 1991 |
| rearrangement | Biochemistry, Genetics and Molec. Biology | 1991 |
| sediment | Environmental Science | 1987 |
| papillary thyroid carcinoma | Biochemistry, Genetics and Molec. Biology | 1995 |
| transport | Environmental Science | 1987 |
| mutation | Biochemistry, Genetics and Molec. Biology | 1989 |
| tumor | Biochemistry, Genetics and Molec. Biology | 1994 |
| cleanup worker | Biochemistry, Genetics and Molec. Biology | 1993 |
| cleanup | Medicine | 1992 |
| unit | Energy | 1982 |
| history | Arts and Humanities | 2009 |
| pond | Environmental Science | 1987 |
| policy | Social Sciences | 1988 |
| prevalence | Biochemistry, Genetics and Molec. Biology | 1995 |
| black sea | Environmental Science | 1987 |
| thyroid disease | Biochemistry, Genetics and Molec. Biology | 1991 |
| radiation protection | Arts and Humanities | 2006 |
| forest ecosystem | Environmental Science | 1991 |
5 Summary
The aim of this case study is to contribute to the complex problem of analysing the scientific trends. To study the reactions of scientific community to the particular topic – Chornobyl disaster – the set of relevant publications was analysed. To this end a number of different tools were used: bibliometrical analysis, descriptive statistics methods, complex networks theory and the elements of content analysis.
Summarizing the results, we can state that Chornobyl problem permanently attracts the interest of researchers. While some disciplines demonstrate a decreasing publication activity within Chornobyl topic, the experts in other fields become more interested. This can be explained by the gradual changing of thematic spectrum: the environmental and medical consequences are obvious from the very beginning, while remote genetic effects could be seen later. The topics of current interest vary not only in with respect to the disciplines, but also to the geographic remoteness from the epicenter of the accident. While the international scientific community all over the world is interested in medical, environmental or physical problems related to Chornobyl, in the neighbouring countries different social, cultural and other humanity y aspects became also evident. Such countries, along with the most developed ones, contribute the most. The collaboration within Chornobyl-related problems becomes more and more tight: geography of the problem expands. The content-analysis of publication abstracts and titles allows one to refine analysis of thematic structure of Chornobyl problem. Among numerous subtopics, two big sets of problems remain the most important: those which are connected with the human health and the environmental ones.
To conclude, the study of the evolution of competitive scientific topics would be an interesting challenge for the future. Having the results of analysis of retrospective data, it is possible to try to predict the future publication activity patterns. The results of numerous case studies can be used in detecting the typical patterns, universal for different topics.
Acknowledgements
This work was supported by the 7th FP, IRSES projects No. 295302 “Statistical physics in diverse realizations”, No. 612707 “Dynamics of and in Complex Systems”, No. 612669 “Structure and Evolution of Complex Systems with Applications in Physics and Life Sciences” and by the COST Action TD1210 “Analyzing the dynamics of information and knowledge landscapes”. OM would like to thank to Nees Jan van Eck for a useful discussion and explaining some key features of the VOSviewer program.
References
- (1) Tseng, Y. H., Lin, Y. I., Lee, Y. Y., Hung, W. C., & Lee, C. H. (2009). A comparison of methods for detecting hot topics. Scientometrics, 81(1), 73–90.
- (2) Akritidis, L., Katsaros, D., & Bozanis, P. (2012). Identifying attractive research fields for new scientists. Scientometrics, 91(3), 869–894.
- (3) Delanoe, A., & Galam, S. (2014). Modeling a controversy in the press: The case of abnormal bee deaths. Physica A: Statistical Mechanics and its Applications, 402, 93–103.
- (4) Zuccala, A., & van Eck, N. J. (2011). Poverty research in a development policy context. Development Policy Review, 29(3), 311–330.
- (5) Weessies, K. (2007). The publishing dynamics of catastrophic events. Journal of the American Society for Information Science and Technology, 58(6), 856–861.
- (6) Magnone, E. (2012). An analysis for estimating the short-term effects of Japan’s triple disaster on progress in materials science. Journal of Informetrics, 6(2), 289-297..
- (7) http://www.nbuv.gov.ua/node/512 Accessed 28 October 2015.
- (8) Mryglod, O., Holovatch, Yu. (2012). Reaction of the academic community to Chornobyl disaster: analysis of publication topics dynamics. (2012) Herald of the Nat. Acad. Sci. of Ukraine, 7, 59–69 (in Ukrainian).
- (9) Yablokov, A. V., Nesterenko, V. B., & Nesterenko, A. V. (2010). 15. Consequences of the Chernobyl catastrophe for public health and the environment 23 years later. Chernobyl, 318.
- (10) Vlado, A. Pajek: Program for large network analysis. http://vlado.fmf.unilj.si/pub/networks/pajek/. Accessed 1 April 2015
- (11) Leydesdorff, L., Khan, G. F., Bornmann, L. The generation of large networks from Web of Science data. El Profesional de la Informacion, 23(6), 589-593. arXiv preprint arXiv:1409.4898.
- (12) PACS (2010). Physics and Astronomy Classification Scheme. http://journals.aps.org/PACS. Accessed 1 April 2015
- (13) UDC (2015) Universal Decimal Classification. http://www.udcc.org. Accessed 1 April 2015
- (14) Schneider, J. W. (2005, June). Verification of bibliometric methods’ applicability for thesaurus construction. In ACM SIGIR Forum (Vol. 39, No. 1, pp. 63–64). ACM.
- (15) van Eck, N. J. (2011). Methodological advances in bibliometric mapping of science (No. EPS-2011-247-LIS). Erasmus Research Institute of Management (ERIM).
- (16) van Eck, N. J., Waltman, L., Noyons, E. C., & Buter, R. K. (2010). Automatic term identification for bibliometric mapping. Scientometrics, 82(3), 581–596.
- (17) Anick, P. G., & Tipirneni, S. (1999, August). The paraphrase search assistant: terminological feedback for iterative information seeking. In: Proceedings of the 22nd annual international ACM SIGIR conference on Research and development in information retrieval (pp. 153–159). ACM.
- (18) Pollack, J., & Adler, D. (2015). Emergent trends and passing fads in project management research: A scientometric analysis of changes in the field. International Journal of Project Management, 33(1), 236–248.
- (19) Rip, A. (1988). Mapping of science: Possibilities and limitations.
- (20) Ravikumar, S., Agrahari, A., & Singh, S. N. (2015). Mapping the intellectual structure of scientometrics: a co-word analysis of the journal Scientometrics (2005- 2010). Scientometrics, 102(1), 929–955.
- (21) Pazienza, M. T., Pennacchiotti, M., & Zanzotto, F. M. (2005). Terminology extraction: an analysis of linguistic and statistical approaches. In Knowledge Mining (pp. 255–279). Springer Berlin Heidelberg.
- (22) Kageura, K., & Umino, B. (1996). Methods of automatic term recognition: A review. Terminology, 3(2), 259–289.
- (23) van Eck, N. J., & Waltman, L. (2010). Software survey: VOSviewer, a computer program for bibliometric mapping. Scientometrics, 84(2), 523–538.
- (24) van Eck, N. J., & Waltman, L. (2011). Text mining and visualization using VOSviewer. arXiv preprint arXiv:1109.2058.
- (25) Waltman, L., & van Eck, N. J. (2013). A smart local moving algorithm for large-scale modularity-based community detection. The European Physical Journal B, 86(11), 1–14.
- (26) Schmid, H. (1994, September). Probabilistic part-of-speech tagging using decision trees. In Proceedings of the international conference on new methods in language processing (Vol. 12, pp. 44–49).
- (27) Schmid, H. (1995). Improvements in part-of-speech tagging with an application to German. In In Proceedings of the ACL SIGDAT-Workshop.
- (28) TreeTagger (2015): a language independent part-of-speech tagger http://www.cis.uni-muenchen.de/~schmid/tools/TreeTagger/. Accessed 1 April 2015
- (29) Simon, H. A. (1955). On a class of skew distribution functions. Biometrika, 425–440.
- (30) Zipf, G. K. (1935). The psycho-biology of language. Oxford, England: Houghton, Mifflin.
- (31) Zipf, G. K. (1949). Human behavior and the principle of least effort. Oxford, England: Addison-Wesley Press.