Broad band polarimetric investigation of Type IIP supernova 2013ej
Abstract
We present results based on follow-up observations of the Type II-plateau supernova (SN) 2013ej at 6 epochs spanning a total duration of 37 d. The -band linear polarimetric observations were carried out between the end of the plateau and the beginning of the nebular phases as noticed in the photometric light curve. The contribution due to interstellar polarization (ISP) was constrained by using couple of approaches, i.e. based upon the observations of foreground stars lying within 5′ and 10 radius of the SN location and also investigating the extinction due to the Milky Way and host galaxy towards the SN direction. Our analysis revealed that in general the intrinsic polarization of the SN is higher than the polarization values for the foreground stars and exhibits an increasing trend during our observations. After correcting the ISP of 0.6 per cent, the maximum intrinsic polarization of SN 2013ej is found to be 2.14 0.57 per cent. Such a strong polarization has rarely been seen in Type II-P SNe. If this is the case, i.e., the ‘polarization bias’ effect is still negligible, the polarization could be attributed to the asymmetry of the inner ejecta of the SN because the ISP towards the SN location is estimated to be, at most, 0.6 per cent.
keywords:
Supernovae: general – supernovae, polarimetry: individual – SN 2013ej, galaxies: individual – NGC 6281 Introduction
Core-collapse Type II-Plateau supernovae (II-P) are the specific events which show hydrogen lines in their optical spectra along with a plateau like structure in the optical light curve (see Filippenko, 1997, for a review on different Types of SNe). These events mark the end stages of the lives of massive stars ( 8 –10 M☉; Heger et al., 2003; Anderson & James, 2009). After explosion, the hydrogen recombination wave recedes through the outer envelope and all the energy deposited by the shock is slowly released (e.g. Popov, 1993; Kasen & Woosley, 2009). It shows nearly constant luminosity i.e. plateau phase in the light curve. The plateau phase ends after approximately 100 days as the thick hydrogen envelope becomes optically thin and consequently a sudden drop in luminosity imprints the phase of transition. The radioactive decay of 56Co into 56Fe powers the post-plateau phase of the light curve, which in turn depend upon the amount of 56Ni synthesized during the explosion (for different evolutionary phases of the light curve, see Grassberg, Imshennik & Nadyozhin, 1971; Falk & Arnett, 1977; Barbon, Ciatti & Rosino, 1979; Utrobin, 2007).
The geometry of these energetic events has been studied in detail using spectropolarimetric, imaging polarimetric techniques (e.g. Barrett, 1988; Jeffery, 1991a; Leonard et al., 2001, 2006; Leonard & Filippenko, 2001; Chugai, 2006; Chornock et al., 2010; Leonard et al., 2012; Wang & Wheeler, 2008; Kumar et al., 2014), and computer simulations (Hoflich, 1991; Kasen et al., 2006; Dessart & Hillier, 2011a). The first quantitative polarization study of SNe atmosphere was conducted by Shapiro & Sutherland (1982, see also ()). The observed degree of polarization in these SNe may vary during various evolution phases, indicating the change in SN geometry and/or ejecta (e.g. density and ionization) but the intrinsic polarization has been found only up to 1.5 per cent (Wheeler, 2000; Leonard et al., 2001; Leonard & Filippenko, 2001; Chornock et al., 2010). It is interesting to note that although in volume-limited studies of nearby CCSNe, a large fraction (around 50 per cent) belongs to II-P SNe (see Eldridge et al., 2013; Smith et al., 2011), their polarization studies comparatively remain quite small. Multi-epoch spectropolarimetric studies of Type II-P SN 1999em and SN 2004dj are available in the literature. Leonard et al. (2001) found that polarization in SN 1999em jumped from 0.2 per cent (day 7) to 0.5 (day 160) but without significant change in polarization angle. In a similar study of the nearby (distance 3.13Mpc) SN 2004dj, Leonard et al. (2006) observed no detectable intrinsic polarization during the plateau phase, but there was a sudden jump up to 0.6 per cent at the end of plateau phase as the photosphere enters the core ejecta. However, it is interesting to mention that in contrary to SN 1999em, SN 2004dj displayed rotation in polarization angle, a possible signature of the clumpy nature of Ni distribution (Leonard et al., 2006). From the above studies, it could be inferred that despite the similarity in the photometric and spectral features, II-P SNe show diverse nature in their polarization properties.
Polarimetric follow-up observations of various II-P SNe can provide very useful information about these events such as the geometry of the ejecta, circum-stellar material (CSM), the shape of the progenitor and the explosion mechanism, etc. An additional advantage of the polarimetric study of II-P SNe is in the use of these objects as extra-galactic distance indicators through the expanding photosphere method (EPM; Kirshner & Kwan, 1974; Eastman, Schmidt & Kirshner, 1996; Dessart & Hillier, 2005; Jones, Hamuy, Lira et al., 2009; Bose & Kumar, 2014). The basic assumption of the EPM technique is a spherically symmetric flux distribution during the early stage i.e. the plateau phase. However, as shown by Leonard et al. (2001), 10 per cent asphericity may produce an EPM distance that overestimates the actual distance by 5 per cent for an edge-on view and underestimates it by 10 per cent for a face-on line of sight. Considering the opportunity of a bright (apparent magnitude at maximum light 12.5 mag; Richmond, 2014) nearby SN 2013ej in NGC 628, here we present the Cousins -band imaging polarimetric study of this object.
1.1 NGC 628 and its observed CCSNe
NGC 628 (also known as Messier 74; M 74) is an interesting nearby galaxy situated in the Pisces constellation. It is a face-on spiral galaxy (prototype SAc) with prominent spiral arms and dust lanes. In the sky, NGC 628 is located far away from the Galactic disk and therefore, is a natural target for the multi-wavelength observations (cf. Soria & Kong, 2002; Krauss et al., 2005; Auld et al., 2006; Cornett et al., 1994; Kilgard et al., 2005, and references therein). The study of star formation scenario and supernova remnants in this galaxy are also available in literature (e.g. Elmegreen et al., 2006; Lelièvre & Roy, 2000; Sonbaş et al., 2010).
Within a distance of 10 Mpc (for latest distance estimation, see Jang & Lee, 2014; Huang et al., 2015, and references therein), NGC 628 is one of the nearby galaxies which interestingly hosted three CCSNe (i.e. SN 2002ap, SN 2003gd and SN 2013ej). SN 2002ap was discovered on 2002 January 29 (Nakano et al., 2002) and soon classified as a Type Ic event. Due to the specific broad spectral features, it was further recognized as a hypernova111These are highly energetic explosions having kinetic energy of the order of 1052 ergs (Iwamoto et al., 1998). Few examples are SN 1997ef (Iwamoto et al., 2000), SN 1998bw (Iwamoto et al., 1998; Maeda et al., 2006), SN 2003dh (Mazzali et al., 2003), SN 2003lw (Mazzali et al., 2006). (Kinugasa et al., 2002b; Meikle et al., 2002; Gal-Yam et al., 2002b; Filippenko & Chornock, 2002). Along with detail optical spectroscopic and photometric study (c.f. Mazzali et al., 2002; Gal-Yam et al., 2002a; Kinugasa et al., 2002a; Foley et al., 2003; Pandey et al., 2003a, b; Vinkó et al., 2004), this event was also monitored in different wavelengths e.g. radio (Berger et al., 2002; Soderberg et al., 2006), X-rays (Sutaria et al., 2003; Soria et al., 2004) and UV (Soria & Kong, 2002). Within less than one and half year after the discovery of SN 2002ap, another supernova SN 2003gd was discovered by R. Evans and N.S.W. Hazelbrook in a southern spiral arm of NGC 628 Evans & McNaught (2003). The photometric and spectroscopic study of this event was performed by Hendry et al. (2005) despite of its late discovery (close to the end of plateau phase). It is notable that apart from NGC 628, there are a few other galaxies such as NGC 6946, Arp 299, NGC 4303, NGC 5236 where 6 or more SNe have been discovered (e.g. Anderson & Soto, 2013; Anderson et al., 2011).
SN 2013ej
SN 2013ej is the third known SN in NGC 628 which was discovered by Lick Observatory Supernova Search (LOSS, Li et al., 2000) on 2013 July 25.45 ut using the 0.76m robotic Katzman Automatic Imaging Telescope (KAIT). The SN was located 92.5 arcsec east and 135 arcsec south of the core of the host galaxy with coordinates , (Kim et al., 2013). The spectra taken on July 27.7 ut by Valenti et al. (2013) using FLOYDS spectrograph led to the classification of the transient as a young Type II SN. The explosion date of the SN has been estimated with a precision of one day. In our study we consider the shock breakout date JD 2456497.45 (Valenti et al., 2014) as the time of explosion.
Based on archival pre-explosion images from Hubble Space Telescope and Gemini telescope, Fraser et al. (2014) have studied the progenitor’s properties. They provided a mass range of 8–16 M☉ by assuming that the progenitor star was a red super-giant. Furthermore, this event was monitored by several groups. Valenti et al. (2014) and Richmond (2014), respectively presented the initial two weeks photometry (, ) and about 6 months photometry (). Similarly Bose et al. (2015) and Huang et al. (2015) have analysed the , and near-infrared photometry along with optical spectroscopy. In addition, Leonard et al. (2013) reported earliest spectropolarimetry observations (taken on August 1.35 ut) obtained with the ESO Very Large Telescope (VLT). Their analysis revealed SN 2013ej to be an usual event showing strong polarization at a very early phase (1.3 per cent at 430 nm to 1.0 per cent at 920 nm).
In this paper, we investigate the polarimetric properties of SN 2013ej using the -band imaging polarimetry. In Section 2, we present the observations and data analysis. Estimation of intrinsic polarization is described in Section 3 and finally, we discuss the results and summarize our conclusions in Section 4.
| ut Date | JD | Phasea | Observed | Intrinsic (ISP subtracted) | Magnitude | ||
| (2013) | 2456000 | (Days) | |||||
| (per cent) | ( | (per cent) | (∘) | (mag) | |||
| Oct 30 | 596.09 | 99.54 | 0.85 0.32 | 109.10 10.68 | 0.21 0.32 | 112.05 42.77 | 14.00 0.02 |
| Nov 01 | 598.10 | 101.55 | 0.65 1.07 | 104.58 46.90 | 0.08 1.07 | 66.53 – | 14.41 0.02 |
| Nov 04 | 601.06 | 104.51 | 1.65 0.29 | 116.73 4.97 | 1.05 0.29 | 121.89 7.77 | 14.93 0.03 |
| Nov 10 | 607.24 | 110.69 | 1.95 0.61 | 89.17 9.12 | 1.49 0.61 | 81.56 11.85 | 15.25 0.03 |
| Dec 04 | 631.13 | 134.58 | 2.75 0.57 | 115.65 5.85 | 2.14 0.57 | 117.86 7.58 | 15.68 0.04 |
| Dec 05 | 632.11 | 135.56 | 1.45 – | 75.70 – | 1.31 – | 62.62 – | 15.61 – |
a With reference to the date of explosion JD 2456497.45. The estimates for the last epoch of observation
indicate the limiting values.
| ut Date | JD | Phasea | A† (01365863+1547463) | B† (01365760+1546218) | C† (01365154+1548473) | D† (01364487+1549344) | ||||
| (2013) | 2456000 | (Days) | ||||||||
| (per cent) | ( | (per cent) | (∘) | (per cent) | ( | (per cent) | (∘) | |||
| Oct 30 | 596.09 | 99.54 | 0.69 0.05 | 112.18 2.18 | 0.87 0.08 | 106.55 2.64 | 0.44 0.08 | 99.21 5.07 | 0.24 0.16 | 109.31 18.83 |
| Nov 01 | 598.10 | 101.55 | 0.82 0.12 | 113.39 4.33 | 0.75 0.10 | 108.08 3.63 | 0.65 0.01 | 108.09 0.03 | 0.39 0.52 | 63.02 37.84 |
| Nov 04 | 601.06 | 104.51 | 0.63 0.16 | 112.08 7.08 | 0.56 0.10 | 107.63 5.15 | 0.74 0.07 | 111.88 2.84 | 0.64 0.09 | 99.76 3.95 |
| Nov 10 | 607.24 | 110.69 | 0.66 0.01 | 113.19 0.59 | 0.50 0.01 | 107.14 0.33 | 0.58 0.08 | 109.34 3.77 | 0.34 0.12 | 124.38 9.84 |
| Dec 04 | 631.13 | 134.58 | 0.67 0.02 | 108.86 0.72 | 0.54 0.02 | 107.57 1.12 | 0.56 0.09 | 110.73 4.63 | 0.14 0.34 | 129.81 70.83 |
| Dec 05 | 632.11 | 135.56 | 0.47 0.01 | 108.12 0.28 | 0.63 0.08 | 102.45 3.76 | 0.60 0.04 | 111.58 2.10 | 0.70 0.30 | 104.36 12.33 |
| Weighted mean of | 0.51 0.01 | 108.84 0.25 | 0.51 0.01 | 107.14 0.32 | 0.65b | 108.09 0.04 | 0.45 0.06 | 105.36 3.94 | ||
| polarization parameters | ||||||||||
† 12.16 0.02, 12.58 0.02, 13.51 0.02 and 13.64 0.02 mag are the -band magnitudes of
the foreground stars A, B, C and D as estimated from the AIMPOL observations.
a With reference to the date of explosion JD 2456497.45.
b Weighted mean error is less than 0.002 per cent.
| Star | RA (J2000) | Dec (J2000) | Distance | ||
|---|---|---|---|---|---|
| ID | (h:m:s) | (d:m:s) | per cent | (∘) | (in pc ) |
| HD 11636 | 01:54:38.35 | +20:48:29.5 | 0.06 0.05 | 79.54 23.20 | 17.99 0.19 |
| HD 9270 | 01:31:29.00 | +15:20:44.9 | 0.08 0.01 | 50.59 1.71 | 107.18 8.27 |
| HD 13248 | 02:09:46.57 | +13:10:32.9 | 0.14 0.06 | 128.56 12.32 | 137.93 11.23 |
| HD 6815 | 01:08:55.85 | +09:43:49.8 | 0.45 0.03 | 108.97 1.77 | 167.79 14.64 |
| HD 10894 | 01:47:09.10 | +10:50:39.1 | 0.19 0.04 | 117.03 6.31 | 280.11 33.74 |
| HD 9560 | 01:33:55.16 | +08:39:47.5 | 0.42 0.02 | 137.69 1.07 | 437† |
| HD 8919 | 01:28:06.01 | +06:01:11.3 | 0.29 0.06 | 117.93 5.84 | 525† |
| HD 12504 | 02:02:51.42 | +11:22:19.9 | 0.18 0.01 | 152.77 0.96 | – |
| HD 9946 | 01:37:18.66 | +10:25:40.4 | 0.11 0.01 | 105.28 3.88 | – |
† These distances are adopted from Kawabata et al. (2002).
2 Observations and data analysis
We collected broad band polarimetric data of SN 2013ej at six epochs: 2013 October 30; November 01, 04, 10 and December 04, 05 as listed in Table 1. These observations were conducted using the ARIES Imaging Polarimeter (AIMPOL, Rautela, Joshi & Pandey, 2004) mounted at the Cassegrain focus of the 104-cm Sampurnanand telescope (ST) at Manora Peak, Nainital. This polarimeter consists of a half-wave plate (HWP) modulator and a Wollaston prism beam-splitter. The Wollaston prism analyzer is placed at the backend of the telescope beam path in order to produce ordinary and extraordinary beams in slightly different directions separated by 28 pixels along the north–south direction on the sky plane. A focal reducer (85 mm, f/1.8) is placed between the Wollaston prism and the CCD camera. This camera consists of Tektronix 1024 pixels 1024 pixels and its cooling is performed by liquid nitrogen. Each pixel of the CCD corresponds to 1.73 arcsec and the field-of-view (FOV) is 8 arcmin in diameter on the sky. The full width at half-maximum (FWHM) of the stellar images vary from 2 to 3 pixels. The readout noise and the gain of the CCD are 7.0 and 11.98 /ADU, respectively.
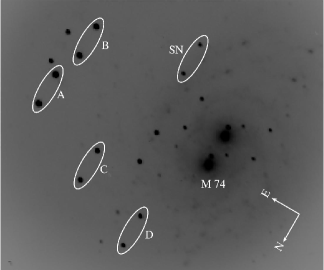
Our observations were carried out in standard ( = 0.67m) photometric band using only the central 325 pixels 325 pixels of the CCD. Fig. 1 shows approximately 7′ 6′ -band image acquired with the AIMPOL containing SN 2013ej in the host galaxy NGC 628. Four field stars marked with ‘A’, ‘B’, ‘C’ and ‘D’ were later used to constrain the interstellar polarization (see Section 3.1). Multiple frames were secured at each position angle of the HWP (i.e. 0, 22.5, 45 and 67.5). The typical individual exposure time was between 10-20 minutes at a particular position angle. To obtain good signal-to-noise ratio, all images at a given position angle were aligned and subsequently combined.
The dual-beam polarizing prism allows us to measure the polarization by simultaneously imaging both orthogonal polarization states onto the detector. Both the half-wave plate fast axis and the axis of the Wollaston prism are kept normal to the optical axis of the system. For such polarimeters, various Stokes parameters can be derived using standard procedures given elsewhere (e.g. Patat & Romaniello, 2006). In the present analysis, fluxes of ordinary and extra-ordinary beams of the SN and field stars were extracted by standard aperture photometry after preprocessing using the IRAF222IRAF is the Image Reduction and Analysis Facility distributed by the National Optical Astronomy Observatories, which are operated by the Association of Universities for Research in Astronomy, Inc., under cooperative agreement with the National Science Foundation. package. The flux values were measured using aperture photometry at multiple apertures ranging from 2 to 8 pixels. These fluxes were used to derive Stokes parameters at each aperture (c.f. equation 1, Kumar et al., 2014). Further, at each aperture, and values were derived by fitting the Stokes parameters with the relation . Where, and are degree of polarization and polarization angle, is the position angle (0∘, 22.5∘, 45∘ and 67.5∘) of HWP. Final and values were chosen at the aperture that best fit with minimum chi-square. Generally, best fit has always been witnessed between 4 to 6 pixels corresponding to 2 to 3 FWHM. Table 1 provides the estimated polarization measurements. The observed degree of polarization and polarization angle are denoted as (per cent) and (∘), respectively.
| Date of observation | ||
|---|---|---|
| (ut 2013) | (per cent) | ( |
| HD 19820 (Std. values) | 4.53 0.03 | 114.46 0.16 |
| Oct 30 | 4.6 0.1 | 114 1 |
| HD 59389 (Std. values) | 6.43 0.02 | 98.14 0.10 |
| Nov 01 | 6.3 0.1 | 98 1 |
| HD 25443 (Std. values) | 4.73 0.32 | 133.65 0.28 |
| Nov 04 | 4.8 0.1 | 133 2 |
| Nov 10 | 4.6 0.2 | 133 2 |
| Dec 04 | 4.9 0.2 | 134 1 |
| Dec 05 | 4.9 0.1 | 134 2 |
| HD 43384 (Std. values) | 2.86 0.03 | 170.7 0.7 |
| Nov 10 | 2.8 0.1 | 170 1 |
| HD 23663 (Std. values) | 5.38 0.03 | 93.04 0.15 |
| Dec 04 | 5.4 0.1 | 93 1 |
| Dec 05 | 5.3 0.1 | 94 2 |
To correct our measurements for the zero-point polarization angle, we performed observations of several polarized standards stars taken from Schmidt, Elston & Lupie (1992) and Hsu & Breger (1982). The results are given in Table 4 which indicate a good agreement (within the observational errors) with standard values. The difference between the observed and standard values were applied to the SN for the respective dates. It is worth mentioning that the instrumental polarization of focal reducers is known to grow from the optical axis to the edges of the field-of-view (Patat & Romaniello, 2006). Nevertheless, the SN was observed slightly off-axis which yielded simultaneous imaging of few field stars along with the SN (see also Section 3.1.1). The instrumental polarization of AIMPOL on the 104 cm ST has been characterized and monitored since 2004 for different projects and generally found to be 0.1 per cent in -band (e.g., Rautela et al., 2004; Pandey et al., 2009; Eswaraiah et al., 2011, 2013; Kumar et al., 2014; Soam et al., 2015, and references therein). To verify this result, we further observed unpolarized standards stars G 191 B2B and HD 21447 from Schmidt, Elston & Lupie (1992) on different nights and their degree of polarization was estimated to be 0.13 0.03 and 0.14 0.05 per cent, respectively. However, in our analysis we have applied an average correction of 0.1 per cent to the observed polarization values of the SN.
It is worthwhile to note that present set of images were obtained in absence of a window mask on the focal plane. In such a set-up, the polarization study of well isolated bright stars normally do not impose any problem. But it may be an issue for the objects which are lying over diffuse backgrounds (e.g. SNe) because the background polarization is not removed properly. A variable amount of polarization may also be introduced due to different phases of moon and/or seeing effects. In our analysis we made an attempt to quantify the possible effect of contamination by the nebulous background on the final polarization measurements of SN 2013ej. A detailed description of the method is given in Appendix A. Our exercise suggests that although there is a non-negligible nebulous background present around SN 2013ej, it does not significantly influence the final polarization measurements.
3 Observational results
3.1 Constraining interstellar polarization
The interstellar polarization (ISP) is produced by differential extinction resulting from aspherical and spinning dust grains along the line of sight that are aligned in space by the Galactic magnetic field (see Whittet, 2003). The ISP (either due to the Milky Way and/or host galaxy) may largely influence the observed SN polarization properties. For example, Leonard & Filippenko (2001) found an extraordinarily high degree of polarization (5.8 per cent) for SN 1999gi in the galaxy NGC 3184 but later, in a separate study, Leonard et al. (2002b) estimated that the previously derived value was heavily affected by ISP, and the intrinsic polarization of the SN was only in the range of 0.3 to 2.0 per cent. Therefore, to understand the intrinsic behavior of the SN polarization parameters, it requires careful accounting for the intervening interstellar medium. Due to unavailability of any standard method for the estimation of ISP, every possible measure should be considered to avoid any observational biases. Fortunately, ISP has been well studied in the Galaxy (e.g. Serkowski, Mathewson & Ford, 1975). Furthermore, while SN polarization properties may show temporal variation, the ISP should be constant. Therefore, by constraining the ISP we can subtract it from the observed SN polarization parameters to obtain intrinsic polarization measurements of SN.
As mentioned in Section 1.1, along with SN 2013ej, NGC 628 had also hosted two additional CCSNe (c.f. SN 2002ap and SN 2003gd). Contrary to SN 2003gd, early discovery and brightness of SN 2002ap (peak apparent mag 12.4, Pandey et al., 2003a) provided better opportunity to study the spectropolarimetric properties in great details by several groups. These authors have also discussed about the ISP contributions. Leonard et al. (2002a) examined ISP for SN 2002ap using the plane method, Serkowski law ISP curve fitting method and by measuring the polarization of five distant stars within 1 of the line of sight of SN. There was general agreement in all estimated values and they adopt = 0.51 per cent at = 125. Similarly Kawabata et al. (2002) and Wang et al. (2003) have estimated ISP as = 0.64 per cent, = 120; = 0.61 per cent, = 122, respectively.
The ISP characterization in the above cited studies provide us an insight about the dust properties in the direction of NGC 628 and enable us to evaluate intrinsic polarization properties of SN 2013ej. In the following sections, we present various approaches which we applied to obtain the intrinsic polarization measurements of SN 2013ej.
3.1.1 Fore-ground stars lying within 5 radius of SN position
There are several isolated and medium brightness field stars situated within 5 arcmin radius of the SN location. Since AIMPOL provides the 8 arcmin diameter wider field-of-view, we are fortunate enough to observe several field stars along with SN. Therefore, during the period of our observations, we pointed the telescope in such a way that all those stars were also observed along with SN. To characterize the polarization properties of these nearby stars, initially we selected six stars with good S/N ratio. Out of them, the trend of two stars were consistent with zero polarization within 3-sigma but the polarization of SN after plateau phase was significantly large. Therefore, we excluded two stars and only the remaining four field stars were considered for the further analysis. These are labelled with letters ‘A’ to ‘D’ as shown in Fig. 1 and their estimated polarization parameters are listed in Table 2 (Two Micron All-Sky Survey (2MASS, Skrutskie et al., 2006) IDs are also mentioned in the parenthesis). To cross-examine the effect of growing noise on polarimetric results of SN (especially towards the late epochs), it could have been interesting to derive the magnitudes of the fainter objects in the SN field. However, some of them are situated in the nebulous regions so we avoided those stars. Nonetheless, -band magnitudes of ‘A’-‘D’ stars are mentioned in the footnote of Table 2.
3.1.2 Fore-ground stars lying within 10 radius of SN position
We examined the polarization measurements of several foreground Milky Way stars available in the ISP catalogue by Heiles (2000). Within 10 radius around the SN 2013ej, we selected only 9 stars which are isolated and do not show either emission features or variability flag in the SIMBAD data base. Out of them, 5 stars have distance information from Hipparcos parallax (van Leeuwen, 2007). Distances of HD 8919 and HD 9560 have been adopted from (Kawabata et al., 2002). Considering the fact that Heiles catalogue represents the polarization in a band different than ours, we have performed -band polarimetric observations of these stars and their estimated and values are listed in Table 3. Among this list, HD 11636 is only at a distance of 18 pc thus likely to skew the results because it is nearby and does not probe all material in the Galactic plane. We have excluded this star from our further analysis. The weighted mean values of remaining 8 stars are as follows:
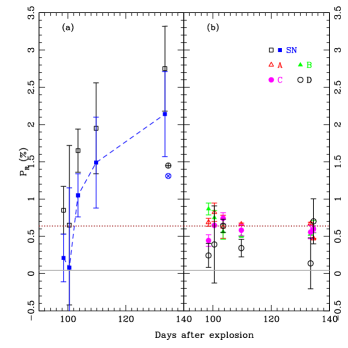
= 0.025 0.003, = 125.08 3.22 (for Heiles catalogue) and = 0.044 0.004, = 55.82 2.26 (for AIMPOL -band), respectively. The polarization level (weighted mean) of these eight stars () as observed with AIMPOL (in -band) is indicated by a grey continuous line in Fig. 2.
3.1.3 Extinction due to the Milky Way and the host galaxy
Based on the observations of various nearby Galactic stars, Serkowski, Mathewson & Ford (1975, see also ()) have provided an empirical relation between reddening and maximum ISP which is given as = 9 , where indicates the reddening value. Although this relation is not universal and has shown some violations (for example, Leonard & Filippenko, 2001; Leonard et al., 2002c; Patat et al., 2011, and references therein) but it is still valid for general investigation purpose.
The resulting from Milky Way interstellar matter in the line of sight of SN 2013ej was found to be 0.062 mag (Schlafly & Finkbeiner, 2011) which is corresponding to an extinction of 0.19 mag in -band for total-to-selective extinction parameter = 3.1 (Cardelli et al., 1989). Bose et al. (2015) have used high resolution echelle spectra (obtained on 79.5 d) and analysed the equivalent width of Na I D doublets to estimate the reddening in the line of sight of SN 2013ej. They clearly resolved these lines of the Milky Way, but Na I D impression for the NGC 628 was missing (see their fig. 2). This implies that the host galaxy contribution is negligible and only Galactic reddening is dominantly playing a role for the SN line of sight extinction. Valenti et al. (2014) have also concluded similar results (see their fig. 3). Now we consider total reddening in the direction of SN = 0.062 mag and thus, the maximum ISP relation gives the maximum degree of ISP towards the SN 2013ej as 0.558 per cent.
3.2 Estimation of SN intrinsic polarization
From the previous discussions, it is clear that MW dust is significantly contributing to the observed SN polarization measurements, and hence it must be subtracted. The foreground stars lying in 10 radius around the SN gives us a general indication of the polarization in this region of sky and consequently along the SN line of sight. But, it is noteworthy to mention that polarization estimates of such sample of stars may not provide exact magnitude and direction of the ISP specially when these stars are beyond 1° from the SN location (c.f. Tran, 1995; Leonard & Filippenko, 2001). Therefore, for the IPS contribution we focus only on those four stars which are within 5′ radius of the SN. Ideally, we should know the distance (or reddening) and the spectral features (which may infer that they are intrinsically unpolarized or not) of these field stars. However, practically it is not an easy task. A careful investigation of Fig. 2 (see also Table 2) indicates that in the course of follow-up observations, polarization parameters of these stars do not show significant variation. This homogeneity of the polarization values among ‘A’-‘D’ stars may suggest that they represent uniform MW ISP in the direction of SN 2013ej. Subsequently, we derived the weighted mean of polarization parameters of these four stars. For each star ‘A’, ‘B’, ‘C’ and ‘D’, first we derived their individual weighted mean of polarization and polarization angles for each epoch as listed in Table 2. Afterwards, the weighted mean of these values were estimated which are found to be 0.637 0.001 per cent and 108.11 0.04 degree. Let us denote it as and , respectively, i.e. = 0.637 0.001 per cent and = 108.11 0.04 degree, where suffix ‘4s’ stands for 4 stars lying in the same field-of-view of SN (within 5′ radius).
As mentioned previously that for SN 2002ap, Kawabata et al. (2002), Leonard et al. (2002a) and Wang et al. (2003) have determined as 0.64, 0.51 and 0.61 per cent, respectively. Although detailed polarimetric study of SN 2003gd (which was also discovered in the same galaxy, see Section 1.1) is not available in the literature, Leonard & Filippenko (2005) have mentioned about 1 per cent ISP contribution towards the line of sight of this object. The value (0.637 per cent) is much larger than value (0.044 per cent), but it is comparable with the values derived in the previously mentioned studies as well as estimated from the maximum ISP and reddening relation given by Serkowski, Mathewson & Ford (1975). Moreover, it seems that there is no noticeable extinction at the position of SN due to host galaxy (see Section 3.1.3). Above facts strongly suggest that total ISP contribution in the SN direction is not more than 0.637 per cent and the polarization parameters of 4 field stars around SN represent real ISP in the direction of SN 2013ej.
By following the methods as described in Kumar et al. (2014, see their Section 3.1), we have estimated and subtracted the ISP components from the observed SN polarization measurements. Firstly, observed and of SN as well as four field stars were transformed into Stokes parameters, then weighted mean Stokes parameters of field stars were determined as = – 0.515 0.001 per cent and = – 0.378 0.001 per cent. To obtain the intrinsic Stokes parameters of SN, the and values were vectorially subtracted from the observed Stokes parameters of SN for each epoch. These values were further converted back to and (see relations 5, 6, 7 and 8 in Kumar et al., 2014, for more details). The intrinsic SN 2013ej polarization values (denoted as and ) for each epoch are listed in column 6 and 7 in Table 1.
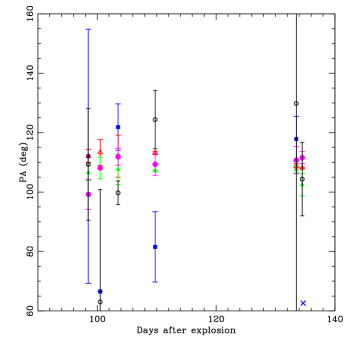
In the left panel of Fig. 2, we have shown the temporal evolution of observed and intrinsic polarization values of SN 2013ej with open and filled square symbols, respectively. The polarization measurements of 4 foreground stars (within 5 radius of SN) are also over plotted with different symbols. Two horizontal lines dotted (brown colour) and continuous (grey colour), respectively illustrate the level of polarization estimated for foreground stars within 5 and 10 radius around the SN location. In the right panel of the figure, intrinsic polarization angles of SN and 4 field stars are over plotted. The degree of polarization is known to be suffered from ‘polarization bias’ effects for errornous data having smaller (e.g. Serkowski, 1958; Wardle & Kronberg, 1974; Patat & Romaniello, 2006). Adopting a traditional, statistic correction as , the decreases by a factor of for a data point having . Thus, we caution the reader that if we make corrections for de-bias, then our initial three estimated values of the SN will tend towards the null polarization.
| SN | Nickel mass | Plateau decline ratea | Explosion energy | References |
|---|---|---|---|---|
| (M⊙) | (1051 erg) | |||
| SN 2013ej | 0.020 0.002 | 1.74 0.08 (mag/100 d) | 0.7 | 1, 2 |
| 0.020 0.010 | ||||
| SN 2008bk | 0.009 | 0.11 0.02 (mag/100 d) | 0.3 | 3, 4 |
| 0.007 0.001 | ||||
| SN 2006ov | 0.003 0.002 | 0.53 0.05 (mag/20 d) | 5, 6 | |
| 0.002 0.002 | ||||
| SN 2004dj | 0.023 0.005 | 0.50 0.04 (mag/20 d) | 0.8 | 7, 8 |
| 0.020 0.010 | ||||
| SN 1999em | 0.027 0.002 | 0.31 0.02 (mag/100 d) | 1.3 | 1, 2, 9 |
| 0.050 0.010 | ||||
| SN 1987A | 0.075 0.005 | 1.5 | 10, 11, 12 | |
| 0.077 |
a The decline rate in -band.
4 Discussion and conclusion
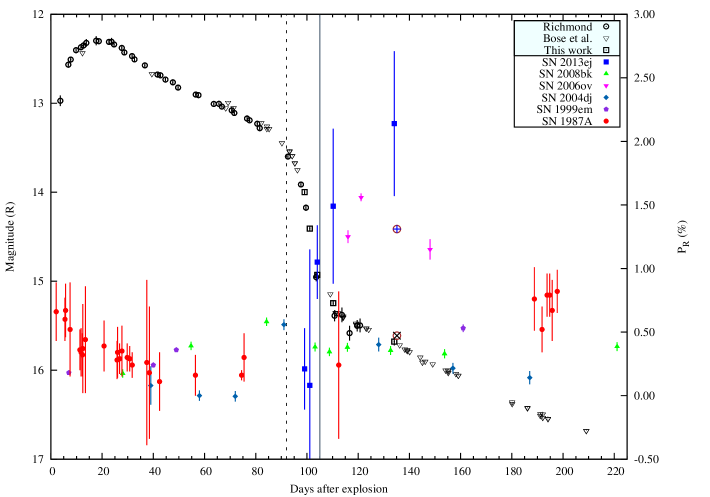
The polarimetric follow-up observations (including spectropolarimetry and broad band) of the Type II-P SNe are very limited, moreover the data sampling is sparse. In the literature, other than SN 2013ej, there are only 5 such events which have at least three epochs of polarization measurements and are extended up to the nebular phase. These include SN 2008bk (Leonard et al., 2012), SN 2006ov (Chornock et al., 2010), 2004dj (Leonard et al., 2006), 1999em (Leonard et al., 2001) and SN 1987A (Barrett, 1988). We have compared their polarimetric properties in Fig. 4 along with SN 2013ej. It is worthy to mention here that except SN 2013ej, SN 1999em and SN 1987A, the explosion dates of other events are not known so precisely.
In Fig. 4 we have shown the -band photometric light curve of SN 2013ej from Richmond (2014), Bose et al. (2015) and also the magnitude estimated from AIMPOL polarimetric observations. To calibrate the observed AIMPOL SN magnitudes, we selected the secondary standard star from Richmond (2014, see his fig. 1 where particular star is denoted by ID #A and it is common in both studies). Then for each night observation, the offset values in both magnitudes were applied to the observed AIMPOL SN magnitudes.
The estimated SN 2013ej magnitudes at 6 epochs are listed in Table 1 and plotted with open square symbols (black colour) in the Fig. 4. As it can be seen, it is very nicely following the light curve evolution pattern of the other two studies (i.e. Richmond, 2014; Bose et al., 2015). Two vertical lines in Fig. 4 mark two important phases, the end of plateau phase ( 92d, with red dashed line) and beginning of nebular phase (105 with continuous grey line). The intrinsic polarization values of SN () are over-plotted on it with filled square symbols. It is obvious from Fig. 4 that our polarimetric follow-up observations are very unique in the sense that these data samples belongs to the crucial evolutionary phase, i.e. end of plateau phase when the hydrogen envelope is almost recombined and inner core is revealed. Furthermore, last three data points were obtained just around the beginning of nebular phase.
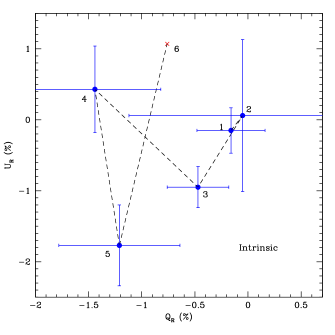
Since the variation pattern of the parameters does not depend to the ISP corrections therefore, it may provide a better probe to examine the simultaneous behaviour of the SN polarization (see, e.g. Wang & Wheeler, 2008, and references therein). In Fig. 3 we have plotted the ISP subtracted polarization data of SN 2013ej on the plane where each number is indicative of data point per epoch. It is apparent from this figure that there are large error bars in our estimates which do not allow us to establish firm conclusion on the observed features of this event based on the imaging polarimetric measurements.
The morphological information about expanding SN ejecta can be directly probed by polarimetric studies (Shapiro & Sutherland, 1982; Hoflich, 1991; Wang & Wheeler, 2008). Spectropolarimetry provides useful information about the overall shape of the emitting region and dynamical evolution of various chemical elements of the explosion. However, broad-band imaging polarimetry allow us longer follow-up coverage of bright events which may pass through important phases of their temporal evolution. A net polarization in hot young CCSNe arises due to incomplete cancelation of directional components of electrical vectors which finally reveal about possible asphericity or clumpiness in the ejecta. In a spherical source, the condition is entirely different when these vectors exactly cancelled and yield zero net polarization (see Leonard & Filippenko, 2005; Wang & Wheeler, 2008; Kasen et al., 2003). There are couple of other processes which may cause polarization in CCSNe such as asymmetric distribution of radioactive material within the SN envelope (e.g. Hoeflich, 1995; Chugai, 2006), aspherical ionization produced by hard Xrays from the interaction between the SN shock front and a non-spherical progenitor wind (Wheeler & Filippenko, 1996) and/or scattering by dust (e.g. Wang & Wheeler, 1996).
Chornock et al. (2010) have studied the nature of asphericity in three II-P SNe (SN 2006my, SN 2006ov and SN 2007aa) and hinted that along with several factors like progenitor mass, explosion energy and 56Ni mass ejection may play a possible role towards the expected net continuum polarization. Among those compared objects, SN 2006ov ejected smallest amount of 56Ni and exhibited larger degree of polarization. We revisited their findings and for this purpose collected sample of explosion energy and ejected 56Ni mass of Type II-P SNe from the literature. These parameters are listed in Table 5. Here, one should keep in mind that 56Ni mass estimation procedures were different in respective studies (i.e. hydrodynamical as well as analytical). From this sample it is apparent that the amount of 56Ni mass in SN 2013ej is comparable with SN 2004dj and SN 1999em but considerably higher than SN 2006ov (more than 6 times) and SN 2008bk (more than 2 times). We also estimated the plateau decay rate (PDR) of the existing sample in -band light curves. PDR is expressed as the decay of magnitude between 100 days of the plateau phase. However, it is worthy to mention that because of early discovery, SN 2013ej, SN 2008bk and SN 1999em have a good sampling of the data. Unfortunately, SN 2006ov and SN 2004dj were discovered at late epochs and therefore, we estimate PDR only for 20 days for these events due to lack of the data. Furthermore, since SN 1987A is a peculiar event, it was not considered to estimate PDR. Though PDR of SN 2006ov and SN 2004dj may not be good representative for comparison with other objects, but it may provide us a general overview about the light curve decay. The estimated PDR values are also listed in Table 5. Interestingly, with a value of 1.74 mag/100 d, SN 2013ej has the highest rate of plateau decay. Here we caution that the existing sample is too small to draw any conclusion about the possible correlation between the ejected 56Ni mass and the plateau decay rate and the observed polarization evolution (see also Chornock et al., 2010). It should also be noted that in a recent study of multi-band model of nearby well-observed Type II-P SNe Pejcha & Prieto (2015) examine the significance of the correlations between the various parameters of explosion such as plateau luminosity, nickel mass, explosion energy and ejecta mass. They advocate that Type II-P SN explosions are governed by several physical parameters which in turn reflect the diversity of the core and surface properties of their progenitors.
As can be seen in Fig. 4, although there are large error bars in polarization estimates of SN 2013ej but in general, the intrinsic polarization values show increasing trend during our observations and ranges between 0.08 to 2.14 per cent. The relatively higher degree of polarization estimated from our analysis is also supported by the spectropolarimetric observation in the early epoch where Leonard et al. (2013) have found strong polarization of about 1 per cent for this event. The maximum intrinsic polarization reached up to a level of 2.14 0.57 per cent, which is significantly higher than similar Type II-P events. The of SN 2013ej exhibits superimposed variability during the observed period, though affected with large error bars (see Fig. 2). Such variations in the have also been noticed for other similar Type of events (e.g. Leonard et al., 2006; Pereyra et al., 2006). Here, we caution that there are large error bars associated with our polarization measurements and also the amount of data is small. Additionally, the observed variations in the estimated values are at one sigma level and therefore, statistically insignificant.
If we examine the last three data points, it show a constant level of polarization within one sigma limit with a mean value of 1.7 per cent. This much level of polarization is comparable with some of the stripped envelope SNe such as SN 1993J (Hoeflich et al., 1996; Tran et al., 1997) and SN 2008D (Gorosabel et al., 2010). It is also notable that within the error limit, SN 2006ov and SN 2013ej show similar level of polarization (Chornock et al., 2010) at later epochs. The increasing trend in the polarization light curve (c.f. Kumar et al., 2014) of SN 2013ej has been seen after the end plateau phase, whereas, in case of SN 1987A and SN 1999em such features appeared before the end plateau phase (40 d) and continued up to late epochs (Barrett, 1988; Jeffery, 1991b; Leonard et al., 2001). The maximum level of polarization of SN 2008bk and SN 2004dj are almost similar. Nevertheless, SN 2008bk shows an increasing trend during the plateau phase and then in late epochs it retained nearly a constant polarization level. In contrary, SN 2004dj featured with different temporal behaviour. SN 2004dj exhibited almost negligible polarization in the similar interval, but once the inner core is revealed (end of plateau phase), the polarization abruptly increased and steadily decline towards the nebular phase. The increasing trend in polarization values of SN 2013ej has been noticed during the phase of transition from the plateau to nebular.
In continuation to above discussion, it should be emphasized that continuum polarization represents the underlying explosion geometry. Line polarization features on the other hand trace the asymmetries related to the relevant chemical elements in the SN ejecta (Kasen et al., 2003; Wang & Wheeler, 2008; Dessart & Hillier, 2011b). Local dust present around the SN could also result in optical scattering of the photons (i.e. “light echo” mechanism) which may linearly polarize the reflected light. Wang & Wheeler (1996) revisited the polarization properties of SN 1987A and favored this scenario (see also Hoeflich et al., 1996; Tran et al., 1997). Restriction of data sample and single filter polarization analysis do not allow us to draw a definite conclusion on the geometry of SN 2013ej ejecta. Nonetheless, the contribution due to CSM interaction could be a plausible reason behind the polarization properties of this event.
Our analysis infer that possibly II-P SNe show diverse nature of ejecta. Post-plateau multi-epoch polarization data of similar events will be extremely useful which can further probe deeper into the ejecta and consequently may shed more light on the explosion geometry of these energetic events. In this context, along with existing large aperture observing facilities with spectropolarimetric capabilities (e.g. VLT, Subaru and Keck etc.), the proposed thirty meter telescope (TMT, www.tmt.org/) will provide extremely useful information about the geometry of CCSNe in the near future.
Acknowledgments
This paper is dedicated to the memory of Dr. J. Gorosabel who had been our collaborator and contributed significantly towards the polarimetric study in astronomy. We are grateful to the observers Arti Joshi, B. J. Medhi and Ram Kesh Yadav at the Aryabhatta Research Institute of observational sciencES (ARIES) for their valuable time and support for the observations of this event. We acknowledge G. C. Anupama for careful reading of the manuscript and useful discussions on various polarimetric aspects. BK acknowledges the financial support funded by the Canadian grant for the International Liquid Mirror Telescope (ILMT) project during his stay at ARIES, India. BK also thanks Ravi Joshi for valuable discussions. CE acknowledges the financial support from the grants MOST 103-2112-M-008-024-MY3 (at NCU, Taiwan) and MOST 102-2119-M-007-004-MY3 (at NTHU, Taiwan) funded by the Ministry of Science and Technology of Taiwan. This research has made use of the SIMBAD database, operated at CDS, Strasbourg, France.
References
- Anderson et al. (2014) Anderson J. P., González-Gaitán S., Hamuy M., et al., 2014, ApJ, 786, 67
- Anderson et al. (2011) Anderson J. P., Habergham S. M., James P. A., 2011, MNRAS, 416, 567
- Anderson & James (2009) Anderson J. P., James P. A., 2009, MNRAS, 399, 559
- Anderson & Soto (2013) Anderson J. P., Soto M., 2013, A&A, 550, A69
- Arnett (1996) Arnett D., 1996, Supernovae and Nucleosynthesis: An Investigation of the History of Matter from the Big Bang to the Present (Princeton University Press)
- Auld et al. (2006) Auld R., Minchin R. F., Davies J. I., et al., 2006, MNRAS, 371, 1617
- Barbon et al. (1979) Barbon R., Ciatti F., Rosino L., 1979, A&A, 72, 287
- Barrett (1988) Barrett P., 1988, MNRAS, 234, 937
- Berger et al. (2002) Berger E., Kulkarni S. R., Chevalier R. A., 2002, ApJ, 577, L5
- Bose & Kumar (2014) Bose S., Kumar B., 2014, ApJ, 782, 98
- Bose et al. (2015) Bose S., Sutaria F., Kumar B., et al., 2015, ApJ, 806, 160
- Cardelli et al. (1989) Cardelli J. A., Clayton G. C., Mathis J. S., 1989, ApJ, 345, 245
- Chornock et al. (2010) Chornock R., Filippenko A. V., Li W., Silverman J. M., 2010, ApJ, 713, 1363
- Chugai (2006) Chugai N. N., 2006, Astronomy Letters, 32, 739
- Cornett et al. (1994) Cornett R. H., O’Connell R. W., Greason M. R., et al., 1994, ApJ, 426, 553
- Dessart & Hillier (2005) Dessart L., Hillier D. J., 2005, A&A, 439, 671
- Dessart & Hillier (2011a) Dessart L., Hillier D. J., 2011a, MNRAS, 410, 1739
- Dessart & Hillier (2011b) Dessart L., Hillier D. J., 2011b, MNRAS, 415, 3497
- Eastman et al. (1996) Eastman R. G., Schmidt B. P., Kirshner R., 1996, ApJ, 466, 911
- Eldridge et al. (2013) Eldridge J. J., Fraser M., Smartt S. J., Maund J. R., Crockett R. M., 2013, MNRAS, 436, 774
- Elmegreen et al. (2006) Elmegreen B. G., Elmegreen D. M., Chandar R., Whitmore B., Regan M., 2006, ApJ, 644, 879
- Elmhamdi et al. (2003) Elmhamdi A., Danziger I. J., Chugai N., et al., 2003, MNRAS, 338, 939
- Eswaraiah et al. (2013) Eswaraiah C., Maheswar G., Pandey A. K., Jose J., Ramaprakash A. N., Bhatt H. C., 2013, A&A, 556, A65
- Eswaraiah et al. (2011) Eswaraiah C., Pandey A. K., Maheswar G., et al., 2011, MNRAS, 411, 1418
- Evans & McNaught (2003) Evans R., McNaught R. H., 2003, \iaucirc, 8150, 2
- Falk & Arnett (1977) Falk S. W., Arnett W. D., 1977, ApJS, 33, 515
- Filippenko (1997) Filippenko A. V., 1997, ARA&A, 35, 309
- Filippenko & Chornock (2002) Filippenko A. V., Chornock R., 2002, \iaucirc, 7825, 1
- Foley et al. (2003) Foley R. J., Papenkova M. S., Swift B. J., et al., 2003, PASP, 115, 1220
- Fraser et al. (2014) Fraser M., Maund J. R., Smartt S. J., et al., 2014, MNRAS, 439, L56
- Gal-Yam et al. (2002a) Gal-Yam A., Ofek E. O., Shemmer O., 2002a, MNRAS, 332, L73
- Gal-Yam et al. (2002b) Gal-Yam A., Shemmer O., Dann J., 2002b, \iaucirc, 7811, 3
- Gorosabel et al. (2010) Gorosabel J., de Ugarte Postigo A., Castro-Tirado A. J., et al., 2010, A&A, 522, A14
- Grassberg et al. (1971) Grassberg E. K., Imshennik V. S., Nadyozhin D. K., 1971, Ap&SS, 10, 28
- Heger et al. (2003) Heger A., Fryer C. L., Woosley S. E., Langer N., Hartmann D. H., 2003, ApJ, 591, 288
- Heiles (2000) Heiles C., 2000, AJ, 119, 923
- Hendry et al. (2005) Hendry M. A., Smartt S. J., Maund J. R., et al., 2005, MNRAS, 359, 906
- Hoeflich (1995) Hoeflich P., 1995, ApJ, 440, 821
- Hoeflich et al. (1996) Hoeflich P., Wheeler J. C., Hines D. C., Trammell S. R., 1996, ApJ, 459, 307
- Hoflich (1991) Hoflich P., 1991, A&A, 246, 481
- Høg et al. (2000) Høg E., Fabricius C., Makarov V. V., et al., 2000, A&A, 355, L27
- Hsu & Breger (1982) Hsu J.-C., Breger M., 1982, ApJ, 262, 732
- Huang et al. (2015) Huang F., Wang X., Zhang J., et al., 2015, ApJ, 807, 59
- Iwamoto et al. (1998) Iwamoto K., Mazzali P. A., Nomoto K., et al., 1998, \nat, 395, 672
- Iwamoto et al. (2000) Iwamoto K., Nakamura T., Nomoto K., et al., 2000, ApJ, 534, 660
- Jang & Lee (2014) Jang I. S., Lee M. G., 2014, ApJ, 792, 52
- Jeffery (1991a) Jeffery D. J., 1991a, ApJ, 375, 264
- Jeffery (1991b) Jeffery D. J., 1991b, ApJS, 77, 405
- Jones et al. (2009) Jones M. I., Hamuy M., Lira P., et al., 2009, ApJ, 696, 1176
- Kasen et al. (2003) Kasen D., Nugent P., Wang L., et al., 2003, ApJ, 593, 788
- Kasen et al. (2006) Kasen D., Thomas R. C., Nugent P., 2006, ApJ, 651, 366
- Kasen & Woosley (2009) Kasen D., Woosley S. E., 2009, ApJ, 703, 2205
- Kawabata et al. (2002) Kawabata K. S., Jeffery D. J., Iye M., et al., 2002, ApJ, 580, L39
- Kilgard et al. (2005) Kilgard R. E., Cowan J. J., Garcia M. R., et al., 2005, ApJS, 159, 214
- Kim et al. (2013) Kim M., Zheng W., Li W., et al., 2013, Central Bureau Electronic Telegrams, 3606, 1
- Kinugasa et al. (2002a) Kinugasa K., Kawakita H., Ayani K., et al., 2002a, ApJ, 577, L97
- Kinugasa et al. (2002b) Kinugasa K., Kawakita H., Ayani K., Kawabata T., Yamaoka H., 2002b, \iaucirc, 7811, 1
- Kirshner & Kwan (1974) Kirshner R. P., Kwan J., 1974, ApJ, 193, 27
- Krauss et al. (2005) Krauss M. I., Kilgard R. E., Garcia M. R., Roberts T. P., Prestwich A. H., 2005, ApJ, 630, 228
- Kumar et al. (2014) Kumar B., Pandey S. B., Eswaraiah C., Gorosabel J., 2014, MNRAS, 442, 2
- Lelièvre & Roy (2000) Lelièvre M., Roy J.-R., 2000, AJ, 120, 1306
- Leonard et al. (2012) Leonard D. C., Dessart L., Hillier D. J., Pignata G., 2012, in American Institute of Physics Conference Series, edited by J. L. Hoffman, J. Bjorkman, B. Whitney, vol. 1429 of American Institute of Physics Conference Series, 204–207
- Leonard & Filippenko (2001) Leonard D. C., Filippenko A. V., 2001, PASP, 113, 920
- Leonard & Filippenko (2005) Leonard D. C., Filippenko A. V., 2005, in 1604-2004: Supernovae as Cosmological Lighthouses, edited by M. Turatto, S. Benetti, L. Zampieri, W. Shea, vol. 342 of Astronomical Society of the Pacific Conference Series, 330
- Leonard et al. (2001) Leonard D. C., Filippenko A. V., Ardila D. R., Brotherton M. S., 2001, ApJ, 553, 861
- Leonard et al. (2002a) Leonard D. C., Filippenko A. V., Chornock R., Foley R. J., 2002a, PASP, 114, 1333
- Leonard et al. (2002b) Leonard D. C., Filippenko A. V., Chornock R., Li W., 2002b, AJ, 124, 2506
- Leonard et al. (2006) Leonard D. C., Filippenko A. V., Ganeshalingam M., et al., 2006, \nat, 440, 505
- Leonard et al. (2002c) Leonard D. C., Filippenko A. V., Li W., et al., 2002c, AJ, 124, 2490
- Leonard et al. (2013) Leonard P. b. D. C., Pignata G., Dessart L., et al., 2013, The Astronomer’s Telegram, 5275, 1
- Li et al. (2000) Li W. D., Filippenko A. V., Treffers R. R., et al., 2000, in American Institute of Physics Conference Series, edited by S. S. Holt, W. W. Zhang, vol. 522 of American Institute of Physics Conference Series, 103–106
- Maeda et al. (2006) Maeda K., Mazzali P. A., Nomoto K., 2006, ApJ, 645, 1331
- Mazzali et al. (2002) Mazzali P. A., Deng J., Maeda K., et al., 2002, ApJ, 572, L61
- Mazzali et al. (2006) Mazzali P. A., Deng J., Pian E., et al., 2006, ApJ, 645, 1323
- Mazzali et al. (2003) Mazzali P. A., Deng J., Tominaga N., et al., 2003, ApJ, 599, L95
- Meikle et al. (2002) Meikle P., Lucy L., Smartt S., Leibundgut B., Lundqvist P., Ostensen R., 2002, \iaucirc, 7811, 2
- Nakano et al. (2002) Nakano S., Hirose Y., Kushida R., Kushida Y., Li W., 2002, \iaucirc, 7810, 1
- Pandey et al. (2009) Pandey J. C., Medhi B. J., Sagar R., Pandey A. K., 2009, MNRAS, 396, 1004
- Pandey et al. (2003a) Pandey S. B., Anupama G. C., Sagar R., Bhattacharya D., Sahu D. K., Pandey J. C., 2003a, MNRAS, 340, 375
- Pandey et al. (2003b) Pandey S. B., Sahu D. K., Anupama G. C., Bhattacharya D., Sagar R., 2003b, Bulletin of the Astronomical Society of India, 31, 351
- Patat & Romaniello (2006) Patat F., Romaniello M., 2006, PASP, 118, 146
- Patat et al. (2011) Patat F., Taubenberger S., Benetti S., Pastorello A., Harutyunyan A., 2011, A&A, 527, L6
- Pejcha & Prieto (2015) Pejcha O., Prieto J. L., 2015, ApJ, 806, 225
- Pereyra et al. (2006) Pereyra A., Magalhães A. M., Rodrigues C. V., et al., 2006, A&A, 454, 827
- Phillips et al. (1990) Phillips M. M., Hamuy M., Heathcote S. R., Suntzeff N. B., Kirhakos S., 1990, AJ, 99, 1133
- Pignata (2013) Pignata G., 2013, in Massive Stars: From alpha to Omega, 176
- Popov (1993) Popov D. V., 1993, ApJ, 414, 712
- Rautela et al. (2004) Rautela B. S., Joshi G. C., Pandey J. C., 2004, Bulletin of the Astronomical Society of India, 32, 159
- Richmond (2014) Richmond M. W., 2014, Journal of the American Association of Variable Star Observers (JAAVSO), 42, 333
- Schlafly & Finkbeiner (2011) Schlafly E. F., Finkbeiner D. P., 2011, ApJ, 737, 103
- Schmidt et al. (1992) Schmidt G. D., Elston R., Lupie O. L., 1992, AJ, 104, 1563
- Serkowski (1958) Serkowski K., 1958, Acta Astron., 8, 135
- Serkowski (1970) Serkowski K., 1970, ApJ, 160, 1083
- Serkowski et al. (1975) Serkowski K., Mathewson D. S., Ford V. L., 1975, ApJ, 196, 261
- Shapiro & Sutherland (1982) Shapiro P. R., Sutherland P. G., 1982, ApJ, 263, 902
- Skrutskie et al. (2006) Skrutskie M. F., Cutri R. M., Stiening R., et al., 2006, AJ, 131, 1163
- Smartt et al. (2009) Smartt S. J., Eldridge J. J., Crockett R. M., Maund J. R., 2009, MNRAS, 395, 1409
- Smith et al. (2011) Smith N., Li W., Filippenko A. V., Chornock R., 2011, MNRAS, 412, 1522
- Soam et al. (2015) Soam A., Maheswar G., Lee C. W., et al., 2015, A&A, 573, A34
- Soderberg et al. (2006) Soderberg A. M., Nakar E., Berger E., Kulkarni S. R., 2006, ApJ, 638, 930
- Sonbaş et al. (2010) Sonbaş E., Akyüz A., Balman Ş., Özel M. E., 2010, A&A, 517, A91
- Soria & Kong (2002) Soria R., Kong A. K. H., 2002, ApJ, 572, L33
- Soria et al. (2004) Soria R., Pian E., Mazzali P. A., 2004, A&A, 413, 107
- Spiro et al. (2014) Spiro S., Pastorello A., Pumo M. L., et al., 2014, MNRAS, 439, 2873
- Sutaria et al. (2003) Sutaria F. K., Chandra P., Bhatnagar S., Ray A., 2003, A&A, 397, 1011
- Tran (1995) Tran H. D., 1995, ApJ, 440, 565
- Tran et al. (1997) Tran H. D., Filippenko A. V., Schmidt G. D., Bjorkman K. S., Jannuzi B. T., Smith P. S., 1997, PASP, 109, 489
- Utrobin (2007) Utrobin V. P., 2007, A&A, 461, 233
- Utrobin & Chugai (2015) Utrobin V. P., Chugai N. N., 2015, A&A, 575, A100
- Valenti et al. (2013) Valenti S., Sand D., Howell D. A., et al., 2013, Central Bureau Electronic Telegrams, 3609, 1
- Valenti et al. (2014) Valenti S., Sand D., Pastorello A., et al., 2014, MNRAS, 438, L101
- van Leeuwen (2007) van Leeuwen F., 2007, A&A, 474, 653
- Vinkó et al. (2004) Vinkó J., Blake R. M., Sárneczky K., et al., 2004, A&A, 427, 453
- Vinkó et al. (2009) Vinkó J., Sárneczky K., Balog Z., et al., 2009, ApJ, 695, 619
- Wang et al. (2003) Wang L., Baade D., Höflich P., Wheeler J. C., 2003, ApJ, 592, 457
- Wang & Wheeler (1996) Wang L., Wheeler J. C., 1996, ApJ, 462, L27
- Wang & Wheeler (2008) Wang L., Wheeler J. C., 2008, ARA&A, 46, 433
- Wardle & Kronberg (1974) Wardle J. F. C., Kronberg P. P., 1974, ApJ, 194, 249
- Wheeler (2000) Wheeler J. C., 2000, Cosmic catastrophes: supernovae, gamma-ray bursts, and adventures in hyperspace, Cambridge University Press
- Wheeler & Filippenko (1996) Wheeler J. C., Filippenko A. V., 1996, in IAU Colloq. 145: Supernovae and Supernova Remnants, edited by T. S. Kuhn, 241
- Whittet (2003) Whittet D. C. B., 2003, Dust in the galactic environment (Bristol: IOP)
- Zhang et al. (2006) Zhang T., Wang X., Li W., et al., 2006, AJ, 131, 2245
Appendix A Estimation of polarization contamination
In this section we briefly describe about our procedures to estimate the possible contaminations introduced due to diffuse background, during different phases of moon and/or seeing conditions. These effects could contribute to the polarization values in addition to those contributed by the ISP.
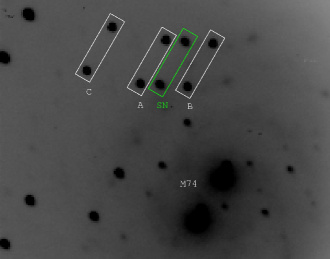
Initially, the SN images acquired at each epoch were aligned using imalign task in IRAF followed by preprocessing (see Section 2). We visually selected three locations A, B and C over one of these aligned images (see Fig. 5). These locations were chosen in such a way that A, B and C are lying nearest to farthest angular distance from the SN. Out of them B and C belong to most and least nebulous region, respectively. Generally, well isolated field stars may not have diffuse background as they are well separated from the nebulous regions (e.g. H II region). Estimation of polarization parameters at various positions (in this case A, B and C) of such star will indicate variation in these values and finally provide possible contribution of nebulous background.
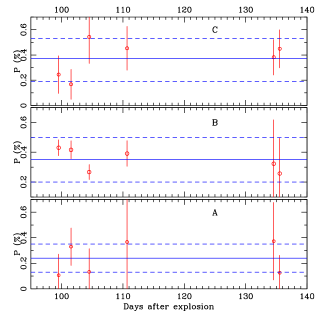
Therefore, we focused to field star HD 8919 which was already observed by AIMPOL with (see Table 3). Situated at a distance of 525 pc, HD 8919 is most distant and faintest (10.07 mag, Høg et al., 2000) object in our list of field stars (c.f. Table 3). The corresponding four images (taken at each HWP positions) of HD 8919 and SN were co-added. It was done by imcombine task in IRAF. Then, we estimated the polarization values of this star at every epoch by applying the same offset and aperture values by which SN polarization values were estimated. The results evaluated at each A, B and C positions are overplotted in panels A, B and C in Fig. 6. We found a mean polarization value of 0.24 0.11, 0.35 0.15 and 0.37 0.16 for A, B and C positions, respectively. The blue coloured continuous and dashed lines in each panel respectively, indicate the mean degree of polarization and one sigma uncertainties.
We do not see significant variation in epoch to epoch values for three positions and also these are lying almost within the one sigma uncertainty limit. This suggests that resultant of nebulous background may not have significant effect on the final measurements of SN. It should be noted that although reported method may not be very accurate but could be useful to verify the background contribution for the objects overimposed to the nebulous regions.