Mapping CO Gas in the GG Tauri A Triple System with 50 AU Spatial Resolution
Abstract
We aim to unveil the observational imprint of physical mechanisms that govern planetary formation in the young, multiple system GG Tau A. We present ALMA observations of 12CO and 13CO 3-2 and 0.9 mm continuum emission with 0.35” resolution. The 12CO 3-2 emission, found within the cavity of the circumternary dust ring (at radius AU) where no 13CO emission is detected, confirms the presence of CO gas near the circumstellar disk of GG Tau Aa. The outer disk and the recently detected hot spot lying at the outer edge of the dust ring are mapped both in 12CO and 13CO. The gas emission in the outer disk can be radially decomposed as a series of slightly overlapping Gaussian rings, suggesting the presence of unresolved gaps or dips. The dip closest to the disk center lies at a radius very close to the hot spot location at AU. The CO excitation conditions indicate that the outer disk remains in the shadow of the ring. The hot spot probably results from local heating processes. The two latter points reinforce the hypothesis that the hot spot is created by an embedded proto-planet shepherding the outer disk.
Subject headings:
protoplanetary disks — stars: individual (GG Tau A) — planet-disk interactions1. Introduction
The discovery of numerous exoplanets in binary and higher order multiple systems, whether orbiting one of the stellar companions or both, clearly demonstrates that planets form and remain in stable orbits in these dynamically complex systems (e.g. the Kepler systems, 16, 34, and 35; Doyle et al., 2011; Welsh et al., 2012). Given that roughly 50% of Sun-like star are in in binary or higher-order multiple systems (Duquennoy & Mayor, 1991; Raghavan et al., 2010), a substantial fraction of planets in the Galaxy have formed in such systems. A complete understanding of planet formation requires us to understand the environments and mechanisms that give rise to such planetary systems.
The massive circum-ternary Keplerian disk surrounding GG Tau Aa, Ab1 and Ab2 (Di Folco et al., 2014) consists of a dense gas and dust annulus or ring that extends from 190 to 280 AU from the central stars and a lower density outer region that extends out to 800 AU (e.g. Dutrey et al., 1994; Guilloteau et al., 1999; Piétu et al., 2011). The total mass of the disk, 0.15 M⊙ (Dutrey et al., 1994), makes it one of the most massive disks orbiting a low-mass stellar system. Interestingly, 80% of the disk mass is confined within the narrow ring despite accounting for 8% of the disk’s volume. The outer disk, which is hidden from the stellar light by the dense ring, is very cold. Dutrey et al. (2014) measured a dust temperature of 8 K at 300 AU and Guilloteau et al. (1999) derived a kinetic temperature of 20 K at the same distance from the stars. Dutrey et al. (2014) also noted that the dust ring appears smooth and homogeneous at 0.5 millimeter (mm) emission.
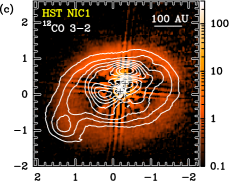
In the near-infrared (near-IR), the ring is optically thick. Detailed models of scattered light emission at wavelengths between 0.8 and 3.6 m found that the emission short ward of 2 m originates from 50 AU above and below the disk mid-plane at the inner edge of the ring (Duchêne et al., 2004). This value is consistent with the thickness of 120 AU derived from the position offset between the ring detected at near-IR and mm wavelengths (Guilloteau et al., 1999). The dust ring is very homogeneous with the exception of a dark lane that is visible on the western side, perhaps the result of a shadow cast by dusty material located inside the inner truncation radius of the disk (Itoh et al., 2014).
Evidence for gas flowing from the outer ring towards the central stars has been inferred from 12CO 2-1 gas emission (Guilloteau & Dutrey, 2001) and has been strongly suggested by a high-spatial resolution map of near-IR H2 gas confined within the inner cavity (Beck et al., 2012). Scattered light images also hinted at the presence of optically thin dust located between the stars and the dust ring (e.g. Roddier et al., 1996; Silber et al., 2000). A recent ALMA study of 12CO 6-5 and IRAM 12CO 2-1 data clearly shows several fragments of CO gas with a kinematic signature indicating that they were falling from the ring toward the inner stellar companions, likely feeding the circumstellar disk associated with the primary star (Dutrey et al., 2014). In this same study, a puzzling CO “hot spot” was detected at the outer edge of the dense ring at a radius of 260 AU. With a temperature estimated to be 40 K, the spot is twice as warm as the surrounding gas. Given the location of this hot spot at the edge of the unusually dense ring, one exciting, although highly speculative, interpretation of this structure is that it represents an embedded companion still in the process of forming.
In this paper, we report our Cycle 1 ALMA observational results of thermal dust at 0.9 mm and line emission from 12CO 3-2 and 13CO 3-2 at 035 angular resolution. We describe the radial profile of the CO gas distribution in the outer ring and the extended region of the disk as well as the CO emission centered on the hot spot. The observations and data reduction are described in section 2. Section 3 presents the analysis of the CO outer disk and is followed by a discussion in Section 4.
2. Observations and Results
2.1. Observations
GG Tau A was observed with the ALMA Band 7 receiver during Early Science (Cycle 1, project ”2012.1.00129.S”). Observations were made in three execution blocks on November 18 and 19, 2013. The array included 29 antennas with projected baselines ranging from 15 m to 1282 m. The frequency setup covered the lines of 12CO and 13CO 3-2 at 345.8 and 330.6 GHz with two spectral windows (SPWs), each providing 1920 channels of 35.3 kHz effective resolution ( km/s) and 58.6 MHz bandwidth. The other two SPWs were set to detect the continuum emission, and each SPW has 3840 channels within a bandwidth of 1.875 GHz, and the spectral resolution is 977 kHz. The calibration (bandpass, phase, amplitude, flux) was performed using CASA111http://casa.nrao.edu v4.1. The bandpass calibration was done using J0423-0120 (aka J0423-013, flux 1.4Jy at 343.5GHz), which also provided the flux scale. The phase and amplitude calibrator is J0509+1806, located away from the source.
2.2. Results
CO and continuum maps were generated from the visibility data using the GILDAS222https://www.iram.fr/IRAMFR/GILDAS package. A high dynamic range was obtained by self-calibrating the continuum data and applying this solution to the line data. In general, the results and maps presented in this paper use a robust weighting with the exception of the spectra presented in Sec.3.2. Robust weighting gives better angular resolution as follows: 041033 with position angle (P.A.) of 52, 043034 with P.A. of 51.3, and 039035 with P.A. of 80 for the 12CO 3-2, 13CO 3-2 and 0.9 mm continuum, respectively. The achieved 1- sensitivity is 9.6 mJy/beam (0.9 K) per velocity channel (35.3 kHz) for the 12CO and 13CO line measurements, respectively. The achieved sensitivity for the 0.9 mm continuum observations is 0.2 mJy/beam. All results have been corrected for the source proper motion (17, -19) mas yr-1 (Ducourant et al., 2005; Dutrey et al., 2014) and precessed to Epoch J2000.
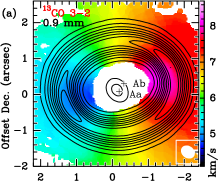
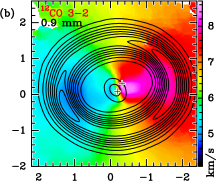
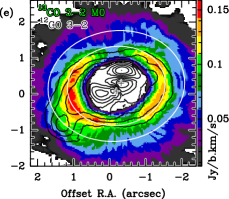
Continuum emission from dust in the GG Tau A system is clearly detected at 0.9 mm and displays characteristics similar to previous continuum observations at 0.45, 1.3, and 3 mm including an unresolved emission peak at the location of the primary companion (GG Tau Aa) and its circumstellar disk as well as a narrow elliptical ring of emission corresponding to the dense, dusty circum-ternary ring (see contours in Figure 1 panels a and b). The best-fit parameters for the inner and outer radius, position angle, and disk inclination are 136 (191 AU), 190 (266 AU), 7.5 and , respectively, with negligible formal errors at this precision.
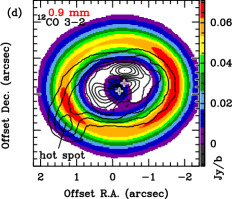
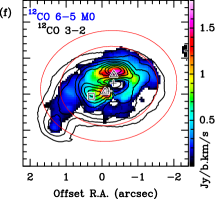
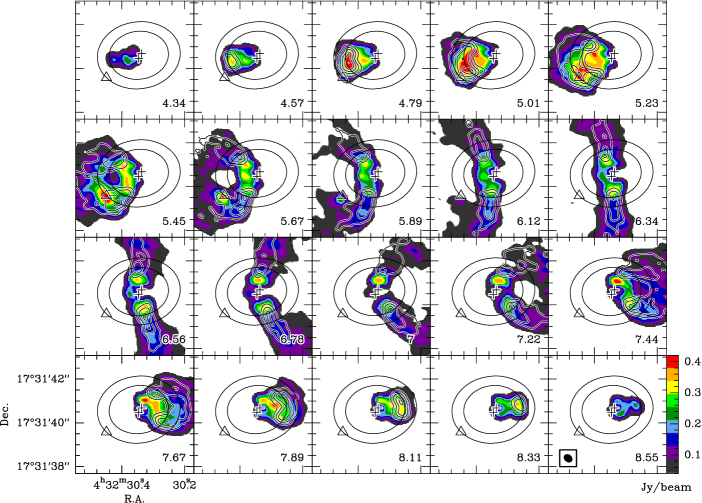
Maps of 12CO and 13CO 3-2 line emission are presented in Figure 1. The 13CO 3-2 image reveals a cavity within the dusty ring in the vicinity of the stellar companions, a result consistent with the dust continuum emission and previous 13CO 1-0 and 2-1 results (Dutrey et al., 1994; Guilloteau et al., 1999). The intensity weighted velocity map of the 13CO 3-2 emission in Figure 1a shows that this line mostly traces the Keplerian motion of gas residing in the circum-ternary disk. By contrast, 12CO 3-2 emission extends inside the cavity down to the positions of the stellar companions (see Figure 1). The peak 12CO 3-2 emission within the cavity is physically located between those associated with 12CO 6-5 tracing warm gas near the stellar companions and 12CO 2-1 tracing colder gas near the inner edge of the ring. Such a stratification is typical of a gradient in the excitation and physical conditions (i.e., temperature and density) of the gas in this environment as noted by Dutrey et al. (2014). In the 12CO 3-2 line emission contours in Figure 1c-f, a long extension of gas reaches toward the southeast terminating near the outer edge of the dense circum-ternary ring some 260 AU from the disk center and spatially coincident with the location of the “hot spot” previously detected in the CO 6-5 mentioned above (Dutrey et al., 2014). The hot spot is also visible in the 12CO 3-2 channel maps in Figure 2, at velocities between 5.23 and 6.12 km s-1.


their respective colors. All the plots are produced with de-projected maps.
3. Analysis of the CO radial distribution
3.1. CO radial distributions
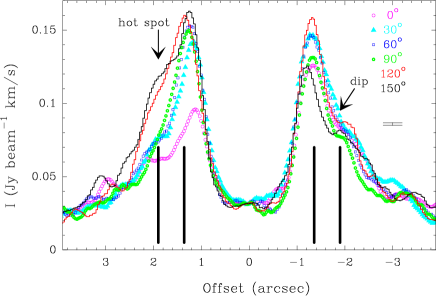
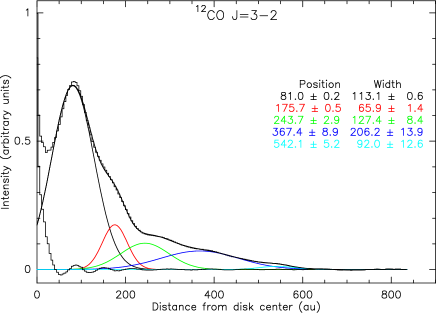
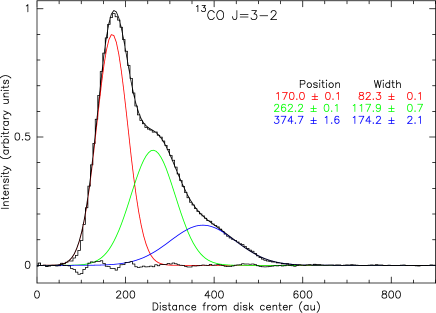
In Figure 3a, six radial profiles of the de-projected integrated flux or moment 0 map of the 13CO 3-2 line are displayed. The disk rotation axis, which is 7.5 East of North, is used as the azimuthal reference or for the radial cuts. All radial profiles exhibit a sharp inner edge, and extend slightly inside the inner truncation radius for the dusty ring. Moving radially outward, the profiles do not decrease monotonically beyond the inner edge of the ring. The 13CO 3-2 emission is clearly azimuthally asymmetric with a notable bright spot located at an offset of 19 and 120 150 , a position that is coincident with the hot spot feature.
In Figure 3b and c, we produce the average radial profile over the western side of the disks from the moment 0 maps of both 12CO and 13CO 3-2, avoiding contributions from the feature on the eastern side. The radial profile for the western half of the disk is decomposed into a series of partially overlapping Gaussians for both CO lines. The positions of the peaks (distance from center in AU) and widths (FWHM in AU) of these Gaussians and their corresponding formal errors are presented in Figure 3b and c. In 12CO, the Gaussian with the brightest amplitude peaks at 81 au, coincident with the gas streamer described in Dutrey et al. (2014). At radii 30 AU, the residuals likely are dominated by the CO disk surrounding the primary, Aa. In the dusty ring and extended disk, the 12CO and 13CO radial distributions can be decomposed into three bright Gaussians centered around 170-176 AU, 240-260 AU and 370 AU. A fourth and outermost Gaussian is observed at a radius of 540 AU, only in 12CO. Given the widths of these Gaussian features and a spatial resolution of 50 AU, all are spatially resolved with the exception of the one that peaks near 170 AU. This feature also happens to be located just slightly inside the inner truncation radius for the dusty ring 190 AU. The difference in apparent inner radii is likely due to the high contrast in opacity between the 13CO 3-2 and 0.9 mm dust emissions, which is on the order of 3500 assuming standard dust properties (Beckwith et al., 1990), a local line-width of 0.3 km/s, a temperature of 20 K and a 13CO abundance of 1.410-6 (see Dutrey et al., 1996, for details). A very small amount of dust and gas inside the inner edge of the ring can thus remain optically thick in 13CO, but be undetectable in dust.
The Gaussians at 250 and 370 AU trace features at the outer radius and beyond the dense, dust ring. Instead of being interpreted in terms of bumps, these radial profiles can be equally well interpreted as resulting from the presence of two “dips” or unresolved gaps at radii and AU on top of a monotonic decrease with radius.
3.2. The gas dynamics traced by CO
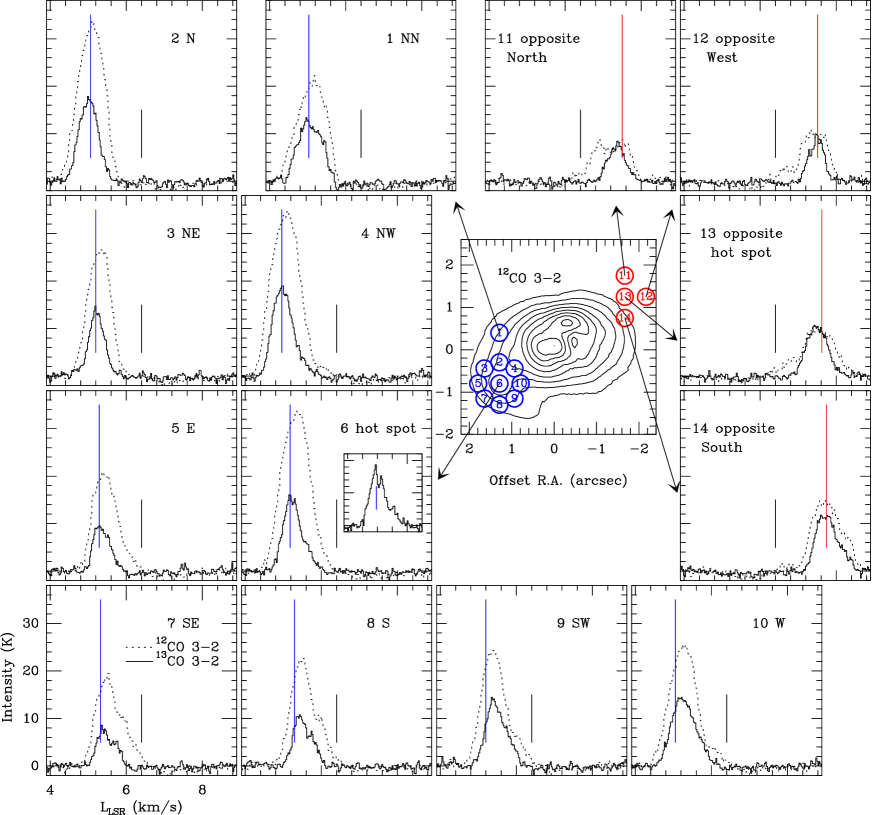
In Figure 4, we present spectra of 12CO and 13CO 3-2 lines extracted from the images with natural weighting near the hot spot and at positions on the western side of the disk opposite the hot spot. As all the images were self-calibrated, deconvolution artefacts should be negligible here. Even if most spectra are more complex than a simple Gaussian, some general trends can be found. On the western side, the spectra are mostly centered around the expected Keplerian velocity, as indicated by the vertical red lines. The 13CO spectra essentially show a single smooth component, while the 12CO spectra are broader, with some blue or red shifted tails or even double-peaked. Double-peaked profiles can appear when CO is located only at the upper layers of the gas disk, as in the case of the CO disk orbiting the single star HD163296 (de Gregorio-Monsalvo et al., 2013). This happens because the two layers of CO gas (above and below the mid-plane) do not project identically.
Around the hot spot on the eastern side of the disk, the 12CO and 13CO 3-2 spectra exhibit a component at the Keplerian velocity (indicated by the vertical blue lines) and a red-shifted tail (at velocity 5.7 km/s), which traces receding gas along the line of sight. On the hot spot itself, the 13CO spectrum obtained in robust weighting, although noisier, further suggests a double-peaked profile with separation of 0.16 km/s centered around the local Keplerian velocity. In addition, the red-shifted component is more intense on the hot spot, suggesting an intrinsic origin at the location of the hot spot.
3.3. Excitation conditions
We also use locations 6 and 12 to 14 shown in Figure 4 to derive the excitation conditions from the 12CO and 13CO 3-2 intensities.
On the western side, both lines have roughly the same intensity. As the 13CO molecule is 70 times less abundant than the 12CO molecule, the former should trace emission closer to the mid-plane of the disk if both lines are optically thick. The similar intensity suggests optically thick emission from material at about the same kinetic temperature (see Dartois et al., 2003, for details about line formation in disks). This can only happen if the vertical temperature gradient is weak. Such a small gradient can be expected, if most of the stellar light is intercepted by the puffed up rim located at the ring inner edge (at radius 180-190 AU). The outer disk ( AU) then remains in shadow and is thus relatively cool.
The H2 density within the ring and outer disk is estimated to be large, being 106 to 109 cm-3 (Guilloteau et al., 1999). At such densities, the 12CO 3-2 and 13CO 3-2 are necessarily thermalized. The brightness temperature is given by
where is the radiation temperature ( for temperatures , see e.g. Wilson et al., 2013), is the beam filling factor and the line opacity. As the lines are optically thick, the brightness temperatures shown in Figure 4 provide a direct measurement of the kinetic temperature (Dutrey et al., 2007). The gas temperature at locations 12 to 14 is then 16-19 K with typical formal errors of 1 K, consistent with the value derived from 13CO 2-1 by Guilloteau et al. (1999). We note that a steep temperature gradient with exponent , i.e. temperature falling almost as 1/r, was found by Guilloteau et al. (1999) in the ring and outer disk. A similar gradient was reported for dust by Dutrey et al. (2014). Such a steep gradient is very different from those found in disks without cavities where (e.g. Piétu et al., 2007). This further supports the hypothesis that the inner edge of the ring is directly exposed to the stellar light, casting a shadow on the outer disk.
We further estimate the column density using RADEX333http://home.strw.leidenuniv.nl/moldata/radex.php (van der Tak et al., 2007). At the locations 12 to 14 in Figure 4, the column density N(13CO) is 31015cm-2, assuming a line width of 0.3 km/s and a temperature of 20 K. This N(13CO) is consistent with the analysis from Guilloteau et al. (1999).
At the hot spot location (location 6), the brightness temperature of 12CO 3-2, K, is identical to that found for the 2-1 line by Dutrey et al. (2014), and much higher than that of 13CO 3-2, K. The same analysis as above implies a kinetic temperature of at least 42 K for 12CO. Further assuming 12CO and 13CO emission arise from the same medium and an isotologue ratio of 70, we can derive the opacity, and thus refine the temperature estimate and determine the column density. Under this assumption and with a beam filling factor , the kinetic temperature is K, and N(13CO) cm-2. These values would be larger for . Given the high signal-to-noise ratio on the spectra, statistical errors are here well below 1 K. Thus the “hot spot” is warmer than the disk by at least 20 K, with a significance level well above 10 .
4. Discussion
4.1. Disk gaps beyond the dense ring?
The presence of several dips (see section 3.1) suggests that the observed CO radial distributions are more complex than a smooth radial law. The comparison between 12CO and 13CO indicates that this brightness distribution seen around GG Tau A reflects the kinetic temperature (or more precisely the product of temperature and beam filling factors) but not directly the molecular column densities, because both lines are optically thick. We discuss the possible origin of the shape of the radial brightness distribution below.
It is unlikely that the temperature difference between the rings is driven by differences in the illumination of the disk by the central stars. As discussed in Sect.3.3, most of the stellar light is probably intercepted at the inner edge of the dense ring. Indeed, the innermost CO ring at 170-176 AU precisely corresponds to this heated rim. At larger distances, the lack of illumination results in low vertical temperature gradients, because the disk is in the shadow of the ring. It is possible that differences in surface density can cause apparent temperature variations. With larger column densities, 12CO would sample higher layers in the disk and thus higher temperatures. However, this effect should be smaller for 13CO because of its smaller abundance. One way to produce the observed contrast in 12CO and 13CO radial distributions would be a contrast in beam filling factors, as would be expected for a series of (radially) unresolved gaps and dense annuli (which remain optically thick even in 13CO). Unresolved spiral patterns can also produce a similar result. The beam size (resolution) of our observation is 50 AU. If the annuli/spirals are not well separated, this would cause an dip/drop in brightness at the location of gaps.
Such configurations are reminiscent of what is observed around HD100546 (Pineda et al., 2014) or AB Auriga (Tang et al., 2012). This is also expected in case of gravitational disturbances by an embedded object located in the disk (Pierens & Nelson, 2013). A distribution similar to that observed in the HL Tau dust disk (ALMA Partnership et al., 2015), scaled to the larger size of the GG Tau ring, can also mimic what we observe here.
We note that 80% of the dust mass of the outer disk is confined at radii between 190 and 260 AU (Dutrey et al., 1994). The gas rings may act like a dust trap (Pinilla et al., 2015; Andrews et al., 2014). However, the model of Andrews et al. (2014) requires the gas to extend down to 100 AU, while the inner edge seen in 13CO is at 170 AU. A more comprehensive model is needed to see if another configuration could provide a viable solution.
4.2. The CO hot spot and its surroundings
We find a significantly higher temperature at the hot spot location (by 20 K) as compared to the other locations at the same radius. It seems unlikely that such a temperature enhancement is created only by variations of the stellar illumination induced by homogeneities in the disk. All mm continuum maps (Dutrey et al., 2014; Andrews et al., 2014) and near-IR images (Itoh et al., 2014) of GG Tau A show a very homogenous distribution of dust as a function of azimuth. Although Silber et al. (2000) reported a distortion in the near-IR emission near the location of the hot spot in the HST image of polarized scattered light (shown in Figure 1), this was not confirmed in more recent images (see discussion in Duchêne et al. 2004, and also Itoh et al. 2014). In addition, the strongest streamer seen in CO 3-2 and 6-5 would attenuate the stellar light between GG Tau A and the hot spot, because it appears at the same azimuth. Finally, the CO gas temperature at 260 AU in the disks around the much more luminous Herbig Ae stars MWC 480 and AB Aur is only 26 K and 32 K respectively (Piétu et al., 2007, 2005). Given these considerations, we find variations in stellar illumination highly unlikely to be the cause in the temperature enhancement observed for the “gas hot spot” feature.
The observed increase in temperature and 12CO emission requires either a significant increase in the local surface density as described above for the ring-like structures and/or a source of heating that affects a localized region of the disk. One such plausible explanation may be tidal disturbances induced by GG Tau B, a very low-mass binary T Tauri system with mass of 0.17 M⊙. However, Beust & Dutrey (2006) investigated such effects and found that the induced disk distortions should affect a substantially large area of the disk, much larger than the size of the hot spot feature.
Another plausible explanation is that the localized heating and density enhancements are provided by the formation of an embedded substellar object (Gressel et al., 2013), similar to that imaged by Delorme et al. (2013) at a distance of 80 AU from the the low-mass binary 2MASS J01033563-5515561(AB). While recognizing the speculative nature of this possibility, the formation of a companion near the outer edge of the dense and massive circum-ternary ring provides a reasonable explanation for the existence and nature of the ring. In addition, such an object would be expected to clear a gap within the disk, which is consistent with the location of one of the dips suggested by the 13CO and 12CO radial profile (see Section 3.1). We note that a planetary mass object at this distance would not necessarily generate an open gap. A fully opened gap can be created only if the planet Hill’s radius is larger than the scale height, typically of the order of 30 AU there, and if the viscosity is small. A planetary companion would most likely produce a surface density contrast instead of a complete disk gap (Crida et al., 2006).
The observed distortion of the channel pattern seen in Figure 2 is also in qualitative agreement with the simulations of CO observations with ALMA of an embedded planet in a Keplerian disk (Perez et al., 2015). A double-peaked profile is detected (though marginally) at the location of the hot spot in 13CO 3-2. If confirmed, this might be the signature of the circumplanetary (CP) disk (Perez et al., 2015). The separation of the 13CO 3-2 peaks is 0.16 km/s. Assuming the CP disk inclination is that of the whole system (i.e. 36.3), we can get a rough estimate of the mass of the embedded object. Its mass is 0.16 Jupiter mass (), for an outer disk radius, rout, of 10 AU or 0.016 for rout=1 AU. On the other hand, the mass of the CO hot spot, derived from the column density of 13CO, is much larger, . This indicates that, within a radial extension of 50 AU (our spatial resolution), a large amount of material is still surrounding the putative embedded object. In this scenario, the receding gas (i.e. the redshifted tail with respect to the local Keplerian velocity) may partly trace material located in the vortex above the disk mid-plane and falling down onto the mid-plane on the proto-planet, as reported by Gressel et al. (2013) in their simulations.
5. Summary
We report our new results for the GG Tau A system using ALMA in 12CO and 13CO 3-2 lines and in continuum at 0.9 mm. The 12CO gas is found in the cavity of the dust ring and in the outer disk, while 13CO gas is detected only in the outer disk. At the outer edge of the dust ring, the hot spot is observed both in 12CO and 13CO 3-2. In the outer disk, the radial distribution of the brightness of the two CO isotopologues is complex and exhibits a series of ring-like features. We note that the first dip coincides with the location of the hot spot, 250-260 AU from the disk center. The angular resolution of these data does not allow a detailed analysis of such structures. Studies of the excitation conditions beyond the ring, in the outer disk, indicate that the outer disk remains in the shadow of the ring. Therefore, the most probable origin of the hot spot is a local source of heating. Together with the apparent dips, this further supports our scenario of a young planet accreting material from its surroundings. Using ALMA, the achievable line sensitivity in a reasonable amount of time still allows an improvement of the angular resolution by a factor 3 (01). With such angular resolution, analysis of the close surroundings of accreting planets and quantitative comparison with model predictions may become feasible.
Facilities: PdBI, ALMA.
References
- ALMA Partnership et al. (2015) ALMA Partnership et al. 2015, ApJ, 808, L3
- Andrews et al. (2014) Andrews, S. M., et al. 2014, ApJ, 787, 148
- Beck et al. (2012) Beck, T. L., Bary, J. S., Dutrey, A., Piétu, V., Guilloteau, S., Lubow, S. H., & Simon, M. 2012, ApJ, 754, 72
- Beckwith et al. (1990) Beckwith, S. V. W., Sargent, A. I., Chini, R. S., & Guesten, R. 1990, AJ, 99, 924
- Beust & Dutrey (2006) Beust, H., & Dutrey, A. 2006, A&A, 446, 137
- Crida et al. (2006) Crida, A., Morbidelli, A., & Masset, F. 2006, Icarus, 181, 587
- Dartois et al. (2003) Dartois, E., Dutrey, A., & Guilloteau, S. 2003, A&A, 399, 773
- de Gregorio-Monsalvo et al. (2013) de Gregorio-Monsalvo, I., et al. 2013, A&A, 557, A133
- Delorme et al. (2013) Delorme, P., et al. 2013, A&A, 553, L5
- Di Folco et al. (2014) Di Folco, E., et al. 2014, A&A, 565, L2
- Doyle et al. (2011) Doyle, L. R., et al. 2011, Science, 333, 1602
- Duchêne et al. (2004) Duchêne, G., McCabe, C., Ghez, A. M., & Macintosh, B. A. 2004, ApJ, 606, 969
- Ducourant et al. (2005) Ducourant, C., Teixeira, R., Périé, J. P., Lecampion, J. F., Guibert, J., & Sartori, M. J. 2005, A&A, 438, 769
- Duquennoy & Mayor (1991) Duquennoy, A., & Mayor, M. 1991, A&A, 248, 485
- Dutrey et al. (1996) Dutrey, A., Guilloteau, S., Duvert, G., Prato, L., Simon, M., Schuster, K., & Menard, F. 1996, A&A, 309, 493
- Dutrey et al. (2007) Dutrey, A., Guilloteau, S., & Ho, P. 2007, Protostars and Planets V, 495
- Dutrey et al. (1994) Dutrey, A., Guilloteau, S., & Simon, M. 1994, A&A, 286, 149
- Dutrey et al. (2014) Dutrey, A., et al. 2014, Nature, 514, 600
- Gressel et al. (2013) Gressel, O., Nelson, R. P., Turner, N. J., & Ziegler, U. 2013, ApJ, 779, 59
- Guilloteau & Dutrey (2001) Guilloteau, S., & Dutrey, A. 2001, in IAU Symposium, Vol. 200, The Formation of Binary Stars, ed. H. Zinnecker & R. Mathieu, 229
- Guilloteau et al. (1999) Guilloteau, S., Dutrey, A., & Simon, M. 1999, A&A, 348, 570
- Itoh et al. (2014) Itoh, Y., et al. 2014, Research in Astronomy and Astrophysics, 14, 1438
- Perez et al. (2015) Perez, S., Dunhill, A., Casassus, S., Roman, P., Szulágyi, J., Flores, C., Marino, S., & Montesinos, M. 2015, ArXiv e-prints
- Pierens & Nelson (2013) Pierens, A., & Nelson, R. P. 2013, A&A, 556, A134
- Piétu et al. (2007) Piétu, V., Dutrey, A., & Guilloteau, S. 2007, A&A, 467, 163
- Piétu et al. (2011) Piétu, V., Gueth, F., Hily-Blant, P., Schuster, K.-F., & Pety, J. 2011, A&A, 528, A81
- Piétu et al. (2005) Piétu, V., Guilloteau, S., & Dutrey, A. 2005, A&A, 443, 945
- Pineda et al. (2014) Pineda, J. E., Quanz, S. P., Meru, F., Mulders, G. D., Meyer, M. R., Panić, O., & Avenhaus, H. 2014, ApJ, 788, L34
- Pinilla et al. (2015) Pinilla, P., de Juan Ovelar, M., Ataiee, S., Benisty, M., Birnstiel, T., van Dishoeck, E. F., & Min, M. 2015, A&A, 573, A9
- Raghavan et al. (2010) Raghavan, D., et al. 2010, ApJS, 190, 1
- Roddier et al. (1996) Roddier, C., Roddier, F., Northcott, M. J., Graves, J. E., & Jim, K. 1996, ApJ, 463, 326
- Silber et al. (2000) Silber, J., Gledhill, T., Duchêne, G., & Ménard, F. 2000, ApJ, 536, L89
- Tang et al. (2012) Tang, Y.-W., Guilloteau, S., Piétu, V., Dutrey, A., Ohashi, N., & Ho, P. T. P. 2012, A&A, 547, A84
- van der Tak et al. (2007) van der Tak, F. F. S., Black, J. H., Schöier, F. L., Jansen, D. J., & van Dishoeck, E. F. 2007, A&A, 468, 627
- Welsh et al. (2012) Welsh, W. F., et al. 2012, Nature, 481, 475
- Wilson et al. (2013) Wilson, T. L., Rohlfs, K., & Hüttemeister, S. 2013, Tools of Radio Astronomy