On the Star Formation Law for Spiral and Irregular Galaxies
Abstract
A dynamical model for star formation on a galactic scale is proposed in which the interstellar medium is constantly condensing to star-forming clouds on the dynamical time of the average midplane density, and the clouds are constantly being disrupted on the dynamical time scale appropriate for their higher density. In this model, the areal star formation rate scales with the 1.5 power of the total gas column density throughout the main regions of spiral galaxies, and with a steeper power, 2, in the far outer regions and in dwarf irregular galaxies because of the flaring disks. At the same time, there is a molecular star formation law that is linear in the main and outer parts of disks and in dIrrs because the duration of individual structures in the molecular phase is also the dynamical time scale, canceling the additional 0.5 power of surface density. The total gas consumption time scales directly with the midplane dynamical time, quenching star formation in the inner regions if there is no accretion, and sustaining star formation for Gyr or more in the outer regions with no qualitative change in gas stability or molecular cloud properties. The ULIRG track follows from high densities in galaxy collisions.
1 Introduction
The increase of the star formation rate (SFR) per unit area, , with increasing molecular gas surface density, , is close to linear in the main parts of galaxy disks (Bigiel et al., 2008; Leroy et al., 2008; Bigiel et al., 2011; Schruba et al., 2011). The usual interpretation is that star formation occurs in molecular clouds at a fixed rate per molecule, independent of environment (e.g., Krumholz et al., 2009a). However, molecular clouds should be denser in the inner parts of galaxies because of larger pressures, as shown by Heyer & Dame (2015) for the Milky Way, and denser clouds should form stars faster. A more physical interpretation is that stars always form at the local ISM collapse rate regardless of the molecular fraction. This would give a slope of 1.5 in a plot of versus total gas column density, , in the inner regions where the disk scale height is about constant, and a slope of 2 for this relation in the outer regions where there is a disk flare (see below). The observed linear relation for molecules would then be the result of an additional correlation between the local dynamical time of molecular gas and its duration in that phase. This is the interpretation we investigate here.
Numerical simulations are of limited value in determining the underlying physics of the areal star formation law because they need to make assumptions about what happens inside their equivalent of molecular clouds. Gnedin et al. (2014) showed that the areal law reflects the local (3D) law. That is, a local dynamical law like for 3D star formation and gas densities and translates into a large-scale law like for average densities, and into an areal law . The implication is that the linear star formation law for molecules, which is often described as a constant consumption time for molecules on a kpc scale, corresponds to a constant time per molecule inside each molecular cloud. The threshold model by Lada et al. (2010) and Evans et al. (2014), as observed in the solar neighborhood, is an example of such a law because there is a constant threshold column density, and presumably also density, for star formation.
A problem with this model is that at the high pressures of inner galaxy disks, clouds of a given column density are less strongly self-gravitating than they are in the solar neighborhood. Recall that the influence of self-gravity on a cloud, as opposed to external pressure, , is directly proportional to . For a given cloud surface density , self-gravity becomes exponentially less important at higher (Padoan et al., 2012). Thus there can be neither a constant threshold column density for star formation nor a linear proportion between the SFR and the molecular cloud mass over galactic scales where the equilibrium pressure from the weight of the gas layer varies by a large amount. In galaxy disks, the pressure varies approximately as the square of the surface density, which corresponds to a factor of over 4 scale lengths, i.e., over most of the main disk.
Bonnell et al. (2013) simulated cloud formation, cloud collisions, and collapse in the denser parts of clouds throughout a spiral arm. They found the observed steep relation (Kennicutt, 1998) for the total gas at the same time as there was a linear relation with the dense gas, , as observed for CO-emitting gas (Bigiel et al., 2008). They attributed the difference to cloud formation in the low density phase, with an increase in the dense gas fraction from cloud collisions as the total gas density increased. Here we take a similar point of view, but at a more fundamental level.
We propose that most of the ISM is in a constant state of collapse to star formation followed by dispersal from young stellar pressures (e.g., Li et al., 2005; Bournaud et al., 2010; Hennebelle & Iffrig, 2014). The duration of each state and its probability are proportional to the associated dynamical time. Star formation is part of this cycle and has a rate given by the same principle, i.e., a fixed fraction of ambient gas turns into stars during its dynamical time. This model is in agreement with observations of cloud phase lifetimes and turbulent crossing times (e.g., Elmegreen, 2000). We show here that the model also gives the observed molecular and total-gas SFR laws with their slopes of 1 and 1.5, respectively.
There are many models for the SFR-surface density relation. Krumholz & McKee (2005) proposed a dynamical model with star formation at locally unstable densities in a log-normal density pdf; in Renaud et al. (2012), this density threshold is where the gas is cool enough to be supersonically turbulent. Krumholz et al. (2009a) extended the model to spiral galaxies assuming a constant surface density for individual molecular clouds in main disks because of pressure decoupling from the ambient medium, and an increasing surface density for individual clouds in the inner parts where the ambient pressure is high. Krumholz et al. (2012) made the same assumptions, extending the high pressure regime to high redshift and interacting galaxies. HI-dominated galaxies like dwarf irregulars were considered in Krumholz (2013). Ostriker et al. (2010) considered feedback-controlled pressure for two stable HI phases with the excess gas in self-gravitating CO clouds that have a constant SFR/mass. Kim et al. (2013) and Kim & Ostriker (2015) ran simulations with star formation feedback that explain the scale height and properties of the ISM with a dynamically-based SFR at a threshold density and a constant efficiency per unit free fall time. Hu et al. (2015) use the dynamical model for SFR in dwarf galaxies with a constant threshold density and efficiency for star formation. In Krumholz et al. (2009a), Dib (2011), Murante et al. (2015) and elsewhere, the SFR depends explicitly on the fraction that comes from molecule formation theory. Hopkins et al. (2014) simulate galaxies with star formation at the local collapse rate in the molecular parts of self-gravitating clouds that exceed a certain fixed density, noting that the rate does not depend sensitively on the detailed star formation law or prescription for molecule formation.
Most of these and other models share attributes of the proposal here. Key differences are that we do not need an equilibrium basic state, although there is a mass balance between collapse and break-up of star-forming clouds, we do not identify molecular clouds with star forming clouds, or vice versa, and we do not assume standardized molecular clouds with a constant star formation rate per molecule (that constant results from the model automatically). The most similar previous theory was that expressed by Madore (2010), who considered star formation on a timescale equal to the sum of an interstellar collapse time and a cloud break up time. We agree that timing is important, and take the next logical step in using this timing argument to convert the physically motivated SFR relation for total gas into a shallower apparent SFR relation for the molecular part of the gas.
2 The Dynamical Model for Star Formation
The dynamical model for star formation (Larson, 1969; Madore, 1977; Silk, 1987; Katz, 1992) suggests that
| (1) |
where
| (2) |
The second step uses . Combined, they give
| (3) |
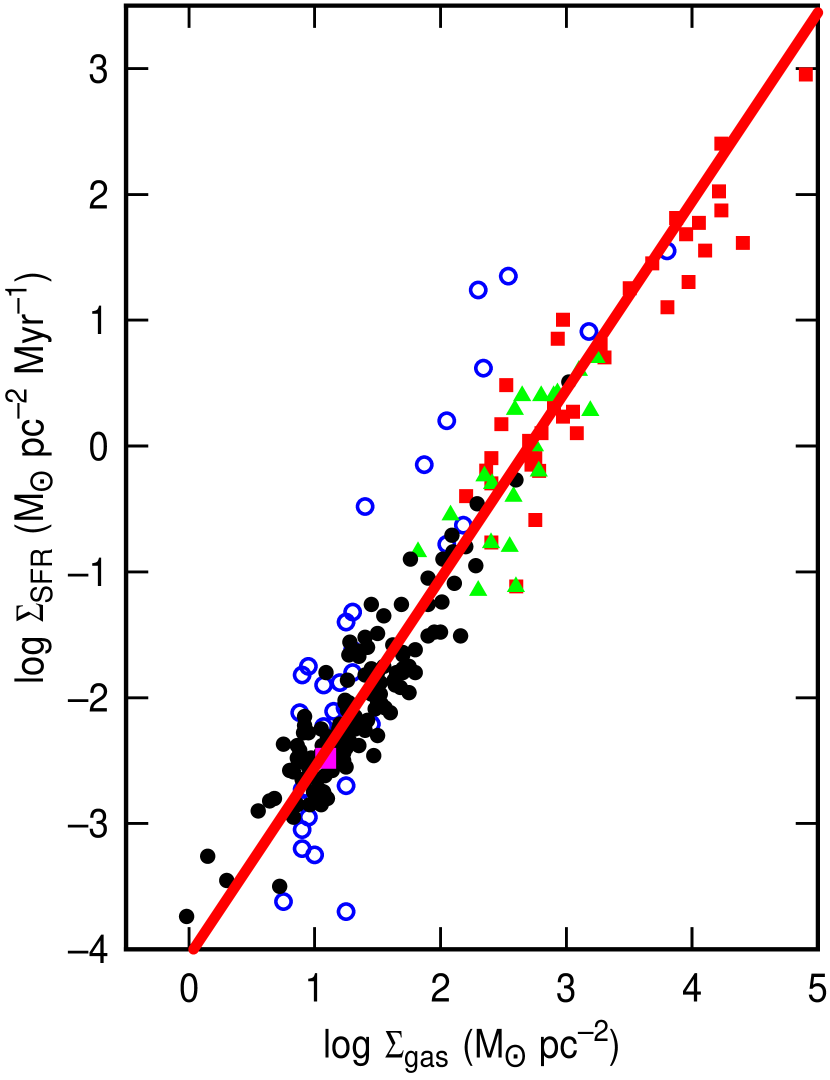
In the inner parts of galaxies, may be about constant (Heyer & Dame, 2015). Setting pc for the total gas layer and (Krumholz & Tan, 2007), we get
| (4) |
This is the same as the relation observed for many types of galaxies by Kennicutt & Evans (2012), as shown in Figure 1a.
The efficiency per unit free fall time, , should depend on cloud geometric structure, i.e., the probability distribution function of dense gas (Elmegreen, 2002), and feedback, i.e., the prevention of local collapse by the stars that have already formed (see review in Padoan et al., 2014). First-principle derivations of this efficiency by several groups are compared in Federrath & Klessen (2012), who find they give about the same value in various situations. We assume simply that is constant for all galaxies (see also Krumholz et al., 2012). We do not consider the average molecular fraction to be a large part of the efficiency: diffuse (non-self-gravitating) gas can be molecular and molecular gas, even at high excitation density, can be diffuse. Similarly, atomic clouds can be diffuse, but also self-gravitating if they are massive enough, which gives them a low average density at a given pressure.
In the outer parts of spiral galaxies and in most of dwarf irregular galaxies, the gas dominates the disk mass surface density and
| (5) |
Then
| (6) |
and
| (7) |
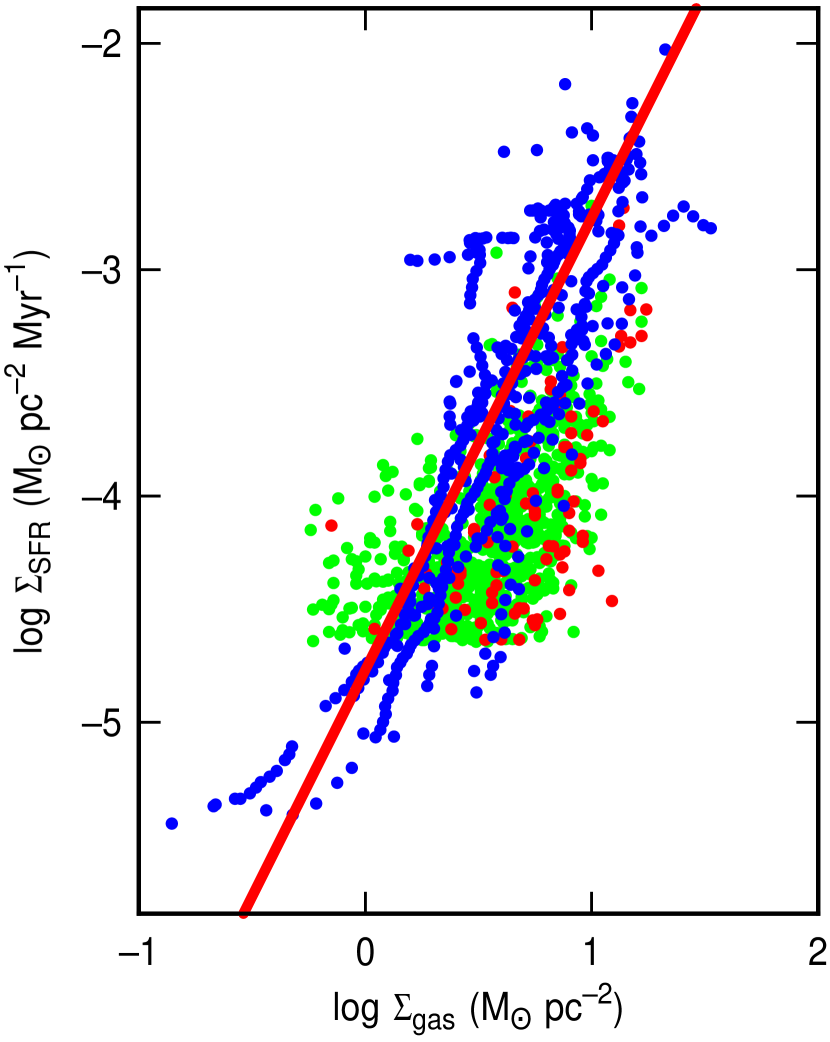
For a typical outer-disk and dIrr gas velocity dispersion of km s-1, and for again, we obtain
| (8) |
This is approximately the same as the relation observed for 20 dIrr’s in Elmegreen & Hunter (2015) and for 5 dIrr’s and the outer parts of 17 spirals in Bigiel et al. (2010) as shown in Figure 1b. The similarity between dIrr and outer spirals was also noted by Roychowdhury et al. (2015) who point out further that this implies the SFR relation is independent of metallicity. Other regions that are gas dominated, as may be the case for parts of mergers or interacting galaxies, could have this relation locally as well.
Equations (4) and (8) suggest that the dynamical model with a constant reproduces the superlinear SFR relation in the inner disks of starburst galaxies where the slope is , as identified by Kennicutt (1998), and it reproduces the relation in dIrrs and the outer parts of spiral galaxies where the slope is (Bigiel et al., 2010; Elmegreen & Hunter, 2015). The steeper slope is because of the disk flare (see also Barnes et al., 2012). Both of these regions have their total gas dominated by the ISM phase that is actually observed, so the dynamical model is revealed directly. When using the molecular surface density on the abscissa, however, we need to consider something else. In the starburst inner region, the gas is mostly molecular, and in the far outer regions of spirals and in dIrrs, the gas is mostly atomic. In the region between, the molecular fraction varies with radius and this is where the linear molecular KS relation appears. Thus the linear relation is most likely a by-product of a changing molecular fraction. We discuss this in the next section.
3 The Surface Density of CO
The dynamical model cannot have a linear relation between and total gas surface density because the space density inside clouds varies with ambient pressure in a galaxy, and therefore with radius (e.g., Kalberla & Kerp, 2009) and spiral arm phase. The linear relation between and molecular surface density as measured by CO (Bigiel et al., 2008; Leroy et al., 2008) or HCN (Gao & Solomon, 2004; Wu et al., 2005) should therefore arise from an additional effect. We suggest that all ISM structures evolve on their internal dynamical timescales, which means the turbulent crossing time for both gravitating and diffuse clouds and the gravitational time for self-gravitating clouds (Elmegreen, 2000). As a result, molecular gas should evolve on a timescale approximately equal to the dynamical time at its threshold density for excitation. The assumption here is that the average density of a molecular cloud or subregion in that cloud is proportional to the excitation density of the molecule observed (Krumholz & Thompson, 2007; Narayanan et al., 2008). This is reasonable because for centrally condensed clouds, a high fraction of the mass has a density close to the value at the observed edge. In addition, for power-law density structure inside clouds (Lombardi et al., 2015), the ratio of gas masses for two fixed densities, such as a collapse threshold and an excitation density, is constant.
In the dynamical model, gas is never in equilibrium but is either collapsing toward star formation at the dynamical rate of the ambient medium, or getting disrupted after star formation, which takes place on some multiple of the dynamical time scale at the density of the star-forming cloud. For the life cycle of CO clouds, the first rate is evaluated at the average local midplane density, as above, and the second is evaluated at the characteristic density of CO emission. Then the fraction of the gas mass in a CO-emitting state is proportional to the mean time spent there,
| (9) |
Consequently, the average column density of CO is
| (10) |
These timescales are proportional to the square roots of the densities for our assumption of gravitationally-driven processes, so
| (11) |
Madore (2010) also considered gas phase timing as part of an explanation for the SFR-density relation; what we call for the star-forming gas, he calls a stagnation time, which is the same basic concept. What is new here is the identification of this time with the dynamical time at the excitation threshold density for tracer molecules like CO and the role that this time plays in converting an intrinsic 1.5 power of total density or column density for the SFR to an observed 1.0 power for the molecules.
For most of a normal galaxy disk, and . If CO emission occurs at a characteristic density for CO excitation, then is about constant and . In this limit,
| (12) |
which may be inverted to give
| (13) |
Here uses instead of in equation (6) and is constant because is approximately the constant excitation density.
We have reproduced the Bigiel-Leroy linear molecular law by stretching the physical law toward lower as the SFR drops when plotting versus because the molecular fraction is dropping at the same time.
Equations (1), (2), (10), and (11) may be combined to give the SFR for arbitrary molecular transitions,
| (14) |
where is some factor of order unity times the excitation density. The ambient density enters equation(14) because the SFR in the KS relation is usually taken to be the average over some large region of a galaxy, where the average density has this value. This relation makes a smooth transition from a power law dependence on molecular gas surface density in the far-inner regions where and for constant (cf. Eq. 4), to a linear dependence on molecular gas at intermediate and large radii (independent of ) where . Because molecules are not usually observed at large radius, the equation reverts to the quadratic dependence on the total in the outer flaring region (cf. Eq. 8). Note that for either CO or HCN in the main disk, and the SFR is for constant at some factor times the appropriate excitation density. For all of these relations, constant in principle, although at higher densities, such as for HCN, should be larger than it is for CO because there is less gas structure closer to the thermal scale, where gas motions approach the thermal speed (Elmegreen, 2008).
4 for the Kennicutt and Bigiel-Leroy correlations
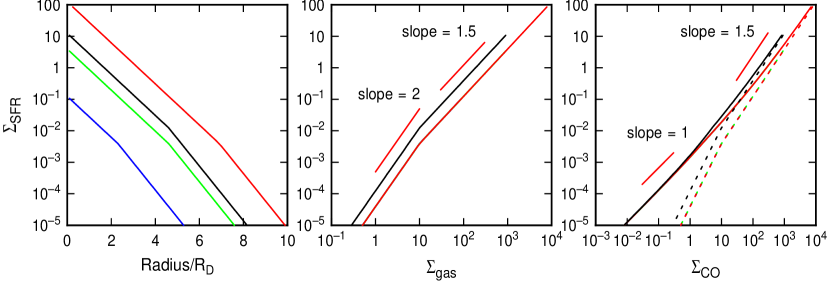
Figure 2 shows the superlinear and linear laws in the normal way they are plotted, one with versus total gas surface density and the other with versus CO surface density. We assume a model galaxy with an exponential radial profile of gas surface density (e.g., Kalberla & Kerp, 2009; Heyer & Dame, 2015)
| (15) |
The disk scale height is assumed to be constant, for pc-2 where stars tend to dominate gas in spiral galaxies, and flaring as outside this radius (cf. eq. 5), where gas tends to dominate stars. These assumptions are based on observations, as noted above, and should be quantified further as part of a more complete theory.
The left-hand plot is the radial profile of the SFR. We assume four cases for illustration, , and in pc-2 for pc and pc-2 for pc as in a thin nuclear disk. The radial profiles are double exponential because the flare in the outer part decreases the dynamical rate with radius more rapidly than in the inner part. The middle panel shows the Kennicutt relation with total gas surface density on the abscissa. All cases with the same converge to the same relation so the curves lie on top of each other. The slope is 1.5 in the inner region and 2 in the outer region. The right-hand panel shows the molecular law. In the inner regions (the “starburst region”) the slope is 1.5 because most of the ISM is molecular. At intermediate and large radii the slope is unity because the CO gas has a spatially varying mass fraction that is directly proportional to the ambient dynamical rate. Also in the right-hand plot are dashed lines that show the total gas repeated from the middle panel. The horizontal distance between the solid and dashed lines is the molecular fraction. These theoretical relationships reproduce the basic observations without requiring that star formation follows molecule formation or that star-forming clouds are standardized.
5 Implications and Conclusions
We have shown that a model in which all ISM structures continuously evolve on a dynamical time with star formation following dynamical contraction and cloud dispersal following star formation reproduces the superlinear relation between and total gas surface density, , with a slope of . It also reproduces the steeper relation in the far outer parts of spiral galaxies and in dwarf irregular galaxies where the disks flare. At the same time, it reproduces the linear relation between the areal SFR and CO surface density in the main disks of spirals because of a varying molecular mass fraction. These observed relations have been obtained without assuming that molecular clouds are standardized or have constant SFRs per unit mass, or that molecular clouds have a universal threshold column density for star formation. Such standardization may apply locally, but it seems unlikely over large regions of a galaxy disk given the enormous pressure range.
Because of this intrinsic dependence of the SFR per unit gas mass on the gas density, the dynamical model predicts that the consumption time of total gas varies inversely with the square root of density, i.e., with and over regions of galaxies where the scale height is about constant. Similarly, the local consumption time varies as and in gas-dominated regions. As a result of these inverse variations, the inner parts of galaxies should be exhausted of gas first, quenching their star formation if cosmic accretion of fresh gas cannot readily get to the inner regions in present-day galaxies. For the same reasons involving density, star formation in starbursts, mergers, and ULIRGs should end much more rapidly than in the main disks of normal galaxies. We also obtain a consumption time of Gyr seen by Bigiel et al. (2010) and Elmegreen & Hunter (2015) in far-outer disks and dIrrs without requiring any special assumptions about molecule formation or stabilization.
The similarity in the KS relation between local galaxies and the star forming population at intermediate redshifts, , is the result of a similar average gas density in this interpretation. While the SFRs and column densities of high- galaxies can be times higher than in local galaxies, the thicknesses of high- disks are higher too, as they are forming the thick-disk components of modern galaxies (Elmegreen & Elmegreen, 2006; Bournaud, Elmegreen & Martig, 2009; Comerón et al., 2014). This constancy of is a sensible result if the Toomre parameter is regulated by disk instabilities because then for a given galaxy type, i.e., a given mass, size, and therefore average epicyclic frequency , we have , which gives a disk thickness , and therefore a density constant. The ULIRG track in the KS relation is also the same at high and low redshift (Tacconi et al., 2013; Sargent et al., 2014; Silverman et al., 2015; Béthermin et al., 2015) because in both cases it follows from the elevated average density that results from disk-disk collisions and tidally-driven gas inflows (Teyssier et al., 2010).
The presence of a change in the slope of the KS relation at pc-2 (Bigiel et al., 2008; Leroy et al., 2008) is usually attributed to a sudden change in the molecular fraction because individual molecular clouds lose their self-shielding at about this column density (Krumholz et al., 2009b). While this molecular transition is approximately true, there is another interpretation in the dynamical model where the slope change results from the disk flare. In this interpretation, the flare begins when the stellar surface density drops to less than the gas surface density and the gas velocity dispersion stops decreasing significantly with radius. Using either equations (4) or (8) for pc-2, we derive Myr-1 pc-2 at this position. Thus, in a Hubble time of Myr, the stellar surface density also reaches pc-2. We note that for both outer spiral disks or dIrr galaxies, there is no sudden drop off in the SFR below this , as would be expected if molecular clouds suddenly lost their shielding ability (Elmegreen & Hunter, 2015). Shielding is important from an observational point of view, however, as the transition from molecular-dominant to atomic-dominant gas should still occur at a value of that scales inversely with the metallicity (Krumholz et al., 2009b). The only point here is that in the dynamical model, this molecular transition does not corresponds to a qualitative change in star formation.
The dynamical model has several predictions. First, the consumption time that is derived for each different molecular transition should scale approximately with the dynamical time at the excitation density of the molecule. The scaling should not be exactly linear because the efficiency factor, , should also change for different molecules if we include additional effects such as depletion of the molecule onto grains or a change in the gas substructure as the thermal scale for turbulence is approached. A second prediction is that a column density threshold for star formation that may appear in certain molecular transitions should increase approximately as the square root of the ambient pressure. This is because clouds with high ratios of boundary pressure to squared-column density are more stable against gravitational collapse than clouds with low ratios.
I am grateful to M. Rafelski for pointing out the similarity in the KS relations for dIrrs and outer spiral disks and to D.A. Hunter and P. Padoan for discussions.
References
- Barnes et al. (2012) Barnes, K. L., van Zee, L., Côté, S., & Schade, D. 2012, ApJ, 757, 64
- Béthermin et al. (2015) Béthermin, M., Daddi, E., Magdis, G., et al. 2015, A&A, 573, A113
- Bigiel et al. (2008) Bigiel, F., Leroy, A., Walter, F., Brinks, E., de Blok, W. J. G., Madore, B., & Thornley, M. D. 2008, AJ, 136, 2846
- Bigiel et al. (2010) Bigiel, F., Leroy, A., Walter, F., Blitz, L., Brinks, E., de Blok, W.J.G., Madore, B. 2010, AJ, 140, 1194
- Bigiel et al. (2011) Bigiel F. et al., 2011, ApJ, 730, L13
- Bonnell et al. (2013) Bonnell, I.A., Dobbs, C.L., & Smith, R.J. 2013, MNRAS, 430, 1790
- Bournaud, Elmegreen & Martig (2009) Bournaud, F., Elmegreen, B.G., & Martig, M. 2009, ApJ, 707, L1
- Bournaud et al. (2010) Bournaud, F., Elmegreen, B.G., Teyssier, R., Block, D.L., & Puerari, I. 2010, MNRAS, 409, 1088
- Comerón et al. (2014) Comerón, S., Elmegreen, B.G., Salo, H., Laurikainen, E., Holwerda, B.W., Knapen, J.H. 2014, A&A, 571, 58
- Dib (2011) Dib, S. 2011, ApJ, 737, L20
- Elmegreen (2000) Elmegreen, B.G. 2000, ApJ, 530, 277
- Elmegreen (2002) Elmegreen, B.G. 2002, ApJ, 577, 206
- Elmegreen (2008) Elmegreen, B.G. 2008, ApJ, 672, 1006
- Elmegreen & Elmegreen (2006) Elmegreen, B.G. & Elmegreen, D.M. 2006, ApJ, 650, 644
- Elmegreen & Hunter (2015) Elmegreen, B.G., & Hunter, D.A. 2015, ApJ, 805, 145
- Evans et al. (2014) Evans, N.J., II., Heiderman, A., & Vutisalchavakul, N. 2014, ApJ, 782, 114
- Federrath & Klessen (2012) Federrath, C., & Klessen, R.S. 2012, ApJ, 761, 156
- Gao & Solomon (2004) Gao, Y., & Solomon, P.M. 2004, ApJS, 152, 63
- Genzel et al. (2014) Genzel, R., Förster Schreiber, N. M., Lang, P., et al. 2014, ApJ, 785, 75
- Gnedin et al. (2014) Gnedin, N.Y., Tasker, E.J., & Fujimoto, Y. 2014, ApJL, 787, L7
- Hennebelle & Iffrig (2014) Hennebelle, P., & Iffrig, O. 2014, A&A, 570, A81
- Heyer & Dame (2015) Heyer, M., & Dame, T.M. 2015, ARA&A, 53, 583
- Hopkins et al. (2014) Hopkins, P.F., Keres, D., Oñorbe, J., Faucher-Giguère, C.-A., Quataert, E., Murray, N., & Bullock, J.S. 2014, MNRAS, 445, 581
- Hu et al. (2015) Hu, C.-Y., Naab, T., Walch, S., Glover, S.C.O., Clark, P. C. 2015, arXiv151005644
- Kalberla & Kerp (2009) Kalberla, P.M.W. & Kerp, J. 2009, ARA&A, 47, 27
- Katz (1992) Katz, N. 1992 1992, ApJ, 391, 502
- Kennicutt (1998) Kennicutt, R.C., Jr. 1998, ApJ, 498, 541
- Kennicutt & Evans (2012) Kennicutt R. C., & Evans N. J., 2012, ARA&A, 50, 531
- Kim et al. (2013) Kim, C.-G., Ostriker, E.C., & Kim, W.-T. 2013, ApJ, 776, 1
- Kim & Ostriker (2015) Kim, C.-G., & Ostriker, E.C. 2015, arXiv 1511.00010
- Krumholz & McKee (2005) Krumholz, M. R., & McKee, C. F. 2005, ApJ, 630, 250
- Krumholz & Tan (2007) Krumholz, M. R., & Tan, J. C. 2007, ApJ, 654, 304
- Krumholz & Thompson (2007) Krumholz, M. R., & Thompson, T. A. 2007, ApJ, 669, 289
- Krumholz et al. (2009a) Krumholz, M. R., McKee, C. F., & Tumlinson, J. 2009, ApJ, 699, 850
- Krumholz et al. (2009b) Krumholz, M.R., McKee, C.F., & Tumlinson, J. 2009, ApJ, 693, 216
- Krumholz et al. (2012) Krumholz, M.R., Dekel, A., & McKee, C.F. 2012, ApJ, 745, 69
- Krumholz (2013) Krumholz, M.R. 2013, MNRAS, 436, 2747
- Lada et al. (2010) Lada, C.J., Lombardi, M., & Alves, J.F. 2010, ApJ, 724, 687
- Larson (1969) Larson, R.B. 1969, MNRAS, 145, 405
- Leroy et al. (2008) Leroy, A.K., Walter, F., Brinks, E., Bigiel, F., de Blok, W. J. G., Madore, B., & Thornley, M. D. 2008, AJ, 136, 2782
- Li et al. (2005) Li, Y., Mac Low, M.-M., & Klessen, R.S. 2005, ApJ, 620, L19
- Lombardi et al. (2015) Lombardi, M., Alves, J., & Lada, C.J. 2015, A&A, 576, L1
- Madore (1977) Madore, B. F. 1977, MNRAS, 178, 1
- Madore (2010) Madore, B.F. 2010, ApJ, 716, L131
- Murante et al. (2015) Murante, G., Monaco, P., Borgani, S., Tornatore, L., Dolag, K., Goz, D. 2015, MNRAS, 447, 178
- Narayanan et al. (2008) Narayanan, D., Cox, T. J., Shirley, Y., et al. 2008, ApJ, 684, 996
- Ostriker et al. (2010) Ostriker, E.C., McKee, C.F., Leroy, A.K. 2010, ApJ, 721, 975
- Padoan et al. (2012) Padoan, P., Haugbolle, T., Nordlund, Å., 2012, ApJ, 759, L27
- Padoan et al. (2014) Padoan, P., Federrath, C., Chabrier, G., Evans, N.J.,II, Johnstone, D., Jorgensen, J. K., McKee, C. F., Nordlund, Å. 2014, in Protostars and Planets VI, H. Beuther, R.S. Klessen, C.P. Dullemond, and T. Henning (eds.), Univ. Arizona Press, Tucson, p.77
- Renaud et al. (2012) Renaud, F., Kraljic, K., & Bournaud, F. 2012, ApJ, 760, L16
- Roychowdhury et al. (2015) Roychowdhury, S., Huang, M.-L., Kauffmann, G., Wang, J., Chengalur, J.N. 2015, MNRAS, 449, 3700
- Sargent et al. (2014) Sargent, M. T., Daddi, E., B thermin, M., et al. 2014, ApJ, 793, 19
- Schruba et al. (2011) Schruba, A., Leroy, A. K., Walter, F., et al. 2011, AJ, 142, 37
- Silk (1987) Silk, J. 1987, IAUS, 115, 663
- Silverman et al. (2015) Silverman, J. D., Daddi, E., Rodighiero, G., et al. 2015, ApJ, 812, L23
- Tacconi et al. (2013) Tacconi, L. J., Neri, R., Genzel, R. et al. 2013, ApJ, 768, 74
- Teyssier et al. (2010) Teyssier, R., Chapon, D., & Bournaud, F. 2010, ApJ, 720, L149
- Wu et al. (2005) Wu, J., Evans, N.J., II., Gao, Y., Solomon, P.M., Shirley, Y.L., & Vanden Bout, P.A. 2005, ApJ, 635, L173