Modeling the Multiple Myeloma Vicious Cycle: Signaling Across the Bone Marrow Microenvironment
Abstract
Multiple myeloma is a plasma cell cancer that leads to a dysregulated bone remodeling process. We present a partial differential equation model describing the dynamics of bone remodeling with the presence of myeloma tumor cells. The model explicitly takes into account the roles of osteoclasts, osteoblasts, precursor cells, stromal cells, osteocytes, and tumor cells. Previous models based on ordinary differential equations make the simplifying assumption that the bone and tumor cells are adjacent to each other. However, in actuality, these cell populations are separated by the bone marrow. Our model takes this separation into account by including the diffusion of chemical factors across the marrow, which can be viewed as communication between the tumor and bone. Additionally, this model incorporates the growth of the tumor and the diminishing bone mass by utilizing a “moving boundary.” We present numerical simulations that qualitatively validate our model’s description of the cell population dynamics.
1 Introduction
Multiple myeloma is a plasma cell cancer characterized by an excess of malignant plasma cells in the bone marrow. The disease has a significant impact on the bones, the immune system, and the kidneys (American Cancer Society 2015). In the bone, patients experience pain, hypercalcemia, fractures, and spinal cord compression (Drake 2014). Spinal cord compression can lead to severe back pain, numbness, and muscle weakness. Hypercalcemia, or high levels of calcium in the blood, can result in dehydration, excessive urination, constipation, loss of appetite, weakness, drowsiness, confusion, and even kidney failure or coma. When the kidneys begin to fail and lose the ability to remove waste from the body, symptoms like weakness, shortness of breath, itching, and leg swelling can arise. The American Cancer Society expects that in 2015 the United States will see approximately 26,850 new multiple myeloma diagnoses and 11,240 deaths from the disease. Survival times range from 29 to 62 months once treatment has started (American Cancer Society 2015).
Some risk factors associated with multiple myeloma include age, gender, race, family history, and obesity. There are very few myeloma patients under the age of 35 (less than one percent), and most multiple myeloma patients are 65 years of age or older. Women are less likely to have myeloma than men, and African Americans develop the disease at least twice as often as Caucasian Americans. While the majority of multiple myeloma patients have no family history of the disease, individuals with a sibling or parent who has had multiple myeloma are four times as likely to have the disease. Other risk factors include radiation exposure and solitary plasmacytoma (American Cancer Society 2015).
1.1 Biological Background
Multiple myeloma bone disease disrupts the body’s ability to maintain a healthy skeleton (American Cancer Society 2015). Healthy bone continuously remodels itself in order to repair damaged bone, to adapt to mechanical strains, and to gain access to minerals stored in the bone (Burr 2002; Parfitt 2002). The bone remodeling process involves the removal of old, and perhaps damaged, bone and its replacement with new bone. The primary actors in this process are cells called osteoclasts, osteoblasts, and osteocytes. Together, the osteoclasts (which destroy bone) and osteoblasts (which form new bone) are called the basic multicellular unit, or BMU (Bellido et al 2014).
Osteoclasts are responsible for bone removal (also called osteolysis or bone resorption). They are multinucleated descendants of the hematopoietic monocyte-macrophage lineage. Once the remodeling process has begun, hematopoeitic precursor cells are recruited to the BMU. Once there, the precursor cells differentiate into preosteoclasts. Then, the mononuclear preosteoclasts join to form the multinucleated mature osteoclast. These osteoclast precursor cells are recruited from their myeloid progenitors by macrophage colony-stimulating factor (M-CSF), tumor necrosis factors (TNF), interleukin-6 (IL-6), receptor activator of nuclear factor kappa-B ligand (RANKL), growth factors (GFs), and Activin A. Then mature osteoclast recruitment from the preosteoclast population is regulated by osteocyte-secreted RANKL and osteoblast secreted osteoprotegerin (OPG). Once bone resorption is complete, osteoclasts undergo apoptosis. While the factors that stimulate apoptosis have not yet been completely determined, in vitro experiments have shown that high calcium levels lead to osteoclast apoptosis (Bellido et al 2014).
Osteoblasts are responsible for the creation of new bone; they carry out bone matrix protein secretion and bone mineralization. Osteoblasts are the descendants of mesenchymal stem cells and are characterized by a cuboidal shape and a large nucleus located at the edge of the cell (Bellido et al 2014). As with osteoclasts, osteoblast formation is regulated by chemical factors. Osteoclast-derived coupling factors recruit osteoblast precursors from a pool of mesenchymal stem cells. Then the formation of mature osteoblasts is promoted by insulin-like growth factor (IGF), transforming growth factor- (TGF), and bone morphogenetic proteins (BMPs) secreted by osteoclasts (Parfitt 1994; Bonewald and Dallas 1994; Plotkin and Bivi 2014). Once new bone has been formed, of osteoblasts undergo apoptosis. Some of the remaining osteoblasts flatten and become lining cells. The rest become osteocytes (Bellido et al 2014; Bonewald 2011).
Approximately 5%-20% of osteoblasts become trapped in the bone and differentiate into osteocytes. They are regularly dispersed throughout the mineralized bone and account for over 90% of the cells in the bone matrix and on the surface of the bone (Bellido et al 2014; Bonewald 2011). Osteocytes are located in lacunae and are connected by a network of dendritic processes, which are found in the canaliculi in the bone matrix. The proteins produced by osteocytes are transported through this network of lacunae and canaliculi. Thus, osteocytes can influence other cells within the bone matrix and on the surface of the bone (Buenzli 2015).
Recent studies have also shown that osteocytes play a key role in the regulation of osteoclasts and osteoblasts (Bonewald 2011). They are able to identify damaged bone and induce osteoclastogenesis with RANKL (Bellido et al 2014; Bonewald 2011). This happens in two ways. First, osteocytes going through apoptosis cause oseoblasts and stromal cells to produce RANKL, thereby stimulating osteoclast recruitment. Second, osteocytes can secrete RANKL themselves (Bellido et al 2014). Osteocytes also produce and secrete sclerostin, which inhibits osteoblast recruitment by blocking the Wnt signaling pathway (Bonewald 2011; Neve et al 2012; Kular et al 2012).
In healthy bone, the destruction of bone by osteoclasts is matched by the replacement of bone by osteoblasts so that bone mass is returned to its original state. However, in multiple myeloma patients, the bone remodeling process is out of balance. In this unhealthy bone, bone destruction outpaces bone replacement, leaving patients with bone lesions. These lesions are quite common in multiple myeloma patients; over ninety percent of patients suffer from them. They occur most often in the spine, skull, pelvis, and ribs. Bone lesions lead to pathologic fractures, bone pain, hypercalcemia, and spinal cord compression (Drake 2014). Even in complete remission, multiple myeloma patients usually do not show reduction of skeletal lesions (Wahlin et al 2009).
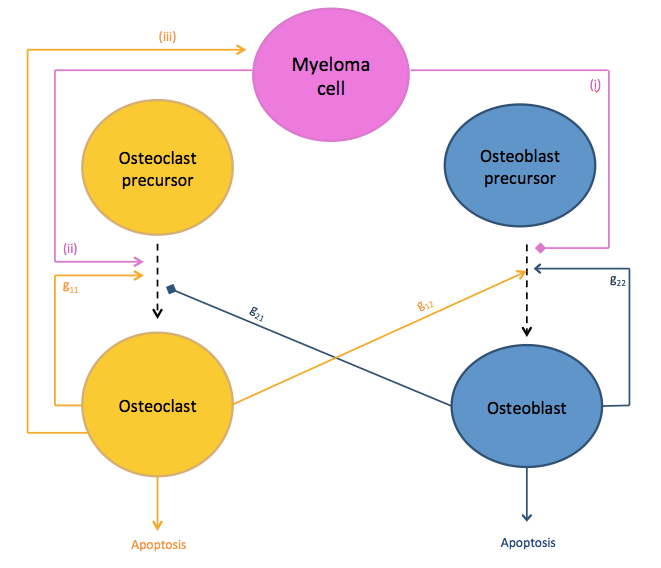
Multiple myeloma leads to bone lesions because myeloma tumor cells cause increased osteoclast production, increased osteoclast activity levels, and decreased osteoblast production (Mundy et al 1974; Bataille et al 1991; Valentin-Opran et al 1982; Evans et al 1989; Bataille et al 1990). This causes increased bone resorption, which in turn encourages tumor growth. This is called the multiple myeloma “vicious cycle” (Abe et al 2004). This cycle is summarized in Figure 3. The details are shown more explicitly in Figure 10.
Myeloma tumor cells encourage this vicious cycle through several chemical factors. Several of these factors encourage osteoclast production. Through adhesion betweeen vascular cell adhesion protein 1 (VCAM-1) located on the stromal cells and very late antigen-4 (VLA4) located on the tumor cells, myeloma cells stimulate stromal RANKL production. This, in turn, simulates osteoclast formation (Michigami et al 2000; Mori et al 2004). Myeloma cells further encourage osteoclast recruitment through the production of macrophage inflammatory protein-1 (MIP-1), tumor necrosis factor- (TNF-, and interleukin-3 (IL-3) (Silbermann and Roodman 2013). Myeloma also causes osteocytes to secrete additional interleukin-11 (IL-11), stimulating osteoclastogenesis (Giuliani et al 2012).
Myeloma cells also suppress the recruitment of osteoblasts. Some chemical factors secreted by myeloma tumor cells that decrease osteoblast production are Dickkopf-related protein 1 (DKK1), IL-3, sclerostin, and secreted frizzled-related proteins (sFRPs) (Drake 2014; Tian et al 2003; Ehrlich and Roodman 2005; Colucci et al 2011; Oshima et al 2005). Additionally, tumor cells increase stromal cell production of Activin A, leading to further decreased osteoblast production (Vallet et al 2010).
The other half of the multiple myeloma “vicious cycle” is the promotion of tumor growth by osteoclast signaling. Osteoclasts secrete B-cell activating factor (BAFF) and a proliferation-inducing ligand (APRIL), which lead to increased tumor growth (Abe et al 2006).
1.2 Mathematical Background
Power law approximations are a method of representing biological systems pioneered by Savageau for biochemical systems (Savageau 1969a, b, 1970, 1976; Voit 2000). They are equations of the form
where the are the populations present in the biological system and the and are parameters that control the growth and decay of the populations. By expressing the power law instead as
we separate the equation into two parts: one that promotes growth of the population and another that contributes to decay. Each part of the equation is the product of a constant ( or ) and the cell populations that contribute to the growth or decay raised to powers ( or ).
This method is used by Komarova et al (2003); Ryser et al (2009, 2010); Ayati et al (2010); Graham et al (2013), and it is used in the model we present here.
We choose the more qualitatative or phenomenological power law approach over mechanistic models with explicit biochemistry (Wang et al 2011; Eudy et al 2015; Ji et al 2015) for a number of reasons: the models are much simpler mathematically; eventually they will be easier to parameterize from patient data; and the fundamental relationships involved are more robust to changes in the understanding of the underlying biochemistry. This last point is critical. A high fidelity mechanistic model, where the parameters are mostly estimated, would indeed provide valuable and quantitatively precise information about the underlying rate constants. However, if the mechanistic model is based on assumptions that later turn out to be false, whatever claims that are made about the underlying rate constants will also turn out to be false. We are operating under the assumption that the current consensus on the mechanisms underlying multiple myeloma bone disease are subject to change.
The model in this paper advances prior work in two main ways. First, we add a number of additional components we anticipate are necessary if a model is to be able to be used to predict patient outcomes (compare Fig. 10 with Figs. 1, 3, 6). Second, we have a spatial model that includes cytokine diffusion and and explicit presence of the tumor; the model presented by Graham et al (2012) used an implicit tumor not located in any particular part of space. Other models based on ordinary differential equations have no spatial heterogeneity (Ryser et al 2009, 2010; Wang et al 2011; Eudy et al 2015; Ji et al 2015).
2 Zero-Dimensional Models
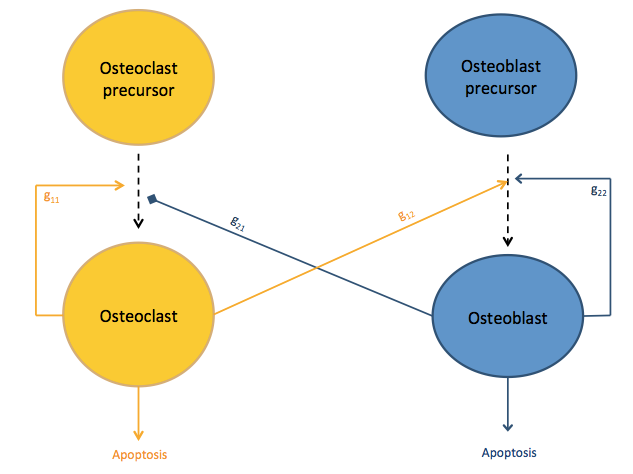
Komarova et al (2003) used Savageau’s power law approximations to describe the dynamics of osteoclasts and osteoblasts during a healthy bone remodeling event (without the presence of multiple myeloma tumor cells). This model takes into account the autocrine and paracrine factors that contribute to the growth and decay of these two cell populations. The model, based on the cell dynamics described in Figure 1, is
| (1) | ||||
| (2) | ||||
| (3) |
where is the density of osteoclasts, is the density of osteoblasts, and is the total bone mass. and represent the steady states for osteoclasts and osteoblasts, respectively. The steady state is given by
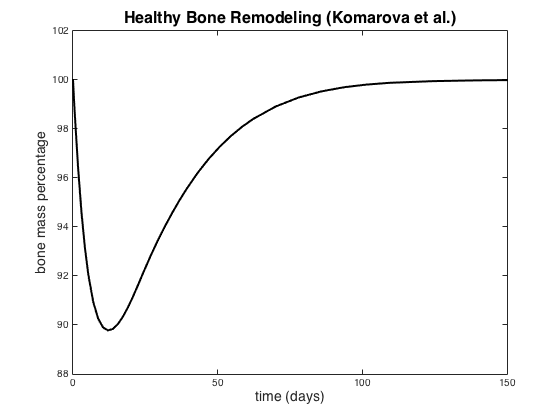
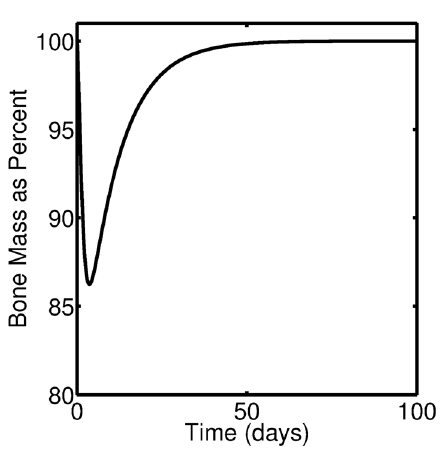
where . Figure 2 shows the total bone mass (as a percentage) during a simulation of a bone remodeling event initiated by an increase in osteoclasts.
Ayati et al (2010) expanded on Komarova et al.’s model by including the presence of a multiple myeloma tumor. The new variables in this model are (the density of the tumor cells), (the maximum tumor size), and (the tumor growth constant). The equations are
| (4) | ||||
| (5) | ||||
| (6) | ||||
| (7) |
The parameters and are all nonnegative. Thus, the addition of the tumor to this model increases osteoclast production and decreases osteoblast production. The steady state solution of this model is
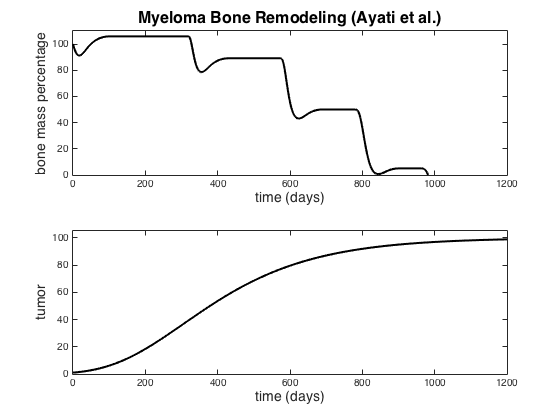
where Computational results for this model are shown in Figure 4. These results show increasing tumor size accompanied by increased osteoclast activity (bone removal) and decreased osteoblast activity (bone replacement).
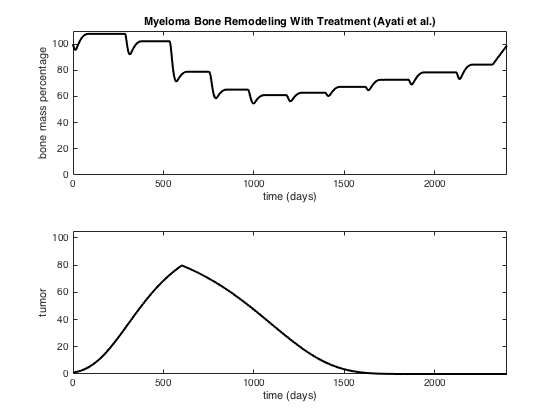
Ayati et al (2010) also introduce a model that includes treatment functions. These treatment functions, and , model the effects of proteasome inhibitors. Proteasome inhibitors promote osteoblast production and inhibit tumor growth, thereby breaking the multiple myeloma “vicious cycle.” The treatment model is
| (8) | ||||
| (9) | ||||
| (10) | ||||
| (11) |
The treatment functions used in this model are given by
Figure 5 shows computational results for this model. These results are similar to Figure 4 until , when the treatment is introduced. At this time, the tumor density begins to shrink. At the same time, the number of osteoclasts decreases and the number of osteoblasts increases. This leads to recovery of lost bone mass.
3 Incorporating Osteocytes
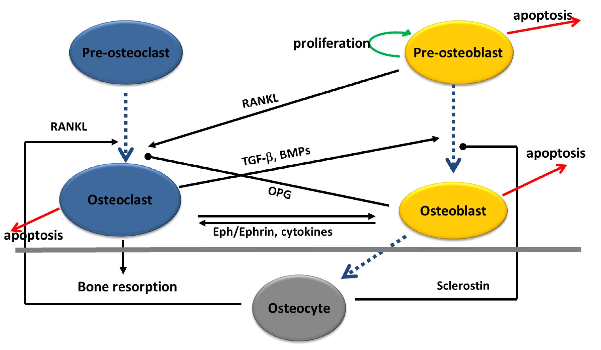
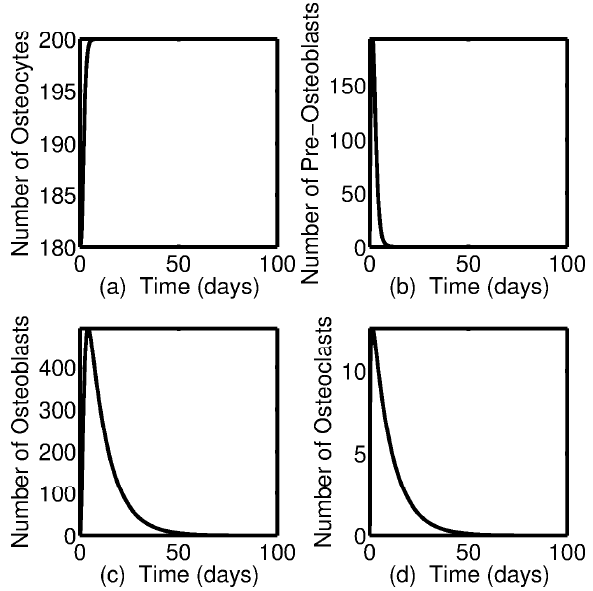
Graham et al (2013) present a mathematical model of healthy bone remodeling that incorporates two additional cell populations: osteocytes () and osteoblast precursors (). The biological details of this model are summarized in Figure 6. The equations for this model are
| (12) | ||||
| (13) | ||||
| (14) | ||||
| (15) | ||||
| (16) |
where .
In this model, represents the relationship between osteocyte apoptosis and the decrease in sclerotin inhibition. The term represents the effects of sclerotin and the Wnt/-catenin pathway. That is, when the number of osteocytes reaches , the sclerotin level is sufficient to block Wnt signaling. This model assumes that osteocyte death is primarily governed by the initiation of the remodeling process. Thus, no osteocyte apoptosis term is included.
4 One-Dimensional Bone Remodeling with Multiple Myeloma
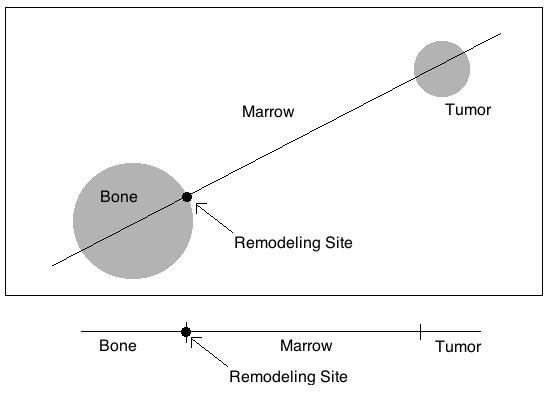
Here we present a one-dimensional model of bone remodeling with the presence of multiple myeloma tumor cells. Figure 9 is a simplified two-dimensional representation of a cross section of a bone marrow biopsy core. A section of bone and a myeloma tumor lay within the marrow. Additionally, a remodeling site is located on the edge of the bone. For our model we consider a one-dimensional representation of this spatial environment, also shown in Figure 9.
This model builds upon the model presented in Graham et al (2013) by including additional cell populations, specifically osteoclast precursors (), stromal cells (), and myeloma tumor cells (). The interactions of the various cell populations included in this model are detailed in Figure 10. This model also incorporates the effects of chemical factors that diffuse across the marrow during the remodeling process:
-
•
: BAFF and APRIL, diffusing from the osteoclasts to the tumor cells
-
•
: MIP-1, IL-3, and TNF, diffusing from the tumor cells to the osteoclasts
-
•
: DKK1, IL-3, sclerostin, and sFRPs, diffusing from the tumor cells to the osteoblasts
-
•
: IL-6, RANKL, GFs, and Activin A, diffusing from the stromal cells to the osteoclasts
-
•
: Activin A, diffusing from the stromal cells to the osteoblasts
Additionally, the model includes a “moving boundary.” That is, the positions of the left and right endpoints of the marrow ( and , respectively) are governed by the change in the bone mass and tumor density, respectively. The equations for this model are
| (17) | ||||
| (18) | ||||
| (19) | ||||
| (20) | ||||
| (21) | ||||
| (22) | ||||
| (23) |
| (24) | ||||
| (25) | ||||
| (26) | ||||
| (27) | ||||
| (28) | ||||
| (29) | ||||
| (30) | ||||
| (31) |
where The boxed numbers correspond with the cell signaling represented in Figure 10.
Equation 17 describes the dynamics of the stromal cell population. The stromal cells (the connective tissue cells of the bone marrow) are recruited by tumor cell signaling 1 at a rate . Stromal cell apoptosis 2 occurs at a rate .
Equation 18 describes the dynamics of the tumor cell population. Myeloma tumor cells are recruited by stromal cell signaling 3 at the right endpoint of the marrow. This recruitment occurs at a rate . Tumor cells are also recruited by osteoclast signaling of BAFF and APRIL 4 as a part of the multiple myeloma “vicious cycle.” This recruitment occurs at a rate and is due to the amount go these ligands present at the right endpoint of the marrow. Finally, tumor cell apoptosis 5 occurs at a rate .
The dynamics of the osteoclast precursor cells are described in equation 19. This equation states that osteoclast precursors descend from a pool of myeloid progenitors 6 at a rate . This differentiation is largely influenced by stromal cell signaling at the left boundary point of the marrow. Additionally, this equation states that osteoclast precursors differentiate into osteoclasts by the RANK/RANKL/OPG pathway 7-9 at a rate . Finally, we have osteoclast precursor death 10 at a rate .
Equation 20 describes the dynamics of the osteoclast population. This equation states the osteoclasts differentiate from the pool of osteoclast precursors by the RANK/RANKL/OPG pathway 7-9 at a rate . Additionally, osteoclasts undergo apoptosis 11 at a rate .
Equation 21 describes the dynamic of the osteoblast precursor population. Osteoblast precursors differentiate from a pool of mesenchymal stem cells due to osteoclast 12 and bone matrix 13 signaling. Osteoblast precursors are recruited by osteoclasts at a rate and by IGF-1 (secreted by the bone matrix) at a rate . Additionally, osteoblast precursors differentiate into mature osteoblasts 14-17 at a rate . Finally, osteoblast precursors undergo apoptosis 18 at a rate .
The dynamics of mature osteoblasts are described by Equation 22. This equation states that osteoblast precursors are differentiated into osteoblasts 14-17 at a rate . Additionally, under this model, mature osteoblasts have one of two fates: differentiation into osteocytes 19 or cell death 20. Osteoblasts differentiate into osteocytes at a rate and undergo apoptosis at a rate .
Equation 23 describes the dynamics of the osteocyte population. This equation states that osteocytes differentiate from the pool of osteoblasts 19 at a rate . These cells undergo apoptosis 21 at a rate .
Equations 24-28 describe the diffusion of chemical factors across the bone marrow. Each of these equations is a diffusion equation of the form , where is the Laplace operator.
Equation 29 gives the rate of change of the bone mass. This equation states that bone resorption is proportional to the number of osteoclasts (with proportionality constant ). Similarly, bone formation is proportional to the number of osteoblasts (with proportionality constant ).
5 Results
Equations 17 - 31 were solved using MATLAB’s pdepe function CITE with the parameter and initial condition values listed in Table 4. The diffusion values () were computed based on the relationship between the size of the peptides (Stokes radius) and the known diffusion values:
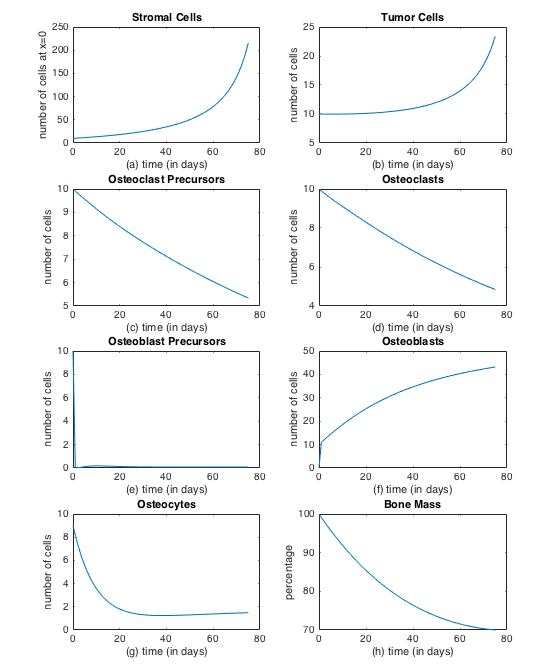
The computed values for each ligand are given in Table Modeling the Multiple Myeloma Vicious Cycle: Signaling Across the Bone Marrow Microenvironment The simulation represents a myeloma-dysregulated bone remodeling event taking place over 75 days. The results are shown in Figures 11, 12, and 13.
Figure 11 gives the bone cell counts and bone mass percentage for the simulated bone remodeling event. Figure 11(a) shows the dynamics of the stromal cell population at position . The dynamics of this population at all other positions are similar to those shown in Figure 11(a). Throughout the remodeling event, we see an increase in the number of stromal cells. figure 11(b) shows the dynamics of the multiple myeloma tumor cell population. For the first fifty days of the bone remodeling event, there is no significant change in the number of tumor cells. However, in the last twenty-five days of the event we see an increase in the tumor cell population due to the multiple myeloma “vicious cycle.” Figures 11(c) and 11(d) show the dynamics of the osteoclast precursor and mature osteoclast cell populations. Both populations decrease as the remodeling event continues. Figures 11(e) and 11(f) show the dynamics of the osteoblast precursor and mature osteoblast cell populations. The osteoblast precursor population decreases in size quickly as osteoblast precursors are recruited to the mature osteoblast population. Figure 11(g) shows the dynamics of the osteocyte population. There is an initial decrease in the number of osteocytes due to the initiation of the bone remodeling event. However, as the event continues, the number of osteocytes begins to increase due to the creation of new bone. Figure 11(h) shows the percentage of bone mass throughout the bone remodeling event. As the remodeling event progresses and the tumor cell population grows, the bone mass percentage decreases.
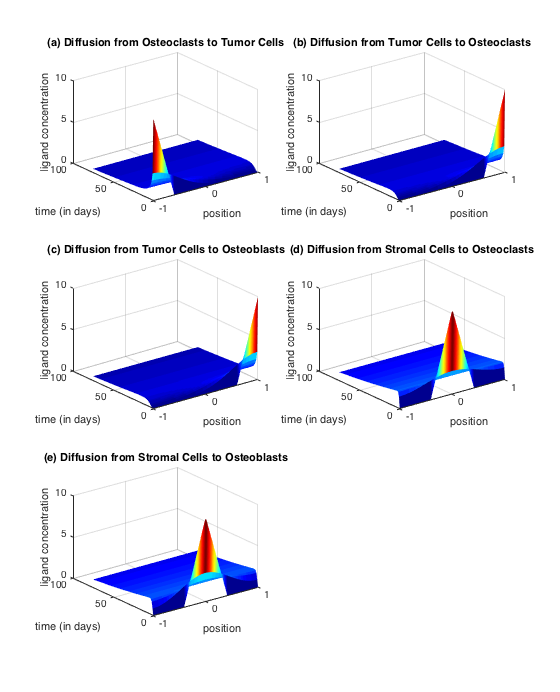
Figure 12 shows the diffusion of ligands across the marrow. Figure 12(a) shows the diffusion of BAFF and APRIL from the osteoclasts to the tumor cells. Figure 12(b) shows the diffusion of MIP-1, IL-3, and TNF from the tumor cells to the osteoclasts. Figure 12(c) shows the diffusion of DKK1, IL-3, sclerotin, and sFRPs from the tumor cells to the osteoblasts. Figure 12(d) shows the diffusion of IL-6, RANKL, GFs, and Activin A from the stromal cells to the osteoclasts. Figure 12(e) shows the diffusion of Activin A from the stromal cells to the osteoblasts.
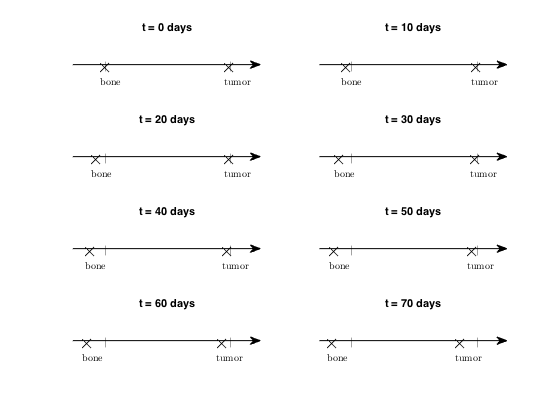
Figure 13 shows the movement of the bone/marrow interface and the marrow/tumor interface. At time , the bone/marrow interface is at and the marrow/tumor interface is at . As time progresses, the bone recedes and the tumor grows. At time , the bone/marrow interface is at and the marrow/tumor interface is at .
Acknowledgements
We thank Dr. James Martin for calculating the diffusion values in Table Modeling the Multiple Myeloma Vicious Cycle: Signaling Across the Bone Marrow Microenvironment.
References
- Abe et al (2004) Abe M, Hiura K, Wilde J, Shioyasono A, Moriyama K, Hashimoto T, Kido S, Oshima T, Shibata H, Ozaki S, Inoue D, Matsumoto T (2004) Osteoclasts enhance myeloma cell growth and survival via cell-cell contact: a vicious cycle between bone destruction and myeloma expansion. Blood 104(8):2484–91, DOI 10.1182/blood-2003-11-3839, URL http://www.ncbi.nlm.nih.gov/pubmed/15187021
- Abe et al (2006) Abe M, Kido S, Hiasa M, Nakano A, Oda A, Amou H, Matsumoto T (2006) BAFF and APRIL as osteoclast-derived survival factors for myeloma cells: a rationale for TACI-Fc treatment in patients with multiple myeloma. Leukemia 20(7):1313–5, DOI 10.1038/sj.leu.2404228, URL http://www.nature.com.proxy.lib.uiowa.edu/leu/journal/v20/n7/full/2404228a.html
- American Cancer Society (2015) American Cancer Society (2015) Multiple Myeloma. http://www.cancer.org/cancer/multiplemyeloma/index, URL http://www.cancer.org/cancer/multiplemyeloma/index
- Ayati et al (2010) Ayati BP, Edwards CM, Webb GF, Wikswo JP (2010) A mathematical model of bone remodeling dynamics for normal bone cell populations and myeloma bone disease. Biology direct 5(1):28, DOI 10.1186/1745-6150-5-28, URL http://www.biology-direct.com/content/5/1/28
- Bataille et al (1990) Bataille R, Delmas PD, Chappard D, Sany J (1990) Abnormal serum bone Gla protein levels in multiple myeloma. Crucial role of bone formation and prognostic implications. Cancer 66(1):167–72, URL http://www.ncbi.nlm.nih.gov/pubmed/2354403
- Bataille et al (1991) Bataille R, Chappard D, Marcelli C, Dessauw P, Baldet P, Sany J, Alexandre C (1991) Recruitment of New Osteoblasts and Osteoclasts Is the Earliest Critical Event in the Pathogenesis of Human Multiple Myeloma. Journal of Clinical Investigation 88(19):62–66, DOI 10.1172/JCI115305
- Bellido et al (2014) Bellido T, Plotkin LI, Bruzzaniti A (2014) Bone Cells. In: Burr DB, Allen MR (eds) Basic and Applied Bone Biology, vol 14, Academic Press, chap 2, pp 27–45, DOI 10.1016/B978-0-12-416015-6.00002-2
- Bonewald (2011) Bonewald LF (2011) The amazing osteocyte. Journal of Bone and Mineral Research 26(2):229–238, DOI 10.1002/jbmr.320
- Bonewald and Dallas (1994) Bonewald LF, Dallas SL (1994) Role of Active and latent Transforming Growth Factor in Bone Formation. Journal of Cellular Biochemistry 55:350–357
- Buenzli (2015) Buenzli PR (2015) Osteocytes as a record of bone formation dynamics: A mathematical model of osteocyte generation in bone matrix. Journal of Theoretical Biology 364:418–427, DOI 10.1016/j.jtbi.2014.09.028, URL http://www.scopus.com/inward/record.url?eid=2-s2.0-84910685875&partnerID=40&md5=6ab8e5b855fa2a6cd8459ed392b61b4c
- Burr (2002) Burr DB (2002) Targeted and Nontargeted Remodeling. Bone 30(1):2–4, URL http://www.researchgate.net/profile/David_Burr3/publication/11565284_Targeted_and_nontargeted_remodeling/links/54b573370cf26833efd26c95.pdf
- Colucci et al (2011) Colucci S, Brunetti G, Oranger A, Mori G, Sardone F, Specchia G, Rinaldi E, Curci P, Liso V, Passeri G, Zallone A, Rizzi R, Grano M (2011) Myeloma cells suppress osteoblasts through sclerostin secretion. Blood cancer journal 1(6):e27, DOI 10.1038/bcj.2011.22, URL http://www.pubmedcentral.nih.gov/articlerender.fcgi?artid=3255263&tool=pmcentrez&rendertype=abstract
- Drake (2014) Drake MT (2014) Myeloma Bone Disease. In: Gertz MA, Rajkumar SV (eds) Multiple Myeloma, Springer, chap 17, DOI 10.1007/978-1-4614-8520-9, URL http://link.springer.com/10.1007/978-1-4614-8520-9
- Ehrlich and Roodman (2005) Ehrlich LA, Roodman GD (2005) The role of immune cells and inflammatory cytokines in Paget’s disease and multiple myeloma. Immunological Reviews 208:252–266, DOI IMR323 [pii] 10.1111/j.0105-2896.2005.00323.x
- Eudy et al (2015) Eudy RJ, Gastonguay MR, Baron KT, Riggs M (2015) Connecting the Dots: Linking Osteocyte Activity and Therapeutic Modulation of Sclerostin by Extending a Multiscale Systems Model. CPT: Pharmacometrics & Systems Pharmacology (May), DOI 10.1002/psp4.12013
- Evans et al (1989) Evans CE, Galasko CSB, Ward C (1989) Does Myeloma Secrete and Osteoblast Inhibiting Factor? The Journal of Bone and Joint Surgery 71(2):288–290
- Giuliani et al (2012) Giuliani N, Ferretti M, Bolzoni M, Storti P, Lazzaretti M, Dalla Palma B, Bonomini S, Martella E, Agnelli L, Neri A, Ceccarelli F, Palumbo C (2012) Increased osteocyte death in multiple myeloma patients: role in myeloma-induced osteoclast formation. Leukemia 26(6):1391–401, DOI 10.1038/leu.2011.381, URL http://www.nature.com.proxy.lib.uiowa.edu/leu/journal/v26/n6/full/leu2011381a.html
- Graham et al (2012) Graham JM, Ayati BP, Ramakrishnan PS, Martin JA (2012) Towards a new spatial representation of bone remodeling. Mathematical biosciences and engineering : MBE 9(2):281–95, URL http://www.pubmedcentral.nih.gov/articlerender.fcgi?artid=3708700&tool=pmcentrez&rendertype=abstract
- Graham et al (2013) Graham JM, Ayati BP, Holstein SA, Martin JA (2013) The role of osteocytes in targeted bone remodeling: a mathematical model. PloS one 8(5):e63,884, DOI 10.1371/journal.pone.0063884, URL http://journals.plos.org/plosone/article?id=10.1371/journal.pone.0063884
- Ji et al (2015) Ji B, Genever PG, Fagan MJ (2015) A virtual approach to evaluate therapies for management of multiple myeloma induced bone disease. International Journal for Numerical Methods in Biomedical Engineering e02735:1–18, DOI 10.1002/cnm
- Komarova et al (2003) Komarova SV, Smith RJ, Dixon S, Sims SM, Wahl LM (2003) Mathematical model predicts a critical role for osteoclast autocrine regulation in the control of bone remodeling. Bone 33(2):206–215, DOI 10.1016/S8756-3282(03)00157-1, URL http://www.sciencedirect.com/science/article/pii/S8756328203001571
- Kular et al (2012) Kular J, Tickner J, Chim SM, Xu J (2012) An overview of the regulation of bone remodelling at the cellular level. Clinical biochemistry 45(12):863–73, DOI 10.1016/j.clinbiochem.2012.03.021, URL http://www.sciencedirect.com/science/article/pii/S000991201200149X
- Michigami et al (2000) Michigami T, Shimizu N, Williams PJ, Niewolna M, Dallas SL, Mundy GR, Yoneda T (2000) Cell-cell contact between marrow stromal cells and myeloma cells via VCAM-1 and alpha(4)beta(1)-integrin enhances production of osteoclast-stimulating activity. Blood 96(5):1953–60, URL http://www.bloodjournal.org/content/96/5/1953.abstract
- Mori et al (2004) Mori Y, Shimizu N, Dallas M, Niewolna M, Story B, Williams PJ, Mundy GR, Yoneda T (2004) Anti-alpha4 integrin antibody suppresses the development of multiple myeloma and associated osteoclastic osteolysis. Blood 104(7):2149–54, DOI 10.1182/blood-2004-01-0236, URL http://www.ncbi.nlm.nih.gov/pubmed/15138161
- Mundy et al (1974) Mundy GR, Raisz LG, Cooper RA, Schechter GP, Salmon SE (1974) Evidence for the Secretion of an Osteoclast Stimulating Factor in Myeloma. The New England Journal of Medicine 291(20):1041–1046, URL http://www.nejm.org.proxy.lib.uiowa.edu/doi/full/10.1056/NEJM197411142912001
- Neve et al (2012) Neve A, Corrado A, Cantatore FP (2012) Osteocytes: central conductors of bone biology in normal and pathological conditions. Acta physiologica (Oxford, England) 204(3):317–30, DOI 10.1111/j.1748-1716.2011.02385.x, URL http://www.ncbi.nlm.nih.gov/pubmed/22099166
- Oshima et al (2005) Oshima T, Abe M, Asano J, Hara T, Kitazoe K, Sekimoto E, Tanaka Y, Shibata H, Hashimoto T, Ozaki S, Kido S, Inoue D, Matsumoto T (2005) Myeloma cells suppress bone formation by secreting a soluble Wnt inhibitor, sFRP-2. Blood 106(9):3160–3165, DOI 10.1182/blood-2004-12-4940
- Parfitt (2002) Parfitt A (2002) Targeted and nontargeted bone remodeling: relationship to basic multicellular unit origination and progression. Bone 30(1):5–7, DOI 10.1016/S8756-3282(01)00642-1, URL http://www.sciencedirect.com/science/article/pii/S8756328201006421
- Parfitt (1994) Parfitt AM (1994) Osteonal and hemi-osteonal remodeling: the spatial and temporal framework for signal traffic in adult human bone. Journal of cellular biochemistry 55(3):273–86, DOI 10.1002/jcb.240550303, URL http://www.ncbi.nlm.nih.gov/pubmed/7962158
- Plotkin and Bivi (2014) Plotkin LI, Bivi N (2014) Local Regulation of Bone Cell Function. In: Burr DB, Allen MR (eds) Basic and Applied Bone Biology, Academic Press, chap 3, pp 47–74, DOI 10.1016/B978-0-12-416015-6.00003-4, URL http://dx.doi.org/10.1016/B978-0-12-416015-6.00003-4
- Ryser et al (2009) Ryser MD, Nigam N, Komarova SV (2009) Mathematical Modeling of Spatio-Temporal Dynamics of a Single Bone Multicellular Unit. Journal of Bone and Mineral Research 24(5):860–870, DOI 10.1359/jbmr.081229
- Ryser et al (2010) Ryser MD, Komarova SV, Nigam N (2010) The Cellular Dynamics of Bone Remodeling: A Mathematical Model. SIAM J Appl Math 70(6):1899–1921
- Savageau (1969a) Savageau MA (1969a) Biochemical systems analysis: I. Some mathematical properties of the rate law for the component enzymatic reactions. Journal of Theoretical Biology 25(3):365–369, DOI 10.1016/S0022-5193(69)80026-3, URL http://www.sciencedirect.com/science/article/pii/S0022519369800263
- Savageau (1969b) Savageau MA (1969b) Biochemical systems analysis: II. The steady-state solutions for an n-pool system using a power-law approximation. Journal of Theoretical Biology 25(3):370–379, DOI 10.1016/S0022-5193(69)80027-5, URL http://www.sciencedirect.com/science/article/pii/S0022519369800275
- Savageau (1970) Savageau MA (1970) Biochemical systems analysis: III. Dynamic solutions using a power-law approximation. Journal of Theoretical Biology 26(2):215–226, DOI 10.1016/S0022-5193(70)80013-3, URL http://www.sciencedirect.com/science/article/pii/S0022519370800133
- Savageau (1976) Savageau MA (1976) Biochemical systems analysis A study of function and design in molecular biology. Addison-Wesley, Reading, MA
- Silbermann and Roodman (2013) Silbermann R, Roodman GD (2013) Myeloma bone disease: Pathophysiology and management. Journal of Bone Oncology DOI 10.1016/j.jbo.2013.04.001
- Tian et al (2003) Tian E, Zhan F, Walker R, Rasmussen E, Ma Y, Barlogie B, Shaughnessy JD (2003) The role of the Wnt-signaling antagonist DKK1 in the development of osteolytic lesions in multiple myeloma. The New England journal of medicine 349(26):2483–94, DOI 10.1056/NEJMoa030847, URL http://www.ncbi.nlm.nih.gov/pubmed/14695408
- Valentin-Opran et al (1982) Valentin-Opran A, Charhon SA, Meunier PJ, Edouard CM, Arlot ME (1982) Quantitative histology of myeloma-induced bone changes. British journal of haematology 52(4):601–10, URL http://www.ncbi.nlm.nih.gov/pubmed/7138789
- Vallet et al (2010) Vallet S, Mukherjee S, Vaghela N, Hideshima T, Fulciniti M, Pozzi S, Santo L, Cirstea D, Patel K, Sohani AR, Guimaraes A, Xie W, Chauhan D, Schoonmaker JA, Attar E, Churchill M, Weller E, Munshi N, Seehra JS, Weissleder R, Anderson KC, Scadden DT, Raje N (2010) Activin A promotes multiple myeloma-induced osteolysis and is a promising target for myeloma bone disease. Proceedings of the National Academy of Sciences of the United States of America 107(11):5124–9, DOI 10.1073/pnas.0911929107, URL http://www.pubmedcentral.nih.gov/articlerender.fcgi?artid=2841922&tool=pmcentrez&rendertype=abstract
- Voit (2000) Voit EO (2000) Computational Analysis of Biochemical Systems. Cambridge University Press, Cambridge, UK
- Wahlin et al (2009) Wahlin A, Holm J, Osterman G, Norberg B (2009) Evaluation of Serial Bone X-ray Examination in Multiple Myeloma. Acta Medica Scandinavica 212(6):385–387, DOI 10.1111/j.0954-6820.1982.tb03234.x, URL http://doi.wiley.com/10.1111/j.0954-6820.1982.tb03234.x
- Wang et al (2011) Wang Y, Pivonka P, Buenzli PR, Smith DW, Dunstan CR (2011) Computational modeling of interactions between multiple myeloma and the bone microenvironment. PloS one 6(11):e27,494, DOI 10.1371/journal.pone.0027494, URL http://journals.plos.org/plosone/article?id=10.1371/journal.pone.0027494
| Symbol | Definition |
|---|---|
| Number of osteoclasts at time | |
| Number of osteoblasts at time | |
| Number of osteoclasts in the steady-state | |
| Number of osteoblasts in the steady-state | |
| Percentage of bone mass at time | |
| Number of tumor cells at time | |
| Maximum tumor size | |
| Tumor growth constant | |
| Treatment functions |
| Symbol | Definition |
|---|---|
| Number of osteocytes at time | |
| Number of osteoblast precursors at time | |
| Number of osteoblasts at time | |
| Number of osteoclasts at time | |
| Percentage of bone mass at time | |
| Osteocyte population threshold for sclerostin production |
| Symbol | Definition |
|---|---|
| Number of stromal cells at time | |
| Number of tumor cells at time | |
| Number of osteoclast precursors at time | |
| Number of osteoclasts at time | |
| Number of osteoblast precursors at time | |
| Number of osteoblasts at time | |
| Number of osteocytes at time | |
| BAFF and APRIL, diffusing from the osteoclasts to the tumor cells | |
| MIP-1, IL-3, and TNF, diffusing from the tumor cells to the osteoclasts | |
| DKK1, IL-3, sclerostin, and sFRPs, diffusing from the tumor cells to the osteoblasts | |
| IL-6, RANKL, GFs, and Activin A, diffusing from the stromal cells to the osteoclasts | |
| Activin A, diffusing from the stromal cells to the osteoblasts | |
| Percentage of bone mass at time | |
| Position of the bone/marrow interface at time | |
| Position of the marrow/tumor interface at time | |
| Osteocyte population threshold for sclerostin production |
| Parameter | Value | Parameter | Value |
|---|---|---|---|
| 0.005 | 10 | ||
| 0.0003 | 1 | ||
| 0.0001 | 1 | ||
| 0.01 | 1 | ||
| 0.01 | 1 | ||
| 0.01 | 1 | ||
| 0.01 | 1 | ||
| 0.008 | 1 | ||
| 0.01 | 1 | ||
| 0.01 | 1 | ||
| 0.01 | 1 | ||
| 0.01 | -1 | ||
| 0.1 | 1 | ||
| 0.01 | 1 | ||
| 38.4 | 1 | ||
| 0.00390625 | 1 | ||
| 0.1037 | 1 | ||
| 0.01 | -0.8 | ||
| 0.1210 | -0.8 | ||
| 0.01 | -0.8 | ||
| 0.1037 | -0.8 | ||
| 0.01 | 1 | ||
| 0.1728 | 1 | ||
| 0.01 | 0.5 | ||
| 0.1063 | 0.65 | ||
| 0.01 | 0.01 | ||
| 0.1 | -0.03 | ||
| 0.01 |
| Peptide | ||||
|---|---|---|---|---|
| Molecular | ||||
| Weight | ||||
| (kDa) | ||||
| Diffuusion Coefficient | ||||
| (Literature) | ||||
| (cm2/sec) | ||||
| Stokes | ||||
| Radius | ||||
| (nm) | ||||
| Diffusion Coefficient (Calculated) | ||||
| (cm2/sec) | ||||
| IL-2 | ||||
| IL-3 | ||||
| IL-6 | ||||
| RANKL | ||||
| OPG | ||||
| BAFF | ||||
| APRIL | ||||
| MIP-1 | ||||
| TNF | ||||
| DKK-1 | ||||
| Sclerostin | ||||
| sFRP-1 | ||||
| GFs | ||||
| Activin A | ||||
| Hemoglobin |
