Astrophysical Origins For The Unusual Chemical Abundance Of The Globular Cluster Palomar 1
Abstract
Observed unusual elemental abundances in globular cluster Palomar 1 (Pal 1) could provide important information for us to study the relation between the globular cluster and our Galaxy. In this work, we study the abundances of elements, Fe-peak elements and neutron-capture elements in Pal 1. We found that the abundances of the SNe Ia and main s-process components of Pal 1 are larger than those of the disk stars and the abundances of the primary component of Pal 1 are smaller than those of the disk stars with similar metallicity. The Fe abundances of Pal 1 and the disk stars mainly originate from the SNe Ia and the primary component, respectively. Although the abundances dominantly produced by the primary process for the disk stars and Pal 1, the contributions of the primary component to Pal 1 are smaller than the corresponding contributions to the disk stars. The Fe-peak elements V and Co mainly originate from the primary and secondary components for the disk stars and Pal 1, but the contributions of the massive stars to Pal 1 are lower than those of the massive stars to the disk stars. The Y abundances mainly originate from the weak r-component for the disk stars. However the contributions of the main s- and main r-components to Y are close to those of the weak r-component for Pal 1. The Ba abundances of Pal 1 and the disk stars mainly originate from the main s-component and the main r-component, respectively. Our calculated results imply that the unusual abundances of Pal could be explained by the top-light IMF for Pal 1’s progenitor-system.
1 Introduction
The heavy elements (Z30) are mainly produced by neutron-capture processes (Burbidge et al., 1957). The slow neutron-capture process (s-process) contains two categories. The weak s-process mainly produces the lighter neutron-capture elements and takes place in the massive stars (Lamb et al., 1977; Raiteri et al., 1991; The et al., 2000). The main s-process occurs in the AGB stars and is directly responsible for the heavier elements (Busso et al., 1999). The rapid neutron-capture process (r-process) also contains two categories. The main r-precess could occur in SNe II with 8-10 progenitor and mainly produces the heavier elements (Cowan et al., 1991; Sneden et al., 2008). However the weak r-process might take place in the SNe II with 11-25 progenitors. The SNe II primarily produce the weak r-process elements and eject the light and Fe-peak elements (Travaglio et al., 2004).
Globular clusters are the living fossils to study the Galactic evolution history since their extremely ancient age. Historically Palomar 1 (Pal 1) was thought as a globular cluster, since its location is higher than the Galactic plane (Harris, 1996). However, the red giants in Pal 1, whose averaged metallicity [Fe/H] is about -0.6, show so metal-rich for a globular cluster of the outer halo (Rosenberg et al., 1998b). Based on the study of the color-magnitude diagram of Pal 1, Rosenberg et al. (1998a) suggested its age lies the range of 6.3-8 Gyr. In this case, Pal 1 was regarded as the youngest globular cluster. Recently, using high-resolution spectra, Sakari et al. (2011) derived chemical abundances for four red giants in Pal 1. They found that element abundances of Pal 1 are unusual comparing to those of the disk stars. The abundances of Mg, Si, Ca, Ti, Co, V and Y of Pal 1 are lower than those of the disk stars with similar metalliciy. However the abundances of Ba and La are higher than those of the disk stars. Sakari et al. (2011) suggested that Pal 1 is not the traditional GC and should be accreted from a dwarf galaxy by our Galaxy. The unusual abundances should imply that Pal 1 should have an unusual formation environment and history.
Nearby galaxies should have complex formation histories and chemical evolution process (Tolstoy et al., 2009). They should have a close relation to our galaxy. For example, some stars and clusters in the Galaxy should originate from the dwarf galaxies. In this case, these stars retain the chemical signatures of its progenitor system. The chemical signatures, such as lower [/Fe] ratios, and star formation histories of nearby dwarf galaxies have been studied for many years (Tolstoy et al., 2003; Lanfranchi et al., 2008; Tsujimoto, 2011). Historically, the explanation of low [/Fe] ratios in dwarf galaxies is that the light elements are deficient, since a low star formation rate (SFR) and extra Fe from SNe Ia (Tinsley et al., 1979). Based on the detailed abundance analysis, McWilliam et al. (2013) concluded that the -element deficiencies in the Sagittarius (Sgr) dwarf spheroidal galaxy result from an top-light initial mass function (IMF), which is relatively deficient in the highest mass stars. Weidner et al. (2013); Kroupa et al. (2013) studied the effects of galaxy mass on stellar IMF. They found that the integrated galaxy IMF varies from top-light to top-heavy in dependence of galaxy type. The top-light IMF should be associated to the dwarf galaxies because the galaxies have not sufficient massive clouds to form the highest-mass stars (Oey, 2011). On the other hand, the IMFs seem to vary among more massive early type galaxies (van Dokkum & Conroy, 2012). Conroy & van Dokkum (2012) found that more massive early type galaxies are associated to bottom-heavy IMF, because many early supernovae drive up the supersonic turbulence in the giant clouds, which leads to formation of more low mass stars.
It is important to note that the abundances of individual stars of Pal 1 present the accumulated effects from the time of the progenitor-system formed to the time of Pal 1 formed. For purpose of investigating the complex formation mechanism and history of Pal 1, it is necessary to study the elemental abundances completely, containing light elements, Fe-peak elements and heavy elements. In this paper, using the abundance approach given by Li et al. (2013b), we investigated the astrophysical origins of chemical abundances of Pal 1 and the disk stars. The results and discussions are given in Section 2. Our conclusions are presented in Section 3.
2 Results And Discussions
It is indicated that the stellar abundances could not be explained by single astrophysical reason (Allen& Barbuy, 2006). For exploring the origins of light and heavy elements in Pal 1, we adopt the abundance approach from Li et al. (2013b). The abundance of element i should be express as:
| (1) |
where , , , and are the abundances of the main r-, the main s-, the primary, the secondary process and SNe Ia, respectively, which have been scaled to the corresponding abundances of Solar system. , , , and are the corresponding component coefficients. The abundance is the number of atoms of element i which is scaled to Si atoms of the solar abundances.
The primary light elements and Fe-peak elements are produced in the massive stars () during hydrostatic burning and the weak r-process elements were produced in the SNe II with progenitor mass . Because the primary light elements, Fe-peak elements and the weak r-process elements are ejected from the massive stars, these elements could be combined as one component, which is called the “primary component”. On the other hand, the secondary light elements and Fe-peak elements are produced in the massive stars () during hydrostatic burning and the weak s-process elements are produced in the massive stars during core He burning and shell C burning. The yields of weak s-process also have the secondary nature. Because the secondary light elements, Fe-peak elements and the weak s-process elements come from the massive stars, these elements could be combined as “secondary component” (Li et al., 2013b). Note that the abundances of secondary elements are observable only for higher metallicity, since their yields decrease with decreasing metallicity. In this case, the primary component contains the abundances of primary elements and the weak r-elements. The secondary component contains the abundances of the secondary elements and the weak s-elements. Both primary and secondary components are produced in the massive stars. The abundances of the secondary elements and the weak s-elements are adopted from Li et al. (2013b) and Raiteri et al. (1993) respectively. The abundances and are adopted from Li et al. (2013a). The abundances are adopted from Timmers et al. (1995) and updated the Fe, Cu, and Zn values from Mishenina et al. (2002). Kobayashi et al. (1998) reported that the SNe Ia events could not occur for the progenitors with low metallicity [Fe/H]. This implies that the SNe Ia events only occur on the higher metalllicy. In this work, we suppose that the abundance pattern produced by SNe Ia do not vary with metallicity, because the yields of SNe Ia depend on metallicity weakly (Iwamoto et al., 1999). In this case, the adopted abundance pattern produced by SNe Ia can be thought as the average abundance pattern produced by SNe Ia.
From the observations, Sakari et al. (2011) reported that compared to the disk stars, the [Ba/Y] values are apparently high, which indicates that the Pal 1 stars were contaminated by the low-metallicity and low-mass AGB stars. In these AGB stars, the s-process prefers heavier s-nuclei rather than lighter s-nuclei, because an iron-seed nucleus can capture more neutrons (Busso et al., 2001). Obviously, the different abundance patterns between Pal 1 and the disk stars attribute to the different chemical characteristics between Pal 1 and the disk stars. The abundances in Equation (1) are adopted from the results with [Fe/H]=-0.6 presented by Busso et al. (2001) for Pal 1. By comparison, for the disk stars, the abundance pattern in Equation (1) are adopted from the results with [Fe/H]=-0.6 calculated by Travaglio et al. (1999) (see their Figures 612).
Equation (1) contains five components. The corresponding component coefficients can be derived by looking for the minimum . Adopting the average abundances in Pal 1 stars (Sakari et al., 2011) and the average abundances of the disk stars with [Fe/H]=-0.6 (Reddy et al., 2006), we can obtain the best-fit coefficients. For the abundances of the Solar system, . Furthermore, we can compare the component coefficients of Pal 1 with the corresponding coefficients of the disk stars to investigate the astrophysical reasons of unusual abundances in Pal 1 stars.
The calculated results for Pal 1 and the disk stars are shown in Figure 1 (a) and (b). In top panels, the filled circles indicate the observed abundances and the solid lines represent the fitted results. In bottom panels, the individual relative offsets () and standard calculated errors for Pal 1 and the disk stars are shown, respectively. It is confirmed from the figure 1 (a) and (b) that the calculated results is validity.
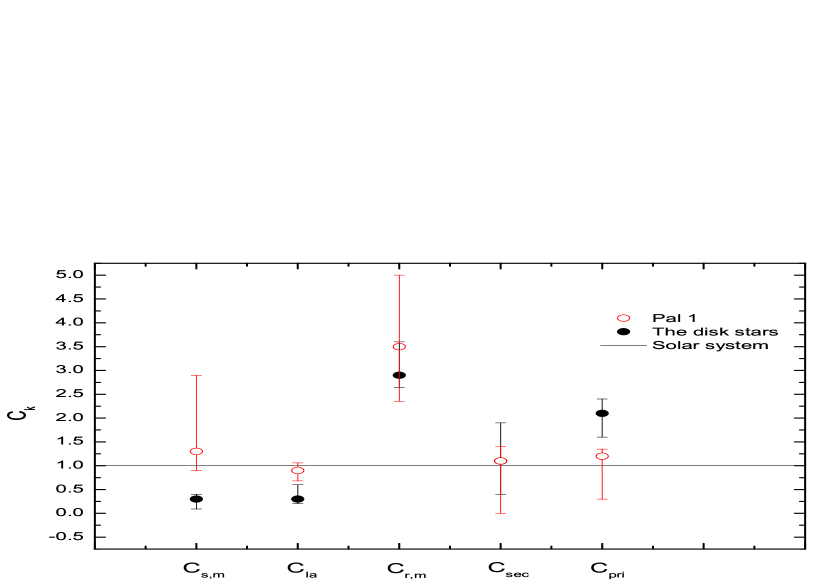
In Figure 2, the values of the component coefficients , , , , and the associated errors are displayed for Pal 1 and the disk stars, respectively. From the figure we can see that the values of , and of Pal 1 are higher than those of the disk stars, which implies that the contributions from the two components to the abundances of Pal 1 are larger than those of the disk stars. On the other hand, the value of of Pal 1 is lower than that of the disk stars, which implies that the contribution of the component to Pal 1 are smaller than that to the disk stars. Furthermore, the values of and ,of Pal 1 are close to those of the disk stars. The abundances of each component can be derived quantitatively using corresponding component coefficient.
Since the various categories of elements are produced in different astrophysical sites, the element abundances of Pal 1 should be directly effected by IMF of its progenitors’ system. We can study the characters of the IMF through the contributions of different processes to the element abundance of Pal 1. The primary component and secondary component are produced by the massive stars with M. On the other hand, the main r-process should take place in the SNe II with 8 progenitors (Cowan et al., 1991; Sneden et al., 2008) and the main s-process mainly occurs in the 1.5 AGB stars (Busso et al., 1999). Based on the calculated results, the coefficients ratios of Pal 1 to the disk stars for primary process, secondary process, main r-process, SNe Ia and main s-process are about 0.6, 1.0, 1.2, 3.0 and 4.5 respectively. The ratios have a trend that increase with decreasing progenitor mass, which should be an evidence that the IMF of Pal 1’s progenitor-system (e.g., dwarf galaxy in which cluster Pal 1 formed) is top-lighter than that of the Galaxy. Note that the coefficient ratios of Pal 1 to the disk stars are determined by their IMFs dominantly and the coefficient ratios should depend on their SFRs weakly. If the IMF of Pal 1 is similar to that of the Galaxy, the coefficient ratios of Pal 1 to the disk stars should be close to a constant. So the unusual abundances of Pal 1 are mainly due to the top-light IMF of its progenitor system. Recently, the signatures of the top-light IMF in the elemental abundances of the Fornax dwarf galaxy and the Sagittarius dwarf galaxy have been reported (Li et al., 2013b; McWilliam et al., 2013). The results imply that the IMF of Pal 1’s progenitor-system have the similar characters with that of the dwarf spheroidal galaxies mentioned above.
Our approach is based upon the measured abundances of the sample stars, thus the associated uncertainties would be included in the calculations. Taking the component coefficient of main s-process of Pal 1 as an example, we discuss the uncertainties of the coefficients. Adopting =3.5, =1.2, =1.1 and =0.9, the top panel in Figure 3 shows the calculated ratios [Ba/H] as a function of the component coefficients . There is only a range of the component coefficients in Figure 3, , in which the calculated ratios fall into observed limits of [Ba/H]. The bottom panel in Figure 3 illustrates the reduced values are the function of the component coefficients . There is a minimum of at =1.3 with a error bar, which indicates that the component coefficient is constrained well. Adopting this approach, we derived the errors of other component coefficients: , , and for Pal 1. , , and for the disk stars. The calculated errors of component coefficients are shown in Figure 2. In this case, the calculated abundance errors should be close to the observational errors, since the component coefficients are restrained by the observational errors. The average observed errors of all elements for the Pal 1 stars and the disk stars are about 0.17 and 0.07 dex, respectively (Sakari et al., 2011; Reddy et al., 2006). In this work, for simplicity, we take the average observed errors as the standard calculated errors of elemental abundances for the two category stars.
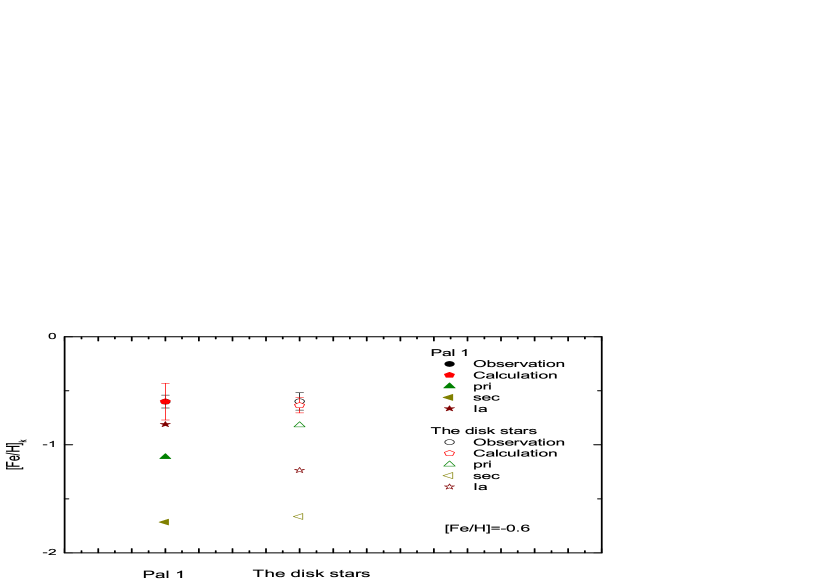
Because different elements in Pal 1 came from different astrophysical sites on different epoches, the abundances of individual stars present the accumulated effects from the time of the progenitor-system formed to the time of Pal 1 formed. In order to reveal the astrophysical reasons of unusual abundances of Pal 1, we show the component abundance ratios of Fe, Mg, Co, Y and Ba in Pal 1 and compare them with the disk stars in Figures 4-8. In the figures, the filled pentagons represent the calculated abundance ratios and the associated error bars represent the calculated errors. From Figure 4, we know that for the disk stars, the Fe element mainly produced by primary process. Although the observed Fe abundances of the disk stars are similar to those of Pal 1, the abundances of the primary and SNe Ia components of the disk stars are obviously different from those of Pal 1. For the Pal 1, the Fe abundance mainly originate from the SNe Ia. The calculated results imply that the primary Fe abundances of Pal 1 are lower than those of the disk stars, which agree in a top-lighter IMF of Pal 1’s progenitor-system.
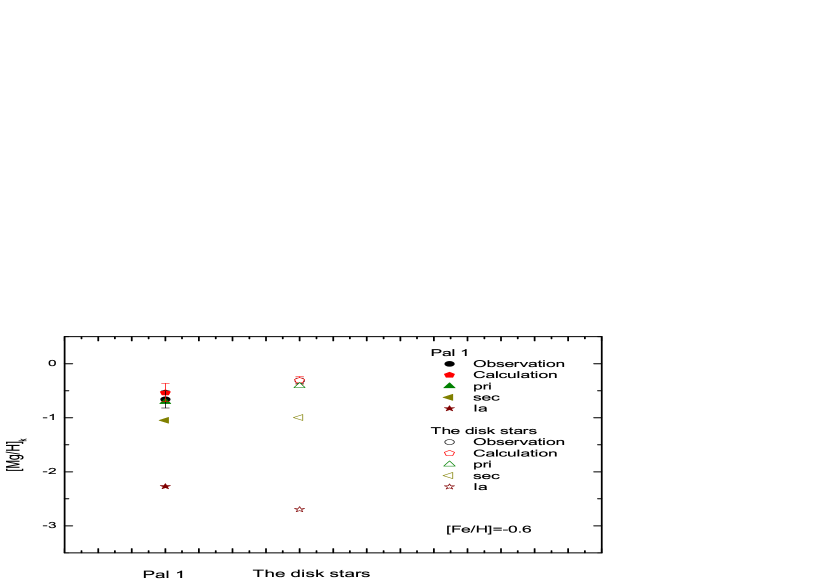
Sakari et al. (2011) reported that the observed Mg abundances of Pal 1 are lower than those of the disk stars by about 0.4 dex. From Figure 5 we know that for the disk stars and Pal 1, although the Mg abundances dominantly produced by the primary process, the primary Mg abundances of Pal 1 are smaller than those of the disk stars. This should mean that the proportion of the massive stars in Pal 1’s progenitor-system is smaller than that of the massive stars in the Galaxy. The observed unusual abundances of other elements in Pal 1 could be also explained by the top-light IMF of Pal 1’s progenitor-system.
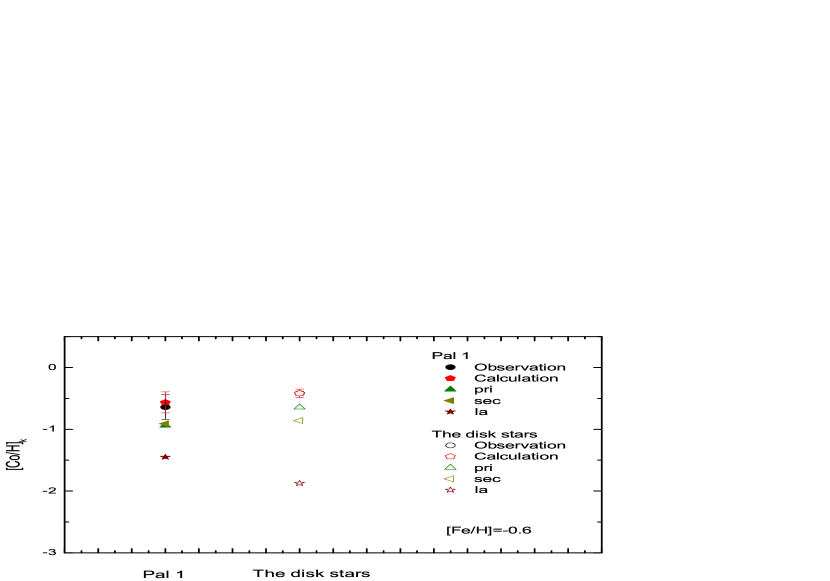
Sakari et al. (2011) showed that abundances of some Fe-peak elements, such as V and Co of Pal 1 are smaller than those of the disk stars. Taken Co as an example, Figure 6 shows that, for the disk stars and Pal 1, although the Co abundances mainly originate from the primary and secondary components of the massive stars, the contributions of the massive stars to Pal 1 is lower than those of the massive stars to the disk stars, which also agree in the top-light IMF of Pal 1’s progenitor-system. The lower abundance of V in Pal 1 could be explained by the similar reason.
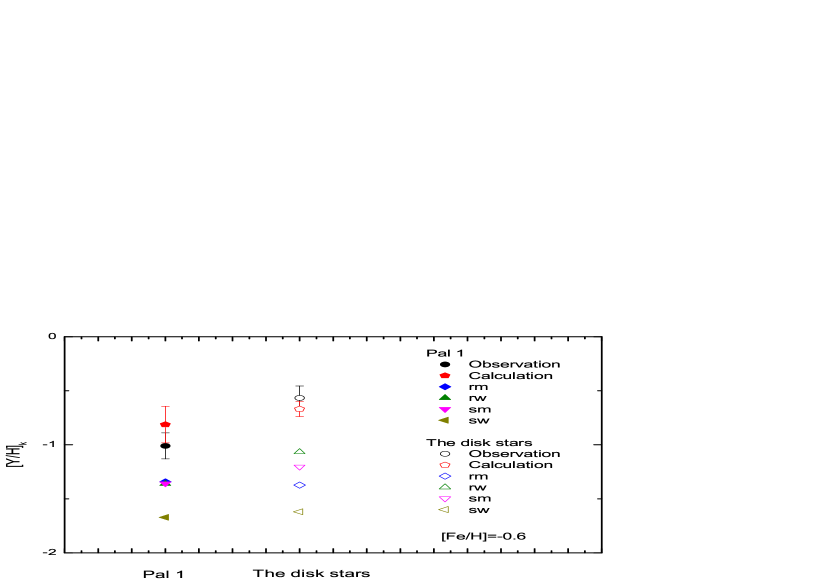
It is indicated that the Y abundances mainly originate from the weak r-component for the disk stars in Figure 6. However, for pal 1, the Y abundance originate from three components: main r-, weak r- and main-s components in the same figure. Sakari et al. (2011) have found that the Y abundances of Pal 1 are lower than those of the disk stars about 0.5 dex. From the figure we know that the main reason of the lower Y abundance is that the abundance of weak r-component of Pal 1 is smaller than those of the disk stars. The abundances of s-process component for Pal 1 should be mainly contaminated by the low metallicity AGB stars with 1.5-3 . In these AGB stars, the s-process prefers heavier s-nuclei (e.g., Ba, La) rather than lighter s-nuclei (e.g., Sr, Y), because an iron-seed nucleus can capture more neutrons (Busso et al., 2001). This should be another reason of the lower Y abundances in Pal 1. As Figure 7 shows, for element Y, the observed abundance including error bar falls into the calculation error limits.
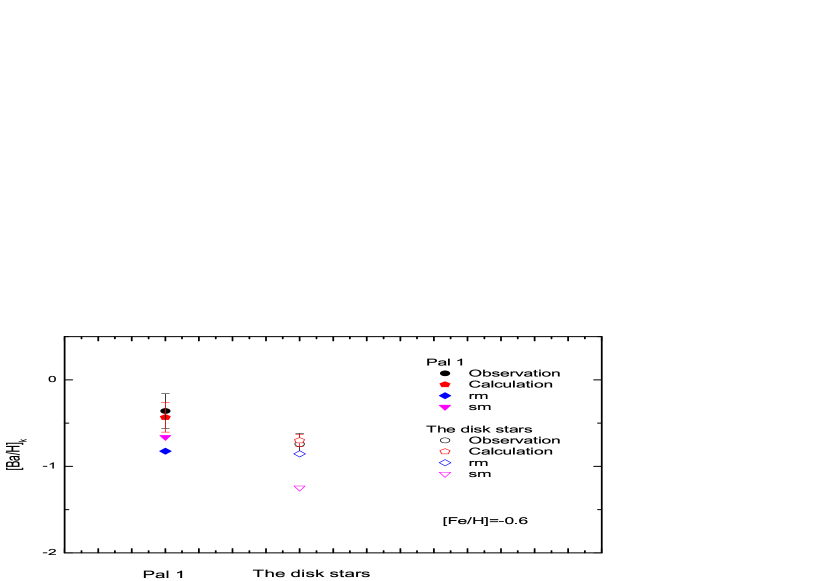
From Figure 8, we can see that the Ba abundances mainly originate from the main r-component for the disk stars. On the other hand, for Pal 1, the Ba abundance mainly originate from the main s-component. Sakari et al. (2011) reported that the Ba abundances of Pal 1 are larger than those of the disk stars. From the figure we know that the main reason of higher Ba abundance is that the Ba abundance of main s-component of Pal 1 is higher than those of the disk stars, which should attribute to the top-light IMF for the Pal 1’s progenitor-system.
3 CONCLUSIONS
The element abundances of Pal 1 contained a great deal of information of element nucleosynthesis and evolution history. In this paper, using the abundance-decomposed approach, we explore the astrophysical reasons of the unusual observed abundances in Pal 1 stars. We found that the component coefficients of main s-process and SNe Ia of Pal 1 are higher than those of the disk stars. However, the component coefficient of primary process of Pal 1 is lower than that of the disk stars. The results should imply that the IMF of Pal 1’s progenitor-system is top-lighter than that of the Galaxy.
The Fe abundances mainly produced by primary process for the disk stars and the Fe abundances mainly originate from the SNe Ia for Pal 1 stars. Although the -element abundances dominantly produced by the primary process for the disk stars and Pal 1, the contribution of primary component of the massive stars to Pal 1 is lower than those of the massive stars to the disk stars, which should be the astrophysical reason of the observed low- abundances in Pal 1. The Fe-peak elements V and Co mainly produced in the massive stars for the disk stars and Pal 1, but the contributions of the massive stars to Pal 1 is lower than those of the massive stars to the disk stars, which might be the astrophysical reason of the observed low abundances of V and Co in Pal 1. That the Y abundances of weak r-component for Pal 1 are smaller than that of weak r-component for the disk stars should be the main reason of the low Y abundances in Pal 1’ stars. Furthermore, that the Ba abundances of the main s-component for Pal 1 are higher than that of main s-component for the disk stars is the astrophysical reason of the high Ba abundance in Pal 1 stars. As a whole, the observed unusual abundances in Pal 1’stars could be explained by the top-light IMF for the Pal 1’s progenitor-system.
Our results obtained from the abundance-decomposed approach can provide more constraints on the astrophysical environment of Pal 1. Overall, we hope our work can give a beneficial guidance for judging chemical origin of Pal 1. Of cause, more observed elemental abundances about the stars of Pal 1 are needed to investigate the relation between Pal 1 and a dwarf galaxy.
References
- Allen& Barbuy (2006) Allen, D.M., Barbuy, B. 2006, A&A, 454, 917
- Arlandini et al. (1999) Arlandini, C., Kppeler, F., Wisshak, K., Gallino, R., Lugaro, M., Busso, M., & Straniero, O. 1999, ApJ, 525, 886
- Burbidge et al. (1957) Burbidge, E. M., Burbidge, G. R., Fowler, W. A., & Hoyle, F. 1957, Rev. Mod. Phys, 29, 547
- Busso et al. (1999) Busso, M., Gallino, R., Wasserburg G. J. 1999, ARA&A, 37, 239
- Busso et al. (2001) Busso, M., Gallino, R., Lambert, D.L., Travaglio, C., Smith, V.V. 2001, Astrophys. J. 557, 802
- Cowan et al. (1991) Cowan, J. J., Thielemann, F.-K., Truran, J. W. 1991, physrep, 208, 267
- Conroy & van Dokkum (2012) Conroy, C., & van Dokkum, P. G. 2012, ApJ, 760, 71
- Harris (1996) Harris, W.E. 1996, AJ, 112, 1487 (2010 edition)
- Iwamoto et al. (1999) Iwamoto, K., Brachwitz, F., Nomoto, K., et al. 1999, ApJS, 125, 439
- Kobayashi et al. (1998) Kobayashi, Chiaki., Tsujimoto, Takuji., Nomoto, Ken’ichi., Hachisu, Izumi., & Kato, Mariko. 1998, ApJ, 503, L155
- Kroupa et al. (2013) Kroupa, Pavel., Weidner, Carsten., Pflamm-Altenburg, Jan., Thies, Ingo., Dabringhausen, Jorg., Marks, Michael., Maschberger, Thomas. 2013, pss5.book, 115
- Lanfranchi et al. (2008) Lanfranchi, G. A., Matteucci, F., & Cescutti, G. 2008, A&A, 481, 635
- Lamb et al. (1977) Lamb, S., Howard, W. M., Truran, J. W., Iben, I. 1977, ApJ, 217,213
- Li et al. (2013a) Li, H. J., Shen, X. J., Liang, S., Cui, W. Y., Zhang, B. 2013a, PASP, 125, 143
- Li et al. (2013b) Li, H. J., Cui, W. Y., Zhang, B. 2013b, ApJ, 775, 12
- McWilliam et al. (2013) McWilliam, Andrew., Wallerstein, George., Mottini, Marta. 2013, ApJ, 778, 149
- Mishenina et al. (2002) Mishenina, T. V.,et al., Kovtyukh, V. V., Soubiran, C., Travaglio, C., Busso, M. 2002, A&A, 396, 189
- Oey (2011) Oey, M. S. 2011, ApJ, 739, L46
- Reddy et al. (2003) Reddy, B.E., Tomkin, J., Lambert, D.L., Allende Prieto, C. 2003, MNRAS, 340, 304
- Reddy et al. (2006) Reddy, B.E., Lambert, D.L., & Prieto, C.A. 2006, MNRAS, 367, 1329
- Raiteri et al. (1991) Raiteri, C. M., Busso, M., Gallino, R., Picchio, G., Pulone, L.1991, ApJ, 371, 665
- Raiteri et al. (1993) Raiteri, C. M., Gallino, R., Busso, M., Neuberger, D., Kappeler, F. 1993, ApJ, 419, 207
- Rosenberg et al. (1998a) Rosenberg, A., Saviane, I., Piotto, G., Aparicio, A., & Zaggia, S.R. 1998a, AJ, 115, 648
- Rosenberg et al. (1998b) Rosenberg, A., Piotto, G., Saviane, I., Aparicio, A., & Gratton, R. 1998b, AJ, 115, 658
- Sneden et al. (2008) Sneden, C., Cowan, J. J., Gallino, R. 2008, ARA&A, 46, 241
- Sakari et al. (2011) Sakari, C. M., Venn, K. A., Irwin, M., Aoki, W., Arimoto, N., Dotter, A. 2011, ApJ, 740, 106
- Tinsley et al. (1979) Tinsley, B. M. 1979, ApJ, 229, 1046
- Tsujimoto (2011) Tsujimoto, T. 2011, ApJ, 736, 113
- Tolstoy et al. (2003) Tolstoy, E., Venn, K. A., Shetrone, M., et al. 2003, AJ, 125, 707
- Tolstoy et al. (2009) Tolstoy, E., Hill, V., Tosi, M., 2009, ARA&A, 47, 371
- The et al. (2000) The, L.-S., El EiD, M. F., Meyer, B. S. 2000, ApJ, 533, 998
- Travaglio et al. (1999) Travaglio, C., Galli, D., Gallino, R., Busso, M., Ferrini, F., & Straniero, O. 1999, ApJ, 521, 691
- Travaglio et al. (2004) Travaglio, C., Gallino, R., Arnone, E., Cowan, J., Jordan, F., & Sneden, C. 2004, ApJ, 601, 864
- Timmers et al. (1995) Timmes, F. X., Woosley, S. E., & Weaver, T. A. 1995, ApJS, 98, 617
- van Dokkum & Conroy (2012) van Dokkum, & Pieter G., Conroy, Charlie. 2012, ApJ, 760, 70
- Weidner et al. (2013) Weidner, C., Kroupa, P., Pflamm-Altenburg, J., Vazdekis, A. 2013, MNRAS, 436, 3309