Charge density wave in hydrogen at high pressure
Abstract
We present extensive molecular dynamics (MD) simulations investigating numerous candidate crystal structures for hydrogen in conditions around the present experimental frontier (400GPa). Spontaneous phase transitions in the simulations reveal a new structure candidate comprising twofold coordinated chains of hydrogen atoms. We explain the electronic structure of this phase in terms of a charge density wave and calculate its experimental signature. In detailed tests of the accuracy of our calculation, we find that -point sampling is far more important in MD than in static calculations, because of the freedom it give the atoms to rearrange themselves optimally for the given sampling.
1 Introduction
Hydrogen is typically located atop group 1A in the periodic table, and while the H2 molecule has no analogue among the alkali metals, one might expect similarities to appear if a non-molecular phase is obtained at extreme conditions.
At pressures where the binding energy is close to zero, the structure is held together by the external pressure rather than chemical bonding. For the alkali metals in this pressure range, complex phases are observed in which the electronic structure can be assigned to two classes. The relatively simple electride structures involve the electron being located in the interstices between atoms playing the role of pseudo-anion [2, 3, 4, 5]. Alternately, the atoms arrange themselves so as to perturb a free electron gas into a charge-density wave, opening a gap (or pseudogap) at the Fermi surface - the signature here being a clustering of diffraction peaks at 2kF[6, 5, 7, 8, 9, 10, 11].
Static experiments using diamond anvil cells are now reaching equivalent pressures in hydrogen, where the work done in compression is greater than the chemical binding energy. Measurements at these pressures are restricted to spectroscopy and conductivity, so density functional calculations are used to determine the structure. Despite the wide variety of methods used, including different treatment of the quantised nuclear motion and different approaches to the exchange-correlation functional, the same set of candidate structures invariably appears, albeit with considerable variation in the stability range. Furthermore, more accurate theoretical treatments invariably come at high computational cost, so at elevated temperature enhanced finite sampling errors can eliminate theoretical improvements.
At present there is no good consensus about the best trade-off: typical calculations have errors of up to 100GPa and a few hundred Kelvin. Thus the practical role of calculations is to propose candidate structures for test against experiment.
2 Calculations
For analysis we use the radial distribution function (RDF), angular distribution function (ADF), projected mean square displacement (MSD), phonon and vibrational mode projection; details of which are given in the SM. In addition we calculate average electron density of states (DoS) and average XRD patterns, all explained in SM.
3 Results and discussions
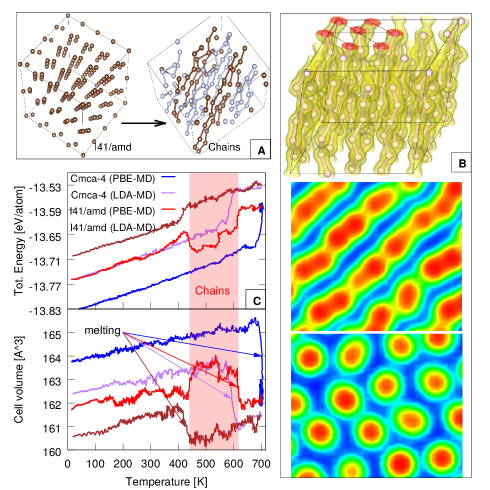
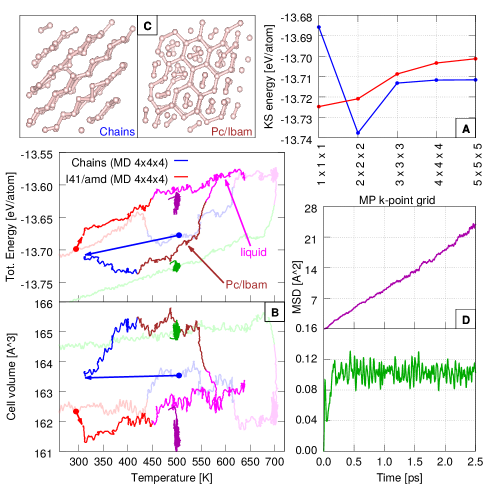
We performed 17 short MD simulations starting with different structures found using static structure searches[12, 13, 14]. Simulations starting in molecular phases retained molecular character, but all high-symmetry structures are unstable and immediately undergo total reconstruction at finite temperature. Surprisingly, they adopt rather similar structures with twofold coordinated chains of hydrogen threading through the simulation box, subject to the constraints of periodic boundary conditions (Figure 1). This structure, has on average 2D hexagonal symmetry in the plane perpendicular to the chains, while being essentially a collection of charge tubes containing diffusive hydrogen nuclei in the chain direction. Similar structures have been identified before in structure searches as transition states between the molecular and atomic phases[14] and probably the same structure was reported in previous PIMD simulations[15, 16]. Its ubiquity marks it out as a candidate high temperature structure worthy of further study.
In addition to these short runs, we performed two long MD simulations using a 2x2x2 k-point grid at 400GPa, starting in (atomic) and (molecular) and slowly heated (Figure 1). Using PBE exchange-correlation, the spontaneously transformed into at around 450K which remained stable until melting occurred at 620K. Although, is clearly more thermodynamically stable than , compared to , which remains molecular until melting, has higher energy, but also lower volume and probably higher entropy owing to large diffusion (Figure 2).
Figure 1 also shows that the liquid is denser than any candidate solid structure at 400GPa, confirming the negative slope of the melting curve [18]. would give a much steeper slope than , which could be measured experimentally. Using LDA exchange-correlation, both phases melt at lower temperatures, indicating that choice of exchange-correlation functional can change melting temperatures by around 100K (corresponding to about 10meV).
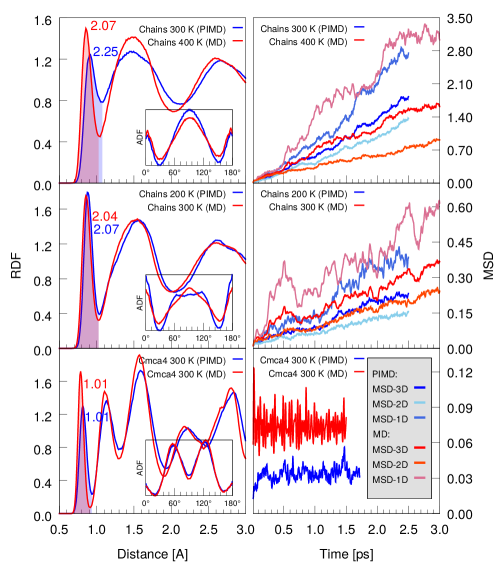
We find that diffusion in the structure is significantly higher than in the competing molecular metallic phases (Figure 2). Studying the atomic trajectories in detail we identify 3 main mechanisms; in order of importance: a) chains sliding ”freely” along their length (included in MSD-1D), b) atoms migrating to neighbour chains (MSD-2D) and c) atoms swapping position within the chain (included in MSD-1D), sometimes by forming a short-lived rotating molecule. The diffusive nature of makes it a higher entropy structure which might stabilize it over at higher temperature. For both and the effect of quantum protons (PIMD) on MSD, RDF and ADF is similar to increasing the temperature by about 100K in classical MD. The RDF confirms that has coordination number 2 with a peak at , meaning the molecules are no longer well defined. We notice in the ADF a well defined peak at which means that the pseudo-molecules are pointing towards one-another. can be viewed as a similar structure, but with the chains broken into well defined molecules, oriented at angles with respect to the chain direction. We can say is a high entropy version of .
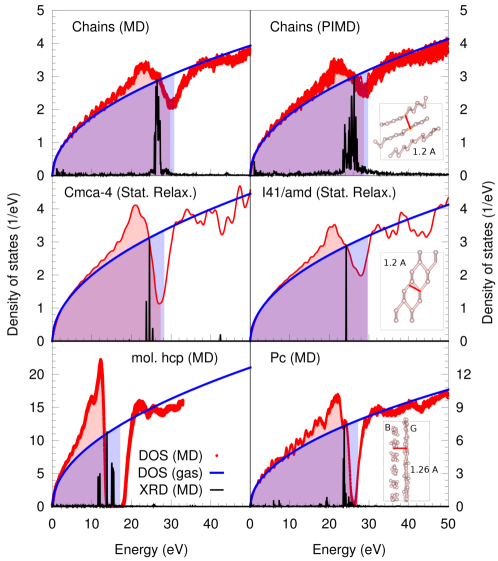
Figure 3 shows the electronic density of states (DoS) taken from individual snapshots of MD. DoS is extremely well fitted by a free-electron gas model, with a pronounced dip at the Fermi energy. To open a pseudogap at the Fermi surface of a free electron gas it is necessary to have an arrangement of atoms which will strongly scatter electrons at kF. Such an arrangement will also strongly scatter X-rays at . In figure 3 we relate the X-ray scattering vector to an equivalent energy using . We have used GDIS software[17] to plot the simulated X-ray diffraction pattern (XRD) implied by our simulations. It can be seen that the structure self-organizes in such a way that a large number of symmetry-unrelated peaks are co-located at .
This is identical to the situation in the alkali metals, in particular for the incommensurate phases[22, 11] which typically have chains of atoms in a “host” framework. It is thus clear that our structure can be interpreted as a Fermi-surface perturbation from a free electron gas. This nearly-free electron picture, stabilization by a charge density wave, appears to be valid for other candidate hydrogen structures. In the case of Phase-IV candidate, , the charge density wave creates a layered structure (insets to figure 3) which can accommodate molecules and hexamers. This could explain the preferences of most structure candidates in the pressure range close to metalization to arrange in layers or polymers. It is peculiar that even at 50GPa, the molecular structure appears to have a nearly free electron DoS. This might be a side effect of the plane wave approximation employed in DFT.
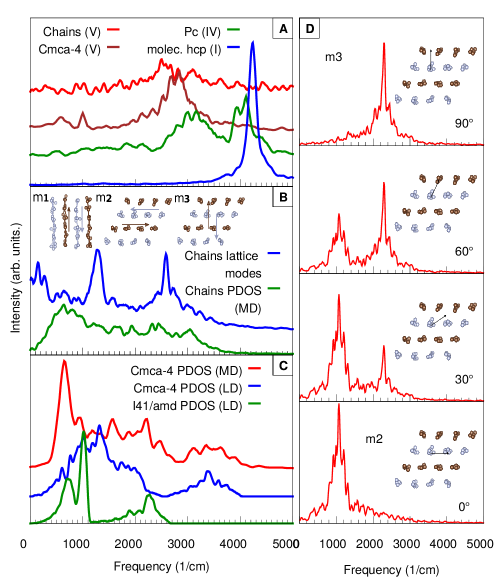
In figure 4 we show our full phonon spectrum (PDOS), calculated from the fourier transform of the velocity autocorrelation function for and and from lattice dynamics (LD) for and . The spectra obtained for at 0K and 300K are consistent suggesting the phonons are harmonic. While presents three distinct bands in the PDOS at 0K, the structure has only one broad band of frequencies with no gap.
Because is metalic and only stable in MD, there is no way to identify the Raman modes, we can only impose restrictions based on symmetry. We therefore calculate the frequencies for the most symmetric phonon modes, involving oscillations of chains, by projecting the MD velocities onto those motions, and taking the FT of the resulting trajectory (see SM for details). There are three main modes involving chain oscillations in the 3 Cartesian directions as depicted in figure 4. We also demonstrate that our method correctly picks up the eigen-frequencies by investigating the spectrum with respect to different projection vectors.
Since the have no molecular modes, so there are no vibronic modes above 3000cm-1 in the PDOS. The highest frequency modes in the calculation are around 2500cm-1, which comprise atoms vibrating within a chain. Occasionally, we do see interatomic distances comparable with the free molecule, but these are short lived. is a natural continuation of the molecular phases on the path to dissociation, as illustrated by the vibrational modes (Figure 4) given by the different structure candidates in order of increasing pressure.
4 Simulation shortcomings
The solid phases of hydrogen discovered so far at room temperature are stabilised by entropy, therefore MD simulations are crucial for understanding the properties of possible candidates. These calculations are expensive, however, and we need to consider trade-offs.
A large size of the cell is important to reduce finite size effects, a lengthy run is needed for equilibration and good sampling of the energy surface. At the same time, a reasonably small time step is required to capture the hydrogen molecular vibrations. In addition, for PIMD runs, a large number of beads is necessary to sample the quantum wave function of the nuclei. These are all supplementary to the actual DFT settings that mainly include the choice of functional, electronic energy cut-off and k-point sampling. The accuracy of the PBE functional for hydrogen has vastly been disputed in the literature, however, we emphasize that in the case of MD using PBE is a reasonable trade-off to minimize the other more important shortcomings.
We draw attention here to yet another convergence issue that has not been fully investigated before. It is common practice to run large MD calculations with small k-point sets, as appropriate for the large cell size. In MD runs with a single k-point, we noticed that nuclei can rearrange in real space such that the energy of the electrons is minimized at , but not at unsampled points in the zone. We demonstrate the effect using calculations (shown in Figure 5A) on snapshots taken from our previously discussed MD heating runs (Figure 1) comparing the pre-transition structure with the post-transition . We see that using -point only sampling, has the lowest energy, whereas in the actual simulation, using a 2x2x2 grid, is lower. For higher K-point sampling, the snapshots are still lower in energy than , but by a smaller amount. This suggests that although the configuration may be optimised to match the -point grid, it is still a valid candidate structure. Previous MD calculations have, at best, investigated -point convergence with respect to static structures and often details of -points are not even quoted. The 20meV uncertainty suggests that -point sampling, rather than functional or quantum-proton effects, may be the dominant source of error in previous MD calculations.
Figure 5 also compares the previous MD runs (Figure 1) with a subsequent MD heating simulation with a denser MP grid, in which melts at 450K and transforms to a type structure. In constant pressure and temperature simulations at 400GPa and 500K, melts whereas is stable. This new results suggest that the stability ranking at these conditions is: , , , . Of course, we must study all competitive candidates, leaving the experiment to decide.
5 Conclusions
We have found and investigated a candidate structure for high-temperature solid hydrogen under pressure. The polymeric structure has twofold coordinated hydrogen atom, and is stabilized by a charge density wave similar to the incommensurate structures in the simple metals. In experiment, it would be characterized by the disappearance of high frequency vibronic peak. Up to 400GPa, is clearly more stable than any network atomic structure, but its stability relative to molecular structures such as cannot be reliably determined using our methods.
6 Acknowledgments
We thank E.Gregoryanz, A.Hermann and M.Martinez-Canales for many useful discussions. IBM thanks the Cray XC30 for computing time (Archer at EPCC) and EPSRC for a studentship.
References
References
- [1] Savin A, Jepsen O, Flad J, Andersen O K, Preuss H and von Schnering H G 1992 Angewandte Chemie International Edition in English 31 187–188
- [2] Ma Y, Eremets M, Oganov A R, Xie Y, Trojan I, Medvedev S, Lyakhov A O, Valle M and Prakapenka V 2009 Nature 458 182–185
- [3] Gatti M, Tokatly I V and Rubio A 2010 Physical Review Letters 104 216404
- [4] Marqués M, Ackland G J, Lundegaard L F, Stinton G, Nelmes R J, McMahon M I and Contreras-Garcia J 2009 Physical Review Letters 103 115501
- [5] Marqués M, McMahon M I, Gregoryanz E, Hanfland M, Guillaume C L, Pickard C J, Ackland G J and Nelmes R J 2011 Physical Review Letters 106 095502
- [6] Heine V 2000 Nature 403 836–837
- [7] Arapan S, Skorodumova N V and Ahuja R 2009 Physical Review Letters 102 085701
- [8] Arapan S, Mao H and Ahuja R 2008 PNAS 105 20627
- [9] Reed S K and Ackland G J 2000 Physical Review Letters 84 5580
- [10] Degtyareva V F 2006 Phys. Uspek. 49 369–388
- [11] Ackland G J and Macleod I R 2004 New Journal of Physics 6 138
- [12] Pickard C J and Needs R J 2007 Nature Physics 3 473–476
- [13] Pickard C J, Martinez-Canales M and Needs R J 2012 Physical Review B 85 214114
- [14] Geng H Y, Song H X, Li J and Wu Q 2012 Journal of Applied Physics 111 063510
- [15] Biermann S, Hohl D and Marx D 1998 Solid State Communications 108 337–341
- [16] Biermann S, Hohl D and Marx D 1998 J. Low Temp. Phys. 110 97–102
- [17] Fleming S and Rohl A 2005 Zeitschrift Fur Kristallographie 220 580–584
- [18] Howie R T, Dalladay-Simpson P and Gregoryanz E 2015 Nature materials 14 495–499
- [19] Magdău I B and Ackland G J 2013 Physical Review B 87 174110
- [20] Ackland G J and Magdau I B 2013 High Pressure Research 1–7
- [21] Magdău I B and Ackland G J 2014 J. Phys.: Conf. Ser. 500 032012
- [22] McMahon M I and Nelmes R J 2004 Physical Review Letters 93 055501