Bright stars observed by FIMS/SPEAR
Abstract
In this paper, we present a catalogue of the spectra of bright stars observed during the sky survey using the Far-Ultraviolet Imaging Spectrograph (FIMS), which was designed primarily to observe diffuse emissions. By carefully eliminating the contamination from the diffuse background, we obtain the spectra of 70 bright stars observed for the first time with a spectral resolution of 2–3 Å over the wavelength of 1370–1710 Å. The far-ultraviolet spectra of an additional 139 stars are also extracted with a better spectral resolution and/or higher reliability than those of the previous observations. The stellar spectral type of the stars presented in the catalogue spans from O9 to A3. The method of spectral extraction of the bright stars is validated by comparing the spectra of 323 stars with those of the International Ultraviolet Explorer (IUE) observations.
keywords:
catalogues – ultraviolet: stars – stars: general – instrumentation: spectrographs – methods: data analysis – techniques: spectroscopic1 Introduction
Among the space missions that have observed stellar spectra in the range of the far ultraviolet (FUV) wavelength, the International Ultraviolet Explorer (IUE; Boggess et al., 1978) has the most extensive list of targets with approximately 5,000 stars with their spectra taken for the wavelength range of 1150–1980 Å with a resolution of 0.1–0.3 Å. Although the wavelength coverage might differ slightly among various missions, there have been a number of additional small and full-scale missions. These include the S2/68 Ultraviolet Sky Survey Telescope (UVSST; Boksenberg et al., 1973; Jamar et al., 1976) aboard the ESRO Satellite TD-1, Copernicus (Rogerson et al., 1973; Snow & Jenkins, 1977), SKYLAB Experiment S-019 (Henize et al., 1975, 1979), Hopkins Ultraviolet Telescope (HUT; Davidsen et al., 1992; Kruk et al., 1995), Orbiting Retrievable Far and Extreme Ultraviolet Spectrometers (ORFEUS; Jenkins et al., 1996), Far Ultraviolet Spectroscopic Explorer (FUSE; Moos et al., 2000; Sahnow et al., 2000), Galaxy Evolution Explorer (GALEX; Morrissey et al., 2007; Bertone & Chavez, 2011), and Space Telescope Imaging Spectrograph (STIS; Woodgate et al. 1998 and StarCAT; Ayres 2010), Goddard High Resolution Spectrograph (GHRS; Brandt et al., 1994), Cosmic Origins Spectrograph (COS; Green et al., 2012) aboard the Hubble Space Telescope (HST). As a result of these observations, the spectra of approximately 10,000 stars are now available in the FUV wavelengths.
Recently, the Far-Ultraviolet Imaging Spectrograph (FIMS), also known as the Spectroscopy of Plasma Evolution from Astrophysical Radiation (SPEAR), performed an all-sky survey in the FUV wavelength region. The FIMS is a dual channel imaging spectrograph (S-band: 900–1150 Å, L-band: 1370–1710 Å) with moderate spectral ( 550) and angular ( 5′) resolutions, and it was designed for the observation of diffuse emissions from interstellar medium (Edelstein et al., 2006a, b). The primary purpose of the FIMS is to study the FUV emission from atomic, ionic, and molecular species in a variety of interstellar environments (e.g. Korpela et al., 2006). In addition, a number of bright stars have also been observed when they are within its large image fields of view, defined by the slit size (S-band: 40 46, L-band: 75 43) . This paper discusses the spectral extraction of these observed bright stars.
The FIMS was used to make observations for one and a half years, covering more than 80% of the sky, after its launch by the Korean microsatellite STSAT-1 on 27 September 2003 into a 700 km sun-synchronous orbit. Although stars were observed in both the S- and L-bands, the S-band data were excluded from the present analysis because of their strong contamination with geocoronal emission lines as well as the low detector sensitivity. We extracted the L-band spectra for 532 stars from 1,523 orbits of observations during its mission lifetime, from which 70 stars were observed for the first time. Here, we report the FUV spectra of these stars along with those of the 139 stars that were observed with a better spectral resolution and/or higher reliability than those of the previous observations, as the FIMS catalogue stars. The remaining 323 stars, which were also observed by the IUE in a large aperture mode , were used to validate the FIMS spectra. Most of the 323 stars were observed in the high-dispersion mode of the IUE with a spectral resolution of 0.2 Å, but 34 stars among them were observed in the low-dispersion mode and with a lower spectral resolution of 6 Å. Section 2 describes the data processing steps used to obtain the FUV spectra of the observed stars, and Section 3 presents the detailed descriptions of the statistical properties of the FIMS catalogue stars. A summary is provided in Section 4.
2 Data Processing Steps
We followed three key steps to obtain the spectral information of the stars that were observed with a diffuse background. A detailed description about flat-fielding as well as the procedures of wavelength and flux calibration for the FIMS data can be found in Edelstein et al. (2006b). In the present paper, we report only on the process of spectral extraction of bright stars from the existing FIMS archival data. However, the new effective area was derived as it was seen to change significantly over the mission time due to degradation in detector sensitivity (Section 2.3).

2.1 Step 1: Identification of stars and merging of data
The FIMS data, which were archived in the FITS format with coordinates and wavelengths assigned to each photon, were arranged to form an image tile for each orbit of observations and pixelated using the HEALPix scheme (Gorski et al., 2005) with a resolution parameter of Nside = 512, corresponding to a pixel size of approximately 7 arcmin. The constant pixel area of the HEALPix scheme makes it convenient to extract stellar spectra, which are mixed with the background spectra because of instrumental scattering.
We identified the stars by comparing the FIMS images with the locations of the bright stars in the TD1 star catalogue (Thompson et al., 1978) based on the S2/68 Ultraviolet Sky Survey Telescope (UVSST) of the TD1 satellite. UVSST is described in Boksenberg et al. (1973) and the absolute calibration of the instrument is given in Humphries et al. (1976). UVSST consisted of an f/3.5 telescope with a primary mirror having a diameter of 27.5 cm, feeding photons to a spectrometer and photometer. The spectrometer has an entrance aperture of 118 17′and a wavelength band in the range of 130–255 nm with spectral resolution of 35 Å. The photometer has an aperture of 17 17′with a broad passband (31 nm) centred at 274 nm. The first UVSST spectral catalogue for 1,356 stars was published by Jamar et al. (1976)111http://vizier.u-strasbg.fr/viz-bin/VizieR?-source=III/39A. Later, Thompson et al. (1978)222http://vizier.u-strasbg.fr/viz-bin/VizieR?-source=II/59 extended the catalogue to 31,215 stars and provided the absolute UV fluxes in four passbands: 135–175 nm, 175–215 nm, 215–255 nm, and the photometric band at 274 nm. The fluxes of the first three wavelength bands were obtained by binning the spectrophotometric data, and the flux of the longest wavelength band was based on the photometric data only. Hence, the angular resolution of the catalogue is limited by that of the photometer, which is 2 arcmin. It is notable that the shortest passband of 135–175 nm, centred at 1565 Å (henceforth, F1565), is comparable with that of the FIMS L-band and was used for identification of UV bright stars in the present study because the TD1 is more sensitive and has higher angular resolution than FIMS. We note that the photometric catalogue (henceforth, TD1) extended by Thompson et al. (1978) were used to identify stars, while the spectral catalogue (henceforth, UVSST) made by Jamar et al. (1976) were used to compare with the FIMS spectra after Section 3.
In order to avoid misidentification of stars in crowded areas and contamination by other bright stars in the surrounding region, we selected only the stars listed in the TD1 catalogue that were isolated within the 2° 2° angular region centred around the target stars. Since the angular resolution of TD1 (2′) is higher than that of the FIMS, we believe that the TD1 catalogue is able to resolve the stars even for those that the FIMS cannot if the stars were bright enough to be observed by TD1. Hence, the angular resolution of the FIMS catalogue is limited by that of the TD1 catalogue. Further, we checked the 2° 2° FIMS images and discarded the pixels brighter than the background median values by a factor of three, except those associated with the target stars. The faintest star in the resulting FIMS catalogue has a flux of 7 10-12 erg s-1 cm-2 Å-1, much higher than the typical TD1 flux limit of 10-12 erg s-1 cm-2 Å-1 in the spectral band of 1350–1750 Å. Although we avoided regions of high concentration of UV sources on the basis of the TD1, there may still exist some stars which were not resolved in the TD1 catalogue among the FIMS catalogue stars. However, we found no bright stars near the stars included in the FIMS catalogue. Instead, some stars that were observed by FIMS but not included in our catalogue were found to be contaminated by unresolved stars. For example, HD 214167 (B1.5Vs; Abt & Cardona, 2011) was found to form a double system with one of the FIMS star of HD 214168 (B1Vne:; Abt & Cardona, 2011), separated by an angular distance of 0.37′. As another example, HD 199739 with a spectral type of B2II (Hill & Lynas-Gray, 1977) was found at an angular distance of 4′ from one of the FIMS star of HD 199661. However, the star is fainter than HD 199661 by 1.7 mag (21%) in V band and 2.8 mag (8%) in U band (Reed, 2003). These two stars were not included in the FIMS catalogue since they were also observed by the IUE. In summary, although the 2° 2° angular region may contain many other stars not resolved in the TD1, the contamination due to them would not be significant.
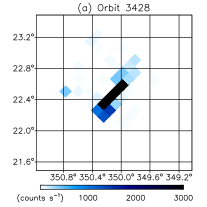
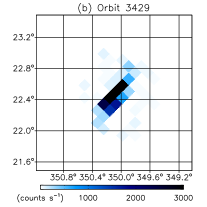
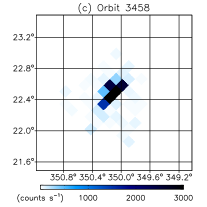
Once the target star was identified and the region of 2° 2° tiles were confirmed to be free of bright stars, we performed a Gaussian fitting for each image to find the centre of the star. We note that instrumental scattering results in diffuse images even for a point source. The selection of this large area around each star is necessary because the instrumental scattering by the slit caused the elongated image of a bright star along the slit direction, as shown in Figure 1 for HD 143275. The multiple image tiles produced by multiple observations for the same star were merged into one before spectral information was extracted. The range of number of tiles for each star was from 3 to 207, with an average of 45.
| HD ID | Orbit | Observational | HD ID | Orbit | Observational |
|---|---|---|---|---|---|
| date | date | ||||
| 21790 | 1116 | 2003-12-12 | 100889 | 2559 | 2004-03-20 |
| 46487 | 1254 | 2003-12-21 | 83058 | 2561 | 2004-03-20 |
| 32249 | 1292 | 2003-12-24 | 79447 | 2772 | 2004-04-03 |
| 31726 | 1341 | 2003-12-27 | 98718 | 2973 | 2004-04-17 |
| 25340 | 1455 | 2004-01-04 | 105937 | 3053 | 2004-04-22 |
| 68217 | 1929 | 2004-02-05 | 108257 | 3054 | 2004-04-22 |
| 63922 | 1964 | 2004-02-08 | 152614 | 3610 | 2004-05-30 |
| 64740 | 1994 | 2004-02-10 | 158094 | 3847 | 2004-06-16 |
| 70556 | 2006 | 2004-02-11 | 165024 | 3947 | 2004-06-22 |
| 64802 | 2057 | 2004-02-14 | 166182 | 3955 | 2004-06-23 |
| 76566 | 2070 | 2004-02-15 | 172910 | 4061 | 2004-06-30 |
| 75821 | 2075 | 2004-02-15 | 207971 | 4639 | 2004-08-09 |
| 67797 | 2078 | 2004-02-16 | 188665 | 5226 | 2004-09-18 |
| 76805 | 2443 | 2004-03-12 | 207330 | 5635 | 2004-10-16 |
2.2 Step 2: Extraction of the stellar spectrum
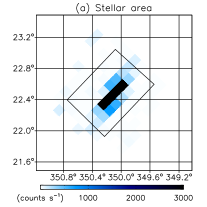
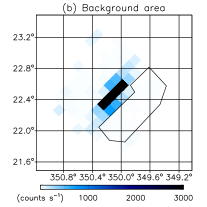
The final merged 2° 2°image tiles consist of two areas: one for the star (hereafter, the stellar area), where both the stellar and diffuse background photons coexist, and the other for the background (hereafter, the background area), where the photons from only the diffuse background are contained. We note that the diffuse background may also contain flux from unresolved fainter stars, although we have carefully filtered out bright background pixels through the Step 1. The selection of these two areas was performed manually so that the background area was free of stellar photons of the target star. Figure 2 presents an example of the stellar area and background area selected for HD 143275.
Because the stellar area contains photons both from the star and the diffuse background, the photon counts per angstrom for the stellar area are expressed as follows:
| (1) |
where is the observed photon counts per angstrom for the stellar area (unit: photons Å-1), is the count rate (unit: photons s-1 Å-1) of the stellar photons to be extracted, is the observation time for the stellar area (unit: s), is the count rate per steradian (unit: photons s-1 Å-1 sr-1) of the diffuse background photons to be removed from , and is the celestial surface area of the stellar area (unit: steradians). Likewise, the photon counts per angstrom for the background area are expressed as follows:
| (2) |
where is the observed photon count per angstrom for the background area (unit: photons Å-1), is the observation time for the background area (unit: s), and is the celestial surface area of the background area in units of steradians. Hence, the stellar photon count rate of can be written as:
| (3) |
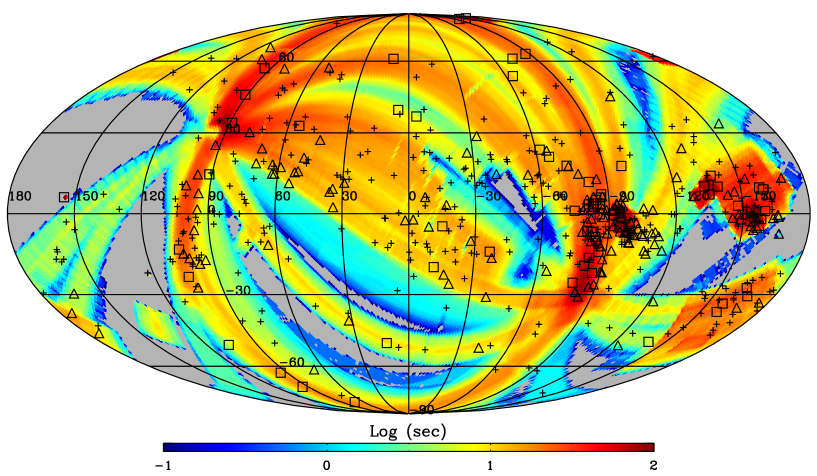
We verified the signal-to-noise ratio (SNR) of for each star and selected only those with a wavelength-averaged SNR greater than 3.0. The total number of stars selected for spectral analysis was 532, out of approximately 4,000 stars from the FIMS observations that were identified through comparison with the TD1 catalogue. Among the 532 stars, 70 stars were observed for the first time by the FIMS, 323 stars were observed by IUE with better SNRs , and the remaining 139 stars were observed by other missions, such as UVSST and SKYLAB, but with lower quality than the FIMS. Figure 3 indicates the locations of the 532 stars observed by FIMS plotted on the all-sky exposure time map.
2.3 Step 3: Correction of effective areas
Accurate calibration of the effective areas as a function of wavelength is necessary in order to obtain reliable stellar spectra because the detector sensitivity degrades over time. The FIMS observed standard stars three times for this purpose: a white dwarf G191-B2B and a B5V-type star HD 188665 were observed in December 2003, February 2004, and August 2004. These observations were compared with the reference spectra obtained previously by HUT, and the effective areas were obtained (Kim et al., 2004). In order to confirm these calibration results, we used the IUE stars and recalculated the effective areas. The IUE reference stars were selected according to the following criteria:
-
1.
Single stars,
-
2.
Average SNR of the FIMS observation was greater than 7.0,
-
3.
B-type stars, in which spectrum was nearly flat without strong absorption features over the FUV wavelength range corresponding to the FIMS L-band, and
-
4.
Flux difference between the IUE and TD1 observations was below 5.
O-type stars were excluded because of a large number of strong absorption lines in the FUV passband, and A-type stars were also excluded because of their weak fluxes at short wavelengths. B-type stars were therefore adopted for the reference stars, though some B-type stars (especially supergiants) may still show stellar absorption lines. The New Spectral Image Processing System (NEWSIPS; Nichols & Linsky, 1996) dataset of the IUE Final Archive, which was retrieved through the FTP site333ftp://archive.stsci.edu/pub/iue/data, was used in the present analysis. In particular, the data observed with a short wavelength camera (1150–1980 Å), taken in the observational mode with a high dispersion and large aperture, was used. A total of 28 stars were selected as the IUE reference stars and are listed in Table 1.
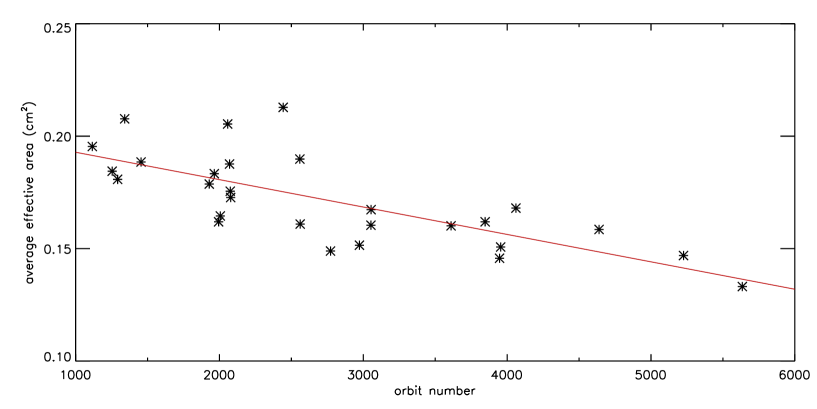
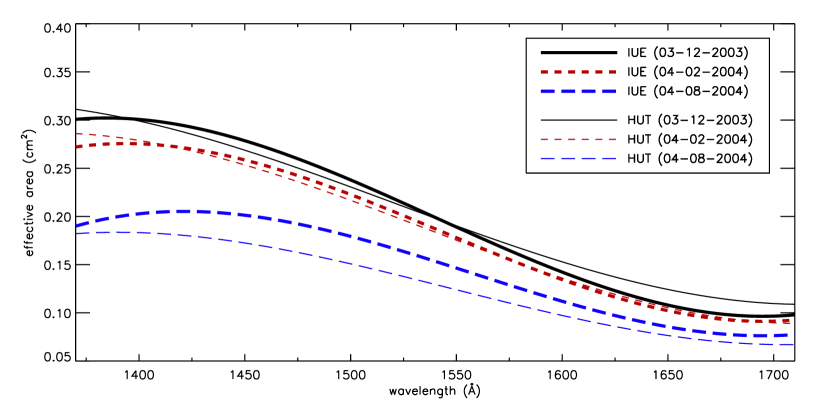
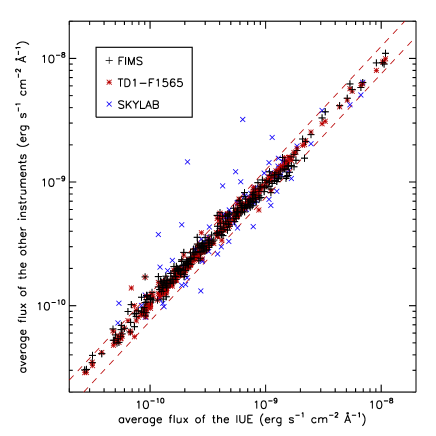
We calculated the FIMS effective areas for the 28 IUE stars by dividing the average FIMS photon count rates per unit wavelength (photons s-1 Å-1) by the average IUE fluxes (photons s-1 cm-2 Å-1) for the spectral range from 1370 to 1710 Å and plotted them as a function of the orbit number, which can be converted into time. Figure 4 depicts the result, which clearly shows that the FIMS effective area decreased in time. We fitted the plot using a linear function of the orbit number, as denoted by the solid red line. Figure 5 presents the final results of the effective area model for three representative orbits, which are compared with the HUT-based calibration. As can be seen in the figure, the IUE-based effective areas are in good agreement with the HUT-based calibration, except the one corresponding to the 4 August 2004 observation, which shows a larger effective area compared to that of the HUT-based calibration. However, we believe that the IUE-based calibration is statistically more reliable since it is based on many stars, and the HUT-based calibration is based on only two stars with limited observations (Kim et al., 2004). Figure 4 shows fluctuations in the estimated effective area based on the stars observed even at similar epochs, and we believe such fluctuations are the reason for the HUT-based curve of 4 August 2004 being lower than that based on the IUE stars. The fluctuations could be due to statistical variation, stellar variability, higher Earth-background, or any instrumental failure. We further confirmed the result of estimation of effective areas by comparing the calibrated FIMS fluxes averaged over 1370–1710 Å with the averaged IUE fluxes over the same wavelength band for all of the available 323 stars, as shown in Figure 6. It is seen that the two fluxes are in good agreement with each other within a 25 error for more than 92 of the stars.


| HD | R.A. | Decl. | l | b | FIMS | FIMS | FIMS | SpType | SpType ref | Comment |
|---|---|---|---|---|---|---|---|---|---|---|
| ID | (deg) | (deg) | (deg) | (deg) | Flux444units: erg s-1 cm-2 Å-1 | S/N | Exp555units: sec | (Skiff, 2014) | (Skiff, 2014) | |
| (1) | (2) | (3) | (4) | (5) | (6) | (7) | (8) | (9) | (10) | (11) |
| 76728 | 133.8 | -60.6 | 277.7 | -10.0 | 5.15E-10 | 15.0 | 37.6 | B8II | Garrison & Gray (1994) | UVSST SKYLAB |
| 69302 | 123.6 | -45.8 | 262.0 | -6.2 | 3.17E-10 | 14.2 | 76.5 | B2IV | Houk (1978) | UVSST SKYLAB |
| 70839 | 125.3 | -58.0 | 272.9 | -11.9 | 2.04E-10 | 8.0 | 37.3 | B2V | Cucchiaro et al. (1976) | UVSST |
| 83944 | 144.8 | -61.3 | 281.9 | -6.6 | 2.10E-10 | 7.4 | 29.6 | B9V | Zorec et al. (2009) | SKYLAB |
| 84567 | 146.3 | -30.2 | 261.8 | 17.5 | 1.38E-10 | 5.1 | 19.2 | B0IV | Houk (1982) | FIMS only |
| 65176 | 119.4 | -1.6 | 222.1 | 13.9 | 3.29E-11 | 3.4 | 33.1 | B1.5Ib/IIep | Schmidt-Kaler (1967) | FIMS only |


3 Results and Discussion
We present the statistics and several representative spectra of the bright stars catalogued by the FIMS in this section. In Figure 6, the fluxes of the FIMS, TD1-F1565, and SKYLAB are compared with those of the IUE; all are averaged in the same manner over similar wavelength ranges for 323 stars observed by the IUE with a large aperture mode. More than 92 of the FIMS fluxes, denoted by black plus (+) symbols, agree well with those of the IUE within the FIMS systemic error of 25 (Edelstein et al., 2006b). The TD1-F1565 fluxes, marked with red asterisk symbols, also agree well with those of IUE within a 25 error for 96 of the 323 stars. However, large fluctuations are seen in the SKYLAB fluxes, marked with blue cross () symbols; only 65 of 86 stars observed by SKYLAB show fluxes comparable to those of the IUE within a 25 error.
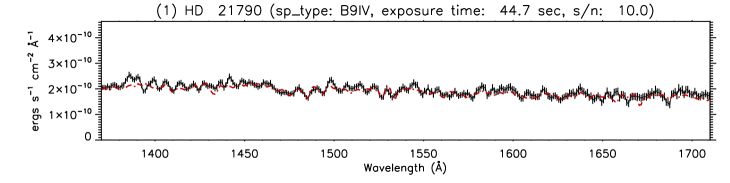
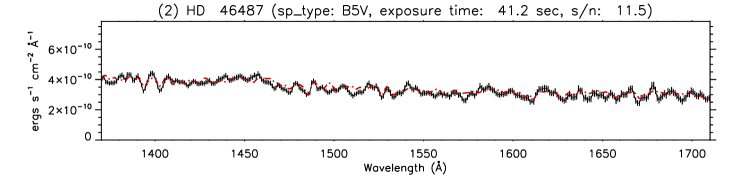
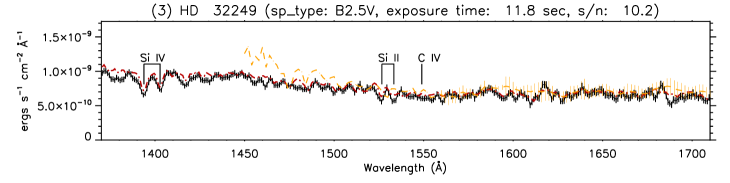
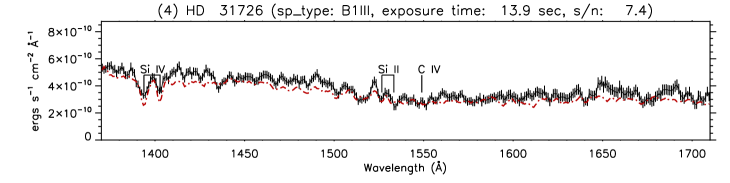
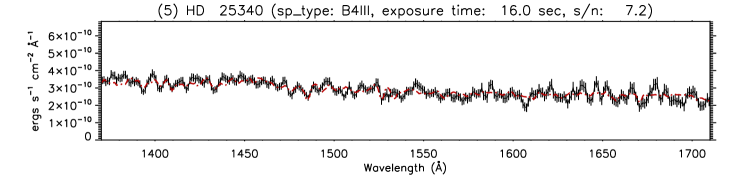
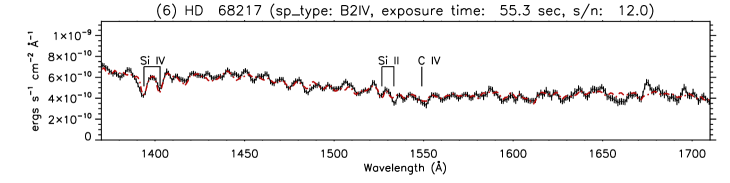
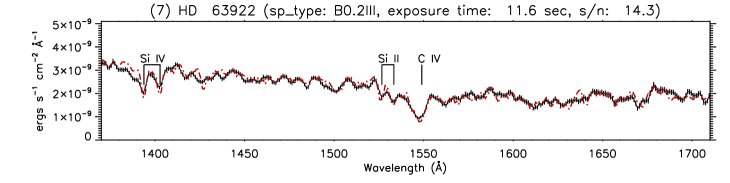
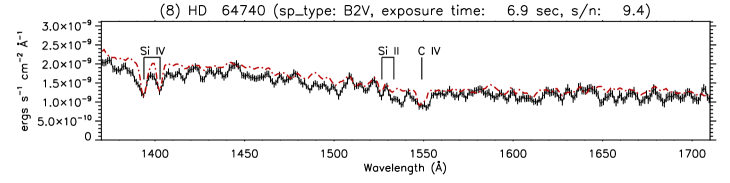
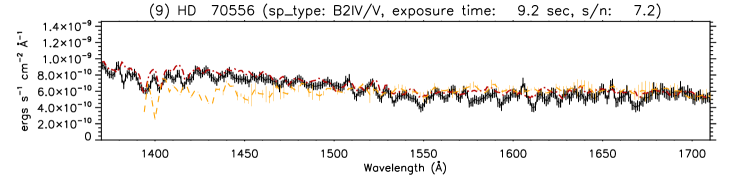
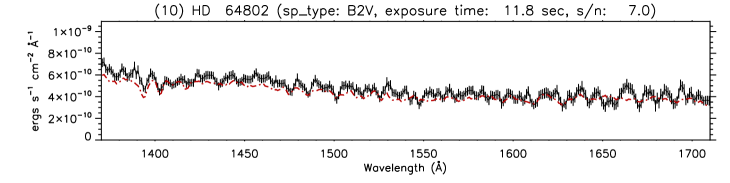
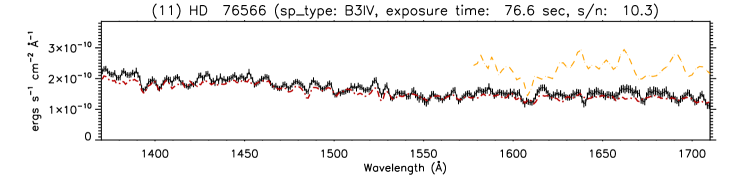
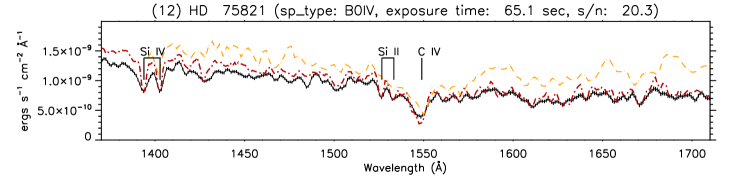
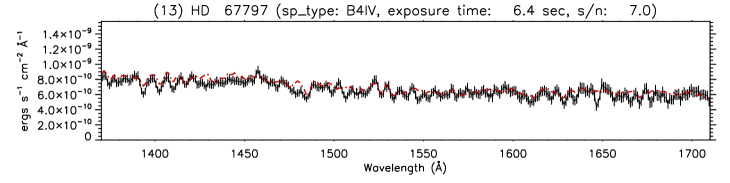
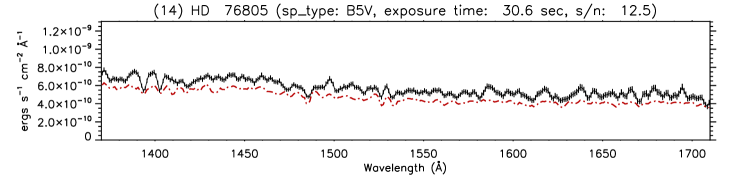
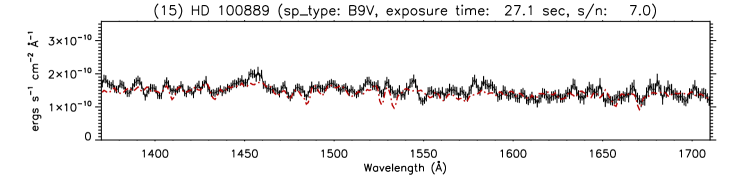
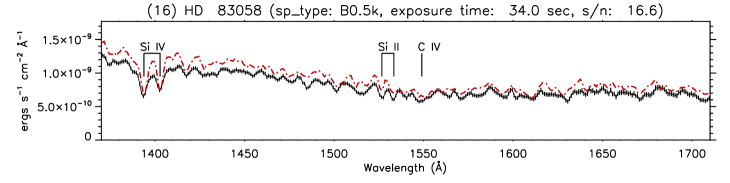
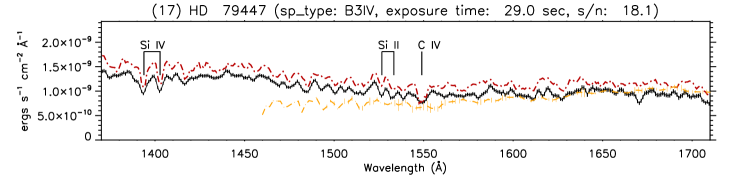
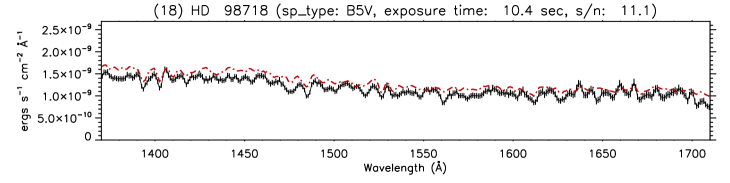
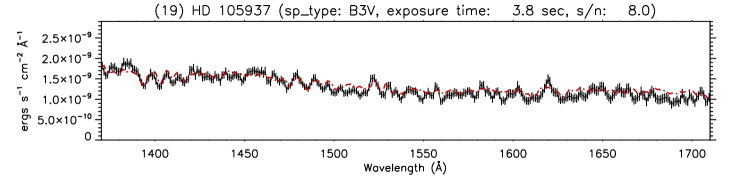
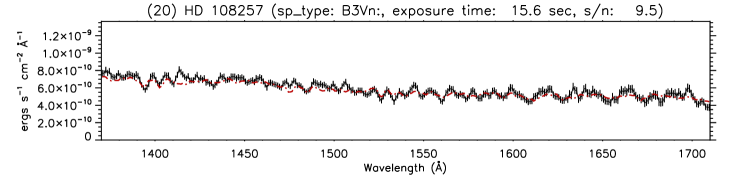
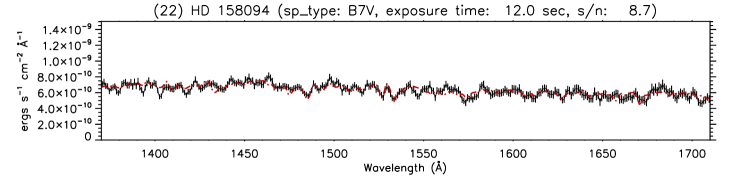
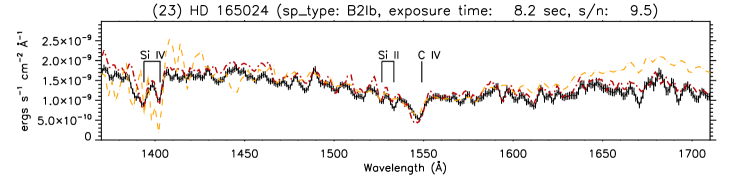
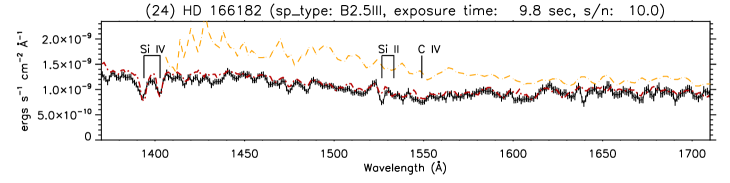
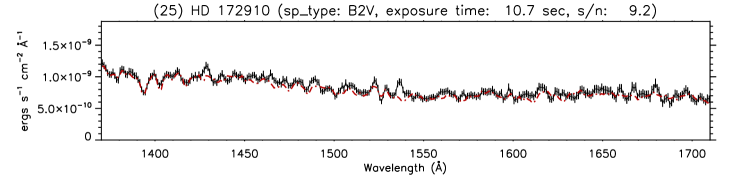
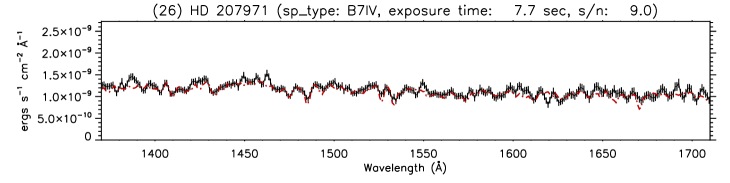
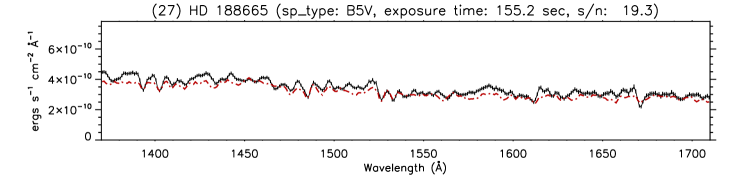
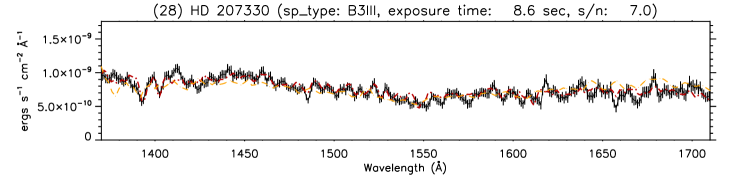
In order to verify the FIMS spectra after the correction of effective area, they are compared in Figure 7 with the IUE spectra for the 28 stars listed in Table 1, together with the available SKYLAB spectra. The black solid lines, dash-dotted red lines, and dashed orange lines indicate the FIMS, IUE, and SKYLAB spectra, respectively. The FIMS spectra are seen to match well with the corresponding IUE spectra. For some stars, such as (14) HD 76805, (16) HD 83058, (17) HD 79447, and (18) HD 98718, the flux levels between the FIMS and the IUE observations show discrepancies due to the fluctuation in the effective area but they are all within 25 of the FIMS systematic error range (Edelstein et al., 2006b). The prominent absorption lines of early-type stars, such as C iv 1548, 1551 and Si iv 1394, 1403 features, are clearly seen in the FIMS spectra. However, narrower lines, such as Si ii∗ 1527, 1533, are less clear in the FIMS spectra than in the IUE spectra because of the variation of spectral resolution across the detector. The SKYLAB spectra show large deviation from the corresponding IUE and FIMS spectra. This demonstrates the superior quality of FIMS data compared to those of SKYLAB.
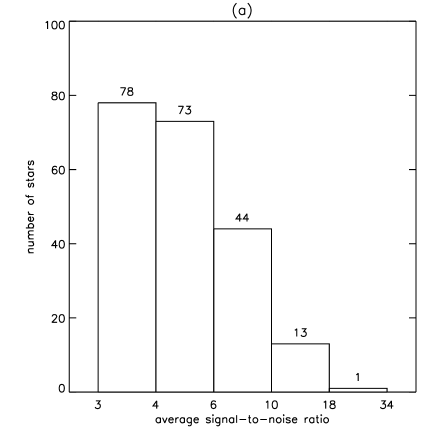
Figure 8 presents statistics for the 209 stars of the FIMS catalogue, excluding those observed by the IUE. Figures 8(a) to 8(d) are histograms of the average SNR per angstrom, exposure time, spectral type, and luminosity class, respectively. The figures illustrate that, of the 209 catalogue stars, the spectra of 58 stars had high SNRs above 6.0. Most of these were bright stars observed with longer exposure times than the average of 20 s. The stellar spectral type of catalogue stars ranged from O9 to A3; 115 of these stars are main sequence stars, 28 are subgiant stars, 48 are normal giant stars, 5 are bright giant stars, and 13 are unknown. The stars with spectral types beyond A4 were not analysed with a sufficient SNR because their flux level was weak in the FUV band due to the low surface temperature; hence, they have been excluded from the catalogue.
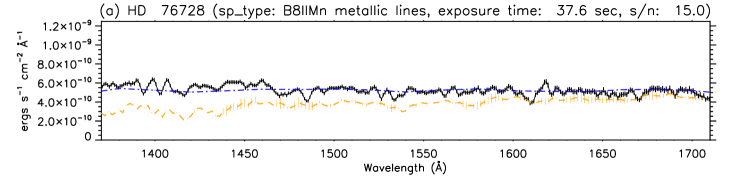
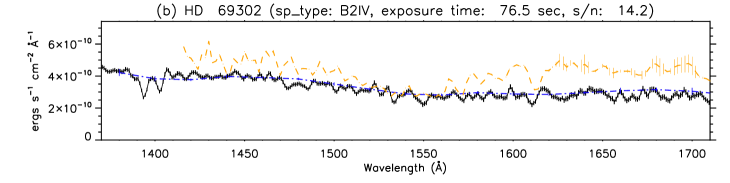
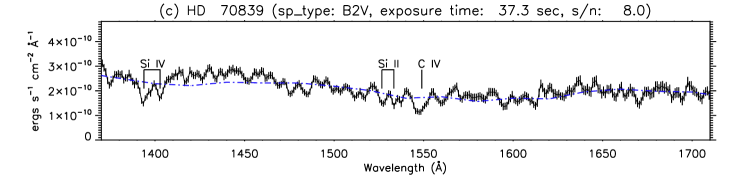
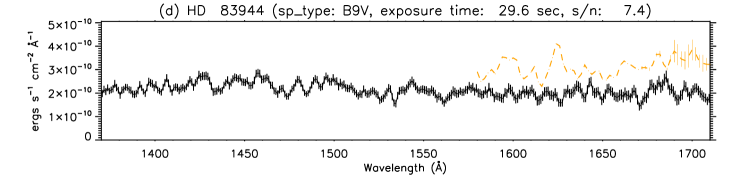
For the stars listed in Table 2, example spectra are plotted in Figure 9 in order to compare the FIMS spectra with the previous observations of UVSST and SKYLAB. The example spectra were arbitrarily chosen and displayed in decreasing order of SNR to show variation of the spectral quality. The FIMS spectra are indicated using solid black lines in the figure. It is seen that the UVSST spectra, marked with dash-dotted blue lines in Figures 9(a) to 9(c) agree well with the FIMS spectra; however, the absorption features are not resolved in the UVSST spectra due to the low spectral resolution of 35 Å. The SKYLAB spectra, which are marked using dashed orange lines in Figures 9(a), 9(b), and 9(d), have a similar spectral resolution to that of the FIMS spectra. However, as seen in Figure 6, the flux levels of the SKYLAB spectra deviate significantly from those of the IUE spectra while the FIMS flux levels are more or less consistent with the IUE observations. Hence, we believe that the FIMS spectra are more reliable than the SKYLAB spectra. Figures 9(e) and 9(f) show two examples observed by the FIMS only. Strong absorption lines including Si iv, Si ii∗, and C iv lines are seen in both spectra even though the SNR is low in the case of Figure 9(f). According to the SIMBAD database, the spectral type of HD 65176, shown in Figure 9(f), is A0. It should be noted that the corresponding spectrum of A0 is not expected to have such prominent absorption features in the Si iv and C iv lines. We will discuss this discrepancy in the following text.
Finally, we would like to discuss possible applications of the FIMS catalogue. The FUV wavelength band covered by the FIMS includes many ion lines associated with hot and warm gases. Hence, as can be seen in Figure 9, the prominent ion absorption lines such as C iv 1548, 1551 and Si iv 1394, 1403 can be used to confirm the spectral classes for early-type stars. For instance, strong Si iv absorption features shown in Figure 9(e) indicate that HD 84567 is a supergiant or giant star with a higher mass-loss rate rather than a subgiant (see Bianchi & Garcia, 2002). On the other hand, the measured slope (-0.67) after reddening correction is consistent with -0.66 estimated from the Skiff’s spectral type of B0IV. Another example is HD 65176, which is classified to be A0 in the SIMBAD database. However, the deep absorption features shown in Figure 9(f) suggest that the star is an early B-type as assigned to be B1.5Ib/IIep in Skiff (2014)666http://vizier.u-strasbg.fr/viz-bin/VizieR?-source=B/MK. Furthermore, we note that the spectral shape changes significantly in this wavelength band as the spectral type changes for the early-type stars. We, therefore, used the spectral classification of Skiff (2014) in this paper. As discussed below, this property can be used to confirm or identify the spectral classes and even estimate the interstellar extinction in UV wavelengths (e.g., the FUV rise; Fitzpatrick & Massa, 1988), which cannot be inferred from optical and near infrared observations, if the spectral type of the target star is correctly identified because the interstellar extinction is strongly wavelength-dependent over this wavelength range.
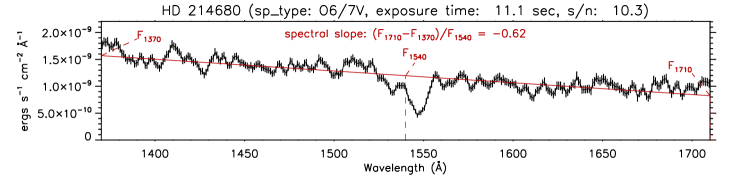
First, let us define the spectral slope. The spectral slope is calculated from a linear fit over the whole wavelength range from 1370 Å to 1710 Å, as shown in Figure 10 for the example star, HD 214680. It is defined as follows:
| (4) |
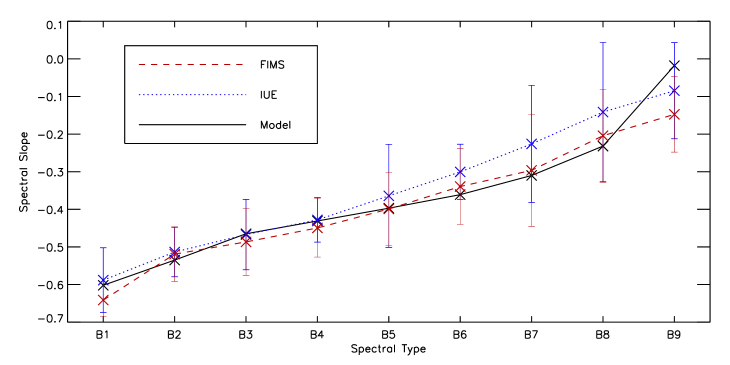
where , , and are the flux values obtained from the linear fit at wavelengths of 1710, 1370, and 1540 Å, respectively. We obtained the average spectral slope for each stellar spectral type based on the Skiff (2014) from B1 to B9 with 20 stars for each spectral type. The E(B-V) colour excess was estimated using the intrinsic colour index (B-V)0 of Fitzgerald (1970) and the observed colour index (B-V) of the SIMBAD database. We selected only those stars with colour excess E(B-V) 0.05, corresponding to an optical depth of 0.35 at 1540 Å, and performed reddening correction using the colour excess. The extinction law was adopted from Weingartner & Draine (2001) with RV = 3.1. We compared the spectral slopes estimated from the FIMS to those of the IUE and a stellar synthetic model. The theoretical model spectra were calculated through interpolation on a grid of the Kurucz model (Castelli & Kurucz, 2003) using the effective temperature and gravity calibration given in Straiys & Kuriliene (1981). Figure 11 shows the results of the spectral slopes. The three spectral slopes estimated from the FIMS, IUE, and a theoretical model are in good agreement, indicating that the spectral slope is steeper in earlier spectral types, as expected. The statistical errors, especially the large ones, may stem from the misidentification of the spectral type. The sub-classification of the spectral type contributes in part to the error. A large source of the uncertainty would be the SIMBAD’s photometry and colors. There are additional sources of uncertainty to the spectral slope. We assumed a constant , which in fact varies from a sightline to sightline, in performing reddening correction. Another non-negligible source might be the uncertainty in the calibration of the effective temperature and gravity. The calibration used in this paper is based on evolutionary models and thereby subject to their intrinsic errors (e.g., Herrero et al., 1992).
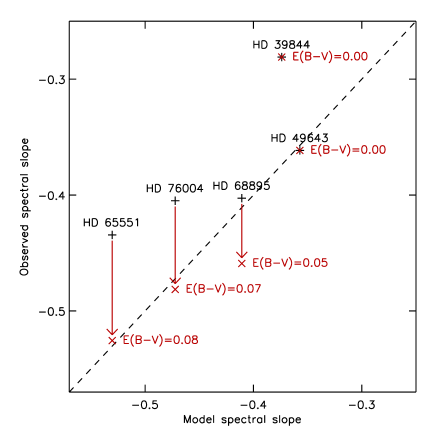
Figure 12 shows some examples of how the spectral slopes in Figure 11 can be used for the identification of the spectral type. In Figure 12, the black plus (+) symbols indicate the spectral slopes before reddening correction and the red cross () symbols indicate those after correction. The sources in the figure were arbitrarily chosen. We see that the spectral slopes of HD 65551, HD 76004 and HD 49643 are consistent with the model spectral slopes when the reddening correction is taken into account. On the other hand, the spectral slopes of HD 68895 and HD 39844 are very different from the corresponding model spectral slopes. The spectral slope of HD 68895 after correction, estimated from the FIMS spectrum, is -0.46 while the model spectral slope corresponding to the spectral type of B5V (Houk, 1978) is -0.41. This spectral slope of -0.46 is more consistent with B3V (Cucchiaro et al., 1976) or B4V than B5V if the reddening correction is correct. If the spectral type of B5V is correct, the colour excess need to be changed to E(B-V)=0.01, or RV should be larger than 3.1. In the same way, the spectral slope of HD 39844 indicates that its spectral type is more consistent with B7V or B8V than with the spectral type of B6V (Cucchiaro et al., 1977) if the interstellar extinction is negligible. On the other hand, if the spectral type of B6V is correct, the colour excess needs to be changed to E(B-V)=0.08, or RV should be smaller than 3.1 for E(B-V) to be less than 0.08.
4 Concluding Remarks
We extracted the L-band (1370–1710 Å) spectra for 532 stars observed using the FIMS during its mission lifetime of one and a half years, which covered approximately 84% of the sky. Of these stars, 323 were also observed by the IUE with higher signal-to-noise ratios than the FIMS; hence, these data were used to validate the FIMS spectra. The remaining 209 stars were compiled as a catalogue: 70 stars were observed by the FIMS for the first time and 139 stars were observed previously by UVSST and/or SKYLAB. We included these 139 stars in the catalogue because we believe the FIMS spectra provide better spectral resolution and/or higher reliability than the previous observations. The catalog contains only the stars whose spectra meet the criterion of average SNRs per angstrom higher than 3.0. The full spectra of the 209 catalogue stars observed by the FIMS can be downloaded from the KASI website777http://ysjo.kasi.re.kr.
Acknowledgments
FIMS/SPEAR is a joint project of KAIST (Korea), KASI (Korea), and UC Berkeley (USA), funded by the Korean MOST and NASA (grant NAG5-5355). K.-W. Min acknowledges the support by the National Research Foundation of Korea through its Grant No. NRF 2012M1A3A4 A01056418.
References
- Abt & Cardona (2011) Abt H. A., Cardona O. 1983, ApJ, 272, 182
- Ayres (2010) Ayres T. R. 2010, ApJS, 187, 149
- Bertone & Chavez (2011) Bertone E., Chavez M. 2011, Ap&SS, 335, 69
- Bianchi & Garcia (2002) Bianchi L., Garcia M. 2002, ApJ, 581, 610
- Boggess et al. (1978) Boggess A. et al. 1978, Nature, 275, 372
- Boksenberg et al. (1973) Boksenberg A. et al. 1973, MNRAS, 163, 291
- Brandt et al. (1994) Brandt J. C. et al. 1994, PASP, 106, 890
- Castelli & Kurucz (2003) Castelli F., Kurucz R. L. 2003 (IAU Symposium 210, Modelling of Stellar Atmospheres, Uppsala, Sweden, eds. N.E. Piskunov, W.W. Weiss. and D.F. Gray, 2003, ASP-S210)
- Cucchiaro et al. (1976) Cucchiaro A., Jaschek M., Jaschek C., Macau-Hercot D. 1976, A&AS, 26, 241
- Cucchiaro et al. (1977) Cucchiaro A., Macau-Hercot D., Jaschek M., Jaschek C. 1977, A&AS, 30, 71
- Davidsen et al. (1992) Davidsen A. F. et al. 1992, ApJ, 392, 264
- Edelstein et al. (2006a) Edelstein J. et al. 2006a, APJL, 644, L153
- Edelstein et al. (2006b) Edelstein J. et al. 2006b, APJL, 644, L159
- Fitzgerald (1970) Fitzgerald M. P. 1970, A&A, 4, 234
- Fitzpatrick & Massa (1988) Fitzpatrick E. L., Massa D. 1988, ApJ, 328, 734
- Garrison & Gray (1994) Garrison R. F., Gray R. O. 1994, AJ, 107, 1556
- Gorski et al. (2005) Gorski K. M., Hivon E., Banday A. J., Wandelt B. D., Hansen F. K., Reinecke M., Bartelmann M. 2005, APJ, 622, 759
- Green et al. (2012) Green J. C. et al. 2012, ApJ, 774, 1
- Henize et al. (1975) Henize K. G., Wray J. D., Parsons S. B., Benedict G. F., Bruhweiler F. C., Rybski P. M., OĆallaghan F. G. 1975, APJL, 199, L119
- Henize et al. (1979) Henize K. G., Wray J. D., Parsons S. B., Benedict G. F. 1979, Catalog of Far-Ultraviolet Objective-Prism Spectrophotometry: SKYLAB Experiment S-019, Ultraviolet Stellar Astronomy (NASA Ref. Publ. 1031; Washington: NASA)
- Herrero et al. (1992) Herrero A., Kudritzki R. P., Vilchez J. M., Kunze D., Butler K., Haser S. 1992, A&A, 261, 209
- Hill & Lynas-Gray (1977) Hill P. W., Lynas-Gray A. E. 1977, MNRAS, 180, 691
- Houk (1978) Houk N. 1978, Michigan Catalogue of Two-Dimensional Spectral Types for the HD Stars. Volume 2. (Ann Arbor, MI: Univ. Michigan Press)
- Houk (1982) Houk N. 1982, Michigan Catalogue of Two-Dimensional Spectral Types for the HD Stars. Volume 3. (Ann Arbor, MI: Univ. Michigan Press)
- Humphries et al. (1976) Humphries C. M., Jamar C., Malaise D., Wroe H. 1976, A&A, 49, 389
- Jamar et al. (1976) Jamar C., Macau-Hercot D., Monfils A., Thompson G. I., Houziaux L., Wilson R. 1976, Ultraviolet Bright Star Spectrophotometric Catalogue (ESA Special Report 27; Paris: ESA)
- Jenkins et al. (1996) Jenkins E. B., Reale M.A., Zucchino P.M., Sofia U.J., 1996, Ap&SS, 239, 315
- Kim et al. (2004) Kim I.-J., Seon K.-I., Yuk I.-S., Nam U.-W., Jin H., Park J.-H. 2004, JASS, 21, 383 (JASS: Journal of Astronomy and Space Science)
- Korpela et al. (2006) Korpela E. J. et al. 2006, APJL, 644, L163
- Kruk et al. (1995) Kruk J. W., Durrance S. T., Kriss G. A., Davidsen A. F., Blair W. P., Espey B.R., Finley D. S. 2006, APJL, 454, L1
- Moos et al. (2000) Moos H.W. et al. 2000, ApJL, 538, L1
- Morrissey et al. (2007) Morrissey P. et al. 2007, ApJS, 173, 682
- Nichols & Linsky (1996) Nichols J. S., Linsky J. L. 1996, AJ, 111, 517
- Reed (2003) Reed, B. C. 2003, AJ, 125, 2531
- Rogerson et al. (1973) Rogerson J. B., Spitzer L., Drake J. F., Dressler K., Jenkins E.B., Morton D.C., York D.G. 1973, ApJL, 181, L97
- Sahnow et al. (2000) Sahnow D. J. et al. 2000, ApJL, 538, L7
- Schmidt-Kaler (1967) Schmidt-Kaler T. 1967, PASP, 79, 181
- Skiff (2014) Skiff B. A. 2014, VizieR Online Data Catalog, 1, 2023
- Snow & Jenkins (1977) Snow T. P., Jr., Jenkins E. B. 1977, ApJS, 33, 269
- Straiys & Kuriliene (1981) Straiys V., Kuriliene G. 1981, Ap&SS, 80, 353
- Thompson et al. (1978) Thompson G. I., Nandy K., Jamar C., Monfils A., Houziaux L., Carnochan D. J., Wilson R. 1978, Catalogue of Stellar Ultraviolet Fluxes (TD1): A Compilation of Absolute Stellar Fluxes Measured by the Sky Survey Telescope (S2/68) Aboard the ESRO Satellite TD-1 (London: The Science Research Council)
- Weingartner & Draine (2001) Weingartner J. C., Draine B. T. 2001, ApJ, 548, 296
- Woodgate et al. (1998) Woodgate B. E. et al. 1998, PASP, 110, 1183
- Zorec et al. (2009) Zorec J., Cidale L., Arias M. L., Fremat Y., Muratore M. F., Torres A. F., Martayan C. 2009, A&A, 501, 297