Origin of the Resistivity Anisotropy in the Nematic Phase of FeSe
Abstract
The in-plane resistivity anisotropy is studied in strain-detwinned single crystals of FeSe. In contrast to other iron-based superconductors, FeSe does not develop long-range magnetic order below the nematic/structural transition at 90 K. This allows for the disentanglement of the contributions to the resistivity anisotropy due to nematic and magnetic orders. Comparing direct transport and elastoresistivity measurements, we extract the intrinsic resistivity anisotropy of strain-free samples. The anisotropy peaks slightly below and decreases to nearly zero on cooling down to the superconducting transition. This behavior is consistent with a scenario in which the in-plane resistivity anisotropy in FeSe is dominated by inelastic scattering by anisotropic spin fluctuations.
pacs:
74.70.Xa, 72.15.-v, 74.25.LdElectronic nematicity has emerged as a key concept in iron-based superconductors since the observation of in-plane resistivity anisotropy in stress-detwinned crystals of Co-doped BaFe2As2 detwinning ; Fisher1 . The fact that the resistivity anisotropy is much larger than what is expected from the small lattice distortion led to the proposal that the tetragonal-to-orthorhombic transition in the iron pnictides is driven not by phonons, but by an electronic nematic phase. Subsequent experiments revealed an intricate dependence of the resistivity anisotropy on doping (a sign change between electron- and hole- doped materials Fisher1 ; Chen ; ErickNature ; Chen2 ; Miyasaka ), and disorder Uchida ; Fisher14 , sparking hot debates about its microscopic origins (see Refs. [FisherReview, ; FernandesNaturereview, ] for reviews).
Electronic contributions involved in the in-plane resistivity anisotropy FernandesNaturereview can be separated into the Drude weight and/or of the scattering rate anisotropies. Fermi-surface anisotropies arising, for instance, from the ferro-orbital order triggered at the nematic transition, affect mostly the Drude weight Devereaux10 ; Phillips11 ; Dagotto12 . Anisotropic scattering, can be due to elastic processes, such as the development of local magnetic order around an impurity Davis13 ; Andersen , or inelastic processes, such as the scattering of electrons by anisotropic magnetic fluctuations Rafaelcalc ; Timm14 known to exist below Dai14 . Recent stress-dependent optical reflectivity studies in Co-doped BaFe2As2 point to a dominant effect of the Drude weight Mirri2014 ; Mirri2015 . However, stripe magnetic order appearing at the magnetic transition severely complicates the analysis. This is because the magnetic state breaks tetragonal symmetry leading to an anisotropic reconstruction of the Fermi surface Uchida ; Valenzuela10 and to the appearance of “Dirac cones” Dirac , which may dramatically alter the resistivity anisotropy Fisherdiracnematicity . Disentangling these contributions is fundamental to reveal the origin of the resistivity anisotropy and, consequently, of the nematic state.
In this context, the stoichiometric FeSe FeSe is an ideal system. It is rather clean (residual resistivity ratios as high as 50 rrrFeSe ) and its orthorhombic/nematic phase transition at K is not accompanied by a long-range magnetic order McQueen2009 eliminating effects of Fermi surface folding.
In this Letter we report the resistivity anisotropy measured in strain-detwinned single crystals of FeSe. Upon cooling, the anisotropy ( and are the resistivities along the orthorhombic and directions) initially increases, reaching a maximum at about 20 K below , and then nearly vanishes upon further cooling towards the superconducting transition 8.5 K. This pronounced non-monotonic behavior is consistent with the scenario in which the main contributor to the resistivity anisotropy is inelastic scattering by magnetic fluctuations rather than the anisotropy of the elastic scattering or of the Fermi surface. To support this conclusion, we performed model calculations of resistivity anisotropy for the scattering of electrons by anisotropic magnetic fluctuations. We find that the anisotropy is well described by the product of two temperature-dependent functions, . The standard nematic order parameter, , increases upon cooling and the scattering function, , decreases and vanishes as the temperature approaches zero.
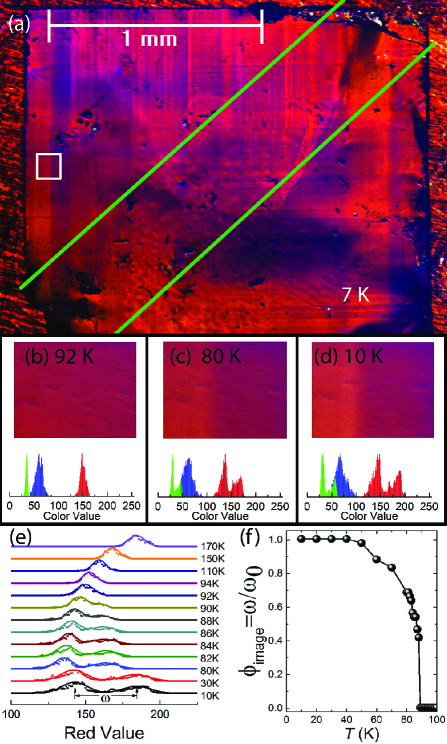
Single crystals of FeSe (1 mm2 surface area and 20 to 150 m thick) were grown using a modified chemical vapor transport as in Ref. Boehmer2013, . Polarized light optical imaging imaging ; detwinning was used to characterize the orthorhombic domain pattern appearing below as shown in Fig. 1. In the orthorhombic phase, the optical bireflectance is anisotropic, which permits visualization of domains of different orientations. In addition to direct imaging, we extract the nematic order parameter from the temperature evolution of the color intensity in a small and clean area of the sample (white box in Fig.1(a)), using a decomposition in red, blue and green (RGB) channels stress . The intensity histograms of the RGB channels are shown in Figs.1(b), (c), (d). Above the image is of uniform color, manifesting as single peaks in the histograms (panel (b)). Below the domains of different colors lead to peak splitting in the histograms, most pronounced in the red channel (Figs.1(c), (d)). The temperature evolution of the red channel histogram is shown in panel (e). The peak splitting, , signaling the breaking of tetragonal symmetry, was determined using a fit to two gaussians and the normalized nematic order parameter, defined as , is shown in Fig.1(f).
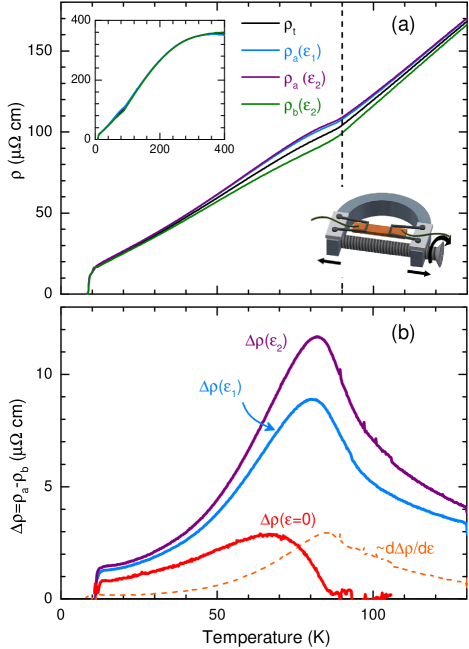
Samples for mechanical detwinning were cut along the tetragonal [110] direction, which becomes the orthorhombic or axis on cooling, as shown schematically by the green lines in Fig. 1(a). Tensile strain was applied to the sample through 50 Ag wires also used as potential leads, inset in Fig. 2(a). Wires for current contacts were mounted strain-free. All contacts were In - soldered. Figure 2(a) shows the resistivity of the FeSe sample measured in the strain-free twinned state, , and in the detwinned state achieved by application of tensile strain of two different magnitudes, and . is controlled by pulling apart the arms of the horseshoe device. In the strain-free, twinned state shows only a small kink at . The sample is split into approximately equal areas of domains of two orientations, so its resistivity is . Together with the measurements in detwinned samples, this allows us to extract the resistivity along the orthorhombic axis, , and the in-plane anisotropy, , shown in Fig. 2(b) for two strain values. The anisotropy increases markedly on cooling, evolves smoothly through and peaks below . On further cooling it decreases reaching small values at . Note that , i.e., the resistivity is larger along the direction, thus having the same sign as that of FeTe FeTe and hole-doped BaFe2As2 compounds ErickNature , and opposite to electron-doped and isovalently substituted BaFe2As2 detwinning ; Fisher1 ; detwinningPdoped .
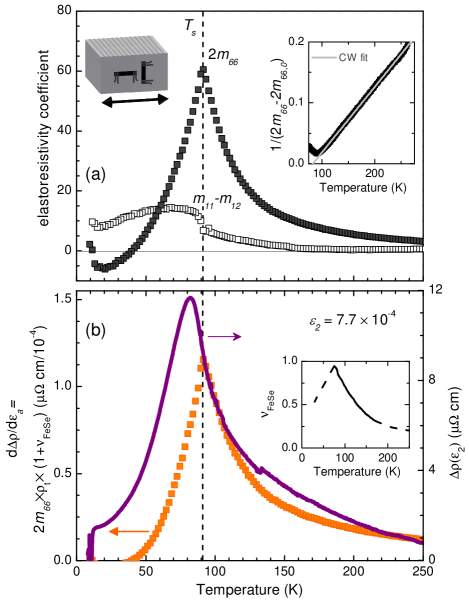
The application of strain not only promotes the formation of orthorhombic domains of only one orientation below , but it also induces resistivity anisotropy above and below due to the elastoresistivity of the material. Figure 3(a) shows the elastoresistivity coefficients 2 and measured using a piezo-based setup, similar to that described in Refs. [Chu2012, ; nematicsusceptibility, ]. Samples of approximate dimensions, 10.30.07 mm3, were glued to one side of a piezostack, shown in the left inset in Fig. 3(a). The change of sample resistance was measured as a function of anisotropic strain, monitored in situ using crossed strain gauges glued to the opposite side of the piezostack. The elastoresistivity coefficient corresponds to the normalized derivative of with respect to the orthorhombic shear strain , nematicsusceptibility . It clearly diverges on approaching from above (Fig. 3(a)) following almost perfect Curie-Weiss law, with 83 K (right inset in Fig. 3(a)), in qualitative agreement with previous report Watson2015 . The elastoresistivity mode, , “orthogonal” to , is related to the derivative of the resistivity anisotropy between two diagonals of the orthorhombic unit cell, and , with respect to the corresponding shear strain, nematicsusceptibility . This mode does not couple to the nematic order parameter and is, as expected, almost zero above . In the strain-free samples, is expected for and the observed finite resistivity anisotropy is likely a consequence of the applied strain. We therefore compare in Fig. 3(b) the resistivity anisotropy under applied strain , given in this case by , with the elastoresistivity data. Because we use the identity, to transform between strain derivatives. Here, is the Poisson ratio of FeSe calculated from ultrasound data Zvyagina2013 . Clearly, and behave similarly for , explaining experimentally observed tail of above . The scaling yields ( 40% of the distortion in the orthorhombic phase) for the external strain applied through the horseshoe device. Below , samples in the elastoresistivity setup are not fully detwinned, so that the domains dominate the measured , which prohibits such a comparison.
To determine the effect of strain on the resistivity below , we return to the two resistivity curves at constant strain and in Fig. 2(b) obtained using the horseshoe device, which fully detwins the samples. In the linear response regime, we can approximate . The derivative is used to extract the intrinsic resistivity anisotropy between the and directions of a single-domain sample in the absence of external strain, . The constant value of is fixed by enforcing in the tetragonal state. The resulting (red line in Fig. 2(b)) clearly displays a broad maximum 20 K below .
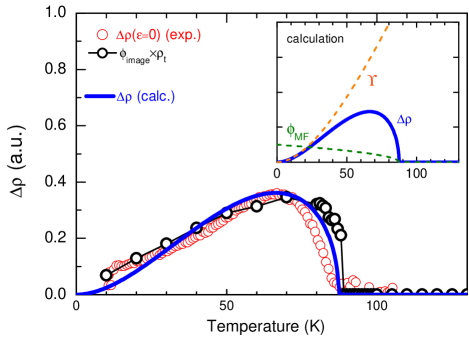
The previous comparison between and reveals that, above , the resistivity anisotropy is proportional to the strain, and therefore to the nematic order parameter . A similar behavior was experimentally observed in the iron pnictides stress . This relationship indeed is more general: because and break the same symmetry, they are generally proportional to each other, i.e. , were is the proportionality factor Chu2012 ; Schutt15 . It is clear from Fig. 1 that displays a standard order-parameter behavior, monotonically increasing upon cooling. In contrast, the resistivity anisotropy, , shows a pronounced peak below and decreases to nearly zero at . This behavior must therefore arise from the temperature-dependence of the proportionality factor, , which should also vanish as , since remains finite and large at . Among the possible microscopic contributions to affecting – anisotropies of Fermi surface, elastic and inelastic scattering rates, only the latter one naturally leads to the observed behavior. Phenomenologically, this is nicely illustrated by using of Fig. 1 as a proxy of , and the resistivity of the twinned sample, , as a proxy of . The latter relies on the assumption that the inelastic scattering also dominates the isotropic transport properties. Indeed, the product , shown by the black symbols in Fig. 4, captures much of the temperature dependence of .
In order to develop a microscopic scenario for this behavior, we consider the three-band model of Ref. Rafaelcalc , in which electrons are scattered by magnetic fluctuations. This model contains one circular hole pocket at the center of the Brillouin zone and two electron pockets centered at momenta and . Below , the onset of nematic order leads to stronger fluctuations at the ordering vector than at , a behavior observed experimentally by the neutron scattering Dai14 . Depending on the relative positions of the hot spots – points of the hole and electron pockets connected by the ordering vectors – one finds or (see also Ref. Timm14 ). Indeed, the change in the positions of the hot spots from hole-doping to electron-doping was argued in Ref. ErickNature as a possible reason for the sign change of . Using the formalism developed in Ref. Rafaelcalc , we perform an expansion of the resistivity anisotropy, finding . Here, we assume to display a mean-field like behavior . The proportionality constant , arising from the scattering of electrons by magnetic excitations, depends on the magnetic correlation length, , and on the Landau damping of the magnetic fluctuations, . In particular, we find , where is a constant that depends on the geometry of the Fermi surface and on the residual resistivity. This leads to , and therefore, the different temperature dependencies of and gives rise to a maximum in below . This behavior is illustrated in Fig. 4, where we plot the calculated for and meV (the product is treated as a fitting parameter to the data). Note that was assumed to be small and temperature-independent above , in agreement with the NMR data Boehmer2015 ; Baek2015 . Below , the onset of nematic order renormalizes and leads to its enhancement Zhang15 , as observed in the same NMR data. The good agreement between the calculated and the measured suggests that the inelastic scattering by anisotropic magnetic fluctuations can explain the experimentally observed non-monotonic temperature-dependence of the in-plane resistivity anisotropy.
In conclusion, the comparison of direct transport and elastoresistivity measurements in FeSe was used to extract the intrinsic in-plane resistivity anisotropy of strain-free samples. Strong non-monotonic temperature dependence, displaying a maximum below and becoming very small as limit was observed. This behavior is explained by anisotropic inelastic scattering as a main contribution to , shedding new light on the origin of nematicity in iron-based superconductors.
Acknowledgements.
The experimental work was supported by the U.S. Department of Energy (DOE), Office of Basic Energy Sciences, Division of Materials Sciences and Engineering. The experimental research was performed at Ames Laboratory, which is operated for the U.S. DOE by Iowa State University under Contract No. DE-AC02-07CH11358. M. S. acknowledges the support from the Humboldt Foundation. R. M. F. is supported by the U.S. Department of Energy, Office of Science, Basic Energy Sciences, under Award No. DE-SC0012336. G. D. was funded by the Gordon and Betty Moore Foundation s EPiQS Initiative through Grant GBMF4411.References
- (1) M. A. Tanatar, E. C. Blomberg, A. Kreyssig, M. G. Kim, N. Ni, A. Thaler, S. L. Bud’ko, P. C. Canfield, A. I. Goldman, I. I. Mazin and R. Prozorov, Phys. Rev. B 81, 184508 (2010).
- (2) J-H. Chu, J. G. Analytis, K. De Greve, P. L. McMahon, Z. Islam, Y. Yamamoto, and I. R. Fisher, Science 329, 824 (2010).
- (3) J. J. Ying, X. F. Wang, T. Wu, Z. J. Xiang, R. H. Liu, Y. J. Yan, A. F. Wang, M. Zhang, G. J. Ye, P. Cheng, J. P. Hu, and X. H. Chen, Phys. Rev. Lett. 107, 067001 (2011).
- (4) E. C. Blomberg, M. A. Tanatar, R. M. Fernandes, I. I. Mazin, Bing Shen, Hai-Hu Wen, M. D. Johannes, J. Schmalian, and R. Prozorov, Nature Comm. 4, 1914 (2013).
- (5) J. Q. Ma, X. G. Luo, P. Cheng, N. Zhu, D. Y. Liu, F. Chen, J. J. Ying, A. F. Wang, X. F. Lu, B. Lei, and X. H. Chen Phys. Rev. B 89, 174512 (2014)
- (6) Tatsuya Kobayashi, Kiyohisa Tanaka, Shigeki Miyasaka, Setsuko Tajima, J. Phys. Soc. Jpn. 84, 094707 (2015).
- (7) Taichi Terashima, Nobuyuki Kurita, Megumi Tomita, Kunihiro Kihou, Chul-Ho Lee, Yasuhide Tomioka, Toshimitsu Ito, Akira Iyo, Hiroshi Eisaki, Tian Liang, Masamichi Nakajima, Shigeyuki Ishida, Shin-ichi Uchida, Hisatomo Harima, and Shinya Uji, Phys. Rev. Lett. 107, 176402 (2011).
- (8) Hsueh-Hui Kuo and Ian R. Fisher, Phys. Rev. Lett. 112, 227001 (2014).
- (9) I. R. Fisher, L. Degiorgi, and Z.X. Shen, Rep. Progr. Phys. 74, 124506 (2011).
- (10) R. M. Fernandes, A. V. Chubukov, J. Schmalian, Nature Phys. 10, 97 (2014).
- (11) C.-C. Chen, J. Maciejko, A. P. Sorini, B. Moritz, R. R. P. Singh, and T. P. Devereaux, Phys. Rev. B 82, 100504 (2010).
- (12) Weicheng Lv and Philip Phillips, Phys. Rev. B 84, 174512 (2011).
- (13) S. Liang, G. Alvarez, C. Sen, A. Moreo, and E. Dagotto, Phys. Rev. Lett. 109, 047001 (2012).
- (14) M. P. Allan, T-M. Chuang, F. Massee, Yang Xie, Ni Ni, S. L. Bud’ko, G. S. Boebinger, Q. Wang, D. S. Dessau, P. C. Canfield, M. S. Golden, and J. C. Davis, Nature Phys. 9, 220 (2013).
- (15) Maria N. Gastiasoro, I. Paul, Y. Wang, P. J. Hirschfeld, Brian M. Andersen, Phys. Rev. Lett. 113, 127001 (2014).
- (16) Rafael M. Fernandes, Elihu Abrahams, and Jörg Schmalian, Phys. Rev. Lett. 107, 217002 (2011).
- (17) Maxim Breitkreiz, Philip M. R. Brydon, and Carsten Timm, Phys. Rev. B 90, 121104(R) (2014).
- (18) Xingye Lu, J. T. Park, Rui Zhang, Huiqian Luo, Andriy H. Nevidomskyy, Qimiao Si, and Pengcheng Dai, Science 345, 657 (2014).
- (19) C. Mirri, A. Dusza, S. Bastelberger, J.-H. Chu, H.-H. Kuo, I. R. Fisher, and L. Degiorgi, Phys. Rev. B 90, 155125 (2014).
- (20) C. Mirri, A. Dusza, S. Bastelberger, M. Chinotti, L. Degiorgi, J.-H. Chu, H.-H. Kuo, and I. R. Fisher, Phys. Rev. Lett. 115, 107001 (2015).
- (21) B. Valenzuela, E. Bascones, and M. J. Calderon, Phys. Rev. Lett. 105, 207202 (2010).
- (22) Khuong K. Huynh, Yoichi Tanabe, and Katsumi Tanigaki, Phys. Rev. Lett. 106, 217004 (2011).
- (23) Hsueh-Hui Kuo, Jiun-Haw Chu, Scott C. Riggs, Leo Yu, Peter L. McMahon, Kristiaan De Greve, Yoshihisa Yamamoto, James G. Analytis, and Ian R. Fisher, Phys. Rev. B 84, 054540 (2011).
- (24) Fong-Chi Hsu, Jiu-Yong Luo, Kuo-Wei Yeh, Ta-Kun Chen, Tzu-Wen Huang, Phillip M. Wu, Yong-Chi Lee, Yi-Lin Huang, Yan-Yi Chu, Der-Chung Yan, Maw-Kuen Wu, Proc Natl. Acad. Sci. U S A. 105, 14262 (2008).
- (25) Shigeru Kasahara, Tatsuya Watashige, Tetsuo Hanaguri, Yuhki Kohsaka, Takuya Yamashita, Yusuke Shimoyama, Yuta Mizukami, Ryota Endo, Hiroaki Ikeda, Kazushi Aoyama, Taichi Terashima, Shinya Uji, Thomas Wolf, Hilbert von Löhneysen, Takasada Shibauchi, and Yuji Matsuda, Proc. Nat. Acad.Sci. 111 16309 (2014).
- (26) T. M. McQueen, A. J. Williams, P. W. Stephens, J. Tao, Y. Zhu, V. Ksenofontov, F. Casper, C. Felser, and R. J. Cava, Phys. Rev. Lett. 103, 057002 (2009).
- (27) A. E. Böhmer, F. Hardy, F. Eilers, D. Ernst, P. Adelmann, P. Schweiss, T. Wolf, C. Meingast, Phys. Rev. B 87, 180505(R) (2013).
- (28) M. A. Tanatar, A. Kreyssig, S. Nandi, N. Ni, S. L. Bud’ko, P. C. Canfield, A. I. Goldman, and R. Prozorov, Phys. Rev. B 79, 180508 (R) (2009).
- (29) E. C. Blomberg, A. Kreyssig, M. A. Tanatar, R. M. Fernandes, M. G. Kim, A. Thaler, J. Schmalian, S. L. Bud’ko, P. C. Canfield, A. I. Goldman, and R. Prozorov, Phys. Rev. B 85, 144509 (2012).
- (30) Juan Jiang, C. He, Y. Zhang, M. Xu , Q. Q. Ge, Z. R. Ye, F. Chen, B. P. Xie, and D. L. Feng, Phys. Rev. B 88, 115130 (2013).
- (31) H.-H. Kuo, James G. Analytis, J.-H. Chu, R. M. Fernandes, J. Schmalian, and I. R. Fisher, Phys. Rev. B 86, 134507 (2012).
- (32) J-H. Chu, H.-H. Kuo, J. G. Analytis, I. R. Fisher, Science 337, 710 (2012).
- (33) Hsueh-Hui Kuo, Maxwell C. Shapiro, Scott C. Riggs, and Ian R. Fisher, Phys. Rev. B 88, 085113 (2013).
- (34) M. D. Watson, T. K. Kim, A. A. Haghighirad, N. R. Davies, A. McCollam, A. Narayanan, S. F. Blake, Y. L. Chen, S. Ghannadzadeh, A. J. Schofield, M. Hoesch, C. Meingast, T. Wolf, and A. I. Coldea, Phys. Rev. B 91, 155106 (2015).
- (35) G. A. Zvyagina, T. N. Gaydamak, K. R. Zhekov, I. V. Bilich, V. D. Fil, D. A. Chareev, and A. N. Vasiliev, Europhys. Lett. 101, 56005 (2013).
- (36) Michael Schütt and Rafael M. Fernandes, Phys. Rev. Lett. 115, 027005 (2015).
- (37) A. E. Böhmer, T. Arai, F. Hardy, T. Hattori, T. Iye, T. Wolf, H. v. Löhneysen, K. Ishida, and C. Meingast, Phys. Rev. Lett. 114, 027001 (2015).
- (38) S. H. Baek, D. V. Efremov, J. M. Ok, J. S. Kim, Jeroen van den Brink, and B. Büchner, Nature Materials 14, 210 (2015).
- (39) Qiang Zhang, Rafael M. Fernandes, Jagat Lamsal, Jiaqiang Yan, Songxue Chi, Gregory S. Tucker, Daniel K. Pratt, Jeffrey W. Lynn, R. W. McCallum, Paul C. Canfield, Thomas A. Lograsso, Alan I. Goldman, David Vaknin, and Robert J. McQueeney, Phys. Rev. Lett. 114, 057001 (2015).