How to bend galaxy disc profiles II: stars surfing the bar in Type-III discs
Abstract
The radial profiles of stars in disc galaxies are observed to be either purely exponential (Type-I), truncated (Type-II) or anti-truncated (Type-III) exponentials. Controlled formation simulations of isolated galaxies can reproduce all of these profile types by varying a single parameter, the initial halo spin. In this paper we examine these simulations in more detail in an effort to identify the physical mechanism that leads to the formation of Type-III profiles. The stars in the anti-truncated outskirts of such discs are now on eccentric orbits, but were born on near-circular orbits at much smaller radii. We show that, and explain how, they were driven to the outskirts via non-linear interactions with a strong and long-lived central bar, which greatly boosted their semi-major axis but also their eccentricity. While bars have been known to cause radial heating and outward migration to stellar orbits, we link this effect to the formation of Type-III profiles. This predicts that the anti-truncated parts of galaxies have unusual kinematics for disc-like stellar configurations: high radial velocity dispersions and slow net rotation. Whether such discs exist in nature, can be tested by future observations.
keywords:
galaxies: kinematics and dynamics – galaxies: formation – galaxies: structure – methods: numerical1 Introduction
1.1 Observed disc breaks
Most late-type galaxies share one common property: an approximately exponential stellar surface density profile (de Vaucouleurs, 1957, 1958; Freeman, 1970) which extends over several scale lengths. As observations reached fainter surface brightness limits, a more diverse picture of late-type morphologies has become apparent: a major portion of such galaxies actually exhibit broken exponential profiles (e. g. van der Kruit, 1979; Pohlen et al., 2004). First, truncated or down-bending disc profiles were discovered (e. g. Pohlen et al., 2002). These discs’ profiles feature a break at a radius outside of which the surface brightness profile is still exponential, but steeper. By contrast, Erwin et al. (2005) observed anti-truncated or up-bending profiles in barred S0-Sb galaxies. The breaks in these galaxies have the opposite behaviour: the slope of the exponential profile outside of the break is shallower than its inner counterpart. Thus stellar disc profiles fall into three different categories:
- Type-I:
-
pure exponential profiles
- Type-II:
-
truncated or down-bending profiles
- Type-III:
-
anti-truncated or up-bending profiles.
Several studies investigated the abundance of each type of disc breaks in different observational samples (e. g. Pohlen & Trujillo, 2006; Erwin et al., 2008; Gutiérrez et al., 2011; Maltby et al., 2012b, 2015) with the result that the relative abundances vary with morphological type. Pohlen & Trujillo (2006) found that pure exponential (Type-I) discs are rather rare (10 %). Head et al. (2015) find that more than 70 % of the galaxies with broken disc profiles in the Coma Cluster have a bar, despite a low bar fraction (about 20 %) in the overall sample. They therefore relate the origin of Type-III profiles to bars. A similar statement has been made by Kim et al. (2014) for Type-II profiles in galaxies with small bulges. Another possible cause for Type-III profiles, dubbed disc fading, are stellar halos which outshine the stellar disc at large radii, although Maltby et al. (2012b, 2015) found that this can only explain a minor fraction of observed Type-III light profiles.
1.2 Theoretical explanations of breaks
The formation of stellar Type-II disc profiles has been studied in numerical models of isolated galaxies (e. g. Debattista et al., 2006; Roškar et al., 2008; Foyle et al., 2008; Minchev et al., 2012). Simulations (Roškar et al., 2008) and analytical models (Dutton, 2009) suggest that the size of the inner disc, i. e. the radial position of the disc break, is related to an upper limit of gas angular momentum in a rotationally supported star forming gaseous disc. In this picture, stars that populate the regions outside the break radius must have been born inside the break. Roškar et al. (2008) showed that radial migration, induced by transient spiral arms (first described by Sellwood & Binney, 2002, hereafter SB02), can move a sufficient number of stars outside the break radius and populate that region. Stars that migrate via this mode are heavily biased to be on near-circular rather than eccentric orbits and to be vertically cool (SB02; Roškar et al., 2012; Solway et al., 2012; Vera-Ciro et al., 2014). An important diagnostic of this mechanism is that the migrated stars preserve their circularity and, hence, the majority of the migrating stars stay on near-circular orbits (see also SB02; Roškar et al., 2012; Solway et al., 2012; Vera-Ciro et al., 2014). This mechanism predicts positive stellar age gradients outside the break in Type-II discs (Roškar et al., 2008). The existence of such age profiles has been confirmed by observed colour profiles (Azzollini et al., 2008; Bakos et al., 2008), spectroscopic observations of NGC 6155 (Yoachim et al., 2010) and by resolved stellar populations (Radburn-Smith et al., 2012). Recent work by Ruiz-Lara et al. (2015) found that positive age gradients in galaxy outskirts are not unique to Type-II discs. They claim that these age profiles are not linked to Type-II profiles but do not rule out stellar migration as a possible mechanism to populate the regions beyond the disc break.
The origin of Type-III disc profiles is still poorly understood. Most of the proposed mechanisms resort to external forces (e. g. Younger et al., 2007; Kazantzidis et al., 2009; Roediger et al., 2012; Borlaff et al., 2014). However, Maltby et al. (2012a) and Head et al. (2015) found no dependence of a galaxy’s disc break type on its environment. This disfavours an external origin of breaks in stellar discs. The first successful attempt to produce Type-III disc profiles in simulations of isolated galaxies was put forward in a preceding letter (Herpich et al., 2015, paper I hereafter).
1.3 Halo spin disc break correlation
In paper I, we analyse a set of controlled simulations of galaxy formation in Milky-Way mass halos with varying initial angular momentum. We found that the type of the profile break correlates with initial host halo spin. Low-spin halos produce Type-III disc profiles, high-spin halos yield Type-II profiles. In a sharp transition between these two regimes (intermediate spin) pure exponential Type-I profiles formed.
In the present paper we present results of a more thorough analysis of the low-spin simulations that were the subject of paper I, i. e. the simulations that formed Type-III profiles. Thus we will only briefly review the properties of the simulations and refer the reader to paper I for a more detailed description.
In this paper we seek a more analytic understanding of how Type-III profiles may form. We start out with a short overview of previous theoretical work on stellar dynamics in non-axisymmetric rotating potential perturbations such as spiral patterns or bars (section 2). In section 3 we quickly review the simulations from paper I. The simulations with the lowest spin will be analysed in more detail and with a particular focus on stellar orbit evolution and bar properties in section 4. There we also identify the physical cause for the formation of Type-III profiles and illustrate it with a simple toy model in section 5. Observational signatures of such Type-III profiles are presented in section 6. Finally, we summarize and discuss our results in section 7.
2 Dynamics in stellar discs
In their landmark work, SB02 show that non-axisymmetric perturbations in the potential (e. g. spiral arms or bars) can drive radial migration of stars in stellar discs. Binney & Tremaine (2008) describe the respective physics in sections 3.3.2 and 3.3.3 which we briefly summarize here.
In such a potential Jacobi’s integral is an integral of motion, i. e. it is constant. It is defined as
| (1) |
where is a test particle’s specific orbital energy and is the -component of the specific angular momentum in a non-rotating frame111We implicitly assume the perturbation to rotate about the -axis.. If and are constant, equation (1) implies that changes in energy are proportional to changes in angular momentum :
| (2) |
It is conceptually useful to plot versus . That plot is commonly referred to as a Lindblad diagram. Given these idealized conditions, equation (2) governs the trajectory of test particles in the Lindblad diagram: it must have a slope that equals the pattern speed . (See Fig. 1 in SB02.)
Trajectories along other slopes in the Lindblad diagram are possible, but such motions cannot be caused by perturbations rotating with a constant pattern speed, such as bars.
SB02 also find that to first order changes in the radial action are proportional to the difference between the pattern speed and the azimuthal angular velocity of the star’s guiding centre :
| (3) |
where and are the radial frequency and mass of the star respectively. Consequently, changes in angular momentum at the corotation resonance (, hereafter CR) do not introduce any radial heating and orbits preserve their circularity in this linear limit.
In a reference frame that is rotating with the spiral perturbation, particles can be ‘trapped’ at the CR. Such particles experience significant oscillations in the radial direction. For an individual transient spiral perturbation, SB02 find that the magnitude of angular momentum changes peaks near the CR and, therefore, a succession of transient spirals with different pattern speeds can cause angular momentum changes in the entire stellar disc. SB02 argue that such spiral perturbations have to be transient because otherwise they would undo the (radial) changes in stellar orbits they caused (see also section III.C.1. in the review by Sellwood, 2014).
Roškar et al. (2012) find that stars may be transported to the CR of another coexisting transient spiral perturbation and therefore may migrate significant distances in a short time without being heated.
Steady (i. e. not transient) rotating perturbations are not expected to modify stellar orbits that are not in resonance with the perturbation (Lynden-Bell & Kalnajs, 1972). Such resonances occur at CR (see above) and at Lindblad resonances, where the frequency at which a star experiences the perturbation equals the absolute value of its radial frequency. is the azimuthal multiplicity of the perturbation. This condition can be satisfied inside and outside of the CR. The corresponding resonances are being referred to as the inner (ILR) and outer Lindblad resonances (OLR). At the Lindblad resonances, orbits will experience radial heating (equation (3)). However, the widely accepted paradigm is that CR are the dominant source of radial motions due to spiral perturbations (SB02). SB02 also find that particles on near circular orbits migrate more efficiently than those on eccentric orbits. This bias has been confirmed in later works by Solway et al. (2012); Vera-Ciro et al. (2014). These studies also find a similar bias towards stars that are dynamically cool in the vertical direction. The terms radial migration or churning have been established for the above mechanism (Schönrich & Binney, 2009; Sellwood, 2014). We will use both terms interchangeably throughout the rest of this paper.
It has long been known that bars cause considerable radial mixing. Migration can also be generated by a bar perturbation but, unlike churning, bar induced mixing dynamically heats stars (Hohl, 1971) and gas (Friedli et al., 1994). Bar and spiral resonances can overlap and cause chaotic or non-linear evolution of stellar orbits (Quillen, 2003). Such overlaps may move stars across the disc even more effectively than churning (Minchev & Famaey, 2010; Minchev et al., 2011). Bars have also been linked to the formation of outer rings (Romero-Gómez et al., 2006, 2007; Athanassoula et al., 2009) indicating that they can drive radial redistribution. However, the formation of rings is generally believed to be caused by gas that it driven to the OLR by bars (Mo et al., 2010).
SB02 point out that despite the significant amount of radial migration in their simulations, there is no significant influence on the morphology of the stellar disc. Bars, however, are known to significantly change a disc’s appearance (Hohl, 1971).
Roškar et al. (2008) showed that churning can move stars beyond the truncation radius of simulated discs ultimately forming the outer part of a Type-II disc profile. The predicted ‘U-shaped’ age profile for this scenario has been confirmed by observations (see section 1.2). However, churning could not be linked to Type-III profiles.
In this paper we will show that bars can, indeed, be responsible for Type-III disc breaks by substantially heating a subset of disc stars. We will also present arguments that disfavour churning in Roškar et al. (2008) as the cause for the outward migration occurring in our slowly rotating simulations from paper I.
3 Simulations
We set up a NFW (Navarro et al., 1997) halo with 10 % of its mass in gas. The halo concentration is . Dark matter (DM) and initial gas particle masses are and respectively. The gravitational softening length is .
The DM particles’ velocities were drawn from the equilibrium distribution function (Kazantzidis et al., 2004). The gas particle velocities were set according to the cosmologically motivated angular momentum profile from Bullock et al. (2001) and are purely tangential with no velocity dispersion as that is modelled by the hydrodynamics solver. The velocities are normalized according to the halo’s spin parameter which is the free parameter in our set-up. We use the definition from Bullock et al. (2001):
| (4) |
The initial temperature profile satisfies hydrostatic equilibrium.
For further details about the initial conditions the reader is referred to paper I.222The initial conditions code pyICs is publicly available and can be downloaded from https://github.com/jakobherpich/pyICs. Since the simulations are self-consistent, the level of control we have is limited, i. e. we are not able to tune certain features of the simulated galaxies independently, e. g. the bar strength or the disc scale length.
The simulations were evolved with a slightly modified version of the publicly available treeSPH code ChaNGa (Jetley et al., 2008, 2010; Menon et al., 2015). The employed version features stochastic star formation (Stinson et al., 2006, ) following the Kennicutt-Schmidt law (Kennicutt, 1998), radiative metal line cooling, metal diffusion and stellar feedback (Stinson et al., 2013; Dalla Vecchia & Schaye, 2012). This recipe has proven to produce realistic galaxies in cosmological simulations (Wang et al., 2015).
The simulations were evolved for a period of 8 Gyr. We explored the spin parameter range of . For the analysis we used the -body analysis framework pynbody (Pontzen et al., 2013).
4 Results
In the present paper we study the orbit evolution of individual stellar particles in the lowest spin simulation from paper I which forms an Type-III disc break (). The goal is to determine how these profiles form. Throughout the rest of this paper we will use the term outer disc to refer to stars which are located outside the position of the break in the radial profile in the final simulation output after 8 Gyr.
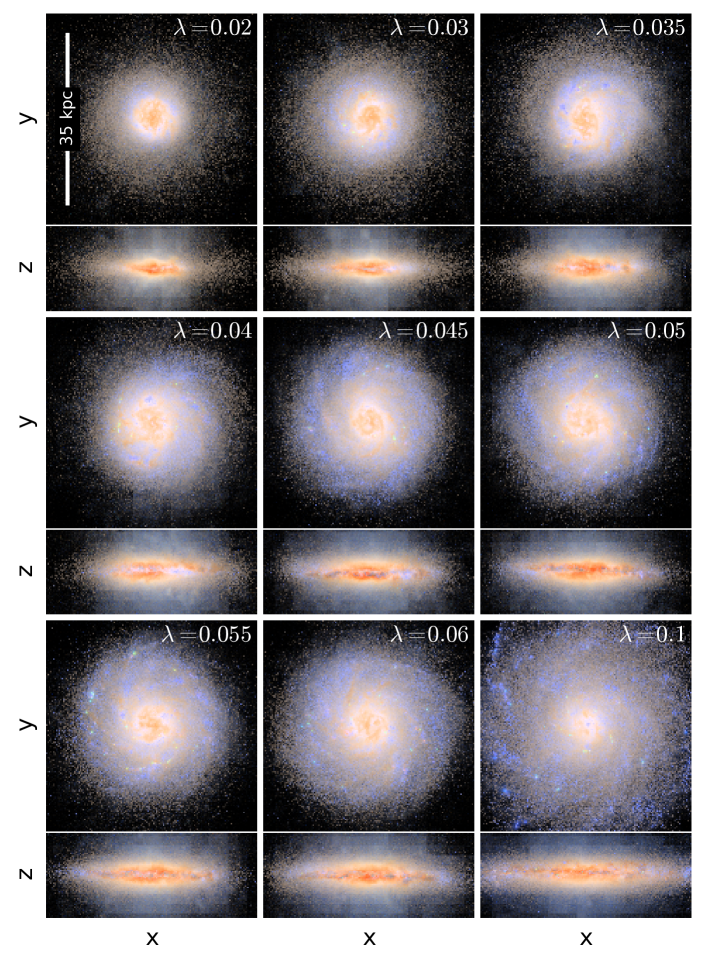
In Fig. 1 we present mock observational images of all simulated galaxies from paper I. They were created using the radiative transfer code sunrise (Jonsson, 2006). The galaxies are more extended and less radially concentrated as increases. All galaxies are disc-like with albeit rather thick discs. Fig. 1 in paper I presents the surface density profiles of the respective galaxies (see paper I for details).
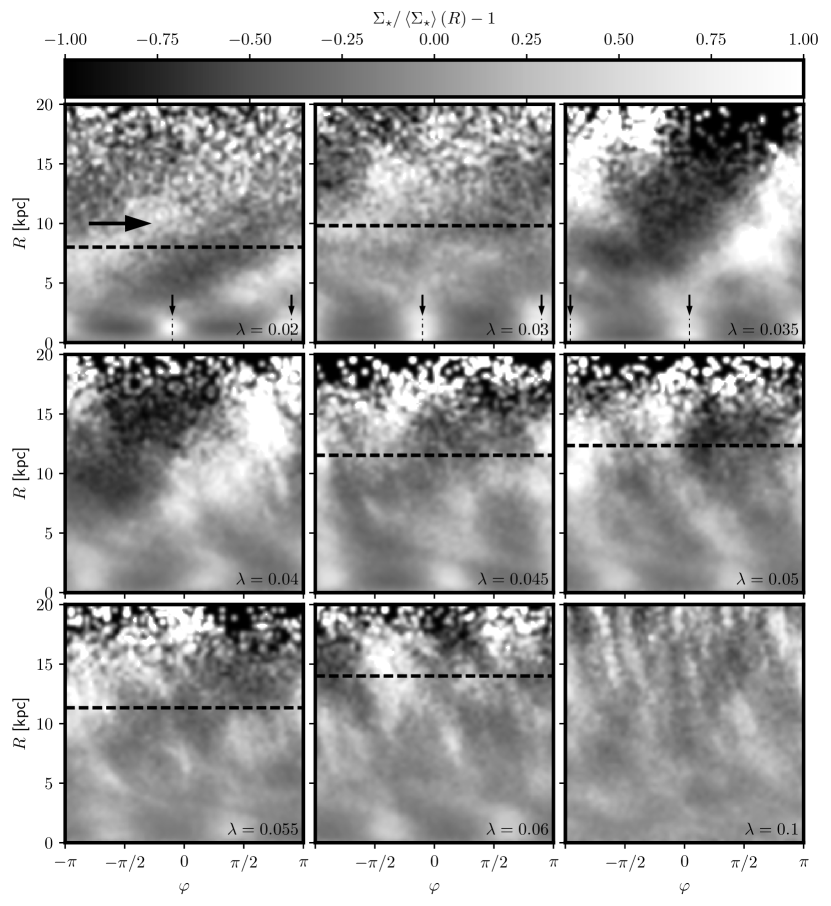
In Fig. 2 we present the average stellar overdensity relative to the mean density at the respective radius in polar coordinates. For the lowest spin simulation (top left panel) we see a small but strong bar (vertical features offset by indicated by the small vertical arrows). The bar signature gets weaker with increasing spin and completely disappears for the highest spin simulation. While the discs of the high spin galaxies () feature complex trailing patterns, the lowest spin galaxies exhibit a one-armed leading pattern. This is consistent with the visual impression from Fig. 1.
The middle panel of Fig. 2 in paper I shows the ratio of inner to outer scale lengths as a function of from a broken exponential fit. It shows that a high initial spin yields galaxies with Type-II disc surface density profiles, while low initial spin yields Type-III profiles.
4.1 Outer discs
Based on very similar simulations, Roškar et al. (2008) reproduced the formation of Type-II disc breaks. The position of the break in the disc profile is set by a radial cut-off of star formation due to the radial termination of the gaseous disc. In their simulations, stars later found in the disc outskirts formed inside the break radius. They found no evidence for radial heating causing migration but instead resonant scattering off of transient spiral arms (SB02) to be responsible for the outward migration of stars. An important signature of this mechanism is that the migrated stars in the outer disc are predominantly on near-circular orbits, i. e. rotationally supported (see also Roškar et al., 2012). In this section we will show that the migration mechanism in our high-spin simulations is consistent with this mechanism. These can produce Type-II disc profiles as well. We also show that the low-spin simulations, which exhibit Type-III breaks, are not.
We first confirm the finding of paper I that all outer disc stars in all of the simulated galaxies must have migrated outward from inside the respective break radii. Additionally, we will show that the outer disc stars in the discs with Type-III profiles stem from the vicinity of the galactic centre, while their counterparts in the discs with Type-II profiles were born further out in the disc. This will be followed by showing that the outer disc stars in the Type-III cases are on very eccentric orbits.
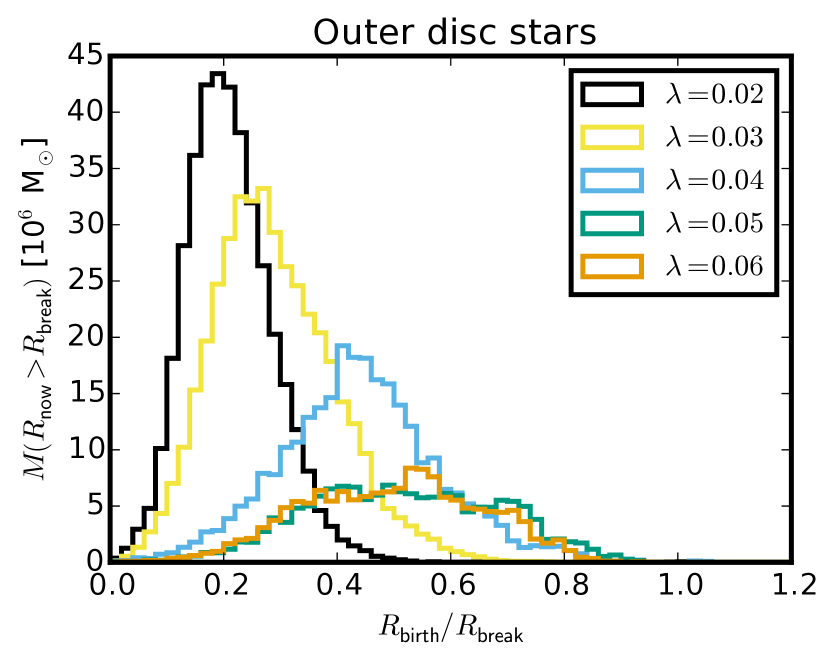
Fig. 3 shows the distribution of birth radii of the stars in the outer disc. We see that practically all outer disc stars are born inside the respective break radius. Here, we find a stark difference between the low- and high-spin cases. In low-spin simulations almost all outer disc stars are born well inside the break radius, . In the high-spin cases the birth radii are located at larger galactocentric distances, . This difference is even more clear in absolute values as the break radii grow with (paper I). We summarize that in all cases the outer disc stars migrate from inside the break region and in the case of the lowest spin simulations originate from predominantly very small radii.
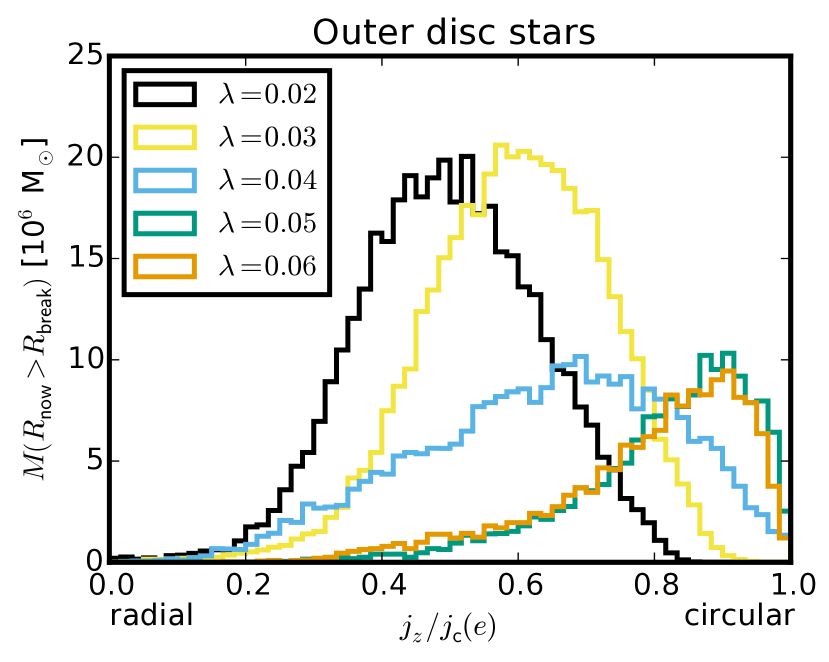
We now characterize stellar orbits in our simulations through their circularity parameter . The circularity parameter is the -component of a star’s specific angular momentum normalized by the specific angular momentum of a circular orbit at the same specific orbital energy. By construction a particle on a perfectly circular orbit has . Particles on perfectly radial orbits satisfy and thus have a circularity parameter of . In practice we will consider every particle with to be on a near circular orbit and particles with on radial orbits. Eccentric orbits cover the range in between these two limiting cases. Negative values correspond to counter-rotating orbits.
In Fig. 4 we present mass-weighted histograms of the distribution of for stars which are beyond the break radius for selected simulations. For the Type-II breaks () most of the orbits are near circular and thus consistent with the mechanism proposed by Roškar et al. (2008). The presence of complex spiral patterns in those galaxies (see Fig. 2) supports this hypothesis. The simulations with Type-III breaks, on the other hand, only have very few stars in their outskirts that are on near circular orbits. Contrary to the higher spin simulations, the distribution of the circularity parameter drops to at values of in these cases. The distribution peaks roughly at which corresponds to rather eccentric orbits. This lack of near circular orbits beyond the break in our simulations with Type-III disc breaks disfavours radial migration as described in section 2 as a possible formation mechanism because it is less efficient for eccentric orbits (SB02).
As there is no evidence that the formation mechanism of the Type-II breaks differs from that of Roškar et al. (2008), we will focus our further analysis on the yet unexplained Type-III breaks.
4.2 Orbit evolution in Type-III discs
Given the substantial radial mass redistribution in Type-III discs, we are now going to explore what mechanism is most important in driving this redistribution. We focus our analysis on the lowest spin simulation (). The break radius of this galaxy is .
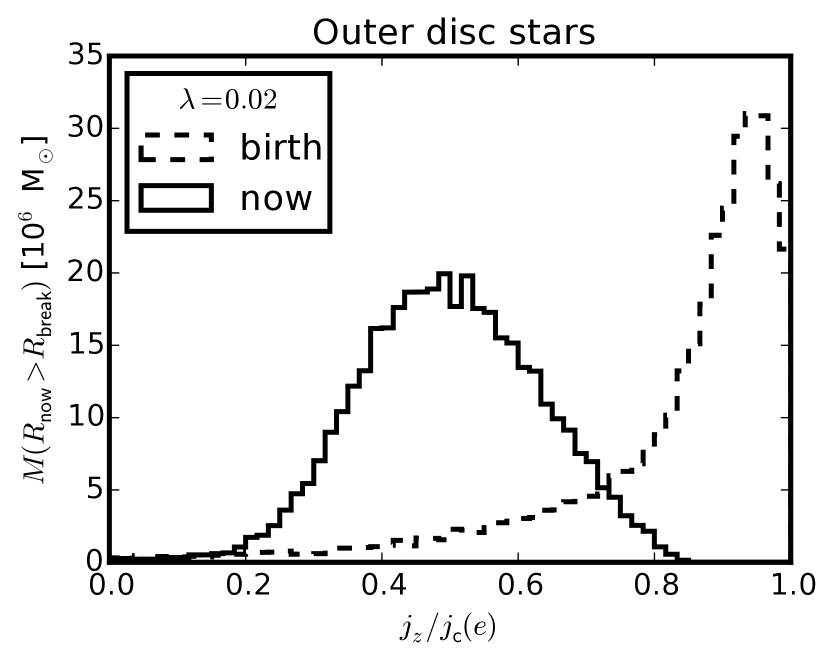
Fig. 5 shows the distribution of the circularity parameter of the outer disc compared to the star’s distribution at birth (dashed line). Most of the outer disc stars were born on nearly circular orbits. Thus, there must be a mechanism which transforms orbits from circular to radial and significantly increases the orbits apocentre.
In order to figure out how orbits get transformed we looked into the time evolution of the orbit of one particular stellar particle. Fig. 6 presents the evolution of orbital parameters of a sample star particle from the outer disc. The four panels show (from top to bottom) the evolution of the star’s radial position , specific orbital energy , specific angular momentum -component and circularity parameter . The times of pericentric passage are marked by vertical dashed lines.
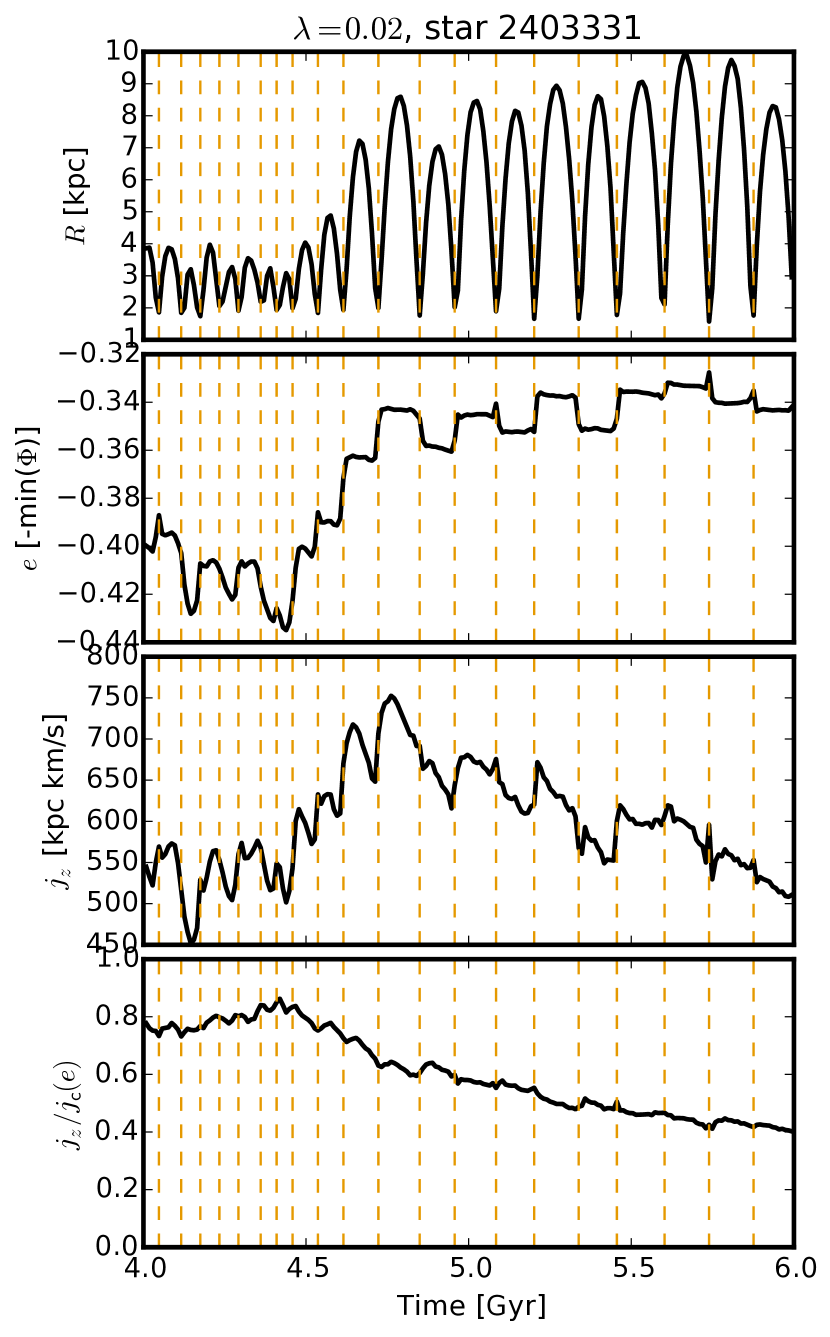
After 4.5 Gyr the star gains or loses energy (second panel) and angular momentum (third panel) at each pericentre passage. When the star is far away from pericentre, its energy stays constant, but it loses specific angular momentum (third panel), which reduces the circularity of its orbit (bottom panel).
During this time span, the binding energy evolves approximately following a step function. The steps occur at pericentre. If the star gains energy at pericentre its semi-major axis increases and vice versa. The pericentre, however, stays more or less constant at approximately 2 kpc. This particular star has a net gain in energy which is not surprising as it has been selected from the outer disc in the final simulation output. In general it is also possible for a star to have a net loss of energy. Such stars migrate towards the galaxy centre and, therefore, cannot be found in the outer disc.
Before 4.5 Gyr, the star in Fig. 6 has a rather small semi-major axis () and the steps in the evolution of its binding energy are smoother and not as well defined yet. Generally, the binding energy of the star is constant when it is far away from the centre and varies only near the centre. Thus, we expect the source of the variation of binding energy to be in the centre of the galaxy. As we will show later (sections 4.4 and 5) the source is the central bar. We stress that the behaviour of the star displayed in Fig. 6 is qualitatively similar to that of other stars found in the outskirts of our low spin discs.
4.3 The bar in Type-III discs
Since particle orbits seem most affected in the centre of galaxies near a possible bar. We characterize the bar using the coefficient of the Fourier mode:
| (5) |
where and are the mass and azimuthal angle of the stars. The sum is over all stars in the considered region333e. g. annular bins or spherical regions of variable size of the galaxy. This mode encodes two relevant quantities, namely the relative bar strength
| (6) |
and the bar’s position angle
| (7) |
In Fig. 7 we present the time evolution of the bar strength in the innermost kpc for a selection of simulations. The lowest spin simulation has the strongest bar. Its bar strength exceeds that of the high spin simulations for a continuous period of 4 or more Gyr. During this period its value is remarkably constant.
The only other simulation that exhibits a strong bar is the one with the second lowest initial spin. Thus, the only simulations in our sample with a strong bar are also the only ones which form a Type-III break. This correlation encouraged us to search for a possible dynamical link between bars and Type-III breaks in our simulations.
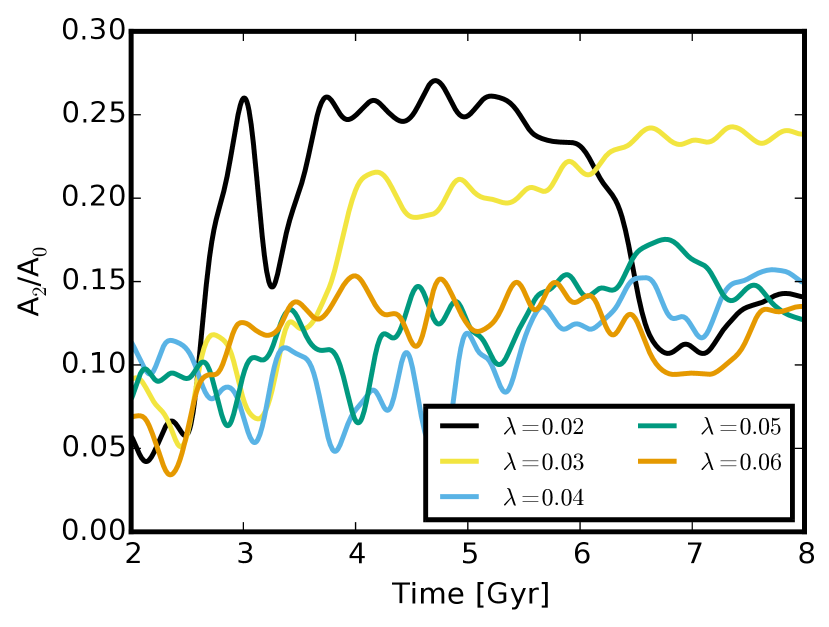
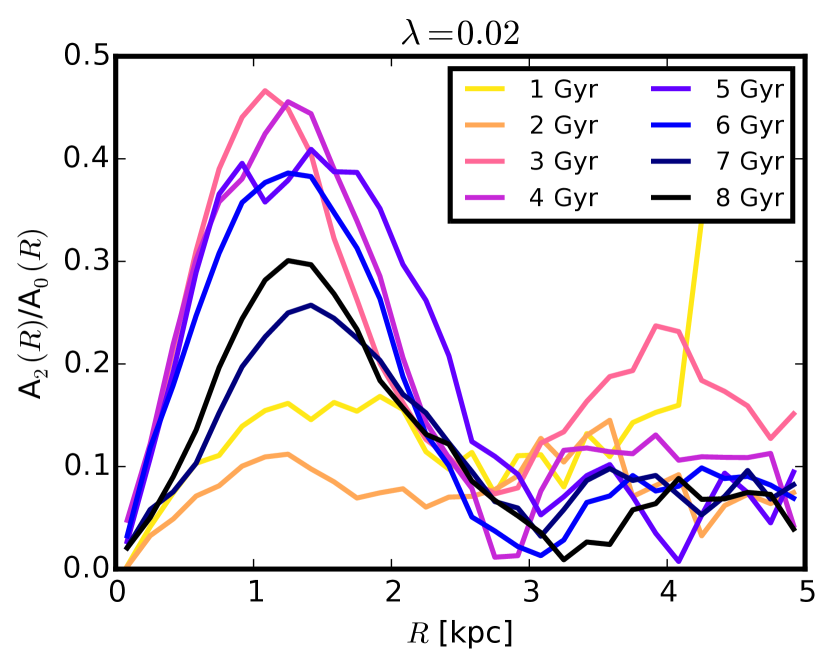
Fig. 8 shows the relative bar strength in different radial bins at different output times for the galaxy. The size of the bar does not evolve significantly. It ends at , so it makes sense to look for possible effects on star particles inside that region.
The pattern speed of the bar is the time derivative of the bar’s position angle. Fig. 9 presents the pattern speed of the bar in the low spin () simulation as a function of time. Once the bar has formed, its pattern speed is remarkably constant, which will be important when we discuss the interaction of stellar particles and the bar in section 4.4.
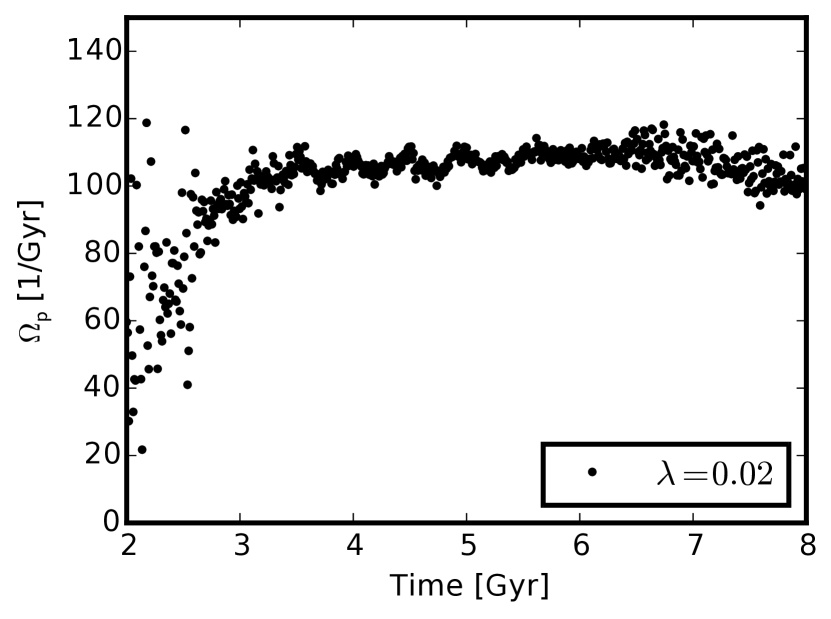
To summarize, low angular momentum simulations develop strong and long-lived bars that have a stable pattern speed over a number of Gyrs. When the bar forms it may trap particles at its resonances. These stars are expected to oscillate radially (SB02) but stay bound to the bar. Note, that such strong bars are known to cause considerable heating of stellar orbits (Hohl, 1971).
4.4 Orbit migration from star-bar interaction
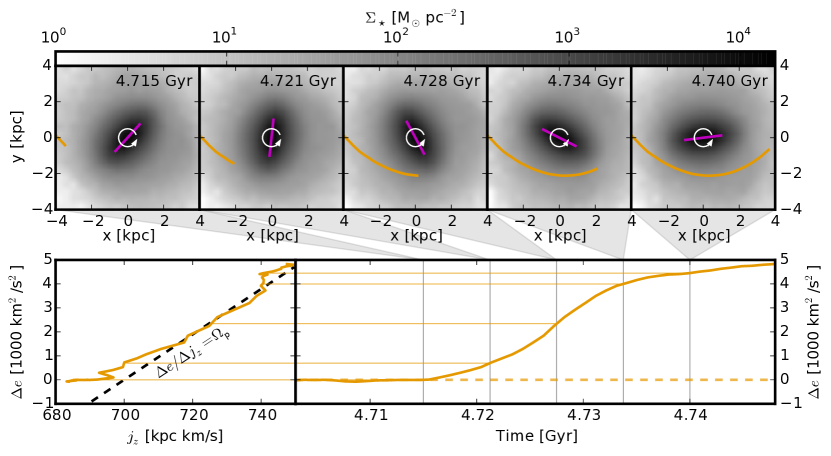
In the top row of Fig. 10 we show the current position of the star particle from Fig. 6 during one direct interaction with the bar that significantly increased its binding energy and apocentre.
The panels in the top row of the figure show that the star and the bar have the same sense of rotation and that the azimuthal phase of the star lags behind that of the bar. During the period that is shown in these images, the star gains a significant amount of binding energy (bottom right panel). The slope of the star’s trajectory in the Lindblad diagram (bottom left panel) is remarkably similar to , particularly for which is the time period in which the time evolution of the binding energy is the strongest. According to equation (2), this is the trajectory we expect from the interaction of a star with the bar, given its constant pattern speed. Taking into account that the orbital binding energy only changes in the vicinity of the bar (see Fig. 6), we interpret this as a clear signature of the bar as the dominant driver of the star’s energy gains (losses).
The encounter of the star and the bar are analogous to a swing-by. The star is exposed to an extended period of acceleration due to the moving potential well of the bar—it is surfing in the bar’s potential.
So far we investigated the behaviour of a single star. However, finding a mechanism that drives a single star’s migration out into the outer disc does not explain the existence of the outer disc. In order to show that the behaviour of that star is typical, we will show that there is a prominent signature of the bar in the outer disc stars’ orbit evolution.444This signature can also be caused by different non-axisymmetric perturbations that are rotating with the same pattern speed. However, the only such perturbation that was found in the simulation is the bar. We will use equation (2) which implies that the ratio of and equals the bar’s pattern speed .
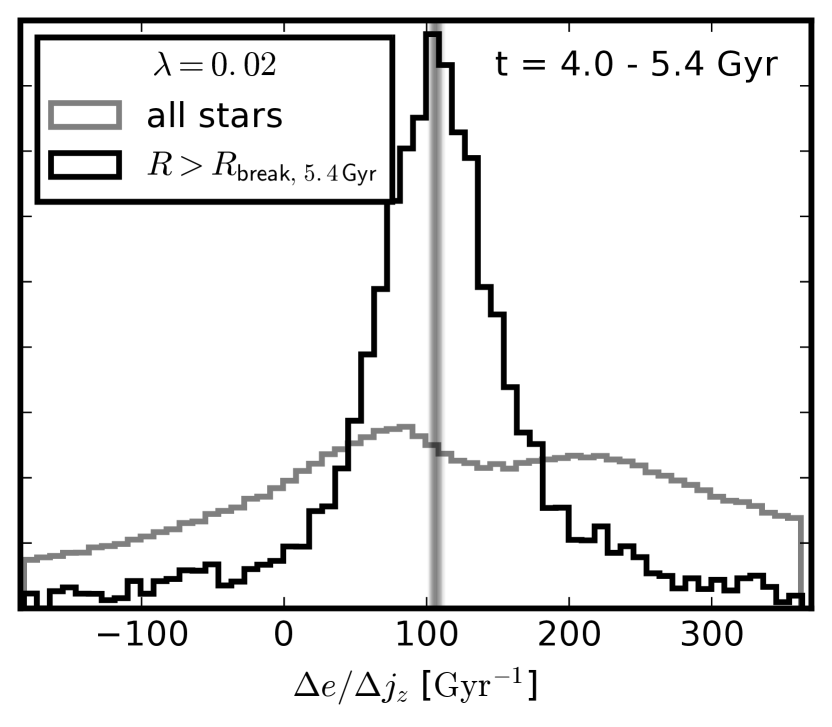
Fig. 11 shows the normalized mass-weighted distribution of of stars in the simulation. It covers the time range from 4.0 to 5.4 Gyr when the bar was both, strong and had a constant pattern speed. The black histogram considers stars that are located outside the break radius at 5.4 Gyr into the simulation. The break radius at this time was . The grey histogram shows the same for all stars in the simulation that were born before 4.0 Gyr. Stars now outside the profile break show a clear peak in their orbit evolution of which coincides remarkably well with the bar’s pattern speed (vertical lines). There is a small feature in the global distribution (grey) but it is offset from and much less prominent. Given the constant pattern speed of the bar, this agreement for the stars in the outskirts matches the prediction of equation (2) for the imprint of the bar on stellar orbits. Thus, it suggests that the bar is the dominant driver of the outward migration happening in the simulations.
5 ‘Surfing the bar’ in a toy model
5.1 Motivation for a toy model
We created a very simple toy model to illustrate that our proposed mechanism (see section 4.4) is indeed capable of increasing the semi-major axes of stellar orbits. Here, the only asymmetry will be a bar-like, rotating, non-axisymmetric perturbation in an otherwise axisymmetric potential. Its purpose is to support our interpretation from section 4. We will show that the interactions of test particles with a bar-like perturbation can reproduce the qualitative behaviour of stellar particles in the outer disc of the simulation. Thus, other effects are not necessary to qualitatively reproduce the kinematics of outer disc stars. This supports our result that the bar is the main driver in the formation of Type-III disc profiles.
5.2 The time-dependent potential
In this model, test particles move in a NFW potential
| (8) |
with a rotating non-axisymmetric Gaussian perturbation
| (9) |
in the centre, where
| (10) |
In the above equations is the minimum unperturbed potential, the scale radius of the NFW potential, the relative strength of the perturbation, the extent of the perturbation in and direction555Note that non-axisymmertry requires , the rotation matrix for rotation by an angle , the perturbation’s pattern speed and the initial phase of the perturbation’s position angle. The total potential then is
| (11) |
This yields a static NFW potential superimposed with a 2D-Gaussian perturbation that is rotating with an angular speed of in the positive sense of rotation. Note, that the particles in this model are not self-gravitating.
5.3 Mass redistribution in the toy model
In this section we describe technical details of our toy model that are necessary for reproducing the results.
We apply this potential to an initially exponential surface density profile with two different perturbation strengths: . We refer to them as the weak and strong model respectively. The values of the model parameters are given in table 1. The initial velocities have been set such that the orbits would be circular in the azimuthally averaged potential.
We evolved the test particles’ coordinates with a Leap-Frog integration scheme. We used a time step of . The relative error of the Jacobi-integral is of order except for a few particles with very small initial radii (). We restricted the treatment to the plane for simplicity.
In principle this setup is overly simplistic. We model a disk with particles on perfectly circular orbits and expose it to a bar perturbation that grows instantly. This is problematic for two reasons: (i) Circular orbits experience the stronger interactions with non-axisymmetric perturbations than (mildly) eccentric orbits and hence, the amount of migration is likely to be overestimated in our simplistic setup (Sellwood & Binney, 2002; Solway et al., 2012; Vera-Ciro et al., 2014); (ii) the instant growth of the bar causes the equilibrium system to be in a non-equlibrium state which will have to equilibrate again.
We performed tests about the effects of both of these problems. (i) We added a velocity perturbation on top of the initially circular orbit which has a random direction and the magnitude of the perturbation is drawn from a normal distribution with a standard deviation of 5 % of the value of the circular velocity of the respective particle. (ii) We linearly grew in time from 0 to its final value with different growth rates. The duration of the bar-growth phase ranges from 0.5 to 5 Gyr. Neither of these tests had any measurable effect on the results of the model.
| Model | weak | strong | |
|---|---|---|---|
| Units | |||
| [km2/s2] | |||
| [kpc] | |||
| [kpc] | |||
| [kpc] | |||
| [rad Gyr-1] | |||
| [rad] | random | ||
| [kpc] | |||
| [Gyr] | |||
In Fig. 12 we compare the evolved surface density profile of the weak (orange) and the strong (magenta) model to the initial (black) profile. In the weak case there is no significant evolution of the surface density profile. There is merely a small feature at the location of the OLR (3.4 kpc). This is consistent with the results of SB02.
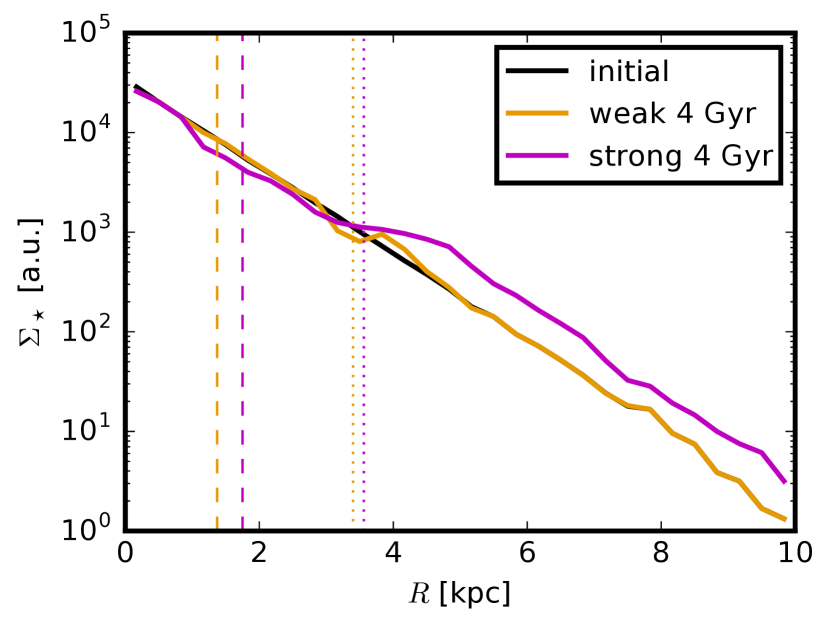
The profile of the strong model has a dip at the position of the CR and just inside the OLR as well as an excess outside the OLR. This indicates that there is significant outward migration from CR and OLR. Note that the determination of the position of the CR and OLR is somewhat dubious because it is based on the existence of nearly circular orbits. In a strict sense, such orbits cannot exist in a non-axisymmetric potential. When we calculate the location of the resonances, we use the azimuthally averaged potential. We show later (Fig. 13) that the resulting resonances agree well with major changes in particles’ angular momentum.
Figure 12 demonstrates that a strong bar can cause a mass excess at large radii. However, the model does not reproduce a Type-III profile as in the simulations. In this toy model the profile looks more like a Type-II.o-OLR profile with a bump that can be associated with the OLR of the bar (Erwin et al., 2008; Gutiérrez et al., 2011). The mass deficiency inside the OLR compared to the Type-III disk profiles in the simulations may be due to the simplistic setup of this model. Due to the lack of self-gravity of the particles, inward migration is likely to be underestimated in this model. Furthermore, we do not model star formation processes here, which are still going on in a real disk and are strongest in the center.
We now explore where these excess particles in the strong model come from. Fig. 13 shows the change of specific angular momentum of each test particle in the strong model as a function of its initial specific angular momentum. There is a strong feature that intersects at the CR. A second strong feature corresponds to the OLR but does not intersect . Generally there is only moderate inward migration (). This can be associated with the CR. Since we can associate the two main features with the resonances we conclude that they are the main drivers of the outward migration. It is not obvious from this figure which of the resonances is dominant.
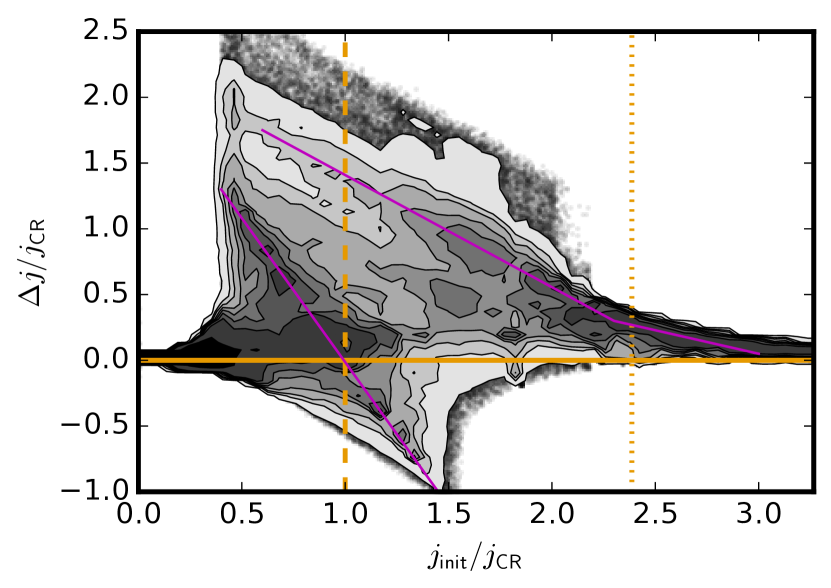
To determine which of the resonances is dominant we perform a modified resimulation of the strong model. We change the initial radial distribution of test particles to be a normal distribution centred around the two resonances, CR and OLR with a standard deviation of 0.2 kpc. We sampled particles in each case. All other parameters are identical to those given in table 1.
Fig. 14 shows histograms of the last peri- (top panel) and the last apocentre distance (bottom) of the test particles. The thick orange and black histograms correspond to the particles centred around the CR and OLR respectively. The thin histograms show the distribution of the corresponding initial radii. The figure shows that the pericentre positions of the particles do not significantly differ from the particles’ initial radii. A large fraction of the particles’ apocentre distances, however, evolve to quite large values.
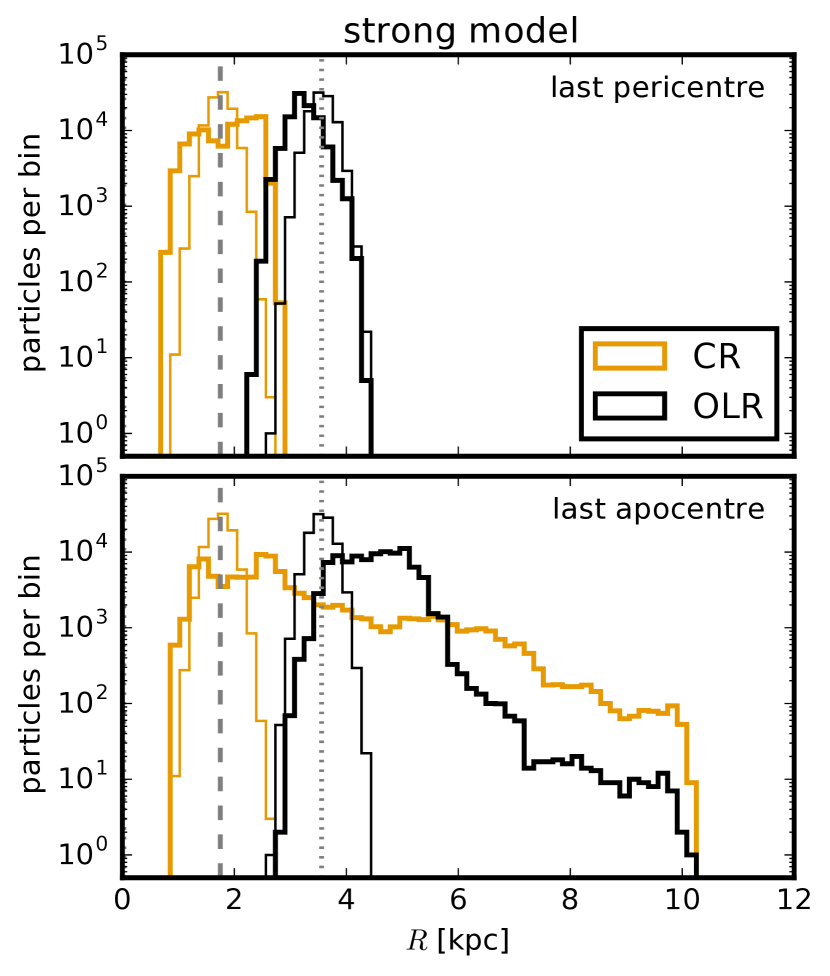
At intermediate radii (4-6 kpc) particles initially at the OLR outnumber the particles initially at CR. This excess is however biased as the particle density at the OLR and CR are the same in our toy model. In real galaxies, however, the particle density decreases with radius. For realistic values of the disc scale length the particle density at the OLR is overestimated by no more than a factor of 3. Thus, correcting for this the particles in resonance with the OLR will still dominate over those from the CR at these radii. At larger radii the distribution of the last apocentre distances is clearly dominated by particles originating from the CR. We conclude that the excess of particles in the outer disc is caused by particles in resonance with the CR and the OLR. However, the CR is more efficient at scattering particles to very large radii.
Fig. 14 also shows that a lot of particles of the strong simulation that are in CR with the perturbation have apocentre distances which are much larger than their pericentres. This means that they experience severe radial heating indicating that the approximation of SB02 (equation 3) breaks down for such a strong perturbation. This is also evident in the altered radial surface density profile (Fig. 12). SB02 showed that migrating particles in resonance with a weak perturbation exchange orbits with another particle resulting in an unchanged global profile. In the case of our toy models, only the weak case seems to agree with this result of SB02.
We note that in our idealized toy model all the orbits stay bound to the region of the perturbation. As long as the perturbation persists, they may also return to their original orbit. In fact the radial position of the particles show a beat pattern. These are however not synchronous among the different particles such that the global radial distribution of the particles will eventually reach an equilibrium distribution. It takes about a Hubble time for such an equilibrium distribution to be reached in our toy model.
In the simulations the scattered outer disc stars also stay bound to the bar (top panel in Fig. 6). The situation in the simulations is more complex though, e. g. the angular momentum changes even when the stars are far away from the bar region. As a result the star particles’ orbits do not show a clear beat pattern. A consequence is that the star’s usually never return to their birth orbit.
5.4 Toy model summary
We demonstrate here that a strong, non-axisymmetric, steady, and rotating perturbation can cause significant radial heating at the CR. As a consequence the radial density profile of a disc can change significantly for such a strong perturbation. This is in qualitative agreement with the properties of the low spin simulation () we analysed in section 4. For the weak model there is no significant change in the radial profile and only very little heating, even at the OLR. In this case the approximation of no radial heating at the CR holds and it agrees well with the results of SB02.
Since we treat particles as test particles and ignore their self-gravity, our toy model is not self-consistent. Due to the way we set up the potential perturbation the additional potential well of the perturbation at the OLR is shallower than that at the CR. This may limit the extent of radial heating caused by the OLR and thus it is most likely underestimated.
Despite the possible underestimation of radial heating by the OLR, we have shown here that particles in CR or OLR with a strong rotating perturbation in the centre experience significant radial heating. It is strong enough to alter the radial surface density profile of an initially exponential disc. This is incompatible with the results of SB02 for weak perturbations which do not significantly alter the global profile of their simulated discs.
In our case of a strong bar, however, we violate the approximation of a weak perturbation (SB02). Hence, the result that particles in CR do not experience radial heating no longer holds. This approximation was based on the fact that at the CR the slope of the trajectory in the Lindblad diagram is equal to that of the circular velocity curve (Fig. 1 in SB02). If the change in angular momentum due to the interaction with the perturbation is strong enough, the particle may depart from the circular velocity curve (or increase its distance to that). This results in radial heating and appears to be what happens in our strong model and in our simulations that produce Type-III disc breaks, given that these are the simulated galaxies with strong bars (Fig. 7).
Due to the lack of self-consistency and the non-axisymmetric external potential, global angular momentum of the test particles is not necessarily conserved (see Fig. 13). This may lead to an underestimation of inward migration in the toy model and might be the reason for the mass deficiency in the central regions of this toy model. The model does still demonstrate the capability of such a perturbation to alter the global mass distribution of a stellar disc.
6 Observational signatures
In this section we will give some observational signatures of the mechanism that we described above. We will compare the disc dynamics of a simulated Type-III disc (low-spin, ) and a Type-II disc (high-spin, ).
We have shown that the eccentricity distribution of the outer discs in the simulations with Type-II and III disc breaks is significantly different (c. f. section 4.1). This leads to distinct dynamical properties of the discs that can be observed.
The upper panel of Fig. 15 shows the mean tangential velocity profile of the stellar discs (dashed lines) for the low-spin () and high-spin () galaxies. They are compared to the expected tangential velocities for circular orbits (solid lines). As the stellar discs host stars on non-circular orbits, we expect the mean tangential velocity to be smaller than the circular velocity as stars at apocentre have low velocities. The effect is much stronger for the low-spin galaxy which exhibits a discrepancy by a factor of 4 in the entire outer disc. For the high-spin galaxy, the mean tangential velocity is only off by a factor of up to 2. This trend of decreasing tangential velocities in the outer discs with decreasing spin is expected as the distribution of circularity parameters shifts towards more eccentric orbits for the low-spin simulations.
The difference between the tangential velocity profile and the circular velocity curve is difficult to observe, as the circular velocity curve cannot be observed easily. A better diagnostic for both types of disc breaks (Type-II and III) is the velocity dispersion profile as these can be observed. The velocity dispersion profiles in each direction are presented in the lower panel of Fig. 15. The prominent difference between both simulations is that the radial velocity dispersion in the (Type-III profile) disc is much higher than the tangential and vertical component. This is a signature of the large amount of eccentric orbits in these discs. In the disc with a Type-II break, all velocity dispersion components are comparable as it hosts a much smaller number of stars on eccentric orbits.
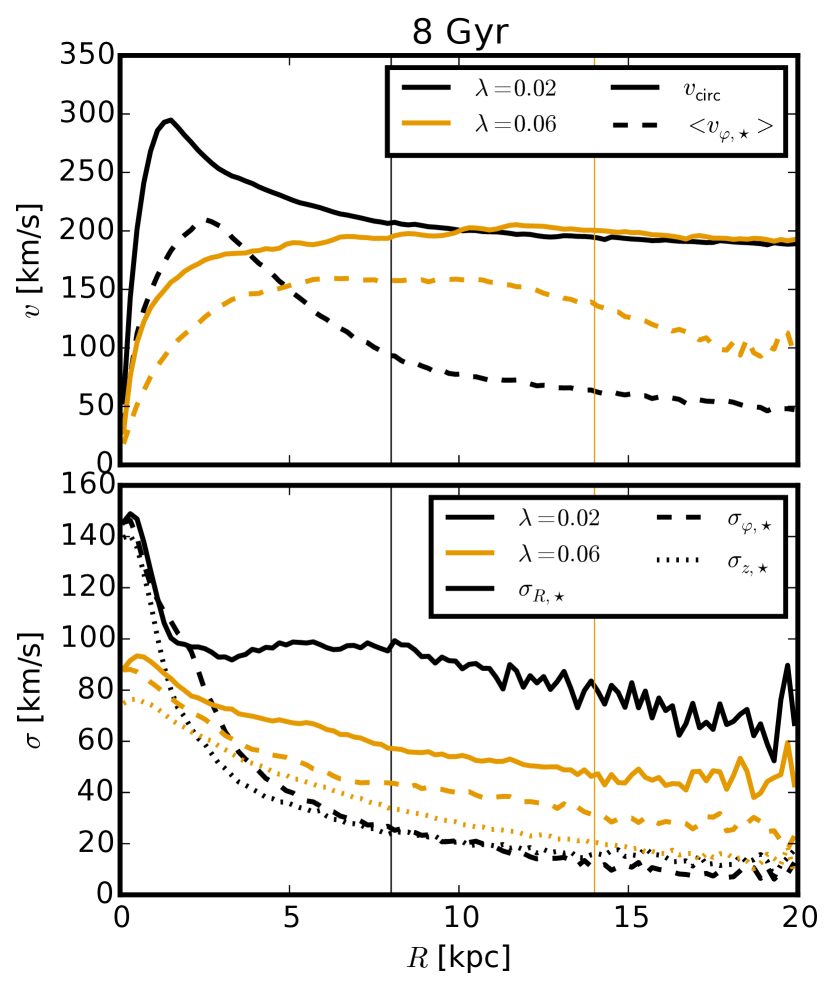
The resulting Type-III disc is dynamically peculiar. While it has as disc shape (Fig. 1), it is very slowly rotating and has an excess in radial velocity dispersion and, thus, the rotational contribution to support the disc is unusually small.
Observing these signatures is challenging as the outskirts of Type-III discs are very faint (). Thus, they are not observable through stellar absorption-line spectroscopy, even with integral field spectroscopy. A possible way to measure the kinematics of the outskirts of such discs would be to observe planetary nebulae. Planetary nebulae have been used previously to measure velocity dispersions of galaxies at very low surface brightness (e. g. Douglas et al., 2000; Herrmann & Ciardullo, 2009) and, thus, would provide a possible tool to observe an excess of radial velocity dispersion, the smoking gun of stars surfing in the bar’s potential.
7 Discussion
We have presented a thorough analysis of stellar orbit evolution in one of the simulated discs of paper I with a Type-III break. The goal was to identify a mechanism that produces Type-III breaks via secular evolution. We chose a simple simulation set-up of disc formation within non-cosmological isolated halos to have full control over the halo spin and to facilitate the identification of secular, i. e. internal, mechanisms.
We showed that the stars that make up the outer parts of these Type-III discs were born on circular orbits well inside the final break radius (Fig. 3 and paper I). Furthermore, the stars in the outer parts of these discs have very eccentric orbits. Therefore, the mechanism that produces Type-III discs is inconsistent with that found by Roškar et al. (2008). They found that the stars that populate the truncated region of Type-II discs have been churned there from their birth radii while retaining near-circular orbits. Instead, there has to be a mechanism that is able to drive stars to larger radii and that can turn those stars’ orbits from circular to eccentric in our low-spin simulations.
We investigated the bar as a potential cause for the formation of Type-III profiles because the two simulations that form Type-III discs have significantly stronger bars than all other simulations of our sample (Fig. 7). We find that the increase of orbital radii (or more accurately their semi-major axes) is driven by an increase in orbital energy (Fig. 6) which, in turn, is driven by encounters of the stars with the bar potential at their pericentres. Our main argument for the bar as the dominant cause is the fact that the ensemble of orbits of stars, that make up the outer disc, show a clear signature of the bar: the distribution of the ratio peaks at the value of the bar’s pattern speed (Fig. 11). This is a clear signature that is expected from a rotating bar (equation (2), see also SB02), with a constant pattern speed (Fig. 9).
Roškar et al. (2008) found that radial migration in simulated galaxies with Type-II breaks is dominated by churning of stars on near-circular orbits. This preserves the stars’ circularity and thus does not cause significant radial heating. We found those results to be consistent with our simulations with Type-II profiles. In our low-spin galaxies, which feature strong bars, the stars in CR with the bar may experience radial heating. This is possible because the churning mechanism is based on a first order approximation for moderate perturbations which states that stars in CR do not experience radial heating. This first order approximation breaks down for the strong bars in our simulations. Here the stars may be driven away from the circular orbit curve while in CR with the bar. This effect of bars has been known for decades (Hohl, 1971) but has never been linked to the formation of Type-III stellar disc profiles.
We confirmed our interpretation of the simulations with the help of a simple toy model which qualitatively mimics the situation in the simulations. We showed that a strong bar-like perturbation may scatter stars to large radii in a very similar fashion as the bar in our low-spin simulations. An excess of stars at large radii could be reproduced in this model with a strong perturbation but not in a model with a weaker perturbation (Fig. 12) which is in qualitative agreement with the results from our simulations. However, the detailed shape of the final profile in the toy model does not feature at Type-III break which is due to the lack of modelling the full complexity of galaxy evolution.
As of now the literature only provided models that associate environmental effects (satellites, accretion) with the formation of Type-III discs. As this work presents a mechanism that is capable of producing these discs in simulations of isolated galaxies, we show that galaxies can form Type-III discs purely via secular evolution. This does not preclude that external forces (Younger et al., 2007; Kazantzidis et al., 2009; Roediger et al., 2012; Borlaff et al., 2014) or other internal processes may also play a role.
We find that the initial halo spin matters as it locally sets the rate at which stars form. This in turn determines the size of the stellar disc and its central surface density. Hence, it also sets the strength and longevity of any bar at the centre. This effect cannot be explored in simulations with prepared discs (e. g. Foyle et al., 2008). For high spin parameters the gaseous disc is very extended but the gas surface density is comparatively low. This leads to more extended star formation at a rather low rate. In low spin halos the opposite happens. Due to the large amount of low angular momentum gas a large portion of this gas is able to settle at low radii forming a concentrated massive gas disc with a high star formation rate. In this case a massive and concentrated disc forms which is highly susceptible to disc instabilities and thus very prone to bar formation (Toomre, 1964; Hohl, 1971). Since the stellar mass density in the centre is very large, the bar is also very massive. As we have shown in this work, this massive bar is driving the formation of Type-III discs.
We previously reported a correlation between disc scale length and the type of truncation (middle panel of Fig. 2 in paper I), i. e. the inner scale lengths increase from compact discs for type-III profiles through intermediate scale lengths for type-I profiles and extended discs for type-II profiles. While Maltby et al. (2012a) and Head et al. (2015) do not find such a correlation in their galaxy samples, Gutiérrez et al. (2011, section 5.2) report a trend that qualitatively agrees with our simulations (paper I). Gutiérrez et al. (2011) cannot rule out a common distribution for the inner scale lengths of type-I and II discs but find that Type-III discs have significantly shorter inner scale lengths compared to pure exponentials. Despite this qualitative agreement between a subset of observational data and our simulated galaxies, it is not the goal of this project to reproduce previous observational results but to take a first step to a possible explanation of the formation of Type-III discs which relies purely on secular stellar dynamics.
We stress that we do not claim the proposed mechanism to be exclusively responsible for the existence of Type-III discs. Instead we show that the proposed mechanism is potentially capable of producing Type-III discs and characterise its dynamical signature which can be used to observationally verify or falsify our model.
The eccentric orbits of the stars in the outskirts of Type-III give rise to very unusual properties of a stellar disc: While being flat the outer disc rotates very slowly and its velocity dispersion is dominated by the radial component.
Minchev et al. (2012) find similar kinematic signatures in Type-III discs that form through external gas accretion. This degeneracy does not undermine the potential capability of falsifying our model if no Type-III discs with bars can be found that have a strong excess in radial velocity dispersion in their outskirts.
We showed that stars in the outskirts of simulated Type-III discs are on very eccentric orbits. They were formed on circular orbits at much smaller galactocentric radii. This outward migration was caused by a strong bar that formed 3-4 Gyr into the simulation and trapped the migrating particles in its rotating potential. This caused a change of the trapped stars’ radial distribution which is responsible for the formation of the anti-truncated part of Type-III discs. This conclusion is based on a dominant signature of the bar on stellar orbits. We describe signatures of this mechanism that allow to test our predictions in future observations.
8 Conclusion
Analyzing controlled disc-galaxy simulations we showed that strong bars can form anti-truncated breaks in the radial surface density profile of stellar discs (Type-III discs). Strong bars can boost the semi-major axis of stellar orbits to very large galactocentric distances, while also changing the distribution of orbit circularity of the affected stars. The initial distribution of stars that later comprise the outskirts of a simulated Type-III stellar disc was initially dominated by near-circular orbits at smaller radii. In the final distribution, near-circular orbits are almost completely absent. It is dominated by very eccentric orbits. This bar-induced transformation of orbits has the capability of changing the global radial mass distribution of the stellar disc ultimately leading to a Type-III break in the radial surface-density profile.
This process is not efficient for discs with weak bars. In this case the dominant radial migration mechanism is spiral-induced churning and the discs form Type-II breaks in their radial profile. The reason is that the first order approximation of only very little or no radial heating holds only for weak but not for strong bars.
Acknowledgements
The authors gratefully acknowledge the very constructive help of various people, in particular Rok Roškar, Victor Debattista, Ivan Minchev, Deidre Hunter and Francoise Combes. We thank the anonymous referee for their comments which helped us to improve upon the interpretation of our results. This paper could not have happened without the -body hydrodynamics code ChaNGa whose development has been shepherded by Thomas Quinn and whose hydrodynamics come from the work of James Wadsley. We thank them for their contributions and letting us use their code. JH, GSS and HWR acknowledge funding from the European Research Council under the European Union’s Seventh Framework Programme (FP 7) ERC Advanced Grant Agreement n. [321035]. GSS and AAD acknowledge support through the Sonderforschungsbereich SFB 881 “The Milky Way System” (subproject A1) of the German Research Foundation (DFG). MM acknowledges support from the Alexander von Humboldt Foundation.
References
- Athanassoula et al. (2009) Athanassoula E., Romero-Gómez M., Masdemont J. J., 2009, MNRAS, 394, 67
- Azzollini et al. (2008) Azzollini R., Trujillo I., Beckman J. E., 2008, ApJ, 679, L69
- Bakos et al. (2008) Bakos J., Trujillo I., Pohlen M., 2008, ApJ, 683, L103
- Binney & Tremaine (2008) Binney J., Tremaine S., 2008, Galactic dynamics, 2. ed. edn. Princeton series in astrophysics, Princeton University Press, Princeton, NJ ; Oxford
- Borlaff et al. (2014) Borlaff A., et al., 2014, A&A, 570, A103
- Bullock et al. (2001) Bullock J. S., Dekel A., Kolatt T. S., Kravtsov A. V., Klypin A. A., Porciani C., Primack J. R., 2001, ApJ, 555, 240
- Dalla Vecchia & Schaye (2012) Dalla Vecchia C., Schaye J., 2012, MNRAS, 426, 140
- de Vaucouleurs (1957) de Vaucouleurs G., 1957, AJ, 62, 69
- de Vaucouleurs (1958) de Vaucouleurs G., 1958, ApJ, 128, 465
- Debattista et al. (2006) Debattista V. P., Mayer L., Carollo C. M., Moore B., Wadsley J., Quinn T., 2006, ApJ, 645, 209
- Douglas et al. (2000) Douglas N. G., Gerssen J., Kuijken K., Merrifield M. R., 2000, MNRAS, 316, 795
- Dutton (2009) Dutton A. A., 2009, MNRAS, 396, 121
- Erwin et al. (2005) Erwin P., Beckman J. E., Pohlen M., 2005, ApJ, 626, L81
- Erwin et al. (2008) Erwin P., Pohlen M., Beckman J. E., 2008, AJ, 135, 20
- Foyle et al. (2008) Foyle K., Courteau S., Thacker R. J., 2008, MNRAS, 386, 1821
- Freeman (1970) Freeman K. C., 1970, ApJ, 160, 811
- Friedli et al. (1994) Friedli D., Benz W., Kennicutt R., 1994, ApJ, 430, L105
- Gutiérrez et al. (2011) Gutiérrez L., Erwin P., Aladro R., Beckman J. E., 2011, AJ, 142, 145
- Head et al. (2015) Head J. T. C. G., Lucey J. R., Hudson M. J., 2015, MNRAS, 453, 3729
- Herpich et al. (2015) Herpich J., et al., 2015, MNRAS, 448, L99
- Herrmann & Ciardullo (2009) Herrmann K. A., Ciardullo R., 2009, ApJ, 705, 1686
- Hohl (1971) Hohl F., 1971, ApJ, 168, 343
- Jetley et al. (2008) Jetley P., Gioachin F., Mendes C., Kale L. V., Quinn T. R., 2008, Proceedings of IEEE International Parallel and Distributed Processing Symposium 2008
- Jetley et al. (2010) Jetley P. Wesolowski L., Gioachin F., Mendes C., Kale L. V., Quinn T. R., 2010, In Proceedings of the 2010 ACM/IEEE International Conference for High Performance Computing, Networking, Storage and Analysis, SC ’10
- Jonsson (2006) Jonsson P., 2006, MNRAS, 372, 2
- Kazantzidis et al. (2004) Kazantzidis S., Magorrian J., Moore B., 2004, ApJ, 601, 37
- Kazantzidis et al. (2009) Kazantzidis S., Zentner A. R., Kravtsov A. V., Bullock J. S., Debattista V. P., 2009, ApJ, 700, 1896
- Kennicutt (1998) Kennicutt Jr. R. C., 1998, ApJ, 498, 541
- Kim et al. (2014) Kim T., et al., 2014, ApJ, 782, 64
- Lynden-Bell & Kalnajs (1972) Lynden-Bell D., Kalnajs A. J., 1972, MNRAS, 157, 1
- Maltby et al. (2012a) Maltby D. T., et al., 2012a, MNRAS, 419, 669
- Maltby et al. (2012b) Maltby D. T., Hoyos C., Gray M. E., Aragón-Salamanca A., Wolf C., 2012b, MNRAS, 420, 2475
- Maltby et al. (2015) Maltby D. T., Aragón-Salamanca A., Gray M. E., Hoyos C., Wolf C., Jogee S., Böhm A., 2015, MNRAS, 447, 1506
- Menon et al. (2015) Menon H., Wesolowski L., Zheng G., Jetley P., Kale L., Quinn T., Governato F., 2015, Computational Astrophysics and Cosmology, 2, 1
- Minchev & Famaey (2010) Minchev I., Famaey B., 2010, ApJ, 722, 112
- Minchev et al. (2011) Minchev I., Famaey B., Combes F., Di Matteo P., Mouhcine M., Wozniak H., 2011, A&A, 527, A147
- Minchev et al. (2012) Minchev I., Famaey B., Quillen A. C., Di Matteo P., Combes F., Vlajić M., Erwin P., Bland-Hawthorn J., 2012, A&A, 548, A126
- Mo et al. (2010) Mo H., van den Bosch F. C., White S., 2010, Galaxy Formation and Evolution
- Navarro et al. (1997) Navarro J. F., Frenk C. S., White S. D. M., 1997, ApJ, 490, 493
- Pohlen & Trujillo (2006) Pohlen M., Trujillo I., 2006, A&A, 454, 759
- Pohlen et al. (2002) Pohlen M., Dettmar R.-J., Lütticke R., Aronica G., 2002, A&A, 392, 807
- Pohlen et al. (2004) Pohlen M., Beckman J. E., Hüttemeister S., Knapen J. H., Erwin P., Dettmar R.-J., 2004, in Block D. L., Puerari I., Freeman K. C., Groess R., Block E. K., eds, Astrophysics and Space Science Library Vol. 319, Penetrating Bars Through Masks of Cosmic Dust. p. 713 (arXiv:astro-ph/0405541)
- Pontzen et al. (2013) Pontzen A., Roškar R., Stinson G., Woods R., 2013, pynbody: N-Body/SPH analysis for python, Astrophysics Source Code Library (ascl:1305.002)
- Quillen (2003) Quillen A. C., 2003, AJ, 125, 785
- Radburn-Smith et al. (2012) Radburn-Smith D. J., et al., 2012, ApJ, 753, 138
- Roediger et al. (2012) Roediger J. C., Courteau S., Sánchez-Blázquez P., McDonald M., 2012, ApJ, 758, 41
- Romero-Gómez et al. (2006) Romero-Gómez M., Masdemont J. J., Athanassoula E., García-Gómez C., 2006, A&A, 453, 39
- Romero-Gómez et al. (2007) Romero-Gómez M., Athanassoula E., Masdemont J. J., García-Gómez C., 2007, A&A, 472, 63
- Roškar et al. (2008) Roškar R., Debattista V. P., Stinson G. S., Quinn T. R., Kaufmann T., Wadsley J., 2008, ApJ, 675, L65
- Roškar et al. (2012) Roškar R., Debattista V. P., Quinn T. R., Wadsley J., 2012, MNRAS, 426, 2089
- Ruiz-Lara et al. (2015) Ruiz-Lara T., et al., 2015, preprint, (arXiv:1511.03499)
- Schönrich & Binney (2009) Schönrich R., Binney J., 2009, MNRAS, 396, 203
- Sellwood (2014) Sellwood J. A., 2014, Reviews of Modern Physics, 86, 1
- Sellwood & Binney (2002) Sellwood J. A., Binney J. J., 2002, MNRAS, 336, 785
- Solway et al. (2012) Solway M., Sellwood J. A., Schönrich R., 2012, MNRAS, 422, 1363
- Stinson et al. (2006) Stinson G., Seth A., Katz N., Wadsley J., Governato F., Quinn T., 2006, MNRAS, 373, 1074
- Stinson et al. (2013) Stinson G. S., Brook C., Macciò A. V., Wadsley J., Quinn T. R., Couchman H. M. P., 2013, MNRAS, 428, 129
- Toomre (1964) Toomre A., 1964, ApJ, 139, 1217
- van der Kruit (1979) van der Kruit P. C., 1979, A&AS, 38, 15
- Vera-Ciro et al. (2014) Vera-Ciro C., D’Onghia E., Navarro J., Abadi M., 2014, ApJ, 794, 173
- Wang et al. (2015) Wang L., Dutton A. A., Stinson G. S., Macciò A. V., Penzo C., Kang X., Keller B. W., Wadsley J., 2015, MNRAS, 454, 83
- Yoachim et al. (2010) Yoachim P., Roškar R., Debattista V. P., 2010, ApJ, 716, L4
- Younger et al. (2007) Younger J. D., Cox T. J., Seth A. C., Hernquist L., 2007, ApJ, 670, 269