The Detection and Statistics of Giant Arcs Behind CLASH Clusters
Abstract
We developed an algorithm to find and characterize gravitationally lensed galaxies (arcs) to perform a comparison of the observed and simulated arc abundance. Observations are from the Cluster Lensing And Supernova survey with Hubble (CLASH). Simulated CLASH images are created using the MOKA package and also clusters selected from the high resolution, hydrodynamical simulations, MUSIC, over the same mass and redshift range as the CLASH sample. The algorithm’ s arc elongation accuracy, completeness and false positive rate are determined and used to compute an estimate of the true arc abundance. We derive a lensing efficiency of arcs (with length and length-to-width ratio ) per cluster for the X-ray selected CLASH sample, arcs per cluster for the MOKA simulated sample and arcs per cluster for the MUSIC simulated sample. The observed and simulated arc statistics are in full agreement. We measure the photometric redshifts of all detected arcs and find a median redshift with 33% of the detected arcs having . We find that the arc abundance does not depend strongly on the source redshift distribution but is sensitive to the mass distribution of the dark matter halos (e.g. the relation). Our results show that consistency between the observed and simulated distributions of lensed arc sizes and axial ratios can be achieved by using cluster-lensing simulations that are carefully matched to the selection criteria used in the observations.
1 Introduction
The occurrence frequency of giant gravitationally lensed arcs – those most elongated, highly non-linear lensing features – is sensitive to the matter distribution within the cores of galaxy clusters. The statistics of giant arcs can thus provide useful tests of the structure formation. Cosmological models can be tested by comparing the observed giant arc abundance with the expected abundance from ray-tracing cosmological simulations. In an early study of arc statistics, Bartelmann et al. (1998) (hereafter B98) first suggested that the predicted arc abundance by is lower than the observed abundance by approximately an order of magnitude. This “order of magnitude” puzzle has stimulated a significant amount of research towards understanding the most important arc-producing effects. The proposed effects include the triaxiality of cluster mass profiles (Oguri et al., 2003; Dalal et al., 2004; Hennawi et al., 2007; Meneghetti et al., 2010), the amount of intervening large scale structure (Wambsganss et al., 2005; Hilbert et al., 2007; Puchwein & Hilbert, 2009), the rapid increase in the lensing cross section during the major mergers (Torri et al., 2004; Fedeli et al., 2006; Hennawi et al., 2007; Zitrin et al., 2013), the background galaxy redshift distribution (Wambsganss et al., 2004), the cosmological parameters (Bartelmann et al., 2003; Meneghetti et al., 2005; Fedeli et al., 2008; Jullo et al., 2010; D’Aloisio & Natarajan, 2011b; Boldrin et al., 2015), the cluster selection criteria (Horesh et al., 2010, 2011), the baryonic mass distribution, primarily in the form of brightest central galaxies (BCG) and substructures (Flore et al., 2000; Meneghetti et al., 2000, 2003; Hennawi et al., 2007; Meneghetti et al., 2010), and the baryon-dragging effects due to cooling (Puchwein et al., 2005; Rozo et al., 2008). Inclusion of these effects have gone a long way towards explaining the “arc statistics problem.” However, the tension between the observed arc abundance and the predicted number remained at the level of factor 3, at least for clusters at low redshifts () (Horesh et al., 2011). Moreover, there has not yet been a consensus reached on which of these physical processes are the dominant ones.
To see if the remaining discrepancies can be resolved, efforts need to be made on both theoretical and observational fronts. On the theoretical side, all effects which impact arc abundance should be included in the simulations to make them more realistic. A straightforward example is to compare the lensing cross section in simulations with dark and baryonic matter against dark matter only simulations (Meneghetti et al., 2003; Puchwein et al., 2005; Killedar et al., 2012). On the observational side, larger, carefully selected cluster samples with ample redshift information are needed. All analyses will also benefit from the utilization of automated procedures for selecting giant arcs as rigorous comparisons must be done using an identical arc selection process for both the actual data and simulated data. In this respect, visual inspection, by which early arc statistics studies were conducted, is not an optimal approach as unquantifiable biases can potentially be introduced when classification is done by eye. Several groups have devised tools to search for arcs in an automated manner (Lenzen et al., 2004; Horesh et al., 2005; Alard, 2006; Seidel & Bartelmann, 2007). Most recently, Horesh et al. (2010, 2011) measured the observed abundance of arcs in a sample of 100 clusters observed with the Hubble Space Telescope (HST), using an automated and objective arc finder. The observed statistics were compared to those from a simulated dataset of cluster images. The simulated images were produced by ray-tracing through a large sample of clusters produced in N-body simulations, realistically simulating the observational effects, and then searching for arcs in these simulated clusters using the same arc-finding algorithm. Horesh et al. (2011) found excellent agreement between the observed and simulated arc statistics, particularly for their main sub-sample of X-ray selected clusters at redhsifts . However, tension between the observations and simulations remained at other redshifts ranges, particularly for the subsample at . Moreover, none of the above groups has quantified the performance of their arcfinders, such as the arc detection completeness or the false positive rate. Without that information, the arcfinders’ ability to predict the “true” arc abundance is limited.
In this paper, we measure the observed abundance of giant arcs from the CLASH (Cluster Lensing And Supernova survey with Hubble) sample (Postman et al., 2012). Giant arcs are found in the CLASH images, and in simulated images that mimic the CLASH data, using an efficient automated arc-finding algorithm whose selection function has been carefully quantified. CLASH is a 524-orbit multi-cycle treasury program that targeted 25 massive clusters with 0.18 0.90. Twenty of the CLASH clusters are selected based on their X-ray characteristics. The X-ray selected CLASH sample contains clusters with 5 keV and with X-ray surface brightness profiles that have low asymmetry. The five remaining clusters were selected based on their expected lensing strength (large Einstein radii, typically for or high magnification areas). Although the cluster sample is smaller than the one analyzed by Horesh et al. (2010, 2011), the CLASH observations are deeper, and photometric redshift information is available for all arcs brighter than about 26 AB mag (all the magnitudes hereafter are AB mag). In addition, our arcfinder is capable of detecting fainter arcs than previous studies. As a result, the total number of arcs that we find is comparable to that in the Horesh et al. studies. We simulate artificial clusters with the same mass and redshift range as the CLASH sample by using the N-body simulation-calibrated semi-analytic tool – MOKA (Giocoli et al., 2012), and directly from the high resolution, hydrodynamical simulations, MUSIC (Meneghetti et al., 2014), and perform ray-tracing simulation to prepare large sets of realizations for the simulated cluster images. We correct the raw arc counts in both the observations and simulations for incompleteness, false positive detections and arc elongation measurement bias. This allows us to conduct a direct comparison between the data and the simulations under different theoretical scenarios.
This paper is organized as follows: we describe the arcfinder algorithm and its implementation in section 2 and in the appendices; we demonstrate the arcfinder detection efficiency and overall performance in Section 3; we present the arc abundance results for the CLASH observations in Section 4; we describe the cluster simulation and ray-tracing calculations in Section 5; we compare the observed and simulated arc abundance results in Section 6, including specifically testing the dependence of the abundance on the source redshift distribution and relation in Section 7; a discussion and summary are given in Section 8 and 9, respectively. Throughout the paper, we adopt a cosmology with parameters , , , , and (Planck Collaboration et al., 2014).
2 Conceptual Development of the Arcfinder
In early works on arc statistics, arc detection was performed by visual inspection due, in part, to the complex shapes of arcs and the crowded environments in which they are found. An automated arc finding algorithm has three key advantages over visual search methods. First, the detection process is reproducible and can be implemented by anyone who learns how to run the code. Second, it can be applied to a large number of real and simulated images. Finally, the detection efficiency and false positive rate can be accurately quantified using artificial objects implanted in real data or using simulated images created by ray-tracing sources through lens models. The biggest challenge to developing such an algorithm is creating a definition of an arc for the purpose of detection that can be implemented in a robust manner using parameters that can be easily quantified from astronomical images.
An ideal arc finder should have the following characteristics:
-
1.
The arc finder should be able to suppress image noise to enhance the contrast of real, low surface brightness arcs without significantly altering the intrinsic shape characteristics of these faint objects.
-
2.
The selection of pixels belonging to arcs should, if possible, not be based on a global fixed intensity threshold as the intensity can vary significantly across a lensed image.
-
3.
The arc finder must employ rules to reject spurious detections such as diffraction spikes from bright stars or edge-on disk galaxies.
-
4.
The arc finder must be able to process many images in a reasonable amount of time.
Here we describe an algorithm for identifying giant arcs - the arcs we are most interested in analyzing in this work. The algorithm was designed to reasonably comply with the above criteria. The parameters that define what we consider to be a giant arc, such as the minimum length and length-to-width ratio, are presented in Section 3.2. Figure 1 shows a flowchart of the steps involved in the algorithm and summarizes its key components. The detailed descriptions of the various steps that comprise the algorithm can be found in appendices A through F.

3 Arcfinder Testing and Performance
3.1 Simulating Arcs
To compute the true arc abundance from the detected one, we must quantify the incompleteness and false positive rate of the arcfinder using a combination of actual and simulated datasets. The most robust way to simulate arcs is via ray-tracing in which light rays from objects in a source plane are shot towards the observer, deflected by the lens plane, and projected onto the image plane (the “sky” as seen by the observer). To quantify the incompleteness and false positive rate, one needs to trace large number of simulated arcs which is often very CPU intensive. Moreover, we need full control of all the input parameters of simulated arcs to perform the tests efficiently, and this becomes difficult to do solely by ray-tracing objects that are placed randomly on the source plane.
Furlanetto et al. (2013) use a different approach to simulate the arcs. Their basic idea is to represent an arc as a curved ellipse with its main axis being a segment of a circle. The model arc is then superposed directly on an image at various locations. The arc’s shape is set by various parameters (e.g., length, width, curvature and orientation) chosen to mimic the shapes of real lensed galaxies. The surface brightness distribution is set using a Sersic law profile. The intensity parameters include the Sersic index and the intensity at the center of the arc, which allows one to assign any magnitude or the total flux to the simulated arcs. However, this simple analytic prescription does not precisely reproduce the properties of real arcs. For example, the “painted-on” arcs tend to have a deficit of surface brightness at their long ends, which can result in shape measurement biases, especially for faint arcs. For a robust comparison between the real data and simulations, the “painted” arc method falls short of the fidelity that is required.
We adopt a hybrid approach to simulate the arcs: simulate a representative set of arcs via ray-tracing with a range of ratios and surface brightnesses and then “paint” these template arcs onto the background images. This approach keeps the advantages of both methods: realistic arc rendering and fast performance. First, we perform ray-tracing by using simulated cluster lens with a NFW profile and a simulated background source with a Sersic profile. Second, we fine tune the distance from the source to the caustic line of the lens and carefully measure the ratio of the formed arcs. We keep those arcs with ratio that are closest to integer values as templates, as shown in Figure 2. We then create many additional simulated arcs by arbitrarily rotating the template images and by adjusting the total flux as desired. These arcs are then inserted into both simulated and actual CLASH images for our arcfinder performance testing. A detailed discussion on the general detectability of arcs as a function of source properties can be found in Meneghetti et al. (2008).


In order to accurately determine the arc detection completeness, we must account for the effects such as light contamination from cluster galaxies, variable sky background and instrumental noise. We accomplish this by inserting the arc templates into actual CLASH detection images (a weighted co-addition of all of the ACS and WFC3-IR images for a given cluster). An example of a CLASH detection image, with the brightest cluster galaxy subtracted out, is shown in Figure 3. We simulate a total of 14700 arcs spread over 7 different values and 7 different total flux values. For the purpose of computing a measure of the algorithm’s detection completeness, we only look at the fraction of simulated arcs that are detected, even though we are inserting the simulated arcs into real cluster data with real arcs. The completeness is then just the ratio of the number of the simulated arcs detected to the total number of arcs simulated. The inverse of this ratio, , is then the multiplicative factor that we will apply to any raw arc count to correct for incompleteness.
We also utilize the F814W CANDELS (Grogin et al., 2011; Koekemoer et al., 2011) images in the false positive rate test because there are no strong lensed sources in the CANDELS fields. We select images from the CANDELS “Wide programs” (e.g. the UDS and COSMOS fields), which have the similar total exposure times as the CLASH detection images () and split these mosaics into smaller images that match the angular size of the CLASH co-added images. We run the arcfinder on the CANDELS data and compute the surface density of detections as functions of both the threshold and the total arc length, . This comprises the basis for our false positive correction function.
We use the CLASH data with simulated arcs to measure our arcfinder completeness as a function of arc length, ratio, and arc signal-to-noise ratio (SNR). Here we define the SNR of arc as: , where is the intensity from the source at pixel and is the combined variance due to the sky background and all sources of detector noise at pixel . In our completeness test, the total flux of each drawn arc is adjusted to match the assigned SNR value. We use the CANDELS images to assess the arcfinder false positive rate. Figure 4 shows the completeness versus the detection threshold, , at . The completeness remains at a high level ( for ) when the ; Figure 5 shows the false positive rate in the CANDELS data as a function the detection threshold when the minimum arc length is set to . The detected number of false positives is slightly above 10 at low , while it decrease rapidly as increases. Figure 5 shows the false positive rate as a function of the length of the objects when the threshold is set to 7. The number of the false positive detections peaks in the length bin . The spurious detections can, thus, be suppressed if we adopt a minumum length threshold of .
We have not applied this minimum length threshold to our completeness test because the identification of the arcs does not depend on the length (only depends on and ). Moreover, the intensity gradient along the ridge line of the arc should be smaller than that in the perpendicular direction, which mean that the length measurement should be more immune to the noise effects. To test that, we measure the ratio of the detected length to the true length of the simulated arcs. Figure 6 shows the distribution of the ratio at three different levels. The dashed lines indicate the median value of the ratio. We can see that both the distribution and the median value remain statistically similar at different levels.
3.2 Determination of the Optimal Detection Threshold
In previous studies, the detection threshold is typically set to 7.5, 8 or 10. Generally, the reason to set a high threshold is to avoid the inclusion of highly elliptical and edge-on spiral galaxies into the arc sample. In general, the lower threshold one uses, the more contamination one gets. Hence it is desirable to find a threshold that maximizes the completeness level and minimizes the false positive rate. We now use our measured estimates of the completeness and false positive rate as a function of the minimal to identify the optimal threshold to use in the construction of our final arc catalog. We do this by identifying the smallest threshold at which the surface density of detected simulated arcs, , exceeds the surface density of false positive detections, , by a factor of 5 or more. The results of this test are shown in Figure 6. We find that the ratio is always larger than 5 when the detection threshold is larger than 7. We thus adopt the detection threshold of 7 in our analysis of the arc abundance. The false positive rate for and an arc length threshold is arcmin-2. We use this false positive rate to correct our corresponding raw arc counts.


3.3 Elongation Bias, Incompleteness and False Positive Rate Correction
There are three statistical corrections we need to apply to the raw counts of the giant arcs. First, the detected is not equal to the true . The background noise and/or the segmentation boundaries of a detected object may systematically affect the determination of the ratio. We need to determine how the detected ratio deviates from the true ratio at different levels, and correct for this elongation bias in a statistical sense. For example, as shown in Figure 7, the detected ratio of arcs can be biased high by image noise, as the noise tends to make arcs appear thinner than they actually are. Second, we need to apply the incompleteness correction (presented above) as there will always be some real arcs that are missed by our detection algorithm. Third, we need to apply a false positive correction as there are always some objects misidentified by the arcfinding algorithm. We apply all these three corrections in deriving the final observed and simulated arc abundances.

To compute the elongation bias correction, we collect all the detected arcs with measured 6.5 111In practice, we set the threshold to be 6.5 instead of 7. The bias correction is then done by comparing the arcs with detected ratios in the range 6.5 7.5 to the number with true 7., and assign them to one of the three bins: 6.5 7.5, 7.5 8.5 and 8.5. We also assign their corresponding true ratios into one of the three bins: 7, 8 and 9. We further split each bin into three sub-bins by their ratios: 5, 5 10 and 10. We then calculate the mean value and standard deviation of the correction factor for the elongation bias , where and are the number of simulated arcs and detected arcs in each bin, respectively.
The true arc count, , is then computed as follows:
| (1) |
where is the observed number of arcs in each bin and goes over all the bins. As shown in Figure 8(a) and Figure 8(b), most of the measured are biased high, especially for the arcs with intrinsically low . The completeness remains above 80% for all the cases. Here, biased high means that arcs with “true” low have their values systematically overestimated. The mean ratio of the observed to the “true” also appears to be dependent on the true ratio as shown in Figure 7.


3.4 Comparison of Arcfinder’s Performance with a Previous Code
We compare the arc detection efficiency of our arcfinder to that of the only publicly available arc-finding code from Horesh et al. (2005). We simulate a large amount of arc with different ratios and draw gaussian random noise onto the arcs to produce simulated arc images with 7 different levels. We run both arcfinding algorithms on these simulated data sets.
Figure 9 shows the detection rate versus the arc ratio level for arcs with true 7, 10, at a detection threshold 7. We have computed the ratio for detected arcs found using each of the algorithms using the definition given in §3.1. For the bright arcs ( 10), the detection rates for both arcfinders remains high (); for faint arcs (5 10), the Horesh et al. (2005) arcfinder’s detection rate drops rapidly, while our algorithm’s detection efficiency remains higher than 90%; for very faint arcs ( 5), our detection rate drops to about 80%. The advantage of our intensity-gradient based arc-finding algorithm is nicely demonstrated in Figure 9, especially for the detection of large arcs with low-surface brightness.

4 Analyses of the CLASH Data
4.1 Arc Statistics for the CLASH Sample
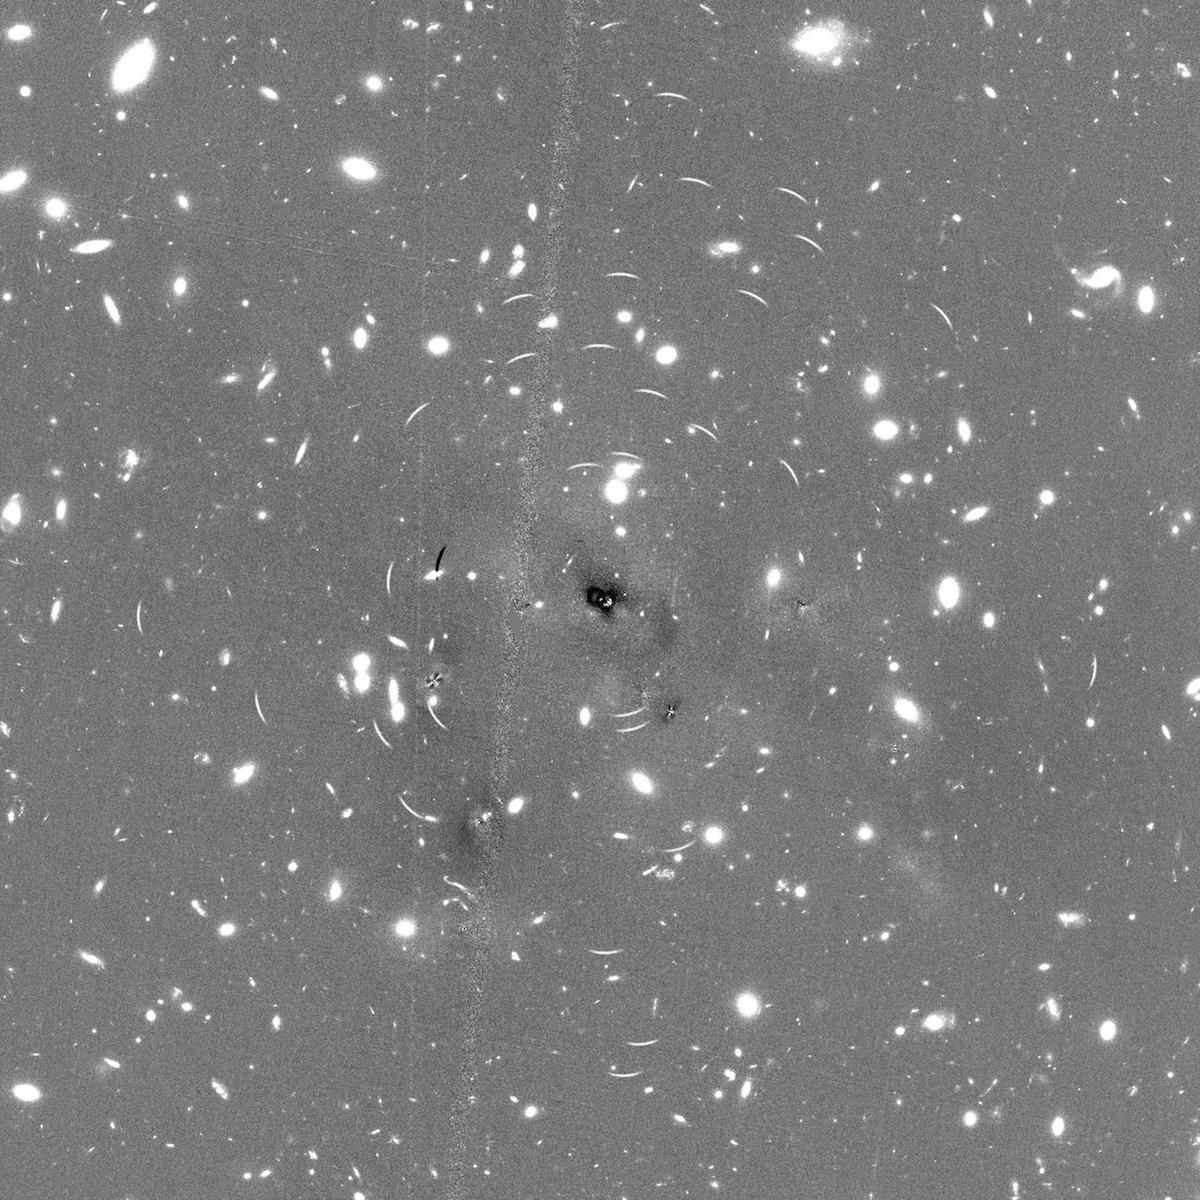
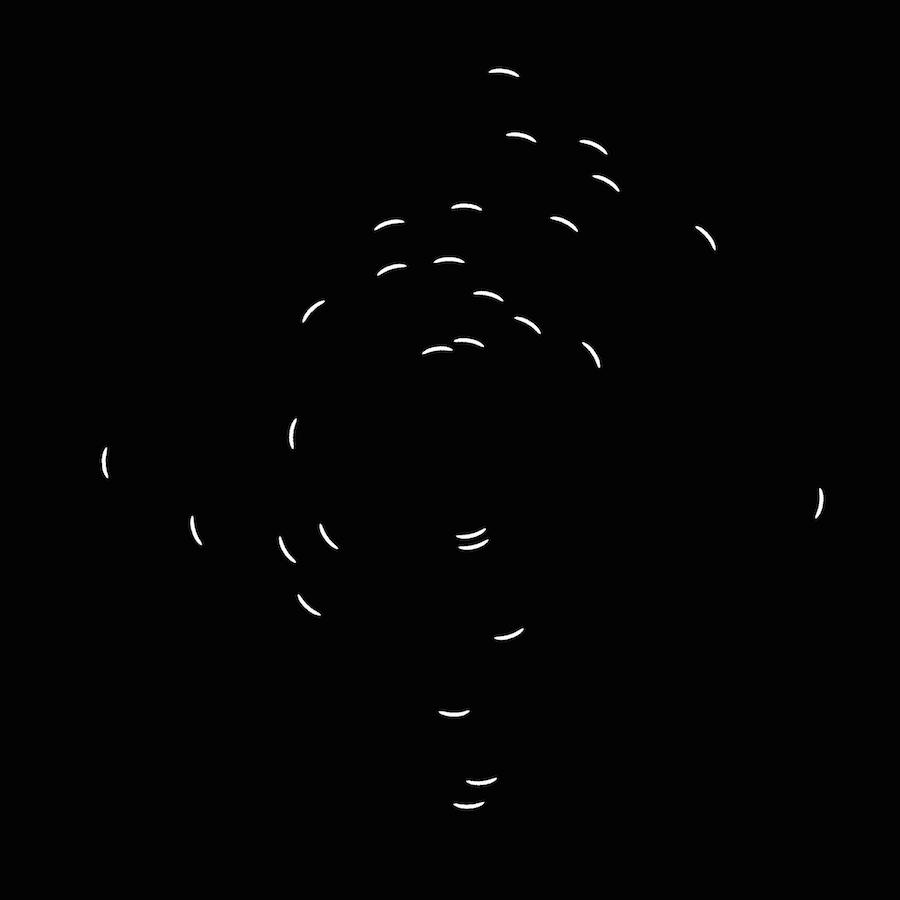
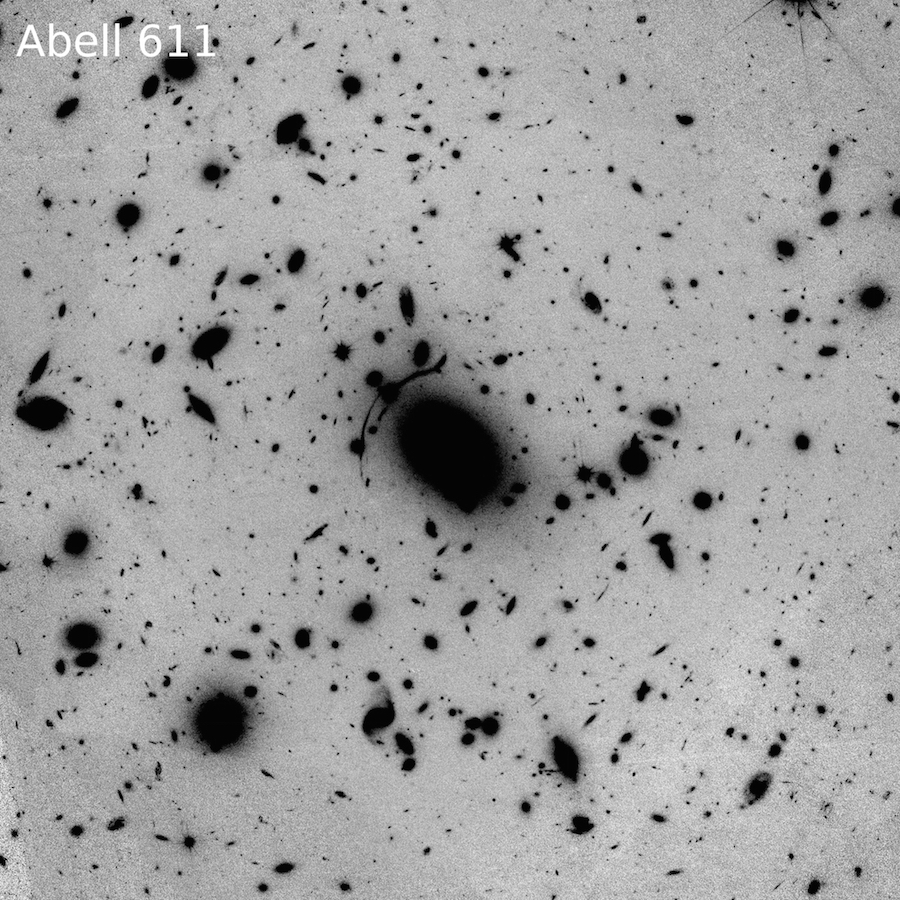
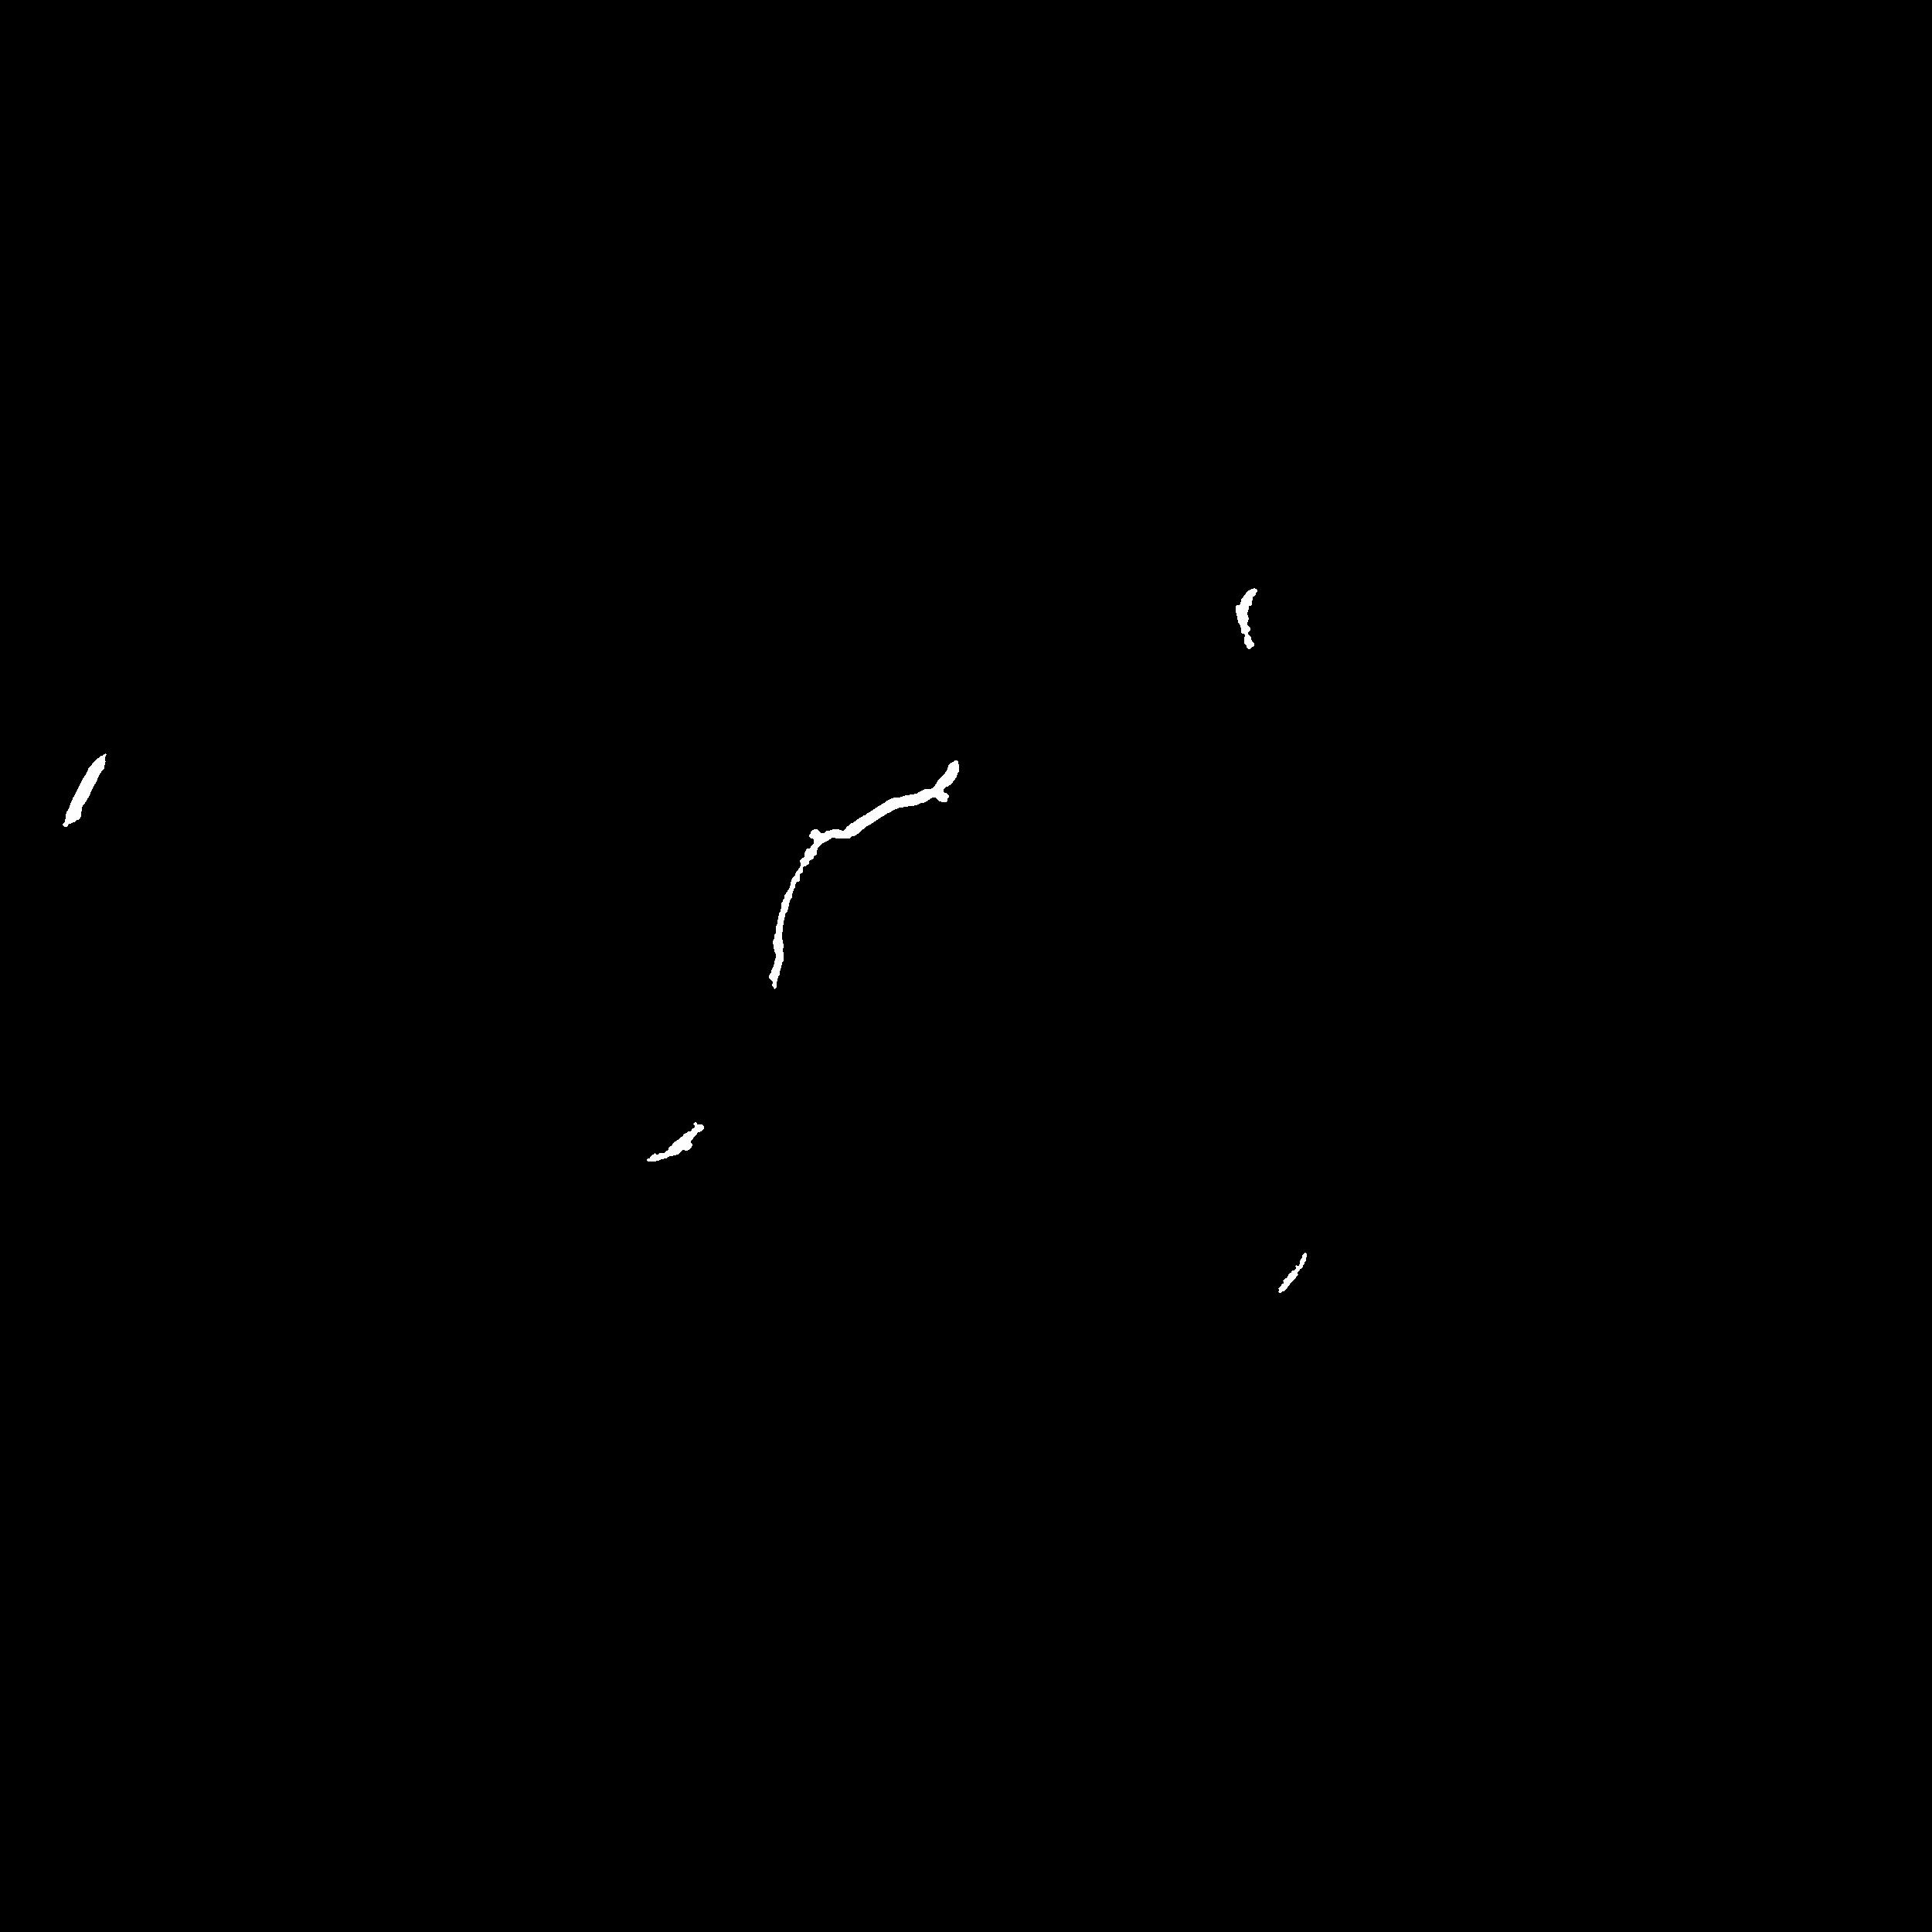
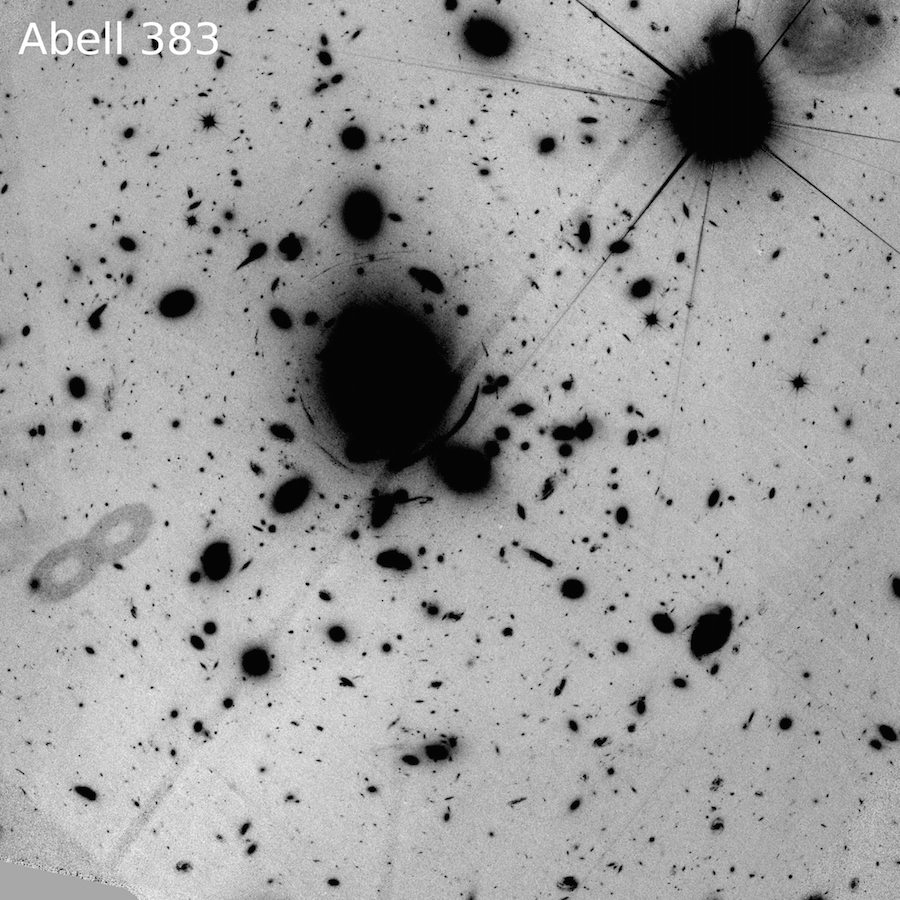
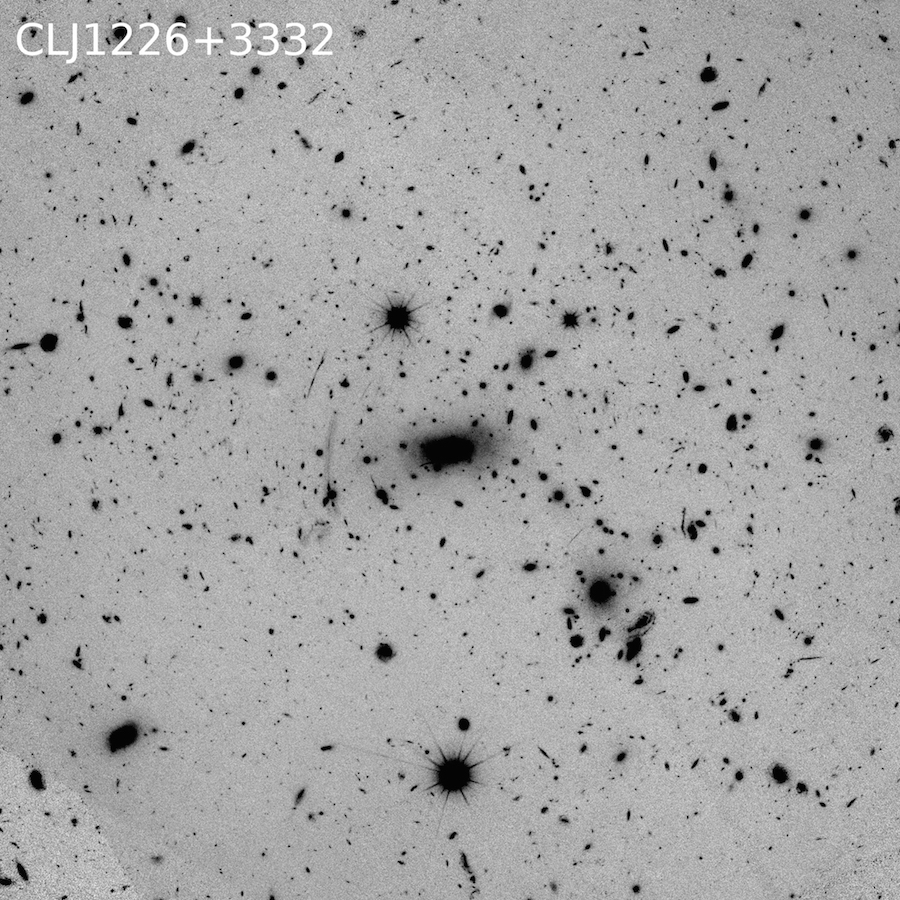
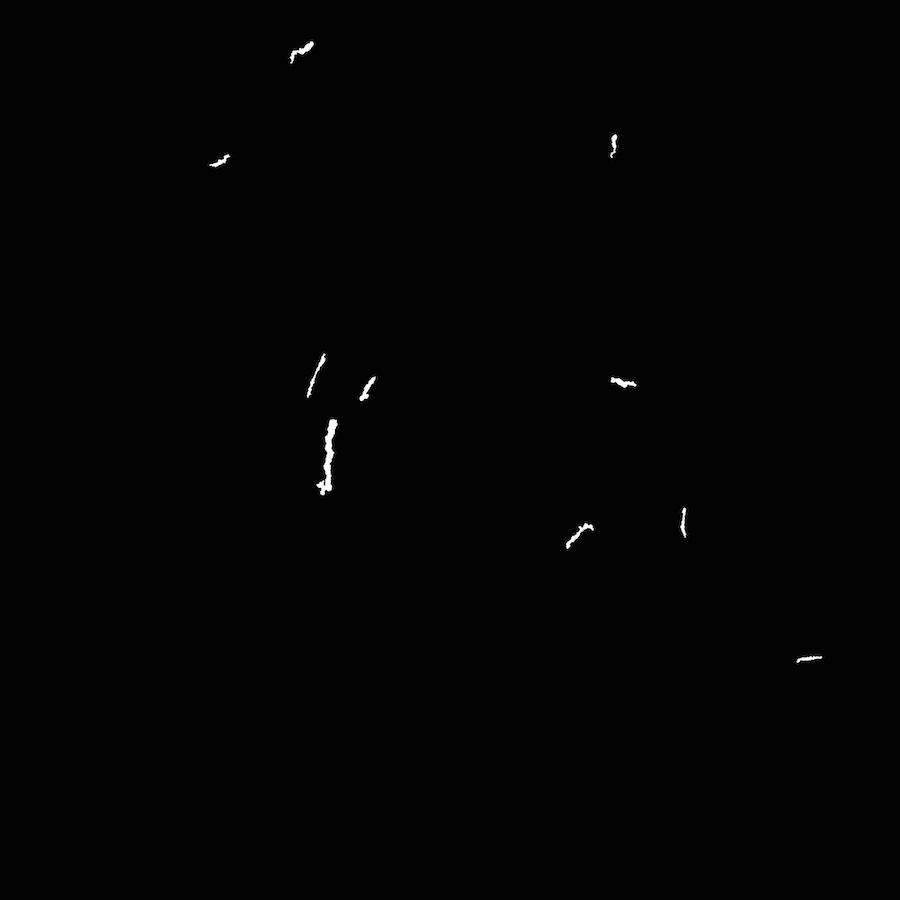
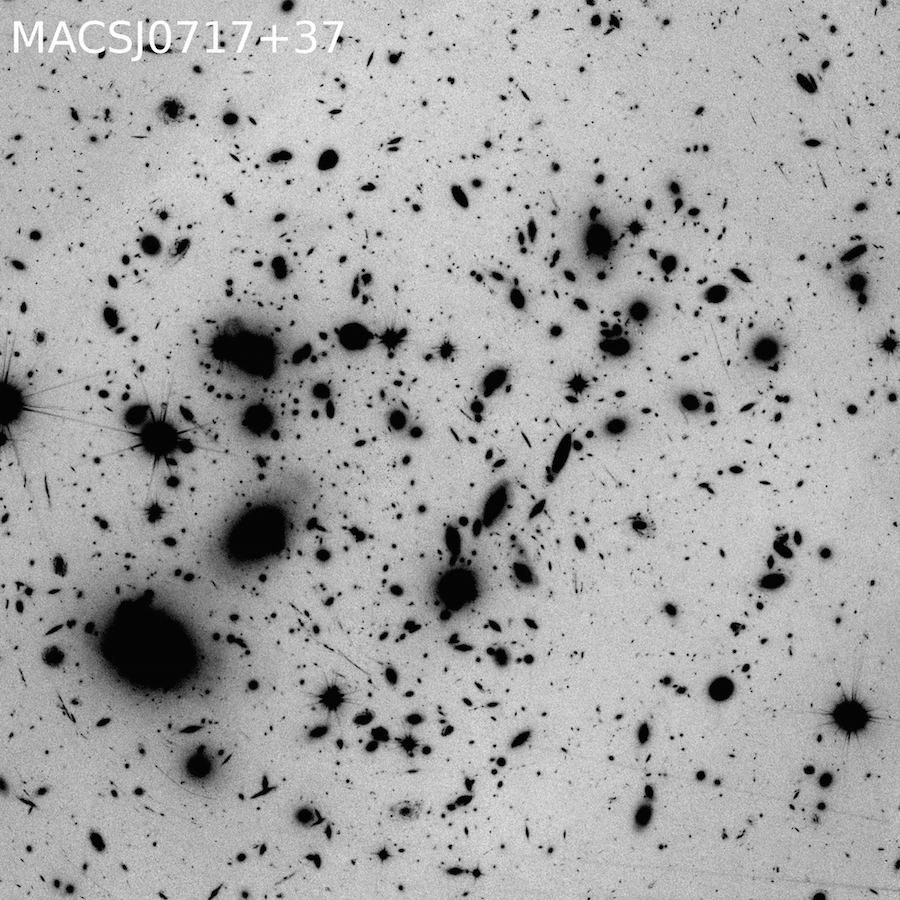
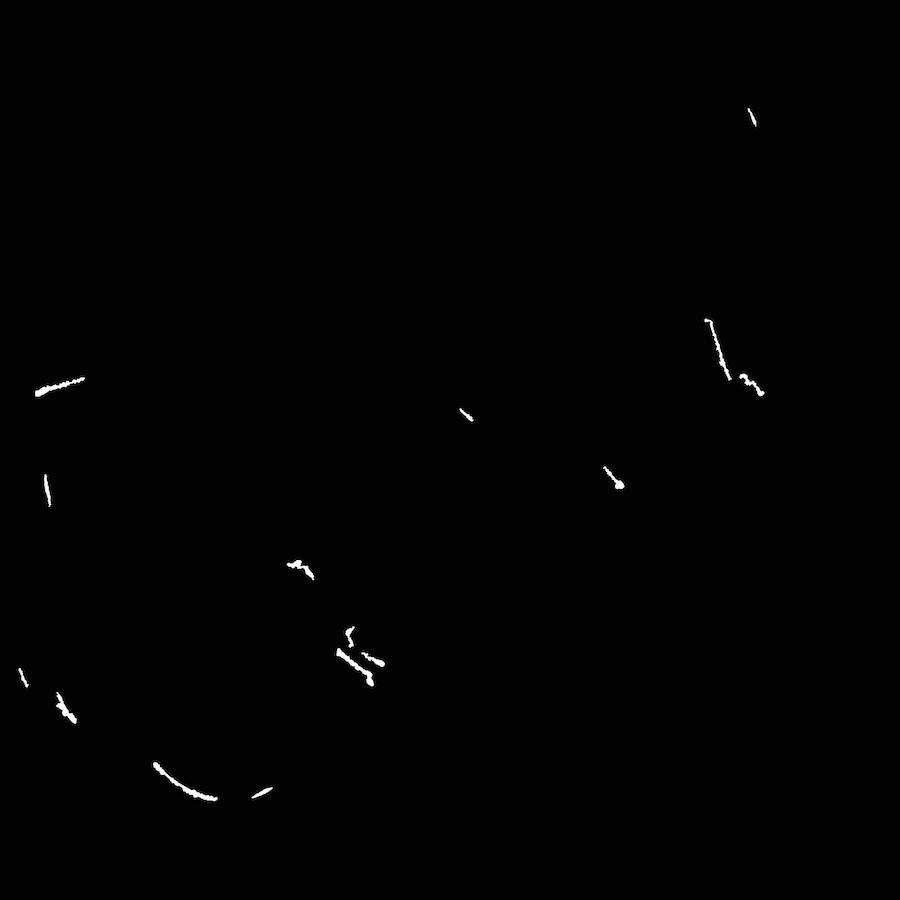
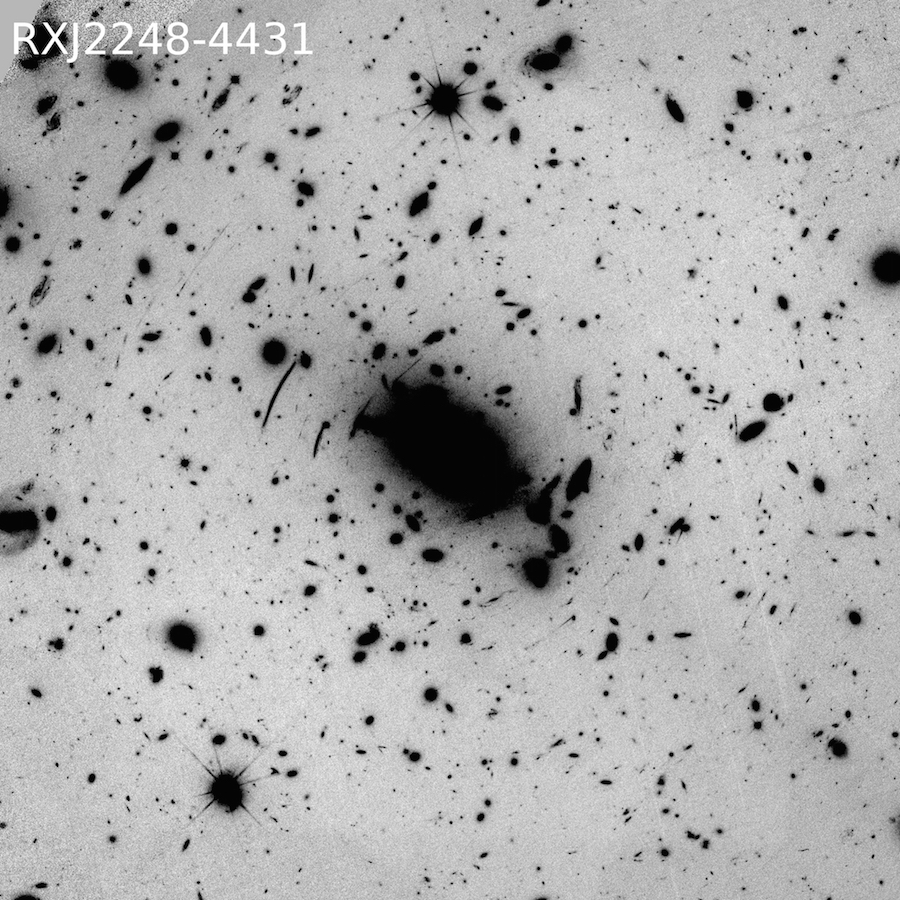
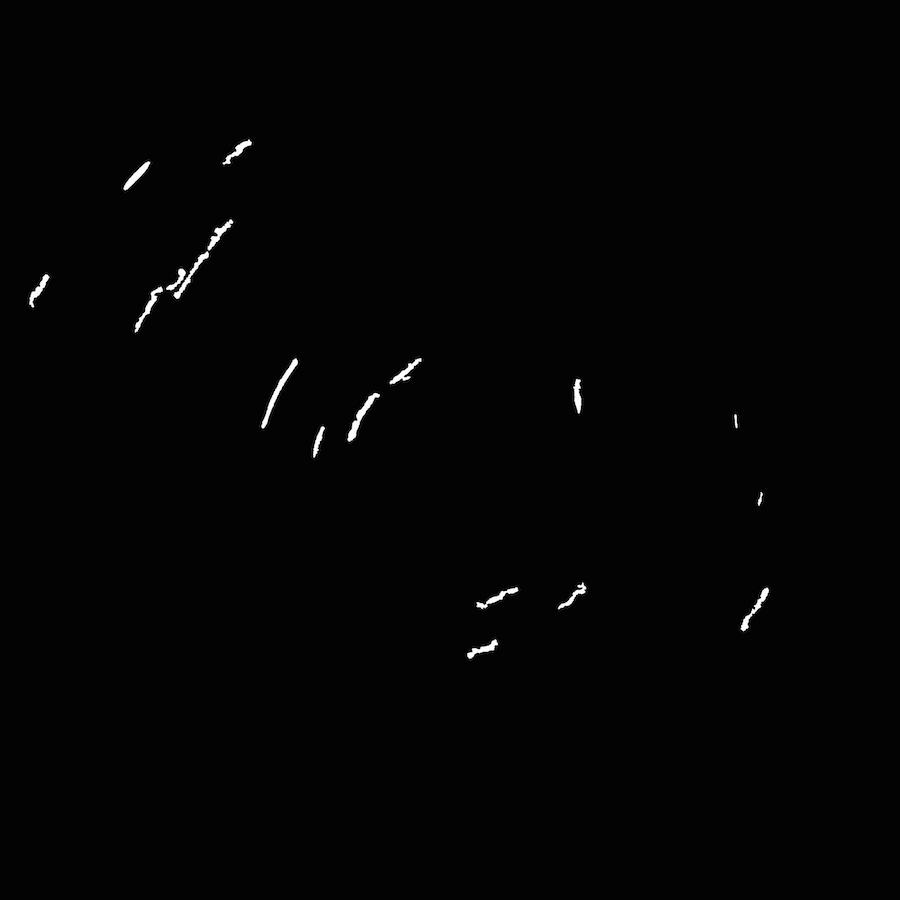
The CLASH observations for each cluster consist of 16 broadband images (spanning the range ) using the , , and instruments onboard HST. The cluster properties are listed in Table 1. We run our arcfinder on the detection () image created for each cluster. We detect a raw total of 187 arcs with in 20 X-ray selected CLASH clusters. After applying our minimum arc length criterion , the arc count drops to 81 giant arcs selected from the 20 X-ray selected CLASH clusters. Correcting for the elongation bias and incompleteness brings the total number of detected arcs in 20 X-ray selected clusters is . After further correcting for the false positive rate, we find a lensing efficiency of arcs per X-ray selected cluster. Throughout this paper, the lensing efficiency denotes the number of arcs per cluster. There are 28 arcs with and detected in the five high-magnification CLASH clusters, corresponding to a mean value arcs per cluster after all corrections are applied. Figure 10 shows the distributions of number of arcs per cluster for the X-ray selected cluster sample and the high magnification cluster sample. Figure 11 shows the comparison of the detection images with the raw output of the arcfinder with for five CLASH clusters.


| ClusteraaCentral cluster coordinates derived from optical image. | ||||
|---|---|---|---|---|
| X-ray Selected Clusters: | ||||
| Abell 209 | 01:31:52.57 | 13:36:38.8 | 0.206 | |
| Abell 383 | 02:48:03.36 | 03:31:44.7 | 0.187 | |
| MACS0329.7-0211 | 03:29:41.68 | 02:11:47.7 | 0.450 | |
| MACS0429.6-0253 | 04:29:36.10 | 02:53:08.0 | 0.399 | |
| MACS0744.9+3927 | 07:44:52.80 | +39:27:24.4 | 0.686 | |
| Abell 611 | 08:00:56.83 | +36:03:24.1 | 0.288 | |
| MACS1115.9+0129 | 11:15:52.05 | +01:29:56.6 | 0.352 | |
| Abell 1423 | 11:57:17.26 | +33:36:37.4 | 0.213 | |
| MACS1206.2-0847 | 12:06:12.28 | 08:48:02.4 | 0.440 | |
| CLJ1226.9+3332 | 12:26:58.37 | +33:32:47.4 | 0.890 | |
| MACS1311.0-0310 | 13:11:01.67 | 03:10:39.5 | 0.494 | |
| RXJ1347.5-1145 | 13:47:30.59 | 11:45:10.1 | 0.451 | |
| MACS1423.8+2404 | 14:23:47.76 | +24:04:40.5 | 0.545 | |
| RXJ1532.9+3021 | 15:32:53.78 | +30:20:58.7 | 0.345 | |
| MACS1720.3+3536 | 17:20:16.95 | +35:36:23.6 | 0.391 | |
| Abell 2261 | 17:22:27.25 | +32:07:58.6 | 0.224 | |
| MACS1931.8-2635 | 19:31:49.66 | 26:34:34.0 | 0.352 | |
| RXJ2129.7+0005 | 21:29:39.94 | +00:05:18.8 | 0.234 | |
| MS2137-2353 | 21:40:15.18 | 23:39:40.7 | 0.313 | |
| RXJ2248.7-4431 (Abell 1063S) | 22:48:44.29 | 44:31:48.4 | 0.348 | |
| High Magnification Clusters: | ||||
| MACS0416.1-2403 | 04:16:09.39 | 24:04:03.9 | 0.420 | |
| MACS0647.8+7015 | 06:47:50.03 | +70:14:49.7 | 0.584 | |
| MACS0717.5+3745 | 07:17:31.65 | +37:45:18.5 | 0.548 | |
| MACS1149.6+2223 | 11:49:35.86 | +22:23:55.0 | 0.544 | |
| MACS2129.4-0741 | 21:29:26.06a | 07:41:28.8a | 0.570 |
4.2 The Arc Redshift Distribution
We determine the photometric redshift distribution of the lensed background galaxies detected by our algorithm using the photometric redshifts derived with the Bayesian-based BPZ package (BPZ; Benítez (2000, 2004); Coe et al. (2006)). Spectral energy distribution (SED) templates are redshifted and fit to the observed photometry. The BPZ code adopts a prior that the empirical likelihood of redshift is a function of both galaxy magnitude and galaxy morphological type (e.g., bright and/or elliptical galaxies are rare at high redshift). We used 11 SED templates originally from PEGASE (Fioc & Rocca-Volmerange, 1997) that have been recalibrated based on photometry and spectroscopic redshifts of galaxies in the FIREWORKS catalog (Wuyts et al., 2008). We obtain the photometric redshift distribution of all the detected arcs and find that they have a median photometric redshift . We also find that there is a significant fraction of arcs with (34% of the detected arcs have photometric redshift larger than 3). Figure 12 shows the arc number counts as a function of redshift before and after correcting for the measurement bias, incompleteness and false positive rate. To compute the photometric redshift distribution of our arc sample, we sum up the individual posterior redshift probability distributions of each detected arc. The mean uncertainty of the photometric redshifts in CLASH is and, thus, we sample the probability distribution using the bin size which is twice as large as the uncertainty of the arc with highest redshift. The summed distribution prior to correction for our selection function and elongation bias is shown as the blue line in Figure 12. To correct for the selection bias, incompleteness and false positive rate, we re-sum the probability distribution for each arc after first multiplying by the appropriate correction factors. The fully corrected redshift distribution, derived in this way, is shown by the red line in in Figure 12. Figure 13 also lists the distribution of arc ratio, arc AB magnitude in F814W filter, arc ratio, and the normalized angular distance of the arc from the cluster center. Table 2 lists the properties of all the detected arcs in 20 X-ray selected sample, including the equatorial and pixel coordinates, length, ratio, radial distance from the arc center to the cluster center, the normalized radial distance by , the photometric redshift and the AB magnitude in the F814W band. In Table 2, we do not exclude the objects with photometric redshifts that are significantly smaller than the corresponding cluster redshift. Such probable foreground sources are considered to be false positive detections. We eliminate false positive detections statistically when we calculate the arc redshift distribution in the CLASH sample.


| Cluster | Arc ID | RA | DEC | (′′) | RD (′′)aaRD = radial distance from the arc center to the cluster center in the unit of arcsecond; IDs with denote the false positive detection. | RD/ | AB mag (F814W) | ||||
|---|---|---|---|---|---|---|---|---|---|---|---|
| Abell1423 | 1 | 179.33 | 33.60 | 2204.00 | 1905.00 | 6.82 | 9.67 | 43.09 | 1.09 | 0.62 | 22.61 |
| †2 | 179.30 | 33.62 | 3553.00 | 3227.00 | 6.14 | 7.61 | 82.69 | 2.10 | 0.00 | 24.29 | |
| Abell209 | 1 | 22.96 | -13.61 | 2760.00 | 2738.00 | 11.90 | 10.00 | 23.16 | 0.62 | 3.50 | 21.73 |
| Abell2261 | †1 | 260.59 | 32.12 | 3542.00 | 1698.00 | 7.08 | 8.89 | 84.98 | 1.84 | 0.00 | 24.39 |
| †2 | 260.61 | 32.12 | 2505.00 | 1994.00 | 8.46 | 10.55 | 32.18 | 0.70 | 0.33 | 23.01 | |
| 3 | 260.62 | 32.13 | 2165.00 | 2317.00 | 6.72 | 7.92 | 24.54 | 0.53 | 3.54 | 23.75 | |
| 4 | 260.60 | 32.13 | 2902.00 | 2395.00 | 10.55 | 14.29 | 26.77 | 0.58 | 1.80 | 22.07 | |
| †5 | 260.64 | 32.13 | 1324.00 | 2620.00 | 13.06 | 23.34 | 76.98 | 1.67 | 0.27 | 23.79 | |
| 6 | 260.61 | 32.15 | 2577.00 | 3516.00 | 6.64 | 10.20 | 66.94 | 1.45 | 1.35 | 23.22 | |
| Abell383 | 1 | 42.03 | -3.54 | 1620.00 | 2246.00 | 6.80 | 7.03 | 54.43 | 1.30 | 0.73 | 25.74 |
| 2 | 42.02 | -3.53 | 2181.00 | 2462.00 | 12.36 | 14.63 | 17.70 | 0.42 | 4.22 | 22.94 | |
| 3 | 42.01 | -3.53 | 2553.00 | 2616.00 | 19.23 | 22.41 | 15.27 | 0.36 | 0.89 | 20.15 | |
| 4 | 42.02 | -3.53 | 2114.00 | 2579.00 | 7.32 | 7.91 | 15.79 | 0.38 | 3.12 | 23.20 | |
| 5 | 42.03 | -3.53 | 1566.00 | 2735.00 | 6.33 | 8.56 | 49.75 | 1.18 | 2.46 | 25.06 | |
| †6 | 42.01 | -3.53 | 2314.00 | 2691.00 | 8.43 | 9.01 | 1.04 | 0.02 | 0.30 | 21.93 | |
| 7 | 42.00 | -3.53 | 2828.00 | 2893.00 | 7.48 | 17.11 | 34.96 | 0.83 | 6.31 | 23.92 | |
| 8 | 42.01 | -3.52 | 2281.00 | 3035.00 | 20.42 | 31.37 | 22.65 | 0.54 | 5.00 | 23.33 | |
| 9 | 42.01 | -3.52 | 2281.00 | 3024.00 | 7.87 | 16.59 | 21.94 | 0.52 | 3.24 | 24.81 | |
| Abell611 | 1 | 120.24 | 36.06 | 2335.00 | 2665.00 | 25.66 | 30.64 | 15.35 | 0.40 | 1.12 | 20.44 |
| †2 | 120.26 | 36.06 | 1358.00 | 2727.00 | 7.02 | 7.37 | 75.89 | 2.00 | 0.27 | 19.75 | |
| CLJ1226 | 1 | 186.74 | 33.54 | 2838.00 | 2253.00 | 6.30 | 9.52 | 26.72 | 1.52 | 2.79 | 25.90 |
| 2 | 186.75 | 33.54 | 2164.00 | 2394.00 | 14.22 | 12.37 | 23.10 | 1.31 | 2.30 | 24.96 | |
| 3 | 186.75 | 33.55 | 2144.00 | 2742.00 | 8.47 | 19.19 | 28.47 | 1.62 | 3.45 | 23.79 | |
| MACS0329 | 1 | 52.41 | -2.19 | 3049.00 | 2869.00 | 7.96 | 9.55 | 43.27 | 1.56 | 1.03 | 23.28 |
| 2 | 52.42 | -2.18 | 2685.00 | 3153.00 | 6.20 | 9.45 | 44.66 | 1.61 | 3.35 | 24.25 | |
| MACS0429 | 1 | 67.40 | -2.90 | 2752.00 | 1709.00 | 6.48 | 8.01 | 52.93 | 2.08 | 1.67 | 24.22 |
| 2 | 67.40 | -2.89 | 2499.00 | 2200.00 | 10.69 | 12.24 | 18.83 | 0.74 | 1.35 | 21.79 | |
| MACS0744 | †1 | 116.22 | 39.44 | 2682.00 | 1488.00 | 7.00 | 7.56 | 66.12 | 3.43 | 0.41 | 20.22 |
| 2 | 116.23 | 39.45 | 2128.00 | 2078.00 | 6.41 | 7.74 | 36.39 | 1.89 | 4.79 | 23.85 | |
| †3 | 116.20 | 39.45 | 3147.00 | 2191.00 | 7.32 | 7.32 | 45.92 | 2.38 | 0.14 | 18.48 | |
| 4 | 116.23 | 39.46 | 1969.00 | 2581.00 | 6.75 | 9.40 | 35.47 | 1.84 | 4.73 | 23.99 | |
| 5 | 116.23 | 39.46 | 2033.00 | 2625.00 | 6.10 | 8.37 | 32.04 | 1.66 | 4.41 | 24.43 | |
| 6 | 116.20 | 39.46 | 3477.00 | 2652.00 | 7.56 | 14.86 | 63.92 | 3.32 | 4.11 | 23.76 | |
| 7 | 116.21 | 39.46 | 2839.00 | 2632.00 | 6.77 | 7.71 | 23.47 | 1.22 | 1.17 | 20.34 | |
| MACS1115 | 1 | 168.96 | 1.49 | 2602.00 | 2228.00 | 14.44 | 18.05 | 18.34 | 0.58 | 2.46 | 23.08 |
| 2 | 168.98 | 1.50 | 1586.00 | 2402.00 | 9.53 | 15.25 | 60.03 | 1.90 | 1.76 | 24.83 | |
| †3 | 168.97 | 1.50 | 2500.00 | 2374.00 | 7.76 | 7.60 | 7.74 | 0.25 | 0.42 | 20.91 | |
| 4 | 168.97 | 1.50 | 2355.00 | 2371.00 | 10.65 | 12.58 | 12.57 | 0.40 | 4.21 | 21.72 | |
| 5 | 168.96 | 1.51 | 2896.00 | 2911.00 | 14.52 | 16.16 | 37.20 | 1.18 | 4.12 | 22.91 | |
| 6 | 168.96 | 1.51 | 2578.00 | 3022.00 | 7.14 | 7.11 | 34.71 | 1.10 | 3.25 | 24.41 | |
| MACS1206 | †1 | 181.55 | -8.81 | 2247.00 | 2078.00 | 6.69 | 7.04 | 28.16 | 0.99 | 0.55 | 20.26 |
| 2 | 181.54 | -8.80 | 2790.00 | 2454.00 | 14.27 | 15.73 | 19.47 | 0.68 | 1.05 | 19.76 | |
| 3 | 181.54 | -8.80 | 3292.00 | 2420.00 | 6.54 | 7.51 | 52.08 | 1.83 | 2.41 | 24.64 | |
| †4 | 181.55 | -8.80 | 2477.00 | 2438.00 | 11.97 | 10.88 | 0.92 | 0.03 | 0.49 | 23.77 | |
| 5 | 181.57 | -8.80 | 1618.00 | 2471.00 | 8.39 | 12.32 | 56.79 | 1.99 | 1.56 | 23.19 | |
| 6 | 181.53 | -8.79 | 3484.00 | 3134.00 | 8.36 | 8.57 | 78.90 | 2.77 | 0.72 | 19.30 | |
| MACS1311 | 1 | 197.75 | -3.17 | 2881.00 | 2742.00 | 6.25 | 7.66 | 29.33 | 1.30 | 2.83 | 24.77 |
| MACS1423 | †1 | 215.93 | 24.07 | 3433.00 | 2050.00 | 9.84 | 17.73 | 66.78 | 3.12 | 0.00 | 23.74 |
| 2 | 215.95 | 24.07 | 2606.00 | 2128.00 | 6.13 | 7.80 | 24.49 | 1.14 | 1.47 | 23.92 | |
| 3 | 215.94 | 24.07 | 2804.00 | 2120.00 | 8.80 | 15.30 | 30.97 | 1.45 | 2.57 | 23.94 | |
| 4 | 215.95 | 24.08 | 2378.00 | 2773.00 | 8.18 | 11.48 | 20.10 | 0.94 | 1.79 | 22.72 | |
| 5 | 215.95 | 24.09 | 2576.00 | 3211.00 | 7.70 | 11.46 | 47.03 | 2.20 | 3.16 | 24.47 | |
| MACS1720 | 1 | 260.06 | 35.60 | 2757.00 | 2042.00 | 8.33 | 11.23 | 33.32 | 1.20 | 4.38 | 24.29 |
| 2 | 260.07 | 35.60 | 2621.00 | 2346.00 | 8.60 | 10.80 | 11.90 | 0.43 | 0.82 | 23.23 | |
| MACS1931 | 1 | 292.96 | -26.59 | 2559.00 | 1917.00 | 9.71 | 11.49 | 37.90 | 1.38 | 3.55 | 24.23 |
| MS2137 | 1 | 325.06 | -23.66 | 2422.00 | 2713.00 | 14.81 | 12.99 | 14.59 | 0.46 | 1.77 | 21.78 |
| 2 | 325.07 | -23.65 | 2181.00 | 2903.00 | 10.75 | 14.08 | 33.37 | 1.05 | 1.71 | 23.95 | |
| 3 | 325.07 | -23.65 | 2215.00 | 3046.00 | 10.93 | 12.95 | 39.93 | 1.26 | 1.97 | 23.86 | |
| RXJ1347 | 1 | 206.87 | -11.77 | 3032.00 | 1776.00 | 12.76 | 21.51 | 55.55 | 1.82 | 1.64 | 23.58 |
| 2 | 206.87 | -11.76 | 3141.00 | 2064.00 | 9.07 | 11.79 | 46.58 | 1.52 | 2.43 | 21.57 | |
| 3 | 206.87 | -11.75 | 3117.00 | 2872.00 | 7.02 | 10.12 | 43.42 | 1.42 | 4.28 | 24.63 | |
| 4 | 206.88 | -11.75 | 2521.00 | 2951.00 | 6.82 | 7.51 | 29.92 | 0.98 | 0.78 | 21.46 | |
| 5 | 206.88 | -11.74 | 2549.00 | 3162.00 | 7.83 | 13.50 | 43.50 | 1.42 | 3.78 | 24.22 | |
| RXJ1532 | †1 | 233.22 | 30.34 | 2841.00 | 2088.00 | 7.75 | 9.30 | 34.16 | 1.25 | 0.27 | 22.25 |
| RXJ2129 | 1 | 322.41 | 0.08 | 2890.00 | 2044.00 | 7.42 | 7.79 | 38.34 | 1.36 | 3.17 | 23.61 |
| †2 | 322.44 | 0.09 | 1394.00 | 2310.00 | 6.26 | 9.57 | 73.09 | 2.60 | 0.00 | 24.96 | |
| 3 | 322.42 | 0.09 | 2295.00 | 2528.00 | 7.20 | 7.83 | 13.81 | 0.49 | 1.55 | 22.65 | |
| RXJ2248 | 1 | 342.18 | -44.54 | 2613.00 | 1950.00 | 6.15 | 6.89 | 36.42 | 1.31 | 3.08 | 24.18 |
| 2 | 342.16 | -44.54 | 3371.00 | 2095.00 | 8.91 | 11.34 | 62.35 | 2.25 | 3.09 | 24.02 | |
| 3 | 342.18 | -44.54 | 2622.00 | 2084.00 | 8.06 | 10.83 | 28.10 | 1.01 | 1.64 | 23.35 | |
| 4 | 342.17 | -44.54 | 2830.00 | 2074.00 | 6.61 | 9.53 | 34.94 | 1.26 | 2.75 | 24.42 | |
| 5 | 342.19 | -44.53 | 2227.00 | 2545.00 | 10.12 | 10.26 | 18.06 | 0.65 | 1.41 | 22.36 | |
| 6 | 342.19 | -44.53 | 2039.00 | 2697.00 | 13.95 | 17.47 | 32.67 | 1.18 | 1.38 | 21.32 | |
| 7 | 342.17 | -44.53 | 2853.00 | 2642.00 | 6.19 | 7.28 | 24.70 | 0.89 | 1.41 | 22.35 | |
| 8 | 342.19 | -44.53 | 2343.00 | 2684.00 | 7.32 | 8.80 | 15.81 | 0.57 | 3.76 | 24.48 | |
| 9 | 342.20 | -44.52 | 1664.00 | 2902.00 | 9.44 | 13.06 | 60.38 | 2.18 | 1.36 | 25.23 | |
| †10 | 342.21 | -44.52 | 1358.00 | 2943.00 | 6.42 | 7.33 | 79.70 | 2.87 | 0.00 | 21.79 | |
| 11 | 342.20 | -44.52 | 1743.00 | 2930.00 | 10.16 | 14.05 | 56.68 | 2.04 | 2.79 | 24.33 | |
| 12 | 342.20 | -44.52 | 1856.00 | 3108.00 | 6.95 | 7.97 | 57.66 | 2.08 | 1.96 | 24.89 | |
| †13 | 342.21 | -44.52 | 1629.00 | 3261.00 | 6.73 | 6.85 | 75.27 | 2.71 | 0.40 | 19.07 | |
| 14 | 342.20 | -44.52 | 1909.00 | 3340.00 | 6.49 | 7.68 | 66.85 | 2.41 | 0.85 | 24.11 |
5 MOKA Lensing Simulations
5.1 The MOKA Simulated Cluster Sample
In order to confirm or resolve the arc statistics problem, we require realistic model predictions to compare with the observed CLASH arc counts. In previous studies, mock clusters were selected from N-body simulations using either dark matter only (Wambsganss et al., 2004; Hilbert et al., 2007; Horesh et al., 2010) or dark matter with other ingredients (Puchwein et al., 2005; Gottlöber & Yepes, 2007; Rozo et al., 2008; Hilbert et al., 2008; Meneghetti et al., 2010). The simulated clusters were then projected onto the plane of the sky as viewed from various directions to create the 2-D mass models. However, the total number of clusters and/or their mass and redshift ranges used in these prior studies are not optimally matched to the CLASH dataset. Therefore, we generate a simulated cluster sample by running the publicly available MOKA package (Giocoli et al., 2012). MOKA uses simulation-calibrated analytical relations to describe the dark matter and baryonic content of clusters, which allows one to incorporate all the cluster properties that are relevant for strong cluster lensing. For example, for each halo, a triaxial NFW profile and a random orientation are assigned. The axial ratios are generated from the prescriptions of Jing & Suto (2002). The halo concentration, , and its dependence on cluster mass, , and redshift are modeled based on the relation of Bhattacharya et al. (2013) The joint weak lensing + strong lensing analysis by Merten et al. (2015); Umetsu et al. (2014) indicates that the observed relation derived from the 20 X-ray selected CLASH clusters agrees with the relation presented in Bhattacharya et al. (2013). The scatter in the concentration value at a fixed mass is well-described by a Gaussian distribution instead of a log-normal distribution, with rms 0.33. We adopt this scatter in our MOKA simulations. The dark matter substructures, the central brightest cluster galaxy (BCG) and adiabatic contraction are also incorporated into the MOKA generated models. MOKA is computationally efficient and is able to create a single simulated cluster lens model in a few CPU seconds on a personal computer by using a fast semi-analytic approach. The details of the code and its implementation can be found in Giocoli et al. (2012).
For our study, we create 640 mock clusters with the same mass and redshift range as the 20 X-ray selected CLASH clusters (32 different realizations for each corresponding mass and redshift). In particular, the density profile of the main halo follows a NFW profile while the density profile of the subhalos is chosen to be truncated Singular Isothermal Sphere (SIS) profile; the spatial density distribution of the subhalos follows the measurement from numerical simulations by Gao et al. (2004); the mass resolution of the subhalos is . We calculate the deflection angle, convergence and shear fields for each projected mass distribution. The angular resolution of the simulated cluster images is , which matches the pixel scale in the CLASH images.
5.2 Background Source Images and Ray-Tracing Method
To create the sky scene from the MOKA mass models, we follow a methodology similar to that in Horesh et al. (2011): we choose galaxies from the F775W UDF image as the sample of sources to be lensed by our simulated cluster mass models. This ensures we have a realistic background field that incorporates the observed distributions of galaxy morphologies, redshifts, luminosities, angular sizes, and ellipticities directly into our simulation. We then simulate the lensed UDF images via ray-tracing, as briefly described in Section 3.1. Adopting the thin lens approximation, the lensing can be described by the lens equation,
| (2) |
where is the image position, is the source position in the source plane, and is the deflection angle which has a weak dependence of source redshift. Coe et al. (2006) have produced a UDF photometric redshift catalogue and a corresponding segmentation map containing 9821 objects detected above a level. Based on the redshift catalog, we assign all the UDF sources among 20 redshift bins with bin widths of . In each redshift bin ( is then fixed) we perform the ray-tracing to generate the simulated lensed image and combine each of the simulated lensed objects from all bins into a final image. Finally, we match the noise levels in the simulations to that in the CLASH images.
6 Comparison Between Simulated Images and Real Observations
We run the arcfinder on all 640 simulated images. A raw total of 3304 arcs with and are detected in 640 simulated realizations. We correct this total number of arcs for elongation bias and incompleteness and obtain arcs, giving a mean of arcs per cluster after applying the false positive correction. This value matches the observed lensing efficiency of precisely. There is no significant difference between the arc abundance detected in the observations with that detected in the MOKA simulations. Examining the observed and simulated distribution of number of arcs per cluster (Figure 14), a Kolmogorov-Smirnov test222The K-S test performed here use the ks2samp routine from the SciPy package. yields a p-value = 0.92, indicating that the null hypothesis that both distributions are drawn from the same parent distribution cannot be strongly rejected. We further test the lensing efficiency as a function of cluster redshift by assigning the observed and simulated samples into two sub-samples by their redshift: and , where . For each sub-sample, we compare the observed and simulated number distribution (see Figure 15) of the lensing efficiency. On average, the higher redshift clusters are slightly more efficient lenses than the lower redshift clusters but the differences are all at marginal statistical significance. The K-S tests indicates that, in both redshift bins, the observed and simulated distributions of the lensing efficiency are consistent with being drawn from a common population (p-values are 0.99 and 0.65 for the lower and higher redshift bins, respectively). We summarize our arc statistics results for the observations and simulations in Table 3. The second and third columns in Table 3 denote the lensing efficiency of the observed and simulated samples, respectively; the fourth column is the p-value of the K-S test on the observed and simulated distributions.
We now explore the relationships between the lensing efficiency and the cluster’s redshift, mass, concentration and effective Einstein radius for CLASH and MOKA samples, where is the area enclosed by the tangential critical curve. Figure 16 shows the lensing efficiencies as functions of cluster redshift, mass, central concentration and . Since the CLASH sample does not span very wide range in the cluster redshift, mass and concentration, it is perhaps not surprising that there are no clear correlations between the lensing efficiency and the redshift, the mass or the concentration for both the CLASH and MOKA samples. However, there is a very significant correlation between the MOKA lensing efficiency and , and the correlation can be described by the following formula:
| (3) |
as the dashed line in Figure 16 shows. The non-zero value of the y-intercept reflects a contribution from false positive detections (consistent with our estimation from simulations) and intrinsic scatter.
| Redshift | CLASH | MOKA | p-value of | |
|---|---|---|---|---|
| Range | Observations | Simulations | K-S test | |
| All Clusters | 0.92 | |||
| 0.99 | ||||
| 0.65 |


7 What is the Dominant Determinant of Cluster Lensing Efficiency?
We now assess the relative importance of the redshift distribution of the lensed sources and the relation of the clusters on the resulting giant arc abundance. We accomplish this by conducting a series of simulations where we alter either the redshift distribution of the background galaxies or the assumed relation. While other effects such as DM substructure, halo triaxiality, and the mass profile of the BCG, may also play a role in determining the distribution of arc number counts, we focus here on studying impact of the redshift distribution and relation as these are potentially the most important effects. As shown below, however, we find that the lensing efficiency of CLASH-like clusters is not very sensitive to the redshift distribution of the background galaxy population so long as there is a significant fraction of the source galaxy population that lies at . We also find that the lensing efficiency is quite sensitive to the DM concentration distribution.
7.1 Simulated Lenses, Background Sources all at or
We start by testing how the source redshift distribution affects the arc abundance. We use the same 160 simulated MOKA clusters but first set all the UDF source redshifts to and, in a separate realization, then set all source redshifts to to see the impact of a delta function redshift distribution (which is obviously an extreme assumption). We then perform the ray-tracing to create 640 new simulated images for each case. We run arcfinder on these images and detect 1748 and 3764 arcs in total, respectively, when and . After applying statistical corrections, we find lensing efficiencies of () and (). The lensing efficiency decreases by a factor about 2 when the background redshift distribution is a delta function with all sources at . However, when putting all sources at one obtains a similar lensing efficiency as that obtained when using realistic UDF redshift distribution. The distributions of arc number per cluster for these 3 cases are shown in Figure 17. K-S tests indicate that the arc number distributions when using the UDF redshift distribution and using a delta function at are consistent (p-value = 0.45). The arc number distribution when assuming a delta function differs significantly from that with UDF redshift distribution or delta function redshift distribution (K-S test p-value = ).
7.2 CLASH Mass Models, UDF Redshift Distribution for the Background Galaxies
Given the CLASH mass models (CLMM), we would like to check if the UDF field is representative as a background source for the simulations. We use the publicly available mass models of 19 CLASH X-ray selected clusters (Zitrin et al., 2014) to lens the UDF source galaxies, and to create 152 simulated images. We detect 656 arcs from these images, corresponding to a lensing efficiency of . This efficiency differs from that found for the actual CLASH images () by . The distributions of arc number per cluster are consistent with one another (see Figure 17). A K-S test gives the p-value = 0.42.
7.3 CLASH Mass Models, Background Sources all at or
We now assess whether the lensing efficiency is altered significantly when using the CLASH mass models along with delta function redshift distributions. Again, we arbitrarily place all the UDF sources redshift to and , and perform ray tracing through 19 CLASH mass model to create 152 new simulated images for each case. We detect a total of 414 and 670 arcs for the and source distributions, respectively. These correspond to lensing efficiencies of and . Similar to that in the MOKA simulations, the lensing efficiency and distribution of arc numbers are similar for simulations with UDF redshift distribution and (p-value = 0.5). Whereas the lensing efficiency for is again about 2 times lower than that with UDF redshift distribution and , and the arc number distribution for is also significantly different (K-S p-value = ). Figure 17 shows the distributions of arc number per cluster of the three samples.
7.4 Different Relations, UDF Redshift Distribution for the Background Galaxies
Here we show how the arc abundance depends on the cluster relation. Using the UDF redshift distribution, we re-simulate 160 new clusters and simulated images with MOKA by adopting the relation in Neto et al. (2007), instead of Bhattacharya et al. (2013). We detect 230 arcs from 160 realizations using the Neto et al. (2007) relation, which, after corrections, yields a lensing efficiency of . The lensing efficiency is a factor of 4 lower using the Neto et al. (2007) relation than when we adopt the Bhattacharya et al. (2013) relation. This arc abundance is seen to be quite sensitive to the parameters of the relation. As above, Figure 17 shows the arc number distributions of three samples.


8 MUSIC Lensing Simulations
Although the lensing efficiency in semi-analytic MOKA simulations is in excellent agreement with that found in the CLASH observations, it is important to make sure this is a robust result. Thus, we study a different suite of simulations to determine the arc abundance using simulated clusters drawn directly from high resolution, hydrodynamical simulations. For this, we use a set of mock clusters taken from the MUSIC-2 N-body/hydrodynamical simulations (Meneghetti et al., 2014). The MUSIC-2 sample (Sembolini et al., 2013; Biffi et al., 2014) consists of a mass limited sample of re-simulated halos selected from the MultiDark cosmological simulation. This simulation is dark-matter only and contains particles in a cube, which was performed in 2010 using ART (Kravtsov et al., 1997) at the NASA Ames Research center. All these simulations are accessible from the online MultiDark Database2 . The run was using the best-fitting cosmological parameters to WMPA7+BAO+SNI ( = 0.27, = 0.0469, = 0.73, = 0.82, = 0.95, = 0.7). There were 282 cluster-scale halos in the simulation box which are more massive than at redshift and are selected to construct our sample. All these massive clusters were re-simulated both with and without radiative physics. The initial conditions for the re-simulations were generated in a finer mesh of size , by following the zooming technique described in Klypin et al. (2001). By doing so, the mass resolution of the re-simulated objects corresponds to and to , which was improved by a factor of 8 with respect to the original simulations. The parallel TREEPM+SPH GADGET code (Springel, 2005) was used to run all the re-simulations. Snapshots for 15 different redshifts in the range are stored for each re-simulated object. The snapshots which overlap with the redshifts of the CLASH clusters are at and .
These re-simulated cluster halos were originally used to estimate the expected concentration-mass () relation for the CLASH cluster sample (Merten et al., 2015; Meneghetti et al., 2014). As in these works, we use the X-ray image simulator X-MAS (Gardini et al., 2004) to produce simulated Chandra observations of the halos, and use them to further identify objects that match the X-ray morphologies and masses of the X-ray selected CLASH clusters. The relation from our X-ray selected set of simulated clusters agrees with that directly derived from the CLASH data at the 90% confidence level (Merten et al., 2015) and is fully consistent with the stacked weak-lensing signal derived from the ground-based wide-field observations (Umetsu et al., 2014). We perform ray-tracing through these X-ray selected simulated clusters (BCG and radiative physics are not included) to lens the UDF sources and create 100 simulated CLASH images.
8.1 Lensing Statistics of MUSIC Simulated Samples and Comparison with Real Observations
We run the arcfinder on the 100 MUSIC simulated images and detect a total of 343 arcs with and . We correct the total number of arcs for the elongation bias and incompleteness, yielding a final number of arcs, which corresponds to a mean value of arcs per cluster after application of the false positive correction. The MUSIC lensing efficiency is fully consistent with the lensing efficiency of the observed CLASH X-ray selected sample (). Figure 18 shows the observed and simulated distributions of arc number per cluster. A K-S test between these two distributions has a p-value = 0.95. We also explored the dependence of the lensing efficiency on the and in the MUSIC simulations (Figure 18, 18). The lensing efficiency decreases with increasing and values, which is consistent with the behavior seen in the CLASH observations. We summarize the main arc statistics results of this paper in Table 4: the second column in Table 4 is the rounded-off value of the mean lensing efficiency (number of arcs per cluster); the third column is the significance of difference in lensing efficiency between the specific simulation sample and that derived for the observed the CLASH X-ray selected sample. As with the MOKA simulations, the MUSIC simulated clusters yield cluster lensing efficiencies that match that seen in the observations when the simulations adopt a relationship and a source redshift distribution that matches the observations.


| Lensing efficiency | Difference relative to | |
| CLASH X-ray selected sample | ||
| Observation (X-ray selected sample) | ||
| Observation (high-magnification sample) | ||
| CLMM + UDF z-distn | ||
| CLMM + () | ||
| CLMM + () | ||
| MOKA + UDF z-distn | ||
| MOKA + () + (B13) | ||
| MOKA + () + (B13) | ||
| MOKA + UDF z-distn + (N07) | ||
| MUSIC + UDF z-distn |
9 Discussion
Since the arc statistics was originally proposed as a cosmological probe, many previous studies have investigated the sensitivity of the arc abundance on various cosmological effects. Cosmology enters the strong lensing properties of the galaxy clusters in two ways: first, the arc abundance depends on the angular-diameter distance and volumn which are determined by the cosmological expansion; second, the arc abundance depends on the cluster abundance and internal structure which are cosmological sensitive. N-body simulations and semi-analytic approaches have been utilized in earlier studies to explore the sensitivity of arc abundance on (Wambsganss et al., 2004; Li et al., 2006; Fedeli et al., 2008) and an increaseing function of arc abundance with has been observed, though whether the large increments in arc abundance when increasing the are quantitatively reliable is not clear; Boldrin et al. (2015) has studied the arc abundance dependence on and for a given survey area. They use MOKA to generate mock clusters with different mass and redshift and populate them into the light cones spanned by the survey region. They identify the increasing functions of arc abundance with both parameters. The arc abundance seems more sensitive to than , because has an effects on the cluster formation time, which in turn affects the cluster internal lensing properties such as triaxiality and concentration. However, the degeneracy between two parameters for the arc abundance limit its ability to distinguish different cosmologies. The arc abundance sensitivity on various dark energy models has also been studied, which includes a constant equation-of-state parameter (Bartelmann et al., 2003) and time varying parameter (Meneghetti et al., 2005), the arc abundance could change by at most a factor of a even with substantial change in . Jullo et al. (2010) and D’Aloisio & Natarajan (2011b) studied how cosmology affects the arc statistics through geometry effects. They found the expansion function thus the cosmological models can be constrained from the ratio of the lensing efficiencies at different redshift. To achieve competitive results, however, the mass distribution of the clusters must be determined with very high precision, and a sample of about ten clusters contaning about 20 arc families each are needed. Moreover, the arc statistics could even change by with different non-Gaussianity parameters based on theoretical framework D’Aloisio & Natarajan (2011a). Therefore, these studies may indicate that, amongest all the cosmological parameters, the arc abundance seems to be most sensitive to . Interestingly, most of the simulations in early arc statistics works have adoped a typically higher value ( was adopted in B98) than the current concensus from WMAP7 and PLANCK, which could have made the discrepancy between the simulations and the observations even larger. It implies that at least the deficit of cluster abundance under different cosmologies might not be the main solution to “arc statistics problem” in the first place. Since the dependence of the cluster internal lensing properties on is still not well known, we simply adopt the value of along with other cosmological parameters from the Planck results (Planck Collaboration et al., 2014). We believe that our conclusion would not change significantly unless there is large revision in the the Planck value for .
As one of the promising candidate solutions to the arc statistics problem, the impact of source redshift distribution on the arc abundance has been emphasized by many previous studies. Wambsganss et al. (2004) studied the magnification probability for light rays propagating cross a cosmological scale and found that the probability of high magnification events highly depends on the source redshift. They concluded that the arc abundance should have a steep increase with source redshift because the number of halos suitable for strong lensing increases exponentially with redshift, and they suggest this as the solution for the arc statistics problem. Bayliss et al. (2011); Bayliss (2012) has established a large sample of arcs (105) from the Sloan Giant Arcs Survey (SGAS) and from the Second Red Sequence Cluster Survey (RCS2) and study the redshift distribution of the arcs. They find that arcs with have a median redshift of . Bayliss (2012) claim the arc statistics problem can be solved by adopting their measured redshift distribution and using the scaling of the optical depth given in Wambsganss et al. (2004). However, Li et al. (2005) and Fedeli et al. (2006) show that the scaling of the optical depth is very different from what assumed by Wambsganss et al. (2004) and that the Wambsganss et al. (2004) assumption that the magnification is a good measure for the ratio of an arc is not justified in detail. Furthermore, it is unclear if the arc identification used by Bayliss (2012) (e.g. by curvature radius of arcs and by visual inspection) might bias the selection in favor of luminous and highly curved arcs. If so, the corresponding arc abundance and redshift distribution could also possibly be biased.
Our results show that the simulations performed either with a UDF redshift distribution or a delta function redshift distribution at give very similar arc abundances. When we change the redshift distribution of the background sources to a delta function at the arc abundance drops by a factor of 2 rather than the order of magnitude change in the arc abundance noted in some previous studies (e.g., Wambsganss et al. (2004)). The factor of 2 change is consistent with Horesh et al. (2005, 2011), who also used UDF images as background sources to perform the ray-tracing. Horesh et al. (2005) used the same simulated clusters at as used in B98 to lens the UDF sources and found an arc abundance that was 3 times higher than that in B98. They attributed this over-abundance to the use of a source number density that was 3.2 times higher than that in B98. They found that changing the source redshift distribution from a delta function at to a realistic UDF distribution results in only a small change in the final arc abundance. These results suggest that the redshift distribution does not have a major impact on the final arc abundance unless one selects a distribution that significantly underpopulates galaxies in the range.
The MUSIC simulated halos do not have BCGs at the center and do not implement complex gaseous physics. However, Killedar et al. (2012) has compared the arc production efficiency of the adiabatic simulations with some more sophisticated simulations which include the effects such as gas cooling, star formation, feedback from AGNs and SN+galactic winds, etc. The comparable results indicates that the implementation of baryonic physics will probably not lead to a significant change in the arc abundance derived from simulations without such processes.
Previous studies have already revealed the correlation between the lensing cross section and the Einstein radius, , from N-body simulation (Meneghetti et al., 2011) and the semi-analytic calculations (Redlich et al., 2012). Our study confirms this correlation as reflected by the dependence of the number of arcs per cluster on , as shown in Figure 16 shows. The relation between the MOKA cluster lensing efficiency and in our study is well fit by a linear relation in log-log plane with a slope of , which is flatter than the slope in Meneghetti et al. (2011) and in Redlich et al. (2012). The detection of this correlation in our MOKA simulations is due to the relatively large size of the MOKA cluster sample (640 simulated clusters), whereas the CLASH sample is too small to robustly unveil this correlation. For the arc abundance per cluster, the fractional error for an ensemble of 32 realizations is . Therefore, to measure the correlation observationally to 10% and to detect a deviation from such correlation, we need clusters in each mass bin, and we probably need a cluster sample with size 200 if 10 different mass bins are expected.
We are able to identify the relative significance of several key physical effects which contribute to the arc abundance enhancement. As Table 4 shows, varying the source redshift distribution leads to, at most, a factor of 2 variation in the arc abundance. Variation of the relations will affect the matter distribution of the inner cluster core and, hence, lead to variations in the arc abundance. Using several recent estimates of the relation (Neto et al., 2007; Bhattacharya et al., 2013) results in variations of the arc abundance by up to a factor of . Using the most recent estimates of the relation in simulations appears to produce excellent agreement with the observed arc abundance. However, quantities such as mass and concentration alone are not sufficient to reflect the likely complex dependencies of the arc abundance on various effects. As shown in Figure 16 and 16, the arc abundance fails to exhibit a strong dependence on either the concentration or the cluster mass alone, for both the CLASH and MOKA samples. By contrast, the effective Einstein radius, , is a good indicator of the lensing efficiency.
Given our results, even without fully understanding the cosmological dependence of the arc abundance, we could still conclude that the initial “arc statistics problem” appears to have been largely due to inadequate modeling of the mass distributions of the clusters and, secondarily, due to inadequate modeling of the background source number density and redshift distribution. In addition, the previous use of mostly visual identification of arcs may have resulted in an inadequate modeling of the false positive contamination rate and completeness corrections. We can divide the contributions from different physical effects on cluster lensing efficiency into three general categories: the cluster abundance, the background source redshift distribution, and the individual cluster lensing cross section. Our study would suggest that the lensing efficiency is more strongly dependent on the individual cluster lensing cross sections than on the source redshift distribution. However, different cosmology could alter both the cluster abundance and the individual cluster lensing cross sections and the relative significance of such factors has not been explored in this study given the small cluster sample size. Future large cluster surveys (e.g., DES, LSST, Euclid, WFIRST) will definitely help to answer this question. We suspect that two other related problems in lensing, the over-concentration problem and Einstein radii problem, where it has been found that some real clusters at intermediate redshift have denser cores than clusters of similar mass produced in simulations (Broadhurst & Barkana, 2008; Oguri & Blandford, 2009; Richard et al., 2010; Sereno et al., 2010; Merten et al., 2015) and where some real clusters have larger Einstein radii than expected in standard cosmology, may well be due to a combination of insufficiently accurate cluster simulations and observational sample selection effects.
10 Summary
We have carried out an observational and theoretical study of the arc statistics problem in clusters of galaxies. We have devised an automated arcfinder to efficiently and objectively detect arcs. We test our arcfinder using a large number of simulated cluster images and have quantified the incompleteness and false positive rate in arc detection. We also investigate how image noise affects the shape determination of the arcs and statistically correct for the observed elongation bias. We run our arcfinding algorithm on 20 X-ray selected CLASH clusters and 5 high-magnification CLASH clusters. After correcting for arc shape elongation bias, incompleteness and false positive rate we find a large arc ( and ) lensing efficiency of arcs per cluster and arcs per cluster, respectively, for the X-ray selected and high-magnification selected CLASH samples.
We simulate mock clusters using both the MOKA semi-analytic cluster generator and the MUSIC-2 N-body results. In both cases, we focus on simulated clusters that have the same mass and redshift range as the CLASH clusters. For the MOKA simulations, we use ray-tracing to create 640 simulated cluster realizations with the F775W UDF image as the background source. For the simulations extracted from the high resolution, hydrodynamical simulations (MUSIC), we identify halos that, in addition to having similar redshifts and Virial masses as the CLASH clusters, are also selected to have similar X-ray morphologies as the CLASH clusters. We find a lensing efficiency of arcs per cluster in the MOKA sims and arcs per cluster in the MUSIC sims. These lensing efficiencies both match the observed lensing efficiency of arcs per cluster. We also study the arc abundance dependence on the cluster redshift by splitting the sample into two bins divided at the median sample redshift of and find no significant differences in either the overall lensing efficiency and arc redshift distributions. The dependence of the MOKA and MUSIC lensing efficiencies on and also match that seen in the observed CLASH ones.
For the future, the relative short running time (less than 5 minutes for images with pixels) of our arcfinder allows us to perform large-scale “blind” searches for giant arcs in various other surveys, especially those with moderately high-angular resolution such as WFIRST and Euclid. Moreover, continued study of the correlation between the arc abundance and the should be conducted to assess just the reliability of using arc abundance (which is an observable) as a predictor of .
Appendix A Integrated Quantized Intensity-Difference Criterion
The following appendices provide further details about the arcfinder algorithm. Specifically, we provide short summaries of the key steps performed to go from the initial science image to the final arc catalog. We begin by convolving our HST images with a square Top-hat kernel with an edge dimension of to modestly enhance the contrast of the faint and thin arcs. Most source detection algorithms work in intensity space, which means the performance of these algorithms largely depends on how the detection threshold is chosen. A higher threshold will yield a catalog with lower completeness for faint objects while a lower threshold will lead to less precise segmentation and a higher false positive rate. To avoid the non-trivial determination of an optimal detection threshold, we focus on three very general properties of giant arcs:
-
1.
Giant arcs, like all real astronomical sources, have a net positive amount of flux on average after subtracting off a suitable background level.
-
2.
Giant arcs have substantial angular lengths.
-
3.
Giant arcs are highly elongated objects.
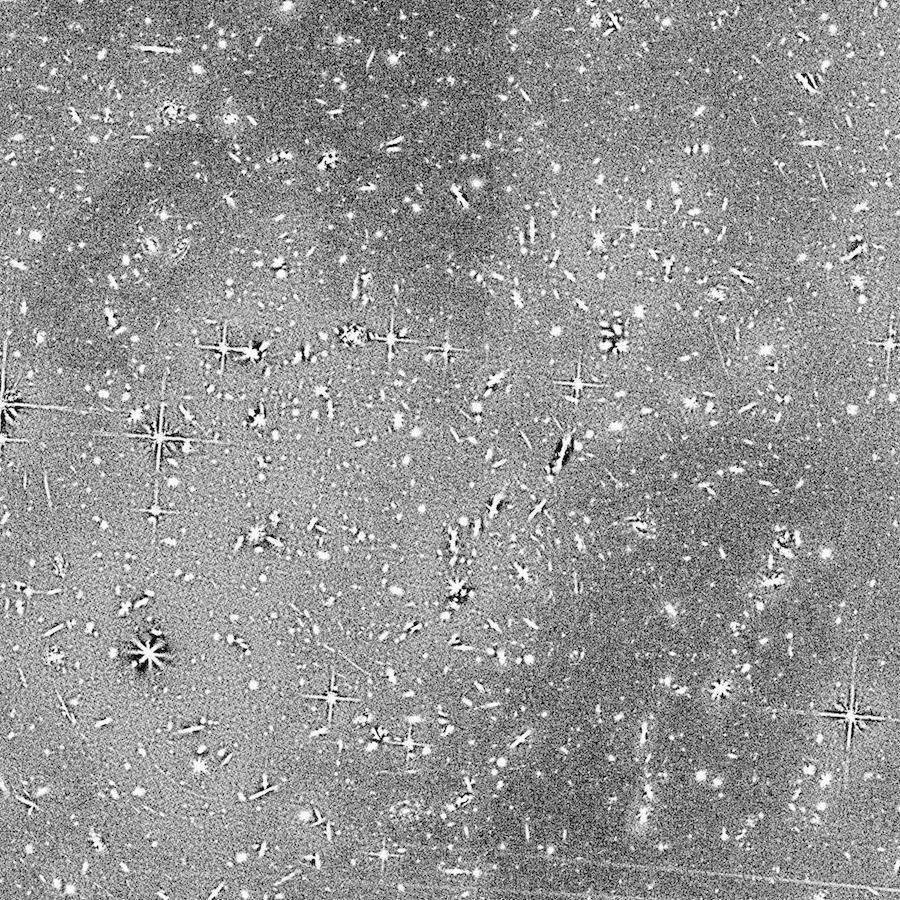
The above general properties imply that, on average, the intensity difference between the pixels belonging to the arc should be positive and the elongated and distorted morphologies of arcs should also be reflected in the angular distribution of these intensity differences. Use of the non-parametric intensity differences has a genuine advantage in the arc detection game: we can, in principle, detect faint structures almost as easily as bright structures. For this key reason, we perform the primary arc detection process in intensity-difference space. To do this, we first lay down a grid of points on the smoothed image, at spatial scale , that is somewhat larger than the arc widths we wish to find. At each grid point we then determine whether each of its 8 adjacent grid points (up, down, left, right, upper-left, upper-right, lower-left, lower-right) is brighter or fainter than this pixel. We quantify this local set of flux differences by assigning a value of for positive difference (the central pixel at grid position is brighter than a given surrounding pixel) and a value of for a negative difference (the central pixel at grid position is fainter than a given surrounding pixel). We sum up these values for all 8 directions. A grid point that was brighter than all of its surrounding grid points would thus have a final value of . A grid point that was brighter than 6 of its surrounding grid points would have a final value of . And so on. As arcs are highly elongated, pixels lying along the ridge line of an elongated arc will tend to have at least 4 or 5 adjacent pixels that are fainter than those at a given grid position. The value assigned to these pixels will thus be at least 2 or higher (). In general, the brighter pixels in an arc will tend to have higher integrated quantized intensity-difference values than the fainter pixels. Given that some giant arcs may have complex intensity profiles we set the threshold for the integrated quantized intensity difference to be the lowest positive value, which is . If we adopt a higher positive threshold, we find that some complex arcs are segmented into several smaller arc detections. The threshold of is the most conservative in maintaining the overall structural shape of the arc candidates. We note that the exact choice of threshold value, however, does not significantly impact the contents of the final sample of large () and highly elongated () arc candidates. The effect of the quantized intensity difference threshold is primarily on the number of small and less elongated sources in the initial detection process.
Choosing a proper grid spacing scale, , is important. Generally, the spacing scale should be larger than the typical arc’s width, and it should neither be too large nor too small, to avoid extending the grid points to nearby bright structures or limiting the grid points around the arc rigid lines. To determine the scale, we visually select 58 giant arcs from our CLASH F814W images, and manually measure the arcs’ full width at half maximum (FWHM) in the direction perpendicular to their ridge lines 333To measure the FWHM, we first draw a line crossing the intensity maxima which is perpendicular to the arc’s ridge line, then use Gaussian profile to fit the intensity of pixels that fall on the line. We approximate the Gaussian FWHM as the FWHM of the arc. . Figure 19 shows the distribution of the pre-selected arc’s FWHM. Note that the median value of these 58 arcs is and most of the arcs widths are less than . In principle we should traverse as many grid scales as possible to optimize the detection of the arcs, which is computationally expensive. We adopt two different scales: and , to make sure that both narrow and wider arcs can be effectively detected in a relatively short computational time. The results based on each scale are combined as the input to the next step.
As noise pixels may have regions with zero-valued or negative integrated quantized intensity-difference 444For noise pixels, if their distributions are independent, the integrated quantized intensity-difference should be equal to 0., another obvious advantage is that we are able to effectively clip out noise pixels and make the arc detection task significantly easier, even in the presence of a bright diffuse background, as might be encountered in the halo of a bright foreground cluster galaxy.

Appendix B The Local Intensity Difference Criterion
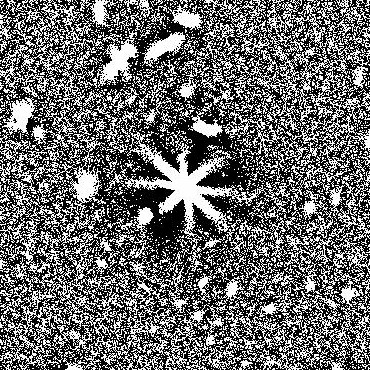
In certain regions (especially in the inner cores of bright galaxies), applying the integrated quantized intensity-difference criteria only will leave the segments with the diffraction pattern (see Figure 20(a)). To suppress these effects, we apply another criterion by comparing the intensity of the central pixel with the mean value of all 8 adjacent pixels over the image. The selected pixels should satisfy two criteria below:
| (B1) | |||
| (B2) |
Appendix C Initial Image Segmentation
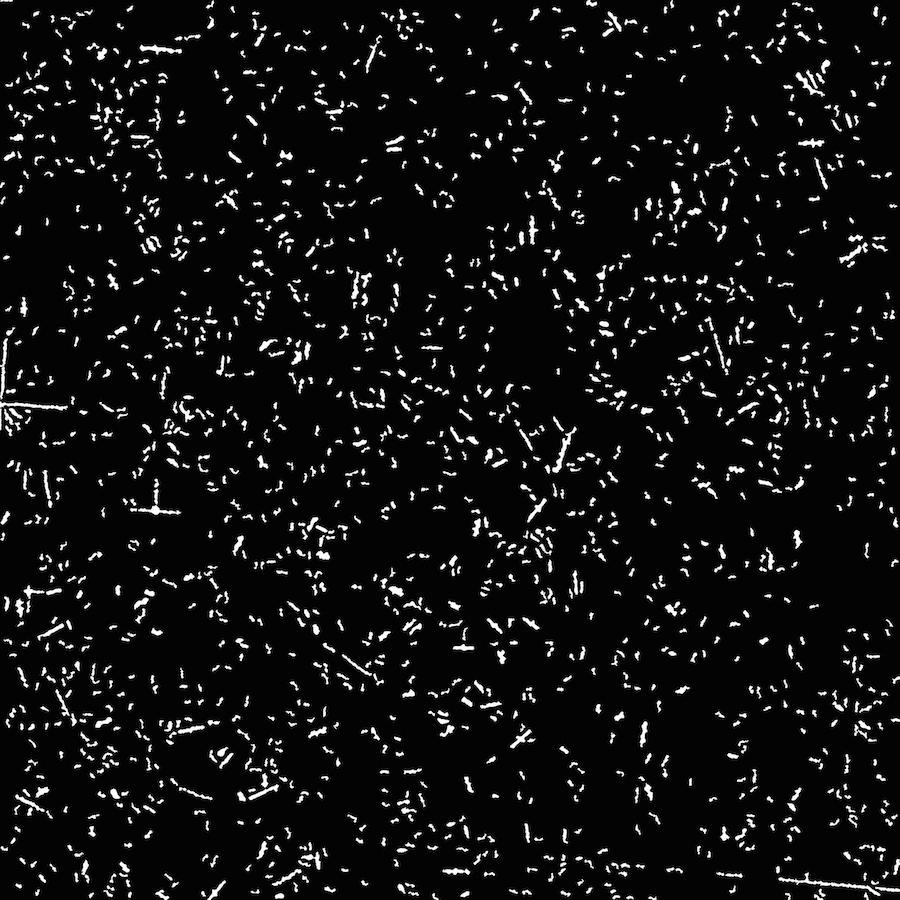
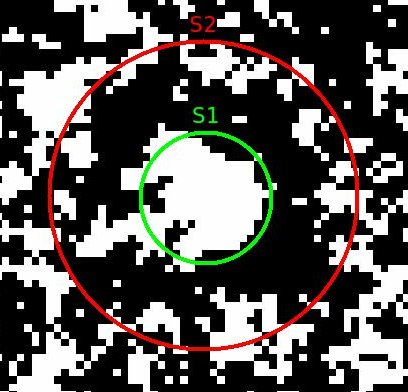
To identify specific arcs, we need to locate regions of contiguous grid points in the integrated quantized intensity-difference map with sums in excess of . We have now replaced the challenge of finding objects in intensity space with the task of finding contiguous regions in this quantized intensity-difference space. We avoid using any global selection criterion on number density since the number density varies largely across the whole image. So the contiguous regions are selected by their local number density of the grid points in the quantized intensity-difference space. Based on the simple fact as Figure 20(d) shows: if the contiguous region is enclosed by circle S1, the local averaged number density inside S1 must be larger than that inside circle S2 which has the same center with S1 but larger radius. The details of contiguous regions selection are as follows: (1) we make three convolved images using three spherical uniform kernels (k1, k2 and k3) with increasing size (, and ); (2) we subtract an image convolved with a broader kernel from one convolved with a narrower kernel, to obtain two residual images (k2 - k1, k3 - k2); (3) we then select all the pixels which have positive values in both residual images.
The selected contiguous regions include a few small and less elongated blobs that are not real sources. We set an area threshold 100 pixls and an eccentricity 555The eccentricity here is equal to the eccentricity of the ellipse that has the same second-moments as the measured object threshold to remove these artifacts. As shown in Figure 20(b). the noise has been suppressed and most giant arcs have been retained.
Appendix D Suppression of Diffraction Spikes
Diffraction spikes from bright stars are the features likely to account for most of the false positive detections. The normal way to remove the star spikes is to locate the position of bright stars and then manually mask out the diffraction pattern. Here we adopt a different approach which eliminates the need to know the position of the bright stars or the direction of the spikes in advance.
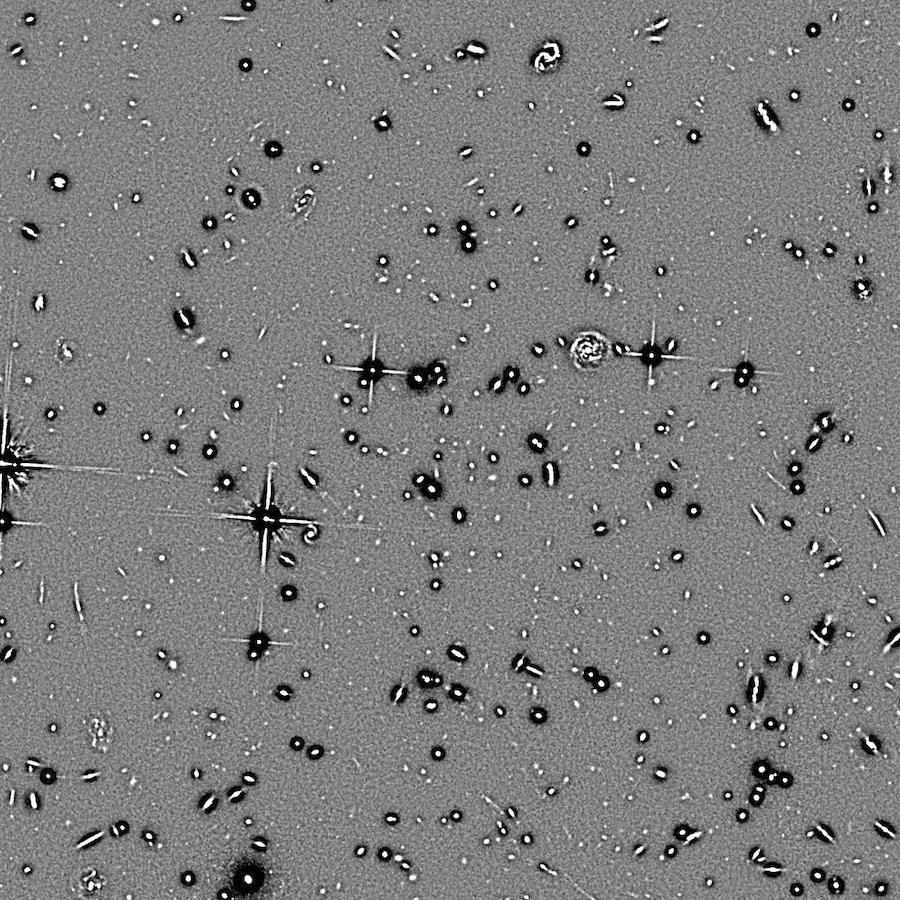
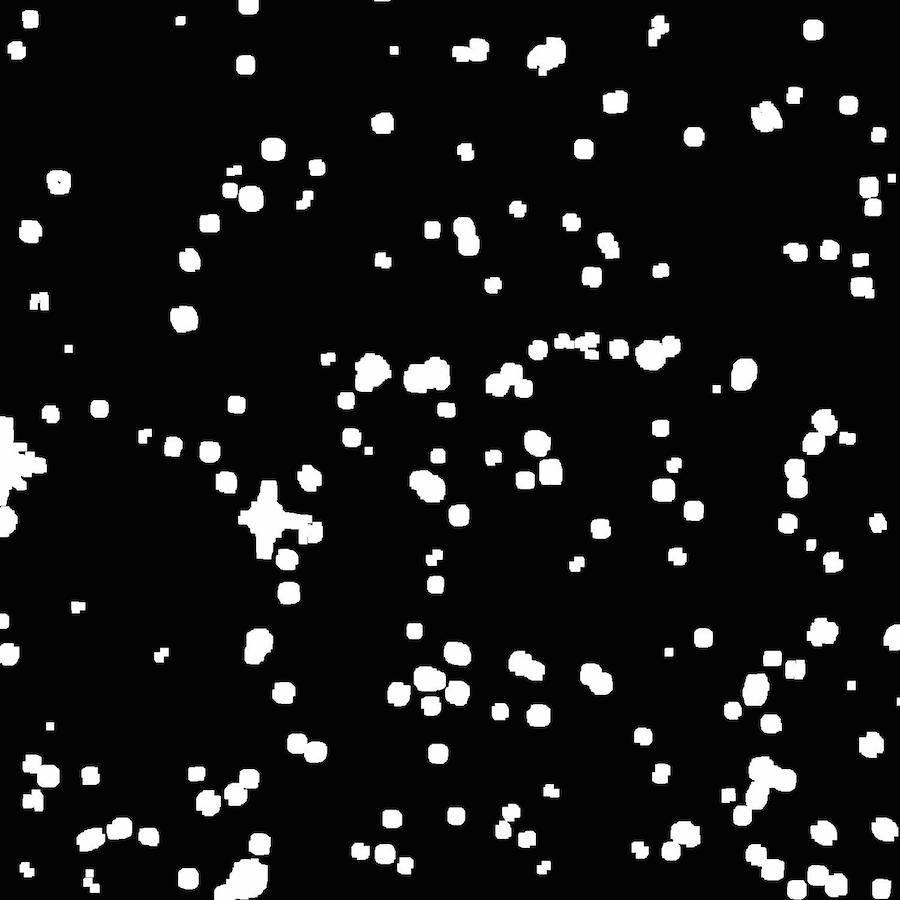
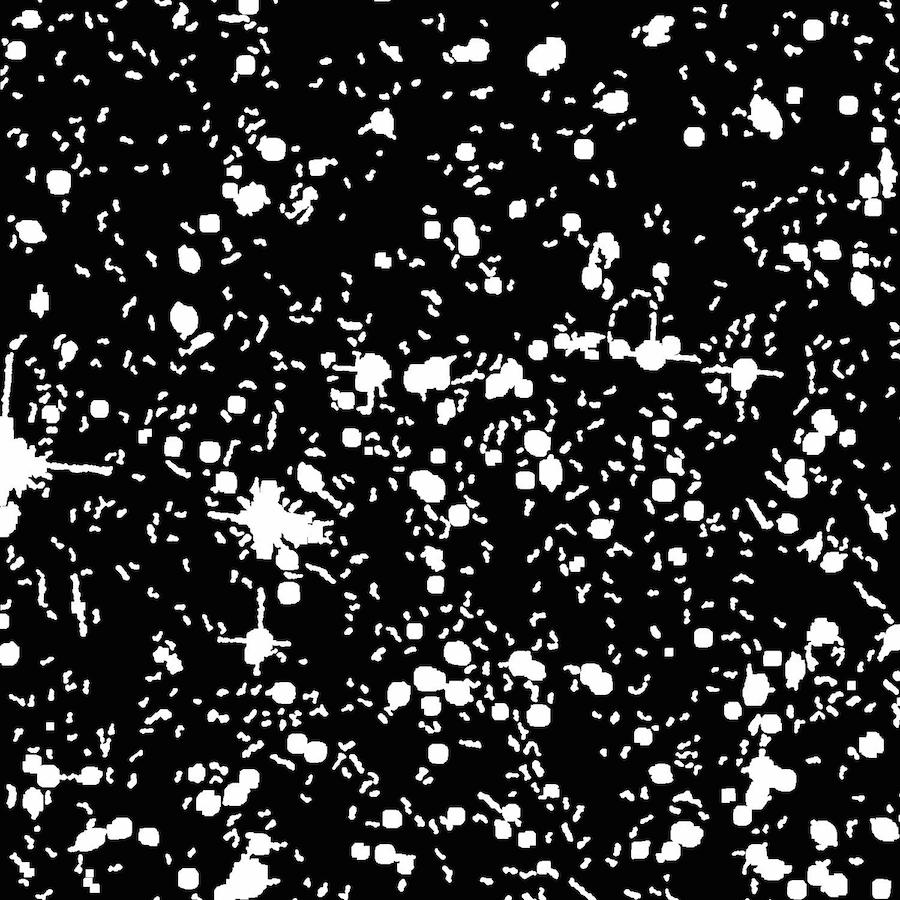
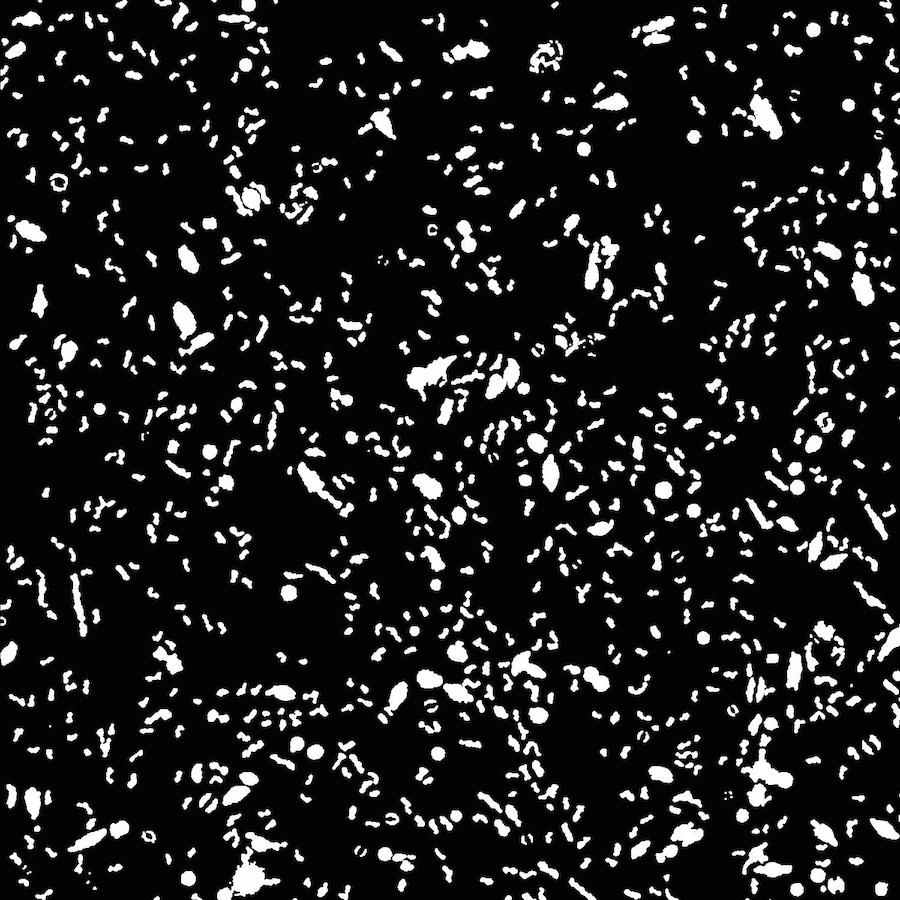
Our approach is to merge the diffraction spikes with each associated star and eliminate the combined source as a whole. To do this, we enhance the strong intensity gradients near bright stars and their diffraction spikes by applying unsharp masking. The unsharp masking enhances the peak and dampens the wings of the intensity distribution. As a result, some dark halos can be observed around the stars or bright elliptical galaxies, which are shown in Figure 21(a). Empirically, we note that most of the pixels belonging to the dark halo regions in CLASH data tend to have a intensity value lower than , and we use this intensity as a threshold to identify these halos. We then dilate the segmentation boundaries around a dark halo in all directions to fill the gaps between the segments ( Figure 21(b)), and combine the “dilated” images with the initial segmentation image obtained in Appendix C (Figure 21(c)). Most of the diffraction spikes merge with the segments of their mother stars as a result of performing this combination. We then label all the connected components 666Whether a pixel connects to its neighbors or not is characterized by the pixel connectivity. Usually there are two types of connectivity: 4-connected and 8-connected. 4-connected pixels are connected horizontally and vertically, or diagonally; 8-connected pixels are connected horizontally and vertically, AND diagonally. In terms of pixel coordinates, in 4-connected case, every pixel that has the coordinates () or () is connected to the pixel at (); in 8-connected case, in additional to 4-connected pixels, each pixel with coordinates () or () is connected to the pixel at (). In this paper, all the adjacent 8-connected pixels are considered to belong to the same connected component.
in the combined image and calculate the maximum pixel intensity of each labeled connected component. Stars typically have maximum intensity values greater than , while other objects barely have the maximum intensity value larger than , therefore we can conservatively set as threshold to remove those bright stars along with the diffraction spikes (Figure 21(d)).
Appendix E Final Image Segmentation
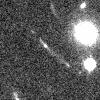
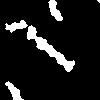
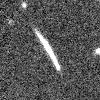
The initial segmentation boundaries for objects detected in intensity-difference space tend to have systematically larger surface area than the corresponding segmentation boundaries in pixel intensity space. So we refine the initial segmentation map to correct this small effect. We first define, for each detected segment, a “bounding box” that spans the region from the minimum coordinates to the maximum coordinates. We then iteratively clip out pixels with very high (low) intensity within this box until the pixel intensity reaches convergence at around its median value. We then estimate the local background and noise level within the box. Since faint arcs are most likely missed or broken into small arclets at a high detection threshold, we set the threshold for the re-segmentation to be proportional to the object’s estimated local signal-to-noise ratio. Hence, objects with low surface brightness will be remapped using a lower detection threshold than that used for brighter objects, allowing all sources to achieve their best segmentation (see Figure 22).



Appendix F Utilization of the Length, Length-to-Width Ratio and Perimeter-to-Length Ratio
Once all images are processed through the preceding steps, we can begin the arc identification process. We identify giant arcs from among all detected sources primarily by their large ellipticity. For each source, we calculate the total area, perimeter length, and position of the peak intensity from the distribution of all the connected pixels777We utilize ndimage (a Python image processing module) to quickly calculate the mentioned parameters of the detected objects. Using the coordinates of the pixel with the peak intensity value in a given source, we locate the furthest point away from that maximum that is still within the boundaries of the source. We also locate the furthest point away from that point, then calculate the sum of the distances from these two points to the peak pixel position, and take this distance as the length of the segment. There are many ways to define the width of the segment: the image segments can be fitted by simple geometrical figures such as ellipse, circles, rectangles and rings (Miralda-Escude, 1993; Bartelmann & Weiss, 1994); and therefore the width of the segment is approximated by the minor axis of the ellipse, the radius of the circle, the smaller side of the rectangle, or the width of the ring; Dalal et al. (2004); Horesh et al. (2005); Hennawi et al. (2007) approximated the width by dividing the area by its length; Meneghetti et al. (2008) proposed a more robust way to measure the width, by traversing the width profile of the arc and approximating the arc width as the median value of the profile. In this study, considering the computational efficiency, we adopt the former method: i. e. all the giant arcs are treated as rectangles and width = area / length, to determine the width of the segment in this paper. To test whether this definition of width will introduces bias in the measurement of , we use the approach in Meneghetti et al. (2008) to re-calculate the width of all the detected arcs and compare with those in former definition. Figure 23 shows the comparison of the ratio of two widths with the newly defined width. The dashed line denotes the median value of the ratio which is about 10% higher than that in our definiton. Therefore, our (width) measure may be slightly biasing high (low).

The final step is to remove those detected segments that are not very likely to be large lensed galaxies by requiring objects to satisfy three additional criteria 888 In this study, we do not need to specify the orientation of the giant tangential arcs relative to the cluster center. This allows us to apply our algorithm to less relaxed clusters that may not have a well-defined center.: (1) their perimeter-to-length ratio must be ; (2) their minimal length must be greater than a fixed value which is discussed in Section 3.2; (3) their minimal length-to-width ratio must be greater than a fixed value which is determined in Section 3.2. The criterion (1) eliminates elongated objects with irregular morphology and criterion (2) both maintains the consistency with the concept of the “giant” arcs and prevents from the domination of the spurious detection as we will discuss later. We include all objects that satisfy these three constraints into our final arc candidate catalog.
References
- Alard (2006) Alard, C. Arxiv e-prints (2006)
- Bartelmann & Weiss (1994) Bartelmann, M., & Weiss, A. 1994, A&A, 287, 1
- Bartelmann et al. (1998) Bartelmann, M., Huss, A., Colberg, J. M., Jenkins, A., Pearce, F. R. 1998, A&A, 330, 1
- Bartelmann et al. (2003) Bartelmann, M., Meneghetti, M., Perrotta, F., et al. 2003, A&A, 409, 449
- Bayliss et al. (2011) Bayliss, M. B., Gladders, M. D., Oguri, M., et al. 2011, ApJ, 727, L26
- Bayliss (2012) Bayliss, M. B. 2012, ApJ, 744, 156
- Beckwith et al. (2006) Beckwith, S., Stiavelli, M., Koekemoer, A. et al. 2006, ApJ, 132, 1729
- Benítez (2000) Benítez, N. 2000, ApJ, 536, 571
- Benítez (2004) Benítez, N., Ford, H., Bouwens, R., et al. 2004, ApJS, 150, 1
- Bhattacharya et al. (2013) Bhattacharya, S., Habib, S., Heitmann, K., & Vikhlinin, A. 2013, ApJ, 766, 32
- Biffi et al. (2014) Biffi, V., Sembolini, F., De Petris, M., Valdarnini, R., et al. 2014, MNRAS, 439, 588
- Boldrin et al. (2015) Boldrin, M., Giocoli, C., Meneghetti, M., et al. 2015 (arXiv:1505.03515)
- Broadhurst & Barkana (2008) Broadhurst, T. J., & Barkana, R. 2008, MNRAS, 390, 1647
- Coe et al. (2006) Coe, D., Benítez, N., Sánchez, S. F., et al. 2006, AJ, 132, 926
- Dalal et al. (2004) Dalal, N., Holder, G., & Hennawi, J. F. 2004. ApJ, 609, 50
- D’Aloisio & Natarajan (2011a) D’Aloisio, A., Natarajan, P. 2011, MNRAS, 411, 1628
- D’Aloisio & Natarajan (2011b) D’Aloisio, A., Natarajan, P. 2011, MNRAS, 415, 1913
- Fedeli et al. (2006) Fedeli, C., Meneghetti, M., Bartelmann, M., Dolag, K., & Moscardini, L. 2006, A&A,447, 419
- Fioc & Rocca-Volmerange (1997) Fioc, M., & Rocca-Volmerange, B. 1997, A&A, 326, 950
- Fedeli et al. (2008) Fedeli, C., Bartelmann, M., Meneghetti, M., & Moscardini, L. 2008, A&A, 486, 35
- Flore et al. (2000) Flores, R. A., Maller, A. H., & Primack, J. R. 2000, ApJ, 535, 555
- Furlanetto et al. (2013) Furlanetto, C., Santiago, B. X., Makler, M., et al. 2013, A&A, 549, 80
- Gao et al. (2004) Gao, L., White, S. D. M., Jenkins, A., Stoehr, F., Springel, V. 2004, MNRAS, 355, 819
- Gardini et al. (2004) Gardini, A., Rasia, E., Mazzotta, P., Tormen, G., et al. 2004, MNRAS, 351, 505
- Giocoli et al. (2012) Giocoli, C., Meneghetti, M., Bartelmann, M., et al. 2012, MNRAS, 421, 3343
- Gottlöber & Yepes (2007) Gottlöber S., & Yepes G. 2007, ApJ, 664, 117
- Grogin et al. (2011) Grogin, N., Kocevski, D., Faber, S. M., Ferguson, H., et al. 2011, ApJS, 197, 35
- Hennawi et al. (2007) Hennawi, J. F., Dalal, N., Bode, P., & Ostriker, J. P. 2007, ApJ, 654, 714
- Hilbert et al. (2007) Hilbert, S., Metcalf, R. B., & White, S. D. M. 2007, MNRAS,382, 1494
- Hilbert et al. (2008) Hilbert S., White S. D. M., Hartlap J., & Schneider P. 2008, MNRAS, 386, 1845
- Horesh et al. (2005) Horesh, A., Ofek, E. O., Maoz, D., et al. 2005, ApJ, 633, 768
- Horesh et al. (2010) Horesh, A., Maoz, D., Ebeling, H., Seidel, G., & Bartelmann, M., 2010, MNRAS, 406, 1318
- Horesh et al. (2011) Horesh, A., Maoz, D., Hilbert, S., & Bartelmann, M., 2011, MNRAS, 418, 54
- Jing & Suto (2002) Jing, Y., & Suto, Y. 2002, ApJ, 574, 538
- Jullo et al. (2010) Jullo, E., Natarajan, P., Kneib, J.-P., D‘Aloisio, A., et al. Science, 329, 924
- Killedar et al. (2012) Killedar, M., Borgani, S., Meneghetti, M., et al. 2012, MNRAS, 427, 533
- Klypin et al. (2001) Klypin, A., Kravtsov, A. V., Bullock, J. S., & Primack, J. R. 2001, ApJ, 554, 903
- Kravtsov et al. (1997) Kravtsov, A. V., Klypin, A. A., & Khokhlov, A. M. 1997, ApJS, 111, 73
- Koekemoer et al. (2011) Koekemoer, A., Faber, S. M., Ferguson, H., Grogin, N., et al. 2011. ApJS, 197, 36
- Lenzen et al. (2004) Lenzen, F., Schindler, S., & Scherzer, O. 2004, A&A, 416, 391
- Li et al. (2005) Li, G.-L., Mao, S., Jing, Y. P., et al. 2005, ApJ, 635, 795
- Li et al. (2006) Li, G.-L., Mao, S., Jing, Y. P., et al. 2006, MNRAS372, 73
- Meneghetti et al. (2000) Meneghetti, M., Bolzonella, M., Bartelmann, M., Moscardini, L., & Tormen, G. 2000, MNRAS, 314, 338
- Meneghetti et al. (2003) Meneghetti, M., Bartelmann, M., & Moscardini, L. 2003, MNRAS, 346, 67
- Meneghetti et al. (2005) Meneghetti, M., Bartelmann, M., Dolag, K., Moscardini, L., et al. 2005, A&A, 442, 413
- Meneghetti et al. (2007) Meneghetti, M., Argazzi, R., Pace, F., Moscardini, L., et al. 2007, A&A, 461, 25
- Meneghetti et al. (2008) Meneghetti, M., Melchior, P., Grazian, A., De Lucia, G., et al. 2008, A&A, 482, 403
- Meneghetti et al. (2010) Meneghetti, M., Fedeli, C., Pace, F., Gottlóber, S., & Yepes, G. 2010, A&A, 519, 90
- Meneghetti et al. (2011) Meneghetti, M., Fedeli, C., Zitrin, A., Bartelmann, M., Broadhurst, T., Gottl ¿ber, S., Moscar-dini, L., Yepes, G. 2011, A&A530, 17
- Meneghetti et al. (2014) Meneghetti, M., Rasia, E., Vega, J., Merten, J., Postman, M., et al. 2014, ApJ, 797, 34
- Merten et al. (2015) Merten, J., Meneghetti, M., Postman, M. et al. 2015, ApJ, 806, 4
- Miralda-Escude (1993) Miralda-Escude, J. 1993, ApJ, 403, 497
- Neto et al. (2007) Neto, A. F., Gao, L., Bett, P., et al. 2007, MNRAS, 381, 1450
- Oguri et al. (2003) Oguri, M., Lee, J., & Suto, Y. 2003,ApJ, 559, 572
- Oguri & Blandford (2009) Oguri, M., & Blandford, R. 2009, MNRAS, 392, 930
- Planck Collaboration et al. (2014) Planck Collaboration, Ade, P. A, Aghanim, N., Armitage-Caplan, C., et al. 2014, A&A, 571, A16
- Postman et al. (2012) Postman, M., Coe, D., Benitez, N., et al. 2012, ApJS, 199, 25
- Puchwein et al. (2005) Puchwein, E., Bartelmann, M., Dolag, K., & Meneghetti, M. 2005, A&A, 442, 405
- Puchwein & Hilbert (2009) Puchwein, E., & Hilbert, S. 2009, MNRAS,398, 1298
- Redlich et al. (2012) Redlich, M., Bartelmann, M., Waizmann, J.-C., Fedeli, C. 2012, A&A547, 66
- Richard et al. (2010) Richard, J., Smith, G. P., Kneib, J. et al. 2010, MNRAS, 404, 325
- Rozo et al. (2008) Rozo, E., Nagai, D., Keeton, C., & Kravtsov, A. 2008, ApJ, 687, 22
- Seidel & Bartelmann (2007) Seidel, G., & Bartelmann, M. 2007, A&A, 472, 341
- Sembolini et al. (2013) Sembolini, F., Yepes, G., De Petris, M., Gottlober, S., et al. 2013 MNRAS, 429, 323
- Sereno et al. (2010) Sereno, M., Jetzer, P., & Lubini, M. 2010, MNRAS, 403, 2077
- Somerville et al. (2004) Somerville, S., Lee, K., Ferguson, H. et al. 2004, ApJ, 600, L171
- Springel (2005) Springel, V. 2005, MNRAS, 364, 1105
- Torri et al. (2004) Torri, E., Meneghetti, M., Bartelmann, M., et al. 2004, MNRAS, 349, 476
- Umetsu et al. (2014) Umetsu, K., Medezinski, E., Nonino, M., Mertem, J., Postman, M., et al. 2014,ApJ, 795, 163
- Wambsganss et al. (2004) Wambsganss, J., Bode, P., & Ostriker, J. P. 2004, ApJ, 606, L93
- Wambsganss et al. (2005) Wambsganss, J., Bode, P., & Ostriker, J. P. 2005, ApJ, 635, L1
- Wuyts et al. (2008) Wuyts, S., Labbé , I., Schreiber, N. M. F., et al. 2008, ApJ, 682, 985
- Zitrin et al. (2013) Zitrin, A., Meneghetti, M., Umetsu, K., Broadhurst, T., et al. 2013, ApJ, 762, 30
- Zitrin et al. (2014) Zitrin, A., Fabris, A., Merten, J., et al. 2014, in press (arXiv:1411.1414)