Diffusion-like recommendation with enhanced similarity of objects
Abstract
In the last decade, diversity and accuracy have been regarded as two important measures in evaluating a recommendation model. However, a clear concern is that a model focusing excessively on one measure will put the other one at risk, thus it is not easy to greatly improve diversity and accuracy simultaneously. In this paper, we propose to enhance the Resource-Allocation (RA) similarity in resource transfer equations of diffusion-like models, by giving a tunable exponent to the RA similarity, and traversing the value of this exponent to achieve the optimal recommendation results. In this way, we can increase the recommendation scores (allocated resource) of many unpopular objects. Experiments on three benchmark data sets, MovieLens, Netflix and RateYourMusic show that the modified models can yield remarkable performance improvement compared with the original ones.
keywords:
Recommender systems , Bipartite networks , Resource-Allocation similarity, Diffusion-like algorithms1 Introduction
Nowadays, the explosive growth of storage capability has allowed people to collect and store almost all the information generated every day. This so-called ”big data” provides great benefit to our life, e.g., we can easily get the cast list of a niche film via search engines. However, we find that it becomes very difficult to find the relevant movie of our interest from countless candidates, if we cannot describe it by appropriate keywords. On this information overload occasion, recommender systems arise to help us make the right decisions.
Different from search engines requiring keywords, recommender systems are designed to uncover users’ potential preferences and interests based on users’ past activities and profile descriptions, and accordingly deliver a personalized list of recommended objects to every user. In the last decade, recommender systems have become a significant issue in both academic and industrial communities. The early recommender models are based on a simple observation that similar users are likely to purchase the same items, or, the items collected by the same user are prone to be similar to each other, such as collaborate filtering [26] and content-based methods [27]. These methods are shown to give accurate recommendation results, but they confront a recommender system with the risk that more and more users will be exposed to a narrowing band of popular items, leading to poor diversity among users’ recommendation lists [9, 12].
Given this, many other recommendation models have been proposed in the literature, including dimensionality reduction techniques [1, 13, 14, 15], diffusion-like methods [2, 16, 19, 25], social filtering [17, 18, 23], and hybrid recommendation models [1, 11, 22, 24]. However, people found that accuracy and diversity seem to be two sides of the seesaw: when one side rises, the other side falls. Examples are two primary diffusion-like methods, ProbS [2] and HeatS [3], which mimic two basic physical processes on user-object bipartite networks. ProbS is demonstrated to give recommendation results with good accuracy but poor diversity, while HeatS is found to be effective in providing a diverse recommendation lists at the cost of accuracy.
This diversity-accuracy dilemma has received considerable research attentions in the field of recommender systems. Zhou et al. [1] designed delicately a nonlinear hybrid model of HeatS and ProbS, called HHP, which achieves significant improvements in both accuracy and diversity of recommendation results. Another two effective methods modified respectively from original ProbS and HeatS, named Preferential Diffusion (PD) [5] and Biased Heat Conduction (BHC) [4], also make a good trade off on accuracy and diversity. In addition, based on BHC and HHP, Qiu et al. [21] took the heterogeneity of the source objects into account, and proposed the Heterogeneous Heat Conduction(HHC) model and Nie et al. [19] investigated the optimal hybrid coefficients of HeatS and ProbS, and proposed accordingly the Balance Diffusion (BD) model, respectively.
In the first diffusion-like model ProbS, every user distributes the total resource he receives previously from objects, back averagely to his neighbor objects. The niche objects will receive lower final resources (recommendation scores) because they have fewer neighbor users (resource portals), thus rank in the bottom of the recommendation lists. That is why ProbS suffers from poor diversity. In view of this, the PD model proposed by Lv et al. [5] intentionally allocates more resource to small-degree objects, and less resource to large-degree objects. For the resource of a given user, every neighbor object receives the percentage approximately inversely proportional to its degree. Compared with ProbS, PD simultaneously improves the diversity and accuracy of recommendation results.
With the similar motivation, we proposed a method which can be used in many being diffusion-like algorithms, like ProbS, BHC and HHP, to get better recommendation results on user-object bipartite networks. we propose to enhance the RA similarity in the transfer equations of diffusion-like models, by giving a tunable exponent on the shoulder of RA similarity, and traverse this parameter to achieve the optimal recommendation results. Experiments on three benchmark data sets, MovieLens, Netflix, and RYM (Rate Your Music) show that our model can yield a great performance improvement compared with the original models.
2 Materials and Methods
In this paper, a recommender system is represented by a bipartite network , where , and correspond to users, objects and edges between users and objects, respectively. This bipartite network could be fully described by an adjacency matrix , where the element if there exists an edge between user and object (user collects object ), meaning that user declared explicitly his preference on object in the past, and otherwise. For every target user, the essential task of a recommender system becomes to recommend him a sublist of uncollected objects of his potential interest.
2.1 Dataset Description
Three real-world data sets are adopted to test the recommendation result, namely, MovieLens, Netflix and RYM (Rate Your Music). Here we will briefly describe these three data sets. MovieLens, a movie rating data set, was collected by the GroupLens Research Project at the University of Minnesota and can be found at the website www.grouplens.org. Netflix, a randomly sampled subset of the huge data set provided by the Netflix company for the Netflix Prize (www.netflixprize.com) [6]. RYM, a music rating data set, is obtained by downloading publicly available data from the music ratings website www.RateYourMusic.com [1]. In this paper, we make use of nothing but the binary information whether there exists an interaction between a user and an object in the past. The basic statistics of the three data sets are presented in Table.1.
| Data set | |||||
|---|---|---|---|---|---|
| MovieLens | 943 | 1,682 | 100,000 | 106 | 59.5 |
| Netflix | 10,000 | 5,640 | 701,947 | 70.2 | 124.5 |
| RYM | 33,762 | 5,267 | 675,817 | 20 | 128.3 |
To evaluate the performance of different models, each data set is randomly divided into two subsets: the training set containing of the links and the probe set with of the links. The training set is treated as known information to make recommendation and the probe set is only used to test the relevance of the recommendation results.
2.2 Evaluation Metrics
In order to evaluate the relevance of recommendation results, we adopt three typical metrics in this paper. In recommender systems, is the most important aspect in evaluating the recommendation performance. A good algorithm is expected to give accurate recommendations, namely stronger ability to find what the users like. We make use of ranking score [4] and precision enhancement [1] to measure the recommendation accuracy. For a target user, the recommender system will return a ranking list of all his uncollected objects to him. For a link between user and object in probe set, we compute the rank () of object in the recommendation list of user .
| (1) |
In the above definition, object is ranked in the -th position of the recommendation list of user , and is the number of objects in recommendation list of user , where is the degree of user in the training set . The ranking score of the whole system can be obtained by averaging the ranking score values over all user-object links in the probe set.
In practice, we will focus on the top-ranked objects rather than checking the whole recommendation list. Thus, a more practical approach is to check the top objects recommended to the target user to calculate how many objects are recommended correctly. is the mostly used metric defined in this way. However, for a sparse data sets the precision may be very low, while for a dense data set it may be high. Obviously, finding a better way to avoid some bad effects brought from data sets themselves is necessary. Zhou et al. [1] introduced enhanced precision which considers improvement compared with the precision of random recommendations. A random recommendation will randomly choose objects from the train set and recommend them to the target user, where is the length of the recommendation list.
| (2) |
where is the number of users in the probe set, is the length of recommendation list, is the number of relevant objects in the recommendation list of user , is the number of objects in the train set, is the number of uncollected objects of user in the train sets, and is the degree of user in probe set.
Besides accuracy, the personalized recommendation method should present different recommendations to different users according to their tastes and interests. The diversity can be quantified by the average Hamming Distance, which measures how different are the recommended lists of users from each other. Given two different users and , borrowing inspiration from the Hamming distance between two strings, the diversity is calculate in a similar way [20],
| (3) |
where is the number of common objects in the top positions of both lists of user and user . Clearly, if user and user receive the same recommendation list, , while if their lists are completely different, . Averaging over all pairs of active users in the probe set, we obtain the hamming distance of the whole system, where greater value means better personalization of users’ recommendation lists.
2.3 Diffusion-like recommendation models
Most diffusion-like recommendation models work by assigning every object an initial level of resource , where the resources on all the objects constitute a resource vector f; then the resources will be redistributed among objects according to the formula .
Analogous to mass diffuse process in user-object bipartite network, Zhou et al. proposed the Probabilistic Spreading (ProbS) model [2], also referred to as Network-Based Inference (NBI). For a target user , the initial resource vector f is defined as , where if user has collected object , otherwise . The transfer equation in matrix is written as
| (4) |
where and denote the degrees of object and user , respectively.
Another diffusion-like model mimicking the heat-spreading process is called HeatS [3]. The initial resource vector f of HeatS is the same as that of ProbS. The key difference between ProbS and HeatS is the resource redistribution strategy: ProbS works by equally distributing the resource of each node to all of its nearest neighbors, the overall resource remains unchanged; while in HeatS every node absorbs equal proportion of resource from every nearest neighbor, the overall resource increases in the process. Specifically, the difference of HeatS from ProbS lies in the transfer matrix , which is described as:
| (5) |
As we mentioned before, ProbS enjoys high recommendation accuracy yet low diversity, while HeatS designed specifically to address the challenge of diversity suffers from terrible accuracy. Many researchers attempted to solve this diversity-accuracy dilemma and have found out some effective ways. For example, a hybrid model of HeatS and ProbS, named HHP, was proposed, with a tunable parameter in the transfer equation :
| (6) |
It is easily observed that HHP reduces to ProbS when , and HeatS when .
3 Results
3.1 Empirical analysis
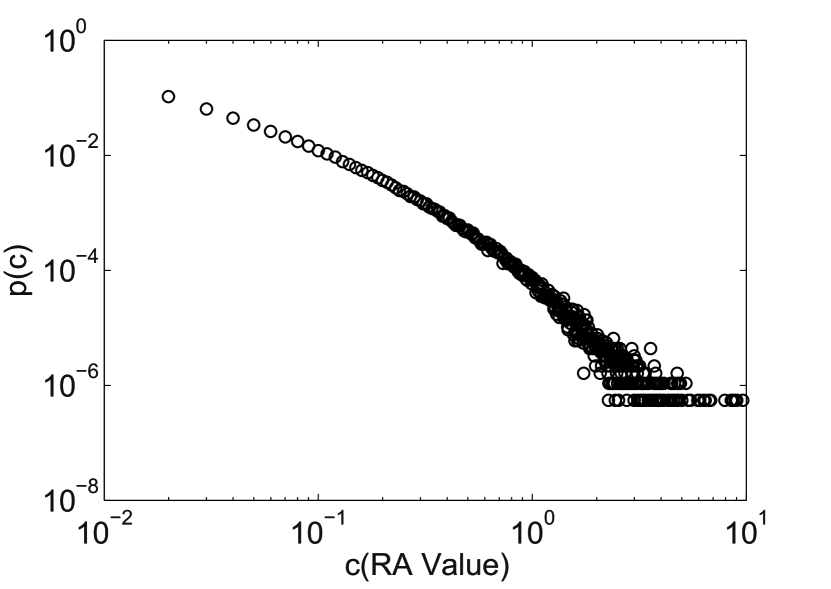
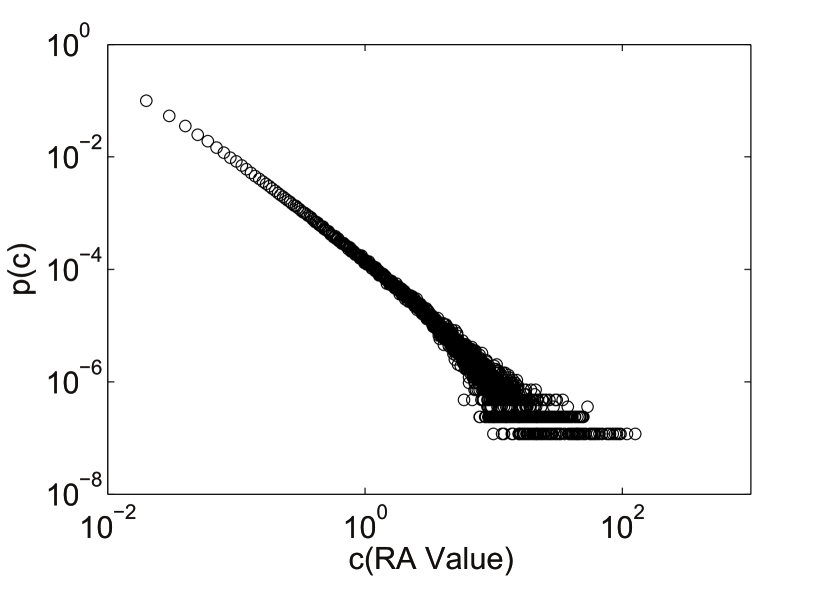
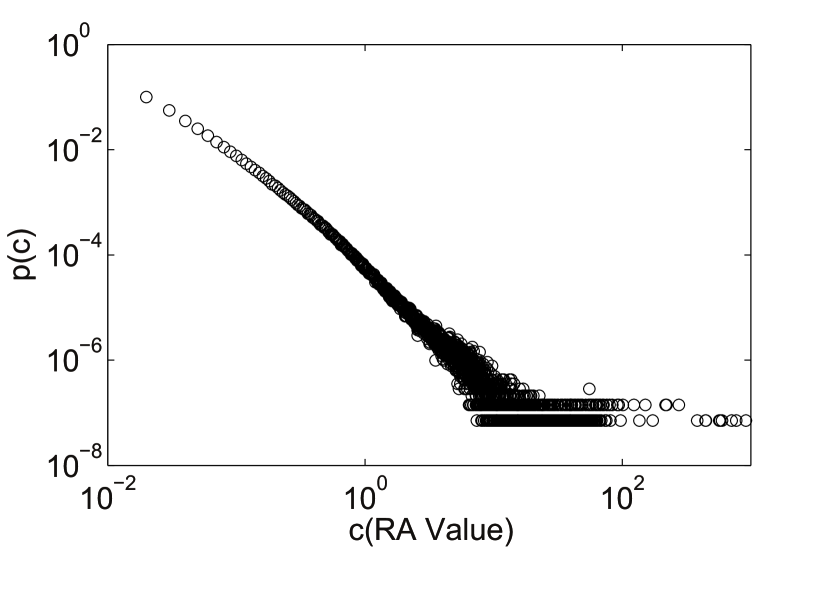
For most of aforementioned diffusion-like methods, the summation formula is a common component of the transfer equations. Zhou et al. [10] defined this summation formula as the Resource-allocation (RA) index, which is regarded as a significant similarity measure of two objects because it considers not only the number of common users but also the degrees of these common users. Fig.1 shows the distributions of RA index on three data sets. It is clear that the distributions follow almost power-law, which indicates that the RA similarities of most pairs of objects are weak and the RA value ranges a large scope (see Table.2).
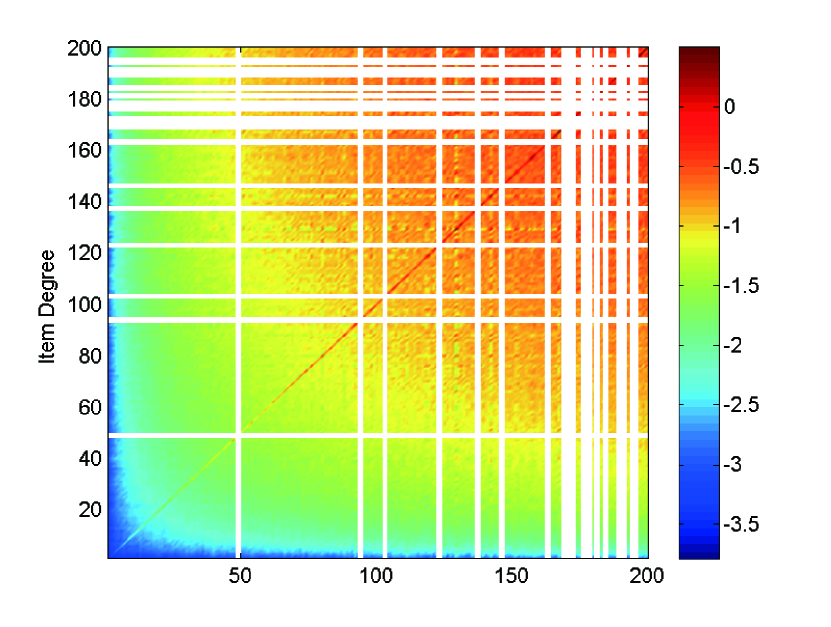
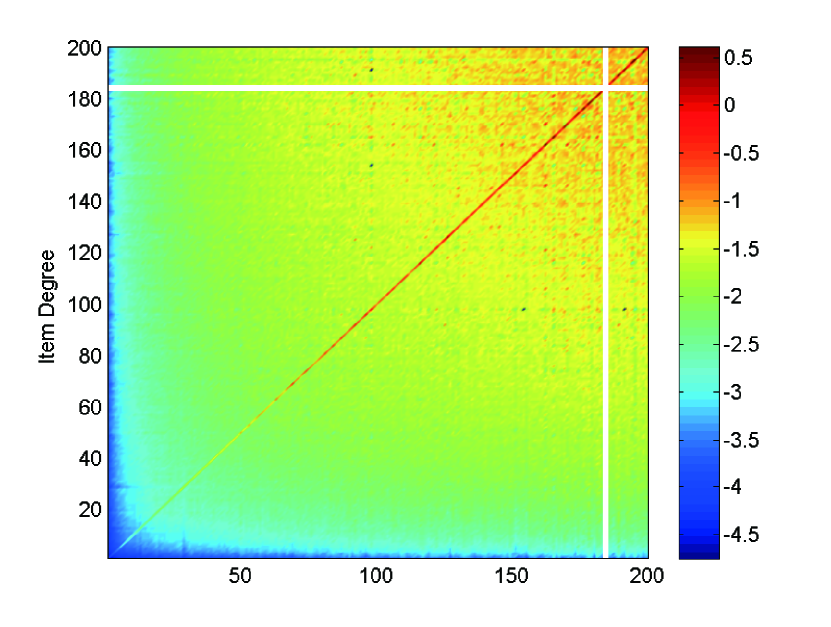
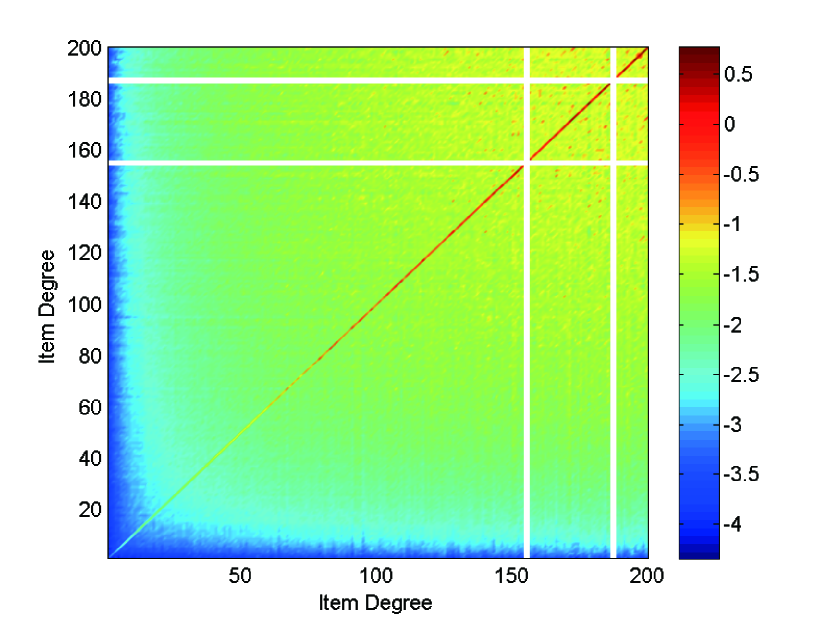
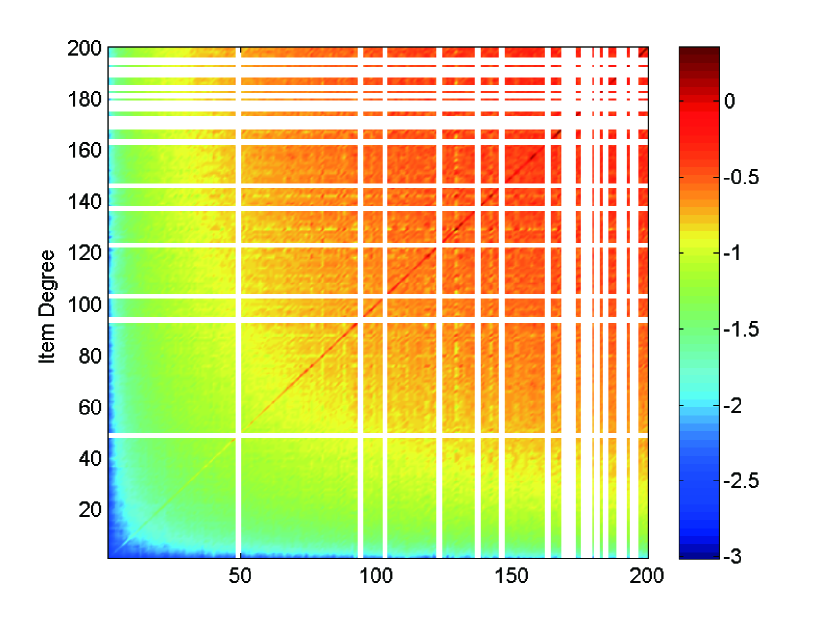
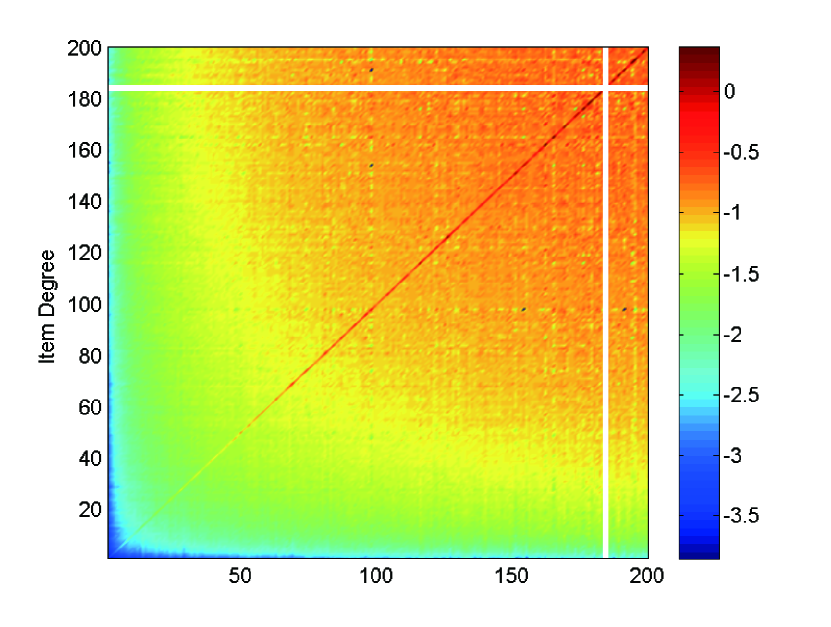
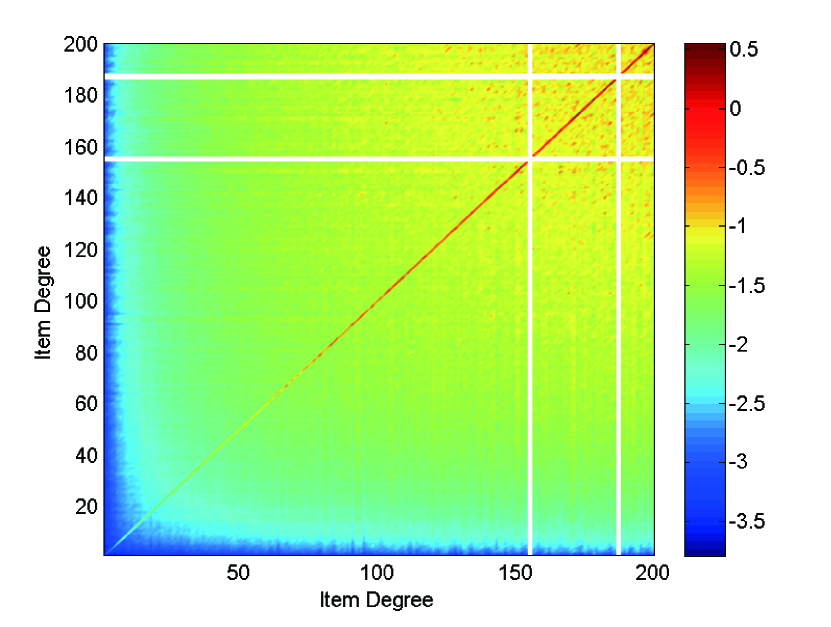
For the user-object bipartite network, the RA similarity can not effectively distinguishes the similarity of objects in an appropriate scale. Fig.2 plots the heat map of RA similarity against degrees of arbitrary pair of objects on three data sets (Fig.2(a), Fig.2(b), Fig.2(c)). the darker is the color, the bigger is the RA similarity of two objects. We find that a majority of RA values are very low, especially for the pairs of small-degree objects, which validates again the heavy-tailed distribution of RA values.
| Data set | minRA | maxRA | magnification |
|---|---|---|---|
| MovieLens | 0.0015 | 9.60 | |
| Netflix | 0.0010 | 126.5862 | |
| RYM | 0.00058 | 912.8531 |
Note that the RA index is a key factor in measuring the resource transfer between objects. Based on above empirical results, we infer that a few large-degree objects receive much resource (recommending opportunity), while a majority of small-degree objects get little resource, thus are seldom recommended. What is more, two popular objects are likely to be bought by the same users, which does not mean these two objects are similar to each other. On the contrary, two niche objects bought by the same users may have high similarity. Thus, the recommendation performance may be improved if we modify the RA index to intentionally decrease (increase) the similarities of large-degree (small-degree) objects. Specifically, the negative effect of power-law distribution of RA values will be weaken by giving an exponent on the shoulder of RA index, named Enhanced Resource Allocation (ERA) index:
| (7) |
By adjusting the parameter of ERA similarity to appropriate values, we get the heat map of ERA similarities against the degrees of objects on three datasets (Fig.2), where for MovieLens(Fig.2(d)), for Netflix(Fig.2(e)) and for RYM(Fig.2(f)). Compared with Fig.2(a), Fig.2(b) and Fig.2(c) respectively, we find that the similarities of many pairs of small degree objects are increased from RA index to ERA index, reflected by larger area of darker color in the figure.
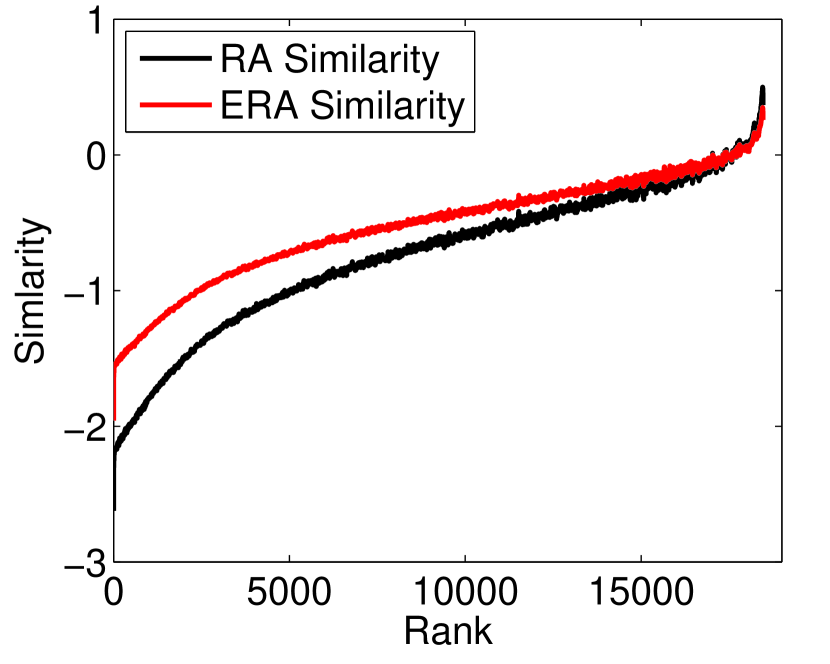
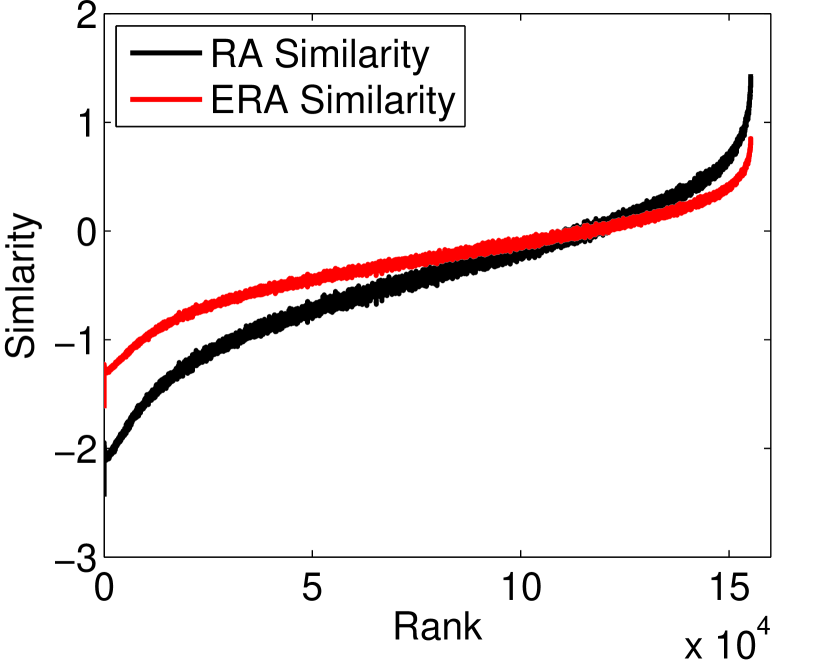
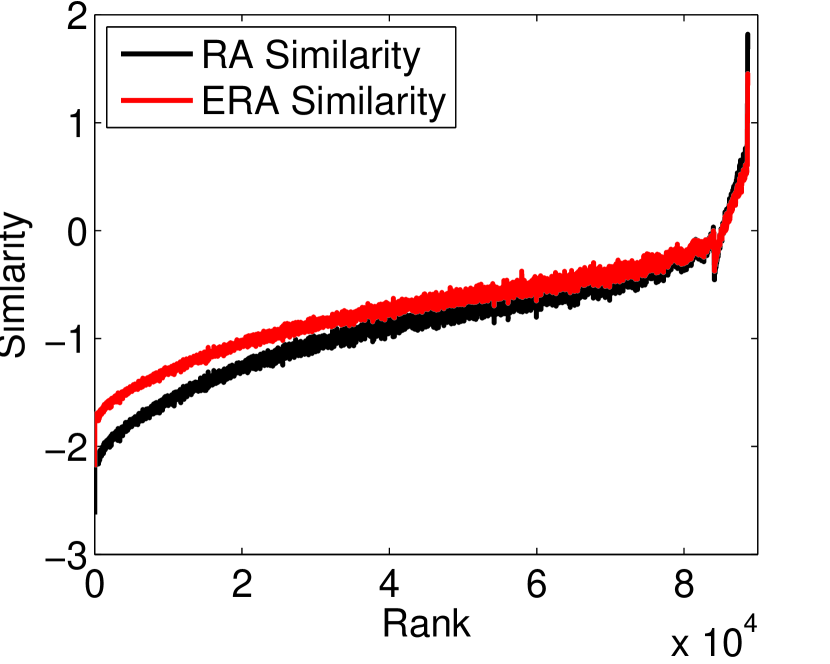
To quantitatively illustrate the difference of ERA index from RA index, Fig.3 plots the similarities against the ranks of degree product of object pairs.For a given x, its corresponding Similarity is the median of y-values of , where is chosen as 30 for a better illustration. We can see a noticeable gap between the similarities of ERA and RA for the same degree product. Specifically, there exists an intersection of the two curves for Netflix data set, which means that ERA similarity is higher (lower) than RA similarity for the object pairs of small degrees (large degrees). However for MovieLens and RYM, ERA similarity is higher than RA similarity for almost all the object pairs regardless of the degree products. Thus, we conjecture that by replacing RA with ERA similarity, the improvement of algorithmic performance will be more significant for Netflix than the other two data sets, which will be validated in following experiments.
3.2 Experiment results
By replacing RA with ERA index in the transfer equation of HHP model, we get the enhanced HHP (Eh-HHP for short) model. Fig.4 plots the values of two typical measures, ranking score and hamming distance, against parameter traversed from 0.1 to 1.2, where the other parameter is tuned to be the optimal value for the corresponding . We can see that in a large range of , the ranking score (hamming distance) is smaller (larger) than that of for three data sets, which means that the accuracy and diversity of Eh-HHP model will be greatly improved than original HHP if is tuned delicately.
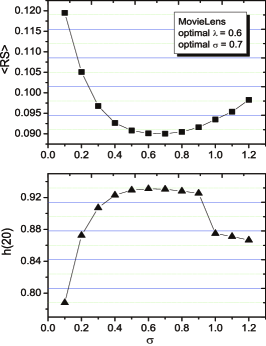
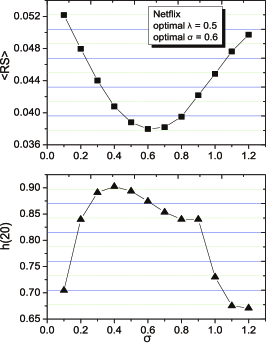
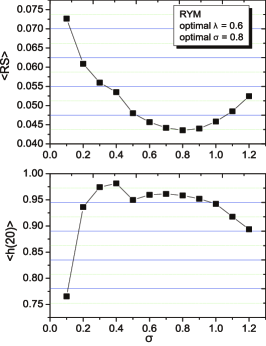
Specifically, the ranking score reaches its optimal value when , , and for MovieLens, Netflix and RYM, respectively. Table.3 summarizes the detailed statistics of recommending results for HHP and Eh-HHP models on three data sets. We can see all the three metrics of Eh-HHP are improved compared with HHP. Specially, the ranking score and hamming distance are increased by and on Netflix, while the performance improvements on MovieLens and RYM are not that remarkable, which is in line with our conjecture in the above subsection.
| Data | Methods | |||||
|---|---|---|---|---|---|---|
| MovieLens | HHP | 0.86 | 0.0923 | 26.33 | 0.9027 | |
| Eh-HHP | 0.7 | 0.58 | 0.0894 | 27.95 | 0.9187 | |
| Netflix | HHP | 0.83 | 0.04471 | 84.89 | 0.7559 | |
| Eh-HHP | 0.6 | 0.51 | 0.0379 | 90.09 | 0.8866 | |
| RYM | HHP | 0.76 | 0.04557 | 119.2 | 0.9369 | |
| Eh-HHP | 0.8 | 0.59 | 0.0435 | 123.70 | 0.9552 |
| Methods | DataSets | |||||
|---|---|---|---|---|---|---|
| Eh-ProbS | MovieLens | 0.4 | 3.24% | 3.3% | 4.9% | |
| Netflix | 0.5 | 3.32% | 0.7% | 12.45% | ||
| RYM | 0.8 | 0.61% | -1.6% | 0.61% | ||
| Eh-HeatS | MovieLens | 1.1 | 30.1% | 331.1% | 3.43% | |
| Netflix | 1.2 | 51.2% | 100% | -10.3% | ||
| RYM | 1.1 | 17.6% | 26.4% | 0% | ||
| Eh-HHP | MovieLens | 0.7 | 3.14% | 6.15% | 1.8% | |
| Netflix | 0.6 | 15.23% | 6.13% | 17.3% | ||
| RYM | 0.8 | 4.5% | 3.78% | 1.95% |
We further investigate the effect of ERA on ProbS and HeatS. Table.4 shows the percentage improvement of three metrics by enhancing the RA similarities in three diffusion-like models ProbS, HeatS, and HHP. It can be clearly observed that the enhancement of RA similarity performs different on three models. For ProbS, which is widely known as an accuracy-favored method, the enhanced similarity brings an improvement on all the metrics on and data sets, but has unnoticed effect on . For HeatS, which is famous for its extremely high diversity and terrible accuracy, the improvements of accuracy metrics on three data sets are remarkable. However, the diversity of Eh-HeatS is decreased compared with HeatS, but still better than Eh-ProbS. The optimal values of Eh-ProbS and Eh-HHP are all between 0 and 1, while for HeatS it lies on , which means that the optimal values depend not only on the data set but also on the original model.
| Methods | |||||
|---|---|---|---|---|---|
| ProbS | n/a | n/a | 0.050 | 74.524 | 0.5535 |
| Eh-ProbS | 0.5 | n/a | 0.048 | 74.017 | 0.6224 |
| HeatS | n/a | n/a | 0.106 | 0.098 | 0.8324 |
| Eh-HeatS | 1.2 | n/a | 0.052 | 75.975 | 0.7464 |
| HHP | n/a | 0.83 | 0.045 | 84.895 | 0.7559 |
| Eh-HHP | 0.6 | 0.51 | 0.0379 | 90.090 | 0.8866 |
| BHC | n/a | 0.85 | 0.048 | 81.029 | 0.7602 |
| Eh-BHC | 0.6 | 0.55 | 0.041 | 87.776 | 0.8469 |
| BD | n/a | 0.77 | 0.039 | 82.537 | 0.8502 |
| Eh-BD | 0.7 | 0.58 | 0.0378 | 88.344 | 0.8793 |
A summary of performance comparison of several diffusion-like models with the enhanced ones on Netflix data set are illustrated in Table.5. The optimal parameters and are subject to the lowest ranking score, and the other two metrics and are calculated accordingly. We can see that almost all the enhanced models perform better than the original ones on both accuracy and diversity except Eh-HeatS which we have explained above. Clearly, Eh-HHP outperforms other enhanced algorithms over all three metrics except the case of Eh-BD in where they are statistically comparable. We have known that without enhanced similarity, BD is the best among the five algorithms, while with ERA similarity, Eh-HHP is better than Eh-BD, i.e., the effect of ERA similarity on HHP is greater than that on BD incorporating with the effect of . We can further investigate that why the performance of Eh-BD is not remarkable on either accuracy or diversity compared with BD later on.
Most of the existing variants of ProbS and HeatS try to diffuse more resources to unpopular and niche objects to match the personalized interests of users, or to assign more resources to popular objects to satisfy the tastes of the majority of users. However, our idea changes essentially the distribution of the similarities of objects, which can be applied into most of the existing diffusion-like recommendation models without increasing the computation complexity.
4 Conclusions and Discussions
An important challenge of recommender systems is how to accurately recommend the unpopular objects in the absence of enough profile information, without degradation of recommendation accuracy of popular objects. In this paper, we proposed to enhance the RA similarity in diffusion-like recommendation models to improve simultaneously both of accuracy and diversity. Experimental results demonstrated the effectiveness of this modification on ProbS, HeatS and HHP on three typical data sets. Different from the power-law distribution of original RA similarity, the distribution of ERA similarity is more even, thus the similarity of a large proportion pairs of unpopular objects are increased, while the similarity of a few popular objects remains almost unchanged. That is why the proposed method greatly reinforces the existed diffusion-like models.
Although our method can improve the recommendation results, we still lack of a full understanding of the effect from the point of view of network topology, e.g., why the improvement of accuracy and diversity is more remarkable on Netflix than that on MovieLens, and why the optimal for Eh-HeatS is larger than 1. Since the transfer equation consists of other components besides RA (ERA) similarity, the influences of these factors should not be neglected. Generally speaking, our work can be analogously applied to any similarity-based recommendation models. We hope that this idea can shed a light on the exploration of relation between the characteristics of network topology and recommendation results.
5 Acknowledgments
The authors would like to express their gratitude to Tao Zhou, Yan-Li Li and Wen-Jun Li for helpful discussions and irradiative ideas. This work is supported by the Natural Science Foundation of China (#61300018), and Special Project of Sichuan Youth Science and Technology Innovation Research Team (#2013TD0006).
References
- [1] Zhou, T., Kuscsik, Z., Liu, J. G., Medo, M., Wakeling, J. R., & Zhang, Y. C. (2010). Solving the apparent diversity-accuracy dilemma of recommender systems. Proceedings of the National Academy of Sciences, 107(10), 4511-4515.
- [2] Zhou, T., Ren, J., Medo, M., & Zhang, Y. C. (2007). Bipartite network projection and personal recommendation. Physical Review E, 76(4), 046115.
- [3] Zhang, Y. C., Blattner, M., & Yu, Y. K. (2007). Heat conduction process on community networks as a recommendation model. Physical review letters, 99(15), 154301.
- [4] Liu, J. G., Zhou, T., & Guo, Q. (2011). Information filtering via biased heat conduction. Physical Review E, 84(3), 037101.
- [5] Lü, L., & Liu, W. (2011). Information filtering via preferential diffusion. Physical Review E, 83(6), 066119.
- [6] Bennett, J., & Lanning, S. (2007, August). The netflix prize. In Proceedings of KDD cup and workshop (Vol. 2007, p. 35).
- [7] Ou, Q., Jin, Y. D., Zhou, T., Wang, B. H., & Yin, B. Q. (2007). Power-law strength-degree correlation from resource-allocation dynamics on weighted networks. Physical Review E, 75(2), 021102.
- [8] Barrat, A., Barthelemy, M., Pastor-Satorras, R., & Vespignani, A. (2004). The architecture of complex weighted networks. Proceedings of the National Academy of Sciences of the United States of America, 101(11), 3747-3752.
- [9] Ren, X., Lü, L., Liu, R., & Zhang, J. (2014). Avoiding congestion in recommender systems. New Journal of Physics, 16(6), 063057.
- [10] Zhou, T., Lü, L., & Zhang, Y. C. (2009). Predicting missing links via local information. The European Physical Journal B, 71(4), 623-630.
- [11] Lü, L., Medo, M., Yeung, C. H., Zhang, Y. C., Zhang, Z. K., & Zhou, T. (2012). Recommender systems. Physics Reports, 519(1), 1-49.
- [12] McNee, S. M., Riedl, J., & Konstan, J. A. (2006, April). Being accurate is not enough: how accuracy metrics have hurt recommender systems. In CHI’06 extended abstracts on Human factors in computing systems (pp. 1097-1101). ACM.
- [13] Takacs, G., Pilaszy, I., Nemeth, B., & Tikk, D. (2007, August). On the gravity recommendation system. In Proceedings of KDD cup and workshop (Vol. 2007).
- [14] Hofmann, T. (2004). Latent semantic models for collaborative filtering. ACM Transactions on Information Systems (TOIS), 22(1), 89-115.
- [15] Blei, D. M., Ng, A. Y., & Jordan, M. I. (2003). Latent dirichlet allocation. the Journal of machine Learning research, 3, 993-1022.
- [16] Zhang, Z. K., Zhou, T., & Zhang, Y. C. (2011). Tag-aware recommender systems: a state-of-the-art survey. Journal of computer science and technology, 26(5), 767-777.
- [17] Massa, P., & Avesani, P. (2007, October). Trust-aware recommender systems. In Proceedings of the 2007 ACM conference on Recommender systems (pp. 17-24). ACM.
- [18] Medo, M., Zhang, Y. C., & Zhou, T. (2009). Adaptive model for recommendation of news. EPL (Europhysics Letters), 88(3), 38005.
- [19] Nie, D. C., An, Y. H., Dong, Q., Fu, Y., & Zhou, T. (2015). Information filtering via balanced diffusion on bipartite networks. Physica A: Statistical Mechanics and its Applications, 421, 44-53.
- [20] Zhou, T., Jiang, L. L., Su, R. Q., & Zhang, Y. C. (2008). Effect of initial configuration on network-based recommendation. EPL (Europhysics Letters), 81(5), 58004.
- [21] Qiu, T., Wang, T. T., Zhang, Z. K., Zhong, L. X., & Chen, G. (2013). Alleviating bias leads to accurate and personalized recommendation. EPL (Europhysics Letters), 104(4), 48007.
- [22] Liu, J. H., Zhou, T., Zhang, Z. K., Yang, Z., Liu, C., & Li, W. M. (2014). Promoting cold-start items in recommender systems. PloS one, 9(12), e113457.
- [23] Nie, D. C., Zhang, Z. K., Zhou, J. L., Fu, Y., & Zhang, K. (2014). Information filtering on coupled social networks. PloS one, 9(7), e101675.
- [24] Qiu, T., Han, T. Y., Zhong, L. X., Zhang, Z. K., & Chen, G. (2014). Redundant correlation effect on personalized recommendation. Computer Physics Communications, 185(2), 489-494.
- [25] Zhang, Z. K., Zhou, T., & Zhang, Y. C. (2010). Personalized recommendation via integrated diffusion on user–item–tag tripartite graphs. Physica A: Statistical Mechanics and its Applications, 389(1), 179-186.
- [26] Sarwar, B., Karypis, G., Konstan, J., & Riedl, J. (2001, April). Item-based collaborative filtering recommendation algorithms. In Proceedings of the 10th international conference on World Wide Web (pp. 285-295). ACM.
- [27] Lops, P., De Gemmis, M., & Semeraro, G. (2011). Content-based recommender systems: State of the art and trends. In Recommender systems handbook (pp. 73-105). Springer US.