NuSTAR catches the unveiling nucleus of NGC 1068
Abstract
We present a NuSTAR and XMM-Newton monitoring campaign in 2014/2015 of the Compton-thick Seyfert 2 galaxy, NGC 1068. During the August 2014 observation, we detect with NuSTAR a flux excess above 20 keV () with respect to the December 2012 observation and to a later observation performed in February 2015. We do not detect any spectral variation below 10 keV in the XMM-Newton data. The transient excess can be explained by a temporary decrease of the column density of the obscuring material along the line of sight (from N cm-2 to N cm-2), which allows us for the first time to unveil the direct nuclear radiation of the buried AGN in NGC 1068 and to infer an intrinsic 2–10 keV luminosity L erg s-1.
keywords:
Galaxies: active - Galaxies: Seyfert - Galaxies: accretion - Individual: NGC 10681 Introduction
Since Antonucci & Miller (1985) proposed the unification scheme for type-1 and type-2 AGN, it has been commonly thought that highly absorbed (i.e. Compton-thick, with N cm-2) Seyfert 2s are obscured by neutral gaseous matter embedded in a thick molecular torus located at parsec distances from the central X-ray source (see Netzer, 2015, for a recent review). Reflection from the torus reveals itself through a very intense neutral Iron K emission line at 6.4 keV, with equivalent widths of keV, and a prominent Compton hump peaking at keV (Ghisellini, Haardt & Matt, 1994).
Recently, both the size and the distance of this thick screen have been questioned by a number of observations that have measured significant column density variability of the innermost absorber over time-scales of days or even hours in nearby bright sources such as NGC 1365 (Risaliti et al., 2005; Rivers et al., 2015), NGC 4388 (Elvis et al., 2004), NGC 4151 (Puccetti et al., 2007) and NGC 7582 (Bianchi et al., 2009, Rivers et al., in prep.). On the other hand, spatially resolved Iron K line emission, extended on scales of hundreds of parsecs, has been detected in the brightest Compton-thick objects such as NGC 1068 (Young, Wilson & Shopbell, 2001; Brinkman et al., 2002), NGC 4945 (Marinucci et al., 2012b) and Mrk 3 (Guainazzi et al., 2012). These measurements suggest that different absorbers/reflectors, located on a variety of spatial scales, may contribute (see e.g. Bianchi, Maiolino & Risaliti, 2012) to the absorption and reprocessing.
NGC 1068 (=14.4 Mpc: Tully, 1988) is one of the best studied Seyfert 2 galaxies. Indeed, the unification model was first proposed to explain the presence of broad optical lines in its polarized light. In X-rays, it was first studied by Ginga, which detected a strong (EW1.3 keV) neutral Iron line (Koyama et al., 1989), an unambiguous sign that we are observing reflected, rather than direct, radiation (Matt, Brandt & Fabian, 1996). This result was later confirmed by ASCA (Ueno et al., 1994; Iwasawa, Fabian & Matt, 1997) which resolved the Iron line into neutral and ionized components. BeppoSAX (Matt et al., 1997) found no evidence for transmitted radiation up to 100 keV, implying a column density of the absorbing material in excess of 1025 cm-2. Matt et al. (2004) and Pounds & Vaughan (2006) studied the XMM-Newton/EPIC spectra, and found evidence for an iron overabundance with respect to the solar value.
Recently, Bauer et al. (2015) analysed the multi-epoch X-ray spectra of NGC 1068 using different observatories, including 3-79 keV data from NuSTAR. They interpreted the broadband cold reflected emission of NGC 1068 as originating from multiple reflectors with three distinct column densities. The highest NH component (N cm-2) is the dominant contribution to the Compton hump, while the lowest NH component (N cm-2) produces much of the line emission. The authors also confirm that almost 30% of the neutral Fe K line flux arises from regions outside the central pc.
Guainazzi et al. (2000) found evidence for variability, in the 3–10 keV band, comparing two BeppoSAX observations performed about one year apart. Later on, comparing ASCA, RossiXTE and BeppoSAX spectra taken at different epochs spanning a few months, Colbert et al. (2002) claimed variations in both the continuum and He-like iron line flux on time scales as short as four months, using the 2–10 keV energy band. Matt et al. (2004), comparing an XMM-Newton observation with BeppoSAX observations performed a few years earlier, found possible evidence for flux variability of both the cold and the ionized reflectors.
We present a joint XMM-Newton and NuSTAR monitoring campaign of NGC 1068, from July 2014 until February 2015, and report on the discovery of a transient excess above 20 keV.
We adopt the cosmological parameters km s-1 Mpc-1, and , i.e. the default ones in xspec 12.8.1 (Arnaud, 1996). Errors correspond to the 90% confidence level for one interesting parameter (), if not stated otherwise.
2 Observations and data reduction
NuSTAR. NGC 1068 was observed by NuSTAR with its two coaligned X-ray telescopes five times. The first three times were in December 2012: those data are discussed in Bauer et al. (2015). After that, NGC 1068 was the target of a monitoring campaign with XMM-Newton composed of four observations, from July 2014 until February 2015. NuSTAR observed the source simultaneously with the third and fourth XMM-Newton pointings. The Level 1 data products were processed with the NuSTAR Data Analysis Software (NuSTARDAS) package (v. 1.3.0). Cleaned event files (level 2 data products) were produced and calibrated using standard filtering criteria with the nupipeline task and the latest calibration files available in the NuSTAR calibration database (CALDB 20150316). Since no spectral variation is found within each observation, we decided to use time-averaged spectra for each epoch. Background light curves are constant within each observation and do not present any flares due to spurious emission. The background levels are perfectly consistent between the three epochs. We coadded data taken in December 2012, since no variation was found between those three pointings. The extraction radii for the source and background spectra were arcmin each. Net exposure times, after this process, can be found in Table 1, for both Focal Plane Modules A and B.
The two pairs of NuSTAR spectra were binned in order to over-sample the instrumental resolution by at least a factor of 2.5 and to have a Signal-to-Noise Ratio (SNR) greater than 5 in each spectral channel.
XMM-Newton. The monitoring campaign of NGC 1068 with XMM-Newton was composed of four ks observations, starting on 2014 July 10 with the EPIC CCD cameras, the pn (Strüder et al., 2001) and the two MOS (Turner et al., 2001), operated in small window and thin filter mode. Details of the XMM-Newton observations and analysis can be found in Bianchi et al. (in prep.).
The resulting net exposure times can be found in Table 1 for the EPIC-pn. Spectra were binned in order to over-sample the instrumental resolution by at least a factor of three and to have no less than 30 counts in each background-subtracted spectral channel. Cross-calibration constants between the NuSTAR-FPMA/B and EPIC-pn are within 10%, in agreement with values presented in Madsen et al. (2015).
NGC 1068 hosts a strong ULX near its nucleus already studied in Matt et al. (2004). The source (at a distance of from the AGN) is present in our 2014/2015 XMM data and we find no differences with respect to the properties discussed in Matt et al. (2004): its contribution to the 4-10 keV spectrum is constrained to be .
| Obs. ID | Date | Exp. Time (ks) | 4–20 keV Count rate (cts s-1) | 20–80 keV Count rate (cts s-1) | ||
|---|---|---|---|---|---|---|
| FPMA | FPMB | FPMA | FPMB | |||
| 60002030002 | 2012-12-18 | 57} | ||||
| 60002030004 | 2012-12-20 | 48 | ||||
| 60002030006 | 2012-12-21 | 19 | ||||
| 60002033002 | 2014-08-18 | 52 | ||||
| 60002033004 | 2015-02-05 | 53 | ||||
| 4–10 keV Count rate (cts s-1) | ||||||
| EPIC-pn | ||||||
| 0740060201 | 2014-07-10 | 44 | ||||
| 0740060301 | 2014-07-18 | 39 | ||||
| 0740060401 | 2014-08-19 | 37 | ||||
| 0740060501 | 2015-02-03 | 37 | ||||
3 Spectral analysis
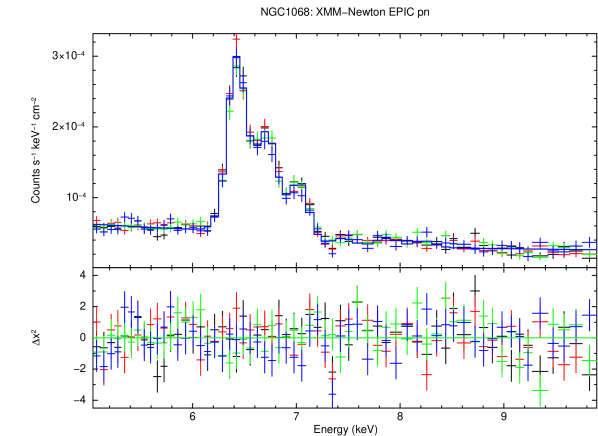
We start our analysis by checking for variability in the four XMM-Newton spectra obtained between July 2014 and February 2015. In our analysis, we only consider data above 4 keV due to the strong contribution at lower energies from distant photoionized, extra-nuclear emission, which will be discussed in Bianchi et al. (in prep.). No differences are found between the spectra, nor do we find differences between the new data set and the one taken in July 2000: we refer to Bianchi et al. (in prep.) for details. Applying the model discussed in Matt et al. (2004) for the old XMM observation to the new 5–10 keV pn spectra, we infer that the flux of the narrow core of the iron K line is constant within 5%.
The best fit of the four spectra is shown in Fig. 1: no spectral or flux variations are apparent.
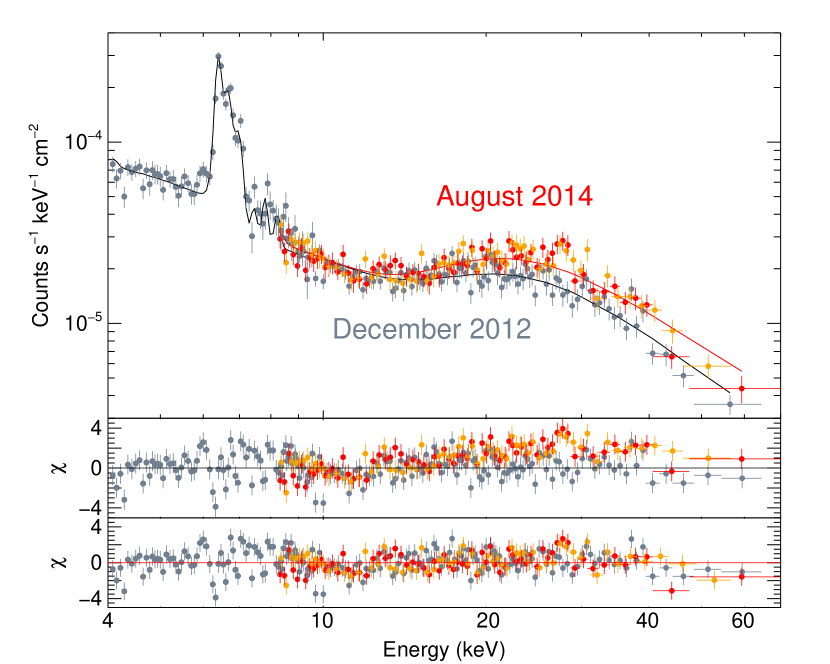
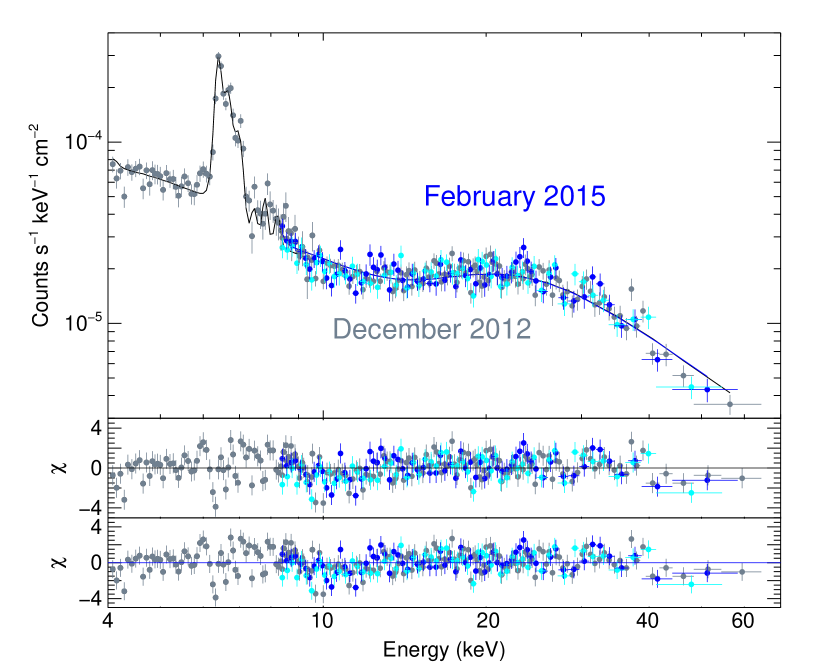
Since no significant changes are found between the XMM spectra, we used only the observation simultaneous to the high-energy transient event (ObsId 0740060401: Table 1, Fig. 2) and then included NuSTAR FPMA and FPMB spectra from observations performed in December 2012, August 2014 and February 2015. The final data set is therefore comprised of seven spectra: one XMM spectrum taken in August 2014 and three pairs of NuSTAR spectra taken in 2012, 2014 and 2015. We only considered NuSTAR data above 8 keV because XMM spectra have higher spectral resolution and higher SNR in the Fe K energy range.
We then apply the best-fit model discussed in Bauer et al. (2015) to our XMM+NuSTAR 4-79 keV data set. This model fits data from 1996 until 2012 from multiple X-ray observatories. The authors found, using MYTorus tables (model M2d), that the reflecting material is composed of three distinct components with N cm-2, N cm-2 and N cm-2. NH,1 is the absorbing column density along the line of sight. Chandra observations show that the spectral features attributed to the NH,1 and NH,2 components arise from the central 2 arcsec only, while NH,3 corresponds to regions outside the central 2 arcsec. NH,1 and NH,3 contribute primarily to the Compton hump, while NH,2 and NH,3 provide dominant contributions to the Fe K lines (Bauer et al., 2015).
For this analysis the normalizations of the absorbed, scattered and line emission in MYTorus tables were kept tied together (coupled reprocessor solution; Yaqoob et al. 2012): further details about this solution can be found in Bauer et al. (2015). Applying their best-fit model to our data set we find /dof=1166/896=1.30 because the model does not reproduce well the August 2014 NuSTAR data (Fig. 2, left-middle panel). Indeed, Fig. 2 and Table 1 show that there is a flux increase above 20 keV and a clear additional spectral feature in the NuSTAR observation taken in August 2014.
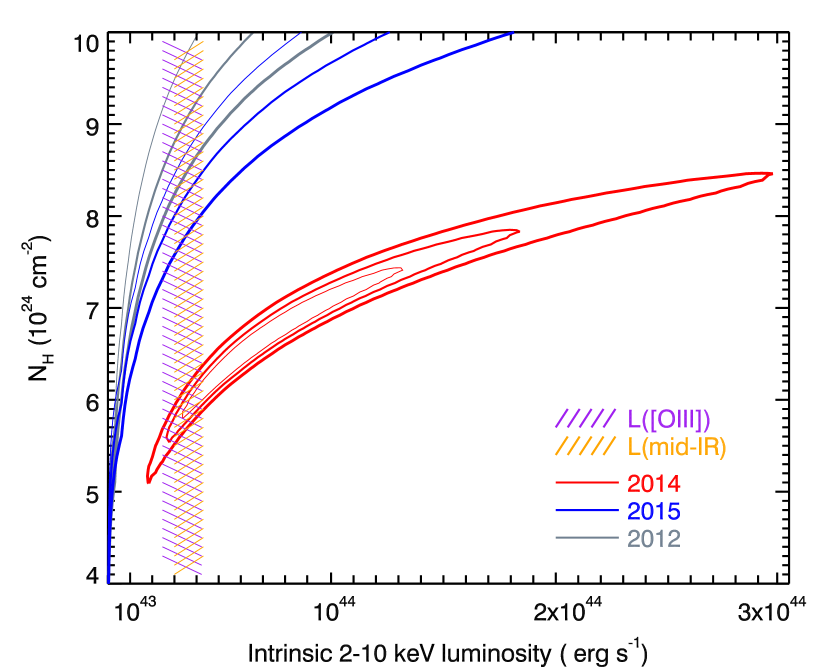
We first model this excess by leaving the column density NH,1 (along the line of sight) free to vary in the 2014 spectra, which results in a significant improvement of the fit (=177 for one additional free parameter). A marginal improvement is found when we also leave the normalization of the primary component free to vary (=10 for one additional free parameter), for a final /dof=979/894=1.09; no strong residuals are seen throughout the whole 4-79 keV energy band (Fig. 2, bottom panels). Best fit values for the column density along the line of sight and for the nuclear component normalization are N cm-2 and A ph cm-2 s-1 keV-1 at 1 keV, respectively. This normalization leads to an unabsorbed 2–10 keV luminosity L erg s-1 , which is consistent with the value presented in Bauer et al. (2015), within the error bars (Fig. 3).The intrinsic luminosity presented in Bauer et al. (2015) is L erg s-1 and indeed, the authors state that it is a factor 1.6 lower than the one derived from the mid-IR to X-ray relation in Gandhi et al. (2009) (which is the orange vertical stripe in Fig. 3). However, we note that at high column densities the derived intrinsic luminosity is highly dependent on the (unknown) geometry of the absorber (e.g. Matt, Pompilio & La Franca, 1999). The fit does not improve if we leave the normalization and column density of the 2015 spectra free to vary, indicating that there is no difference between the 2012 and 2015 data sets. Residuals around 25-30 keV in both August 2014 and February 2015 observations (Fig. 2, middle and bottom panels) may be ascribed to residual instrumental features in the NuSTAR ARFs (see Fig. 7 and 8, Madsen et al. 2015). If we include the instrumental background emission lines between 22 keV and 35 keV, no significant variations in the best fit parameters are found. This effect represents of the total 20-80 keV flux in the August 2014 observation and of the observed flux excess, in the 20-80 keV energy band. Fig. 3 shows the contour plots between the column density along the line of sight (the one directly obscuring the primary continuum) and the intrinsic 2-10 keV nuclear luminosity extrapolated from the de-absorbed best fit from the primary continuum for the three NuSTAR data sets (colors as in Fig. 2). The inferred X-ray luminosity L– erg s-1 is almost four orders of magnitude greater than usually observed in ULXs (Swartz et al., 2004; Walton et al., 2011): the lack of variations below 10 keV and the sharp cutoff in ULX spectra above 20 keV (Bachetti et al., 2013; Walton et al., 2013, 2014, 2015) lead us to conclude that this transient excess cannot be attributed to the ULX in the NGC 1068 FOV.
We then considered the possibility that the high-energy excess in the August 2014 observation might be due to a rise in the reflected emission only, due to matter with N cm-2. The only way to have a variation in the Compton hump without an associated variation in the iron line is for the reflector to be almost completely self-obscured. Indeed, fits show that the inclination angle of the reflector would have to be larger than 87∘, assuming a toroidal configuration. We therefore conclude that this intepretation, while not impossible, is unlikely.
4 Discussion
We interpret the high-energy excess detected in the August 2014 NuSTAR spectra as the first unveiling event ever observed in NGC 1068, in which there is a drop in the column density along our line of sight. If we take into account the mid-IR and [OIII] luminosities as proxies of the intrinsic nuclear luminosity, we have additional pieces of information to add to the contour plots shown in Fig. 3. The vertical orange lines represent the intrinsic 2-10 keV luminosity inferred from the mid-IR luminosity (Gandhi et al., 2009). Purple lines indicate the intrinsic 2-10 keV luminosity calculated from the extinction-corrected [OIII] luminosity (Marinucci et al., 2012a) using the [OIII]-X ray relation from Lamastra et al. (2009). Contour plots show that the intrinsic X-ray luminosity for the three observations is consistent with those inferred using other proxies, and all the spectral difference can be attributed to a change in the absorbing column density, from N cm-2 in the 2012 observation to N cm-2 in 2014 (Fig. 3, using 90% confidence level for two interesting parameters).
Assuming the bolometric correction from Marconi et al. (2004) we infer L erg s-1, in agreement with Hönig, Prieto & Beckert (2008). The black hole mass of NGC 1068 is estimated to be M⊙ (Greenhill et al., 1996; Lodato & Bertin, 2003). For consistency with the mid-IR and [OIII] luminosities (Fig. 3) we take the lower value L erg s-1, leading to an accretion rate , confirming the highly accreting nature of the source.
Absorption variability is common when observations performed months to years apart are compared (Risaliti, Elvis & Nicastro, 2002), and has been found on time scales of hours to days in several sources. However, even in the so-called “changing-look AGN” (sources that switched from the Compton-thick to the Compton-thin state and vice versa) an eclipsing/unveiling event affecting only the spectrum above 10 kev has never been observed: we emphasize that this is the first time that a Compton-thick unveiling event of this kind has been reported. We note that this is different from the intrinsic variability recently reported for the Compton-thick AGN NGC 4945 (Puccetti et al., 2014). Our finding is supporting a clumpy structure of the obscuring material along the line of sight (Nenkova et al., 2008).
In this scenario we do not have a single, monolithic obscuring wall, but the total column density along the line of sight is the sum of the contributions from a discrete number of clouds. The NuSTAR sensitivity above 10 keV allowed us to infer only a lower limit on the column density variation (N cm-2) but greater changes could have occurred (top-left corner of Fig. 3: the parameter space with N cm-2) but were not measurable with our data. Further monitoring of NGC 1068 could provide contraints on the number of clouds and their distance from the illuminating source.
5 Conclusions
We presented a spectral analysis of the 4-79 keV NuSTAR and XMM-Newton monitoring campaign of NGC 1068 obtained between July 2014 and February 2015. We found a clear transient excess above 20 keV in the August 2014 NuSTAR observation, while no variations are found in the XMM data below 10 keV. The most plausible explanation is an unveiling event, in which for a short while the total absorbing column, probably composed by a number of individual clouds, became less thick so as to permit to the nuclear radiation to pierce through it. Our result provides further evidence that the obscuring material along our line of sight is clumpy, and enables us to infer a 2–10 keV intrinsic luminosity of L erg s-1.
ACKNOWLEDGEMENTS
We thank the referee for her/his comments. AM, SB and GM acknowledge financial support from Italian Space Agency under grant ASI/INAF I/037/12/0-011/13. FEB acknowledges support from CONICYT-Chile (PFB-06/2007, FONDECYT 1141218, ACT1101), and grant IC120009, awarded to The Millennium Institute of Astrophysics, MAS. WNB acknowledges Caltech NuSTAR subcontract 44A-1092750. This work was supported under NASA Contracts No. NNG08FD60C, NNX10AC99G, NNX14AQ07H and made use of data from the NuSTAR mission, a project led by the California Institute of Technology, managed by the Jet Propulsion Laboratory, and funded by the National Aeronautics and Space Administration. We thank the NuSTAR Operations, Software and Calibration teams for support with the execution and analysis of these observations. This research has made use of the NuSTAR Data Analysis Software (NuSTARDAS) jointly developed by the ASI Science Data Center (ASDC, Italy) and the California Institute of Technology (USA).
References
- Antonucci & Miller (1985) Antonucci R. R. J., Miller J. S., 1985, ApJ, 297, 621
- Arnaud (1996) Arnaud K. A., 1996, in ASP Conf. Ser. 101: Astronomical Data Analysis Software and Systems V, p. 17
- Bachetti et al. (2013) Bachetti M. et al., 2013, ApJ, 778, 163
- Bauer et al. (2015) Bauer F. E. et al., 2015, eprint arXiv:1411.0670
- Bianchi, Maiolino & Risaliti (2012) Bianchi S., Maiolino R., Risaliti G., 2012, Advances in Astronomy, 2012, 17
- Bianchi et al. (2009) Bianchi S., Piconcelli E., Chiaberge M., Bailón E. J., Matt G., Fiore F., 2009, ApJ, 695, 781
- Brinkman et al. (2002) Brinkman A. C., Kaastra J. S., van der Meer R. L. J., Kinkhabwala A., Behar E., Kahn S. M., Paerels F. B. S., Sako M., 2002, A&A, 396, 761
- Colbert et al. (2002) Colbert E. J. M., Weaver K. A., Krolik J. H., Mulchaey J. S., Mushotzky R. F., 2002, ApJ, 581, 182
- Elvis et al. (2004) Elvis M., Risaliti G., Nicastro F., Miller J. M., Fiore F., Puccetti S., 2004, ApJ, 615, L25
- Gandhi et al. (2009) Gandhi P., Horst H., Smette A., Hönig S., Comastri A., Gilli R., Vignali C., Duschl W., 2009, A&A, 502, 457
- Ghisellini, Haardt & Matt (1994) Ghisellini G., Haardt F., Matt G., 1994, MNRAS, 267, 743
- Greenhill et al. (1996) Greenhill L. J., Gwinn C. R., Antonucci R., Barvainis R., 1996, ApJ, 472, L21
- Guainazzi et al. (2012) Guainazzi M., La Parola V., Miniutti G., Segreto A., Longinotti A. L., 2012, A&A, 547, A31
- Guainazzi et al. (2000) Guainazzi M., Molendi S., Vignati P., Matt G., Iwasawa K., 2000, NEWA, 5, 235
- Hönig, Prieto & Beckert (2008) Hönig S. F., Prieto M. A., Beckert T., 2008, A&A, 485, 33
- Iwasawa, Fabian & Matt (1997) Iwasawa K., Fabian A. C., Matt G., 1997, MNRAS, 289, 443
- Koyama et al. (1989) Koyama K., Inoue H., Tanaka Y., Awaki H., Takano S., Ohashi T., Matsuoka M., 1989, PASJ, 41, 731
- Lamastra et al. (2009) Lamastra A., Bianchi S., Matt G., Perola G. C., Barcons X., Carrera F. J., 2009, A&A, 504, 73
- Lodato & Bertin (2003) Lodato G., Bertin G., 2003, A&A, 398, 517
- Madsen et al. (2015) Madsen K. K. et al., 2015, e-prints arXiv:1504.01672
- Marconi et al. (2004) Marconi A., Risaliti G., Gilli R., Hunt L. K., Maiolino R., Salvati M., 2004, MNRAS, 351, 169
- Marinucci et al. (2012a) Marinucci A., Bianchi S., Nicastro F., Matt G., Goulding A. D., 2012a, ApJ, 748, 130
- Marinucci et al. (2012b) Marinucci A., Risaliti G., Wang J., Nardini E., Elvis M., Fabbiano G., Bianchi S., Matt G., 2012b, MNRAS, 423, L6
- Matt et al. (2004) Matt G., Bianchi S., Guainazzi M., Molendi S., 2004, A&A, 414, 155
- Matt, Brandt & Fabian (1996) Matt G., Brandt W. N., Fabian A. C., 1996, MNRAS, 280, 823
- Matt et al. (1997) Matt G. et al., 1997, A&A, 325, L13
- Matt, Pompilio & La Franca (1999) Matt G., Pompilio F., La Franca F., 1999, New Astronomy, 4, 191
- Nenkova et al. (2008) Nenkova M., Sirocky M. M., Nikutta R., Ivezić Ž., Elitzur M., 2008, ApJ, 685, 160
- Netzer (2015) Netzer H., 2015, ArXiv e-prints
- Pounds & Vaughan (2006) Pounds K., Vaughan S., 2006, MNRAS, 368, 707
- Puccetti et al. (2014) Puccetti S. et al., 2014, ApJ, 793, 26
- Puccetti et al. (2007) Puccetti S., Fiore F., Risaliti G., Capalbi M., Elvis M., Nicastro F., 2007, MNRAS, 377, 607
- Risaliti et al. (2005) Risaliti G., Elvis M., Fabbiano G., Baldi A., Zezas A., 2005, ApJ, 623, L93
- Risaliti, Elvis & Nicastro (2002) Risaliti G., Elvis M., Nicastro F., 2002, ApJ, 571, 234
- Rivers et al. (2015) Rivers E. et al., 2015, e-prints arXiv:1503.03109
- Strüder et al. (2001) Strüder L. et al., 2001, A&A, 365, L18
- Swartz et al. (2004) Swartz D. A., Ghosh K. K., Tennant A. F., Wu K., 2004, ApJS, 154, 519
- Tully (1988) Tully R. B., 1988, Nearby galaxies catalog
- Turner et al. (2001) Turner M. J. L. et al., 2001, A&A, 365, L27
- Ueno et al. (1994) Ueno S., Mushotzky R. F., Koyama K., Iwasawa K., Awaki H., Hayashi I., 1994, PASJ, 46, L71
- Walton et al. (2013) Walton D. J. et al., 2013, ApJ, 779, 148
- Walton et al. (2014) —, 2014, ApJ, 793, 21
- Walton et al. (2015) —, 2015, e-prints arXiv:1504.00023
- Walton et al. (2011) Walton D. J., Roberts T. P., Mateos S., Heard V., 2011, MNRAS, 416, 1844
- Young, Wilson & Shopbell (2001) Young A. J., Wilson A. S., Shopbell P. L., 2001, ApJ, 556, 6