11email: cornelia.haisjackl, stefan.zugal@uibk.ac.at
Investigating Differences between Graphical and Textual Declarative Process Models††thanks: This research is supported by Austrian Science Fund (FWF): P26140–N15, P23699–N23. The final publication is available at Springer via http://dx.doi.org/10.1007/978-3-319-07869-4_17
Abstract
Declarative approaches to business process modeling are regarded as well suited for highly volatile environments, as they enable a high degree of flexibility. However, problems in understanding declarative process models often impede their adoption. Particularly, a study revealed that aspects that are present in both imperative and declarative process modeling languages at a graphical level—while having different semantics—cause considerable troubles. In this work we investigate whether a notation that does not contain graphical lookalikes, i.e., a textual notation, can help to avoid this problem. Even though a textual representation does not suffer from lookalikes, in our empirical study it performed worse in terms of error rate, duration and mental effort, as the textual representation forces the reader to mentally merge the textual information. Likewise, subjects themselves expressed that the graphical representation is easier to understand.
Keywords:
Declarative Process Models, Empirical Research, Mindshift Learning Theory.1 Introduction
In the context of analyzing and designing information systems, the positive influence of conceptual modeling on understanding and communication has been documented Mylo98 . For example, business process models (process models for short) have been employed in the context of process–aware information systems, service–oriented architectures and web services ReMe . Recently, declarative approaches have received increasing attention due to their flexibility with respect to modeling and execution of processes ReWe12 . While imperative process models specify exactly how things must be done, declarative models focus on the logic that governs the interplay of process actions by describing activities that may be performed as well as constraints prohibiting undesired behavior. Existing research has addressed technical issues of declarative process models, such as maintainability ZuPW11 , verification Pesi08 and execution Bar+13 . Understandability concerns of declarative models, on the contrary, have been considered only to a limited extent. So far, a study was conducted focusing on common strategies and typical pitfalls when system analysts make sense of declarative process models BPMDS2013 . The study revealed that aspects that are present in both imperative and declarative process modeling languages at a graphical level—while having different semantics—cause considerable troubles. To understand these findings, we would like to refer to the theory of Mindshift Learning ArHa07 . This theory postulates that, when learning new modeling languages, concepts that are similar, but still show subtle differences, are most difficult to learn. In this work, we investigate whether mindshift learning indeed imposes a burden on understanding declarative process models by conducting an empirical study, trying to avoid mindshift learning by using a declarative process modeling notation based on text. We handed out graphical and textual declarative process models to subjects and asked them to perform sense–making tasks. Results of this study indicate that the graphical representation is advantageous because it gives rise to fewer errors, shorter durations, and less mental effort. Therefore, even though it might be recommendable to avoid representing declarative models in a way similar to imperative models, a pure textual representation does not seem to be the right solution.
The remainder of the paper is structured as follows. Sect. 2 gives background information. Then, Sect. 3 describes the setup of the empirical investigation, whereas Sect. 4 deals with its execution and presents the results. Finally, related work is presented in Sect. 5, and Sect. 6 concludes the paper.
2 Backgrounds
Next, we present background information on declarative models (Sect. 2.1) and present the concept of mental effort as a measure for understanding (Sect. 2.2).
2.1 Declarative Process Models
Declarative approaches to business process modeling have received increasing interest, as they promise to provide a high degree of flexibility Pesi08 . Instead of describing how a process must be executed, declarative models focus on the logic that governs the interplay of activities. For this purpose, declarative process models specify activities that may be performed as well as constraints prohibiting undesired behavior. Constraints found in literature may be divided into existence constraints, relation constraints and negation constraints AalstPesic2006DecSerFlow . Existence constraints specify how often an activity must be executed for one particular process instance (e.g., , cf. Figure 1). In turn, relation constraints restrict the ordering of activities (e.g., , cf. Figure 1). Finally, negation constraints define negative relations between activities (e.g., , cf. Figure 1).
A trace is defined as a completed process instance ReWe12 . It can have two different states: either it satisfies all constraints of the process model (valid, also referred to as satisfied), or the trace violates constraints in the process model (invalid, also referred to as violated). A minimal trace is defined as a valid trace with a minimum number of activities. A sub–trace, in turn, can be in three different states: First, a sub–trace can be valid (the sub–trace satisfies all constraints of the process model). Second, it can be temporarily violated (the sub–trace does not satisfy all constraints of the process model, but there is an affix or suffix that could be added to the sub–trace such that all constraints are satisfied), or third, invalid (the sub–trace violates constraints in the process model and no affix or suffix can be added to the sub–trace to satisfy all constraints).
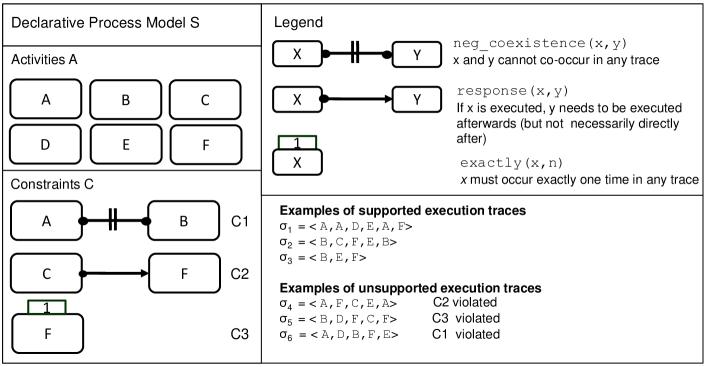
An example of a declarative process model , using Declare (formerly known as ConDec) Pesi08 , is shown in Figure 1. consists of 6 activities A to F and 3 constraints. The neg_coexistence constraint (C1) forbids that A and B co-occur in the same trace. In turn, the response constraint (C2) requires that every execution of C must be followed by one of F before the process instance may complete. Finally, the exactly constraint (C3) states that F must be executed exactly once per process instance. For instance, trace =<A,A,D,E,A,F> satisfies all constraints (C1–C3), i.e., these are valid traces, whereas, e.g., trace is invalid as it violates C1. Trace =<F> is the minimal trace since there exists no other valid trace comprising a lower number of activities.
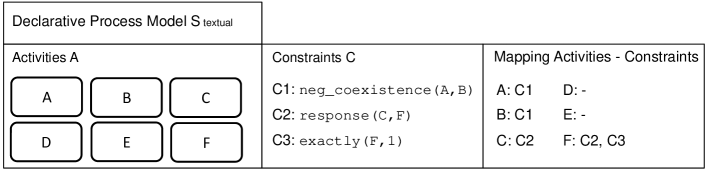
In the empirical investigation we try to avoid mindshift learning by using a declarative process modeling notation based on text. Figure 2 shows the textual representation of the declarative process model (cf. Figure 1). The textual representation consists of three parts. First, a list of activities (activities A to F). Second, a list of constraints (C1 to C3). Third, an activity–constraint mapping list, to support subjects when looking up all constraints that are related to a specific activity (e.g., F is related to constraints C2 and C3).
2.2 Mental Effort
To investigate the sense–making of declarative process models, it seems necessary to also take into account the humans cognitive system—in particular working memory, which is responsible for maintaining and manipulating a limited amount of information for goal–directed behavior, such as the interpretation of a declarative process model (cf. Badd12 ). The amount of working memory currently used is thereby referred to as mental effort Paa+03 . Research indicates that a high mental effort increases the probability of errors, especially when the working memory capacity is exceeded Swel88 . In the context of conceptual models, Zug+12b argues that higher mental effort is in general associated with lower understanding of models. Various techniques exist for assessing mental effort, including pupillometry, heart–rate variability and rating scales Paa+03 . Especially rating scales, i.e., self–rating mental effort, has been shown to reliably measure mental effort and is thus widely adopted Paa+03 . Furthermore, this kind of measurement can be easily applied, e.g., by using 7–point rating scales. In the context of conceptual modeling, it was argued that mental effort should be considered as an additional measure of understanding together with error rates and duration Zug+12b .
3 Defining and Planning the Empirical Investigation
To investigate whether mindshift learning indeed imposes a burden on understanding declarative process models we conduct an empirical investigation.
3.0.1 Research Question.
Goal of this empirical investigation is to avoid difficulties because of
mindshift learning due to similarities between imperative and declarative
modeling notations. Therefore, we investigate how system analysts answer several
tasks about declarative process models, once with a graphical model
representation (with presence of mindshift learning) and once with a textual
model representation (with absence of mindshift learning). In particular, we are
interested in differences between graphical and textual model representations
regarding errors, duration and mental effort. Therefore, our research
questions can be stated as follows:
Research Question What are the
differences between a graphical and textual representation regarding error
rates?
Research Question What are the
differences between a graphical and textual representation regarding
duration?
Research Question What are the
differences between a graphical and textual representation regarding mental
effort?
With our last research question, we take a broader perspective and ask subjects
directly for advantages and disadvantages for each representation as well as
personal suggestions for improving the understandability of declarative process
models.
Research Question What are advantages of each representation and what are potential improvements for the understandability of declarative process models?
3.0.2 Subjects.
To ensure that obtained results are not influenced by unfamiliarity with declarative process modeling, subjects need to be sufficiently trained. Even though we do not require experts, subjects should have at least a moderate understanding of declarative processes’ principles.
3.0.3 Objects.
The process models ( and ) used in this
investigation originate from a previous study (cf. BPMDS2013 ) and
describe real–world business processes. Since we were interested in the
influence of differences regarding the process models’ representation, we created a second
variant of each process model describing the exact same process, but with a
textual representation. The variants for are illustrated in
Figure 3. For the graphical models we
use the declarative process modeling language Declare Pesi08 , where
activities are represented as boxes and constraints as lines or arcs. The
textual models are described in Sect. 2.1.111The
empirical investigation’s material can be downloaded
from:
http://bpm.q-e.at/GraphicalTextualDPM
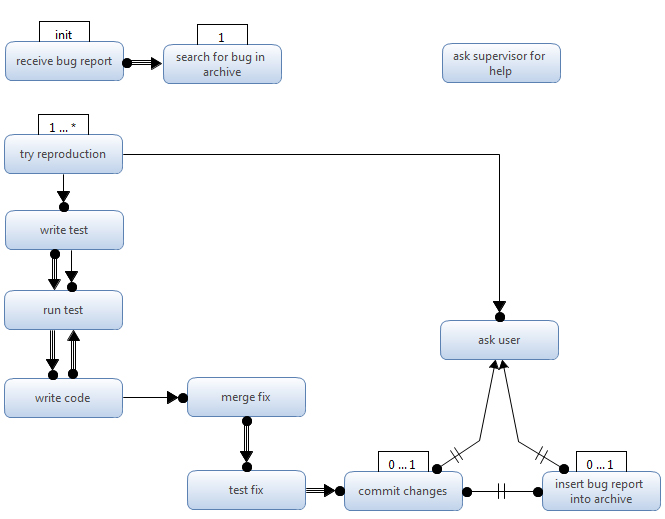
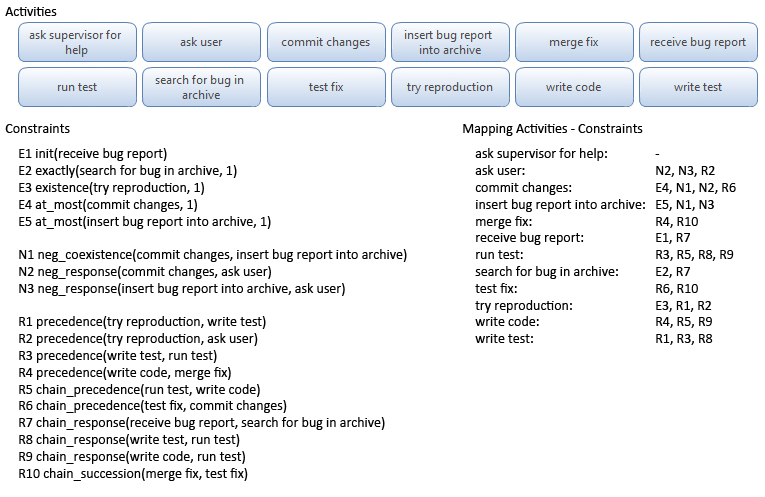
The models vary regarding the number of activities (between 12 and 24), number of constraints (between 18 and 25) and degree of interconnectivity of constraints, i.e., models consist of 3 to 6 components (cf. BPMDS2013 ). The process models are based on two different domains describing bug fixing in a software company and a worker’s duties at an electronic company. Both models contain constraints of all three types, i.e., existence, relation and negation constraints.
3.0.4 Design.
Figure 4 shows the
overall design of the empirical investigation: First, subjects are
randomly assigned to two groups of similar size. Regardless of the
group assignment, demographical data is collected and subjects obtain
introductory assignments. To support subjects, sheets briefly summarizing the
constraints’ semantics are provided, which can be used throughout the
investigation. Then, each subject works on one graphical and one textual process
model. Group 1 starts with the graphical representation of , while Group 2
works on the textual representation of the same model. A session is concluded by
a discussion with the subject to help reflecting on the investigation and
providing us with feedback. For each process model, a series of questions is
asked (cf. Figure 4b): First, subjects are
asked to describe what the goal of the process model is, allowing subjects to
familiarize with the model. Second, we seek to assess whether subjects
understand the process model by asking 3 questions regarding traces in
declarative process models: naming the minimal trace, naming 2 valid traces and
naming 2 invalid traces (cf. Sect. 2.1). Further, a
series of questions is designed based on the findings of BPMDS2013 to
investigate hidden dependencies, pairs of constraints, combinations of
constraints and existence constraints. Third, we ask the subjects about their
opinion on advantages and disadvantages of each model representation, what parts
are most challenging and if they have any suggestions to make the model easier
to read/understand.
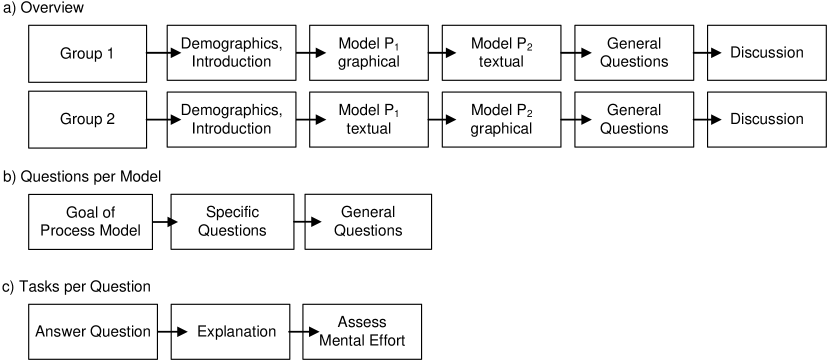
For each question, a three–step procedure is followed, cf. Figure 4 c). First, the subject is asked to answer the question either by True, False or Don’t Know. Second, the subject has to fill in an explanation field, where it should be reasoned why the specific answer was given. Third, the subject is asked to assess the expended mental effort. To this end, a 7–point rating scale is used, which is known to reliably measure mental effort Paa+03 .
3.0.5 Instrumentation.
For the operationalization of this setup, we relied on Cheetah Experimental Platform (CEP) PiZW10 . CEP guided the subjects through the sessions, starting with an initial questionnaire, two questionnaires about declarative process models (one represented graphically and one textually), a concluding questionnaire and a feedback questionnaire. Data was collected automatically, ensuring that each session, the collected demographic data was stored as a separate case of the empirical investigation.
4 Execution and Results
So far we described the experimental setup, next we briefly describe its execution as well as the results.
4.0.1 Execution
The empirical investigation was conducted in December 2013 at the University of Innsbruck in the course of a weekly lecture on business processes and workflows; all in all 9 students participated. To prepare the students, a lecture on declarative process models was held one week before the empirical investigation. In addition, students had to work on several modeling assignments using declarative processes before the investigation took place. Immediately before the sessions, a short lecture revisiting the most important concepts of declarative process models and the setup was held. The rest of the session was guided by CEP’s experimental workflow engine PiZW10 , as described in Sect. 3.
4.0.2 Data Validation
Since our research setup requires subjects to be at least moderately familiar with Declare, we used a Likert scale, ranging from “Strongly agree” (7) over “Neutral” (4) to “Strongly disagree” (1) to screen for familiarity with Declare. The computed mean is 4.11 (slightly above average). For confidence in understanding Declare models a mean value of 4.11 was reached (slightly above average). Finally, for perceived competence in creating Declare models, a mean value of 4 (average) could be computed. Since all values range about average, we conclude that the participating subjects fit the targeted profile. In the following, we use the gathered data to investigate the research questions.
4.0.3 : What are the differences between a graphical and textual representation regarding error rates?
To investigate , the subjects were asked to answer specific questions (cf. Sect. 3) As detailed previously, they had to identify one minimal trace, 2 valid traces and 2 invalid traces for each model. Since 9 subjects participated in the investigation and each subject worked on two process models, 18 answers were collected regarding the minimal trace (9 for each model). Further, 36 for valid traces (18 for each model) and 36 invalid traces (18 for each model) were collected. Additionally, we asked subjects 2 questions regarding 4 categories for each model. As described in Sect. 3, the categories are hidden dependencies, pairs of constraints, combinations of constraints and existence constraints. Therefore, there are 9 subjects, 8 questions per model, 2 models, resulting in 144 answers. Table 1 shows the distribution of answers: Overall, subjects gave 179 out of 234 correct answers (76.50%).
| Graphical | Textual | |||||
|---|---|---|---|---|---|---|
| Category | Both | Both | ||||
| Traces | 80% | 80% | 80% | 92% | 60% | 78% |
| Hidden Dependencies | 100% | 90% | 94% | 90% | 75% | 83% |
| Pairs of Constraints | 75% | 60% | 67% | 70% | 63% | 67% |
| Combination of Constraints | 63% | 90% | 78% | 70% | 50% | 61% |
| Existence Constraints | 63% | 90% | 78% | 70% | 75% | 72% |
| Overall | 77% | 82% | 79% | 82% | 63% | 74% |
As mentioned in Sec. 3, we asked subjects to give us an explanation for each answer. We used these explanations for identifying and classifying reasons for errors. Table 2 gives an overview of the data analysis: Overall, 55 answers were incorrect (23.50%).
| Category | Graphical | Textual | Both |
|---|---|---|---|
| Subtrace definition | 8 | 7 | 15 |
| Overlooked model elements | 4 | 6 | 10 |
| Unknown | 5 | 5 | 10 |
| Constraint definition | 3 | 6 | 9 |
| Lacking modeling knowledge | 3 | 2 | 5 |
| Hidden dependency | 1 | 3 | 4 |
| Problem with setup | 0 | 2 | 2 |
All in all, we could identify 7 categories why subjects failed to give a correct answer. Considering the most commonly reason for errors, 15 times subjects answered incorrectly because they had problems with the definition of a sub–trace (cf. Sect. 2.1). Ten times a wrong answer was given due to overlooked model elements, i.e., activities or constraints. Additionally 10 times we were not able to categorize the error, because either the subject did not enter an explanation or the explanation was not sufficient. Nine times the subjects answered incorrectly due to problems with constraint definitions, e.g., confusing two constraints with each other. Five errors were caused by lack of modeling knowledge. Four times a wrong answer was given due to hidden dependencies. Two times we identified that an error was made because of a problem with the setup, i.e., we asked for two valid traces, but the subjects just entered one.
Overall, 31 out of 55 error are due to problems with the setup (either direct problems with setup or indirect, i.e., lack of knowledge or troubles with definitions) and 10 unknown. The 14 remaining errors were made because of overlooking model elements when combining constraints, or hidden dependencies (cf. BPMDS2013 ).
Discussion.
In general, we observed that subjects make less errors when the model is represented graphically. As previous findings BPMDS2013 indicate that subjects have considerable problems making sense of graphically represented pairs of constraints, we expected that subjects would give fewer wrong answers using the textual representation. However, our findings indicate that there is no difference between textual or graphical representation in this category. It seems that having the disadvantage of mindshift learning is still less challenging for subjects than the extraction of information from text, i.e., information that needs to be computed in the human mind ScRo96 .
4.0.4 : What are the differences between a graphical and textual representation regarding duration?
To target this research question, we investigated how long it took subjects to answer all specific questions (c.f., Section 3). Table 3 shows the duration in minutes for the 11 questions per model.
| Minimum | Maximum | Mean | |
|---|---|---|---|
| graphical representation | 17 | 41 | 28 |
| textual representation | 23 | 55 | 37 |
| graphical representation | 10 | 20 | 15 |
| textual representation | 19 | 30 | 24 |
Discussion.
The findings obtained in indicate that answering questions about a graphically represented model needs less time than for a textual model. In particular, the disadvantage of mindshift learning is not only less challenging for subjects than the extraction of information from text (c.f., ), but it also needs less time.
4.0.5 : What are the differences between a graphical and textual representation regarding mental effort?
When investigating the sense–making of declarative process models, it seems desirable to have measures that allow researchers to assess in how far proposed concepts support the human mind in interpreting declarative process models. As described in Sect. 2.2, the measurement of mental effort seems to be promising, as it presumably allows assessing subtle changes with respect to understandability Zug+12b . To this end, we computed the average mental effort for each question. Table 4 shows the mental effort for the specific questions per model mentioned in Sect. 3 (11 questions per model).
| Minimum | Maximum | Mean | |
|---|---|---|---|
| graphical representation | 3.09 | 4 | 3.68 |
| textual representation | 3.36 | 6 | 4.47 |
| graphical representation | 3.45 | 4.73 | 3.96 |
| textual representation | 4.27 | 4.82 | 4.48 |
Discussion.
The empirical investigation indicates that answering questions to a graphically represented model requires a higher mental effort than for a textual one. To understand these findings, we would like to refer to the Split–Attention Effect Kal+03 . This effect occurs when information from different sources has to be integrated and is known to increase mental effort. In our case, when studying a textually represented model that consists of three separate lists (activities, constraints and an activity–constraint mapping), the subject has to keep parts of one list in working memory while searching for the matching parts in other lists. Thereby, two basic effects are distinguished. First, the reader has to switch attention between different information sources, e.g., constraint and mapping lists. Second, the reader has to integrate different information sources. These two phenomena in combination are then known to increase mental effort and are referred to as split -attention effect.
4.0.6 : What are advantages of each representation and what are potential improvements for the understandability of declarative process models?
The goal of is to complement findings obtained so far with opinions from students, i.e., subjective measures. In particular, after all specific questions were answered, we additionally asked general questions for each model. To analyze answers, we identified and classified issues, which—according to the subjects—influence the sense–making of declarative business process models. All in all, we could find 5 factors that subjects considered to be harmful for the sense–making of declarative process models (cf. Table 5). Three subjects mentioned that the pairs of constraints posed a considerable challenge for the sense–making (cf. BPMDS2013 ). In addition, 3 subjects explicitly mentioned that they experienced problems with the high number of constraints and resulting dependencies (combination of constraints). One subject explained that he had problems due to too many activities. Another one mentioned that he was challenged making sense of because there were too many components. Also, 6 subjects perceived the textual representation as a negative influence.
| Category | Factor | Subjects | Influence |
|---|---|---|---|
| Constraints | Pairs of constraints | 3 | |
| Combination of constraints | 3 | ||
| Number of activities | 1 | ||
| Number of components | 1 | ||
| Other | Representation | 5 |
Regarding advantages or disadvantages of each representation, 6 subjects mentioned that the graphical representation was easier to grasp. One subject answered that the graphical representation is also unclear sometimes due to pairs of constraints (cf. BPMDS2013 ). One subject praised the good overview of the constraints at the textual representation. Overall, the subjects had a better perception of the graphical representation, which might also be concerned with the shorter duration and lower mental effort (cf. and ). Also, subjects made propositions how to make declarative process models easier to understand. In particular, 7 subjects proposed to only use the graphical representation. In addition, one subject indicated that paired constraints should be simplified. Unsurprisingly, suggestions for the improvement of declarative process models are closely connected to respective problems (cf. Table 5). In general, it can be observed that the basic building blocks of declarative process models—activities and constraints—are rather unproblematic. However, the combination of constraints and in particular pairs of constraints, in turn, pose considerable challenges. In this sense, for instance, approaches providing computer–based support for the interpretation of constraints seem promising Zug+11b .
4.0.7 Limitations.
Our work has the following limitations. First, the number of subjects in the empirical investigation is relatively low (9 subjects), hampering the only of descriptive nature result’s generalization. Second, even though process models used in this investigation vary in the number of activities, number of constraints and representation, it remains unclear whether results are applicable to declarative process models in general, e.g., more complex models. Third, all subjects are students, further limiting the generalization of results. Finally, most errors were due to problems with the setup of the investigation (cf. Table 2).
5 Related Work
In this work, we investigated the understanding of graphical and textual declarative process models. More generally, factors of conceptual model comprehension were investigated in MSR12 , and the understandability of imperative process models was investigated in ReMe . Comparisons of graphical and textual notations were examined from different angels. For instance, the interpretation of business process descriptions in BPMN (graphical notation) and in an alternative text notation (based on written use-cases) was investigated in OttensooserJSS2012 . More generally, Whitley97 provides an overview of relative strengthes and weaknesses of textual versus flowchart notations. For this investigation, we have focused on the declarative modeling language Declare. Recently, also Dynamic Condition Response (DCR) graphs HiMu10 have gained increasing interest. Unlike Declare, DCR graphs focus on a set of core constraints instead of allowing for the specification of arbitrary constraints. However, so far, contributions related to DCR graphs have rather focused on technical aspects, such as technical feasibility and expressiveness, while understandability was not approached yet.
6 Summary and Outlook
Declarative approaches to business process modeling have recently attracted interest, as they provide a high degree of flexibility Pesi08 . However, the increase in flexibility comes at the cost of understandability and hence might result in maintainability problems of respective process models Pesi08 . The presented empirical investigation presents differences between graphical and textual represented declarative business process models. The results indicate that the graphical representation is advantageous in terms of errors, duration and mental effort. In addition, subjects themselves expressed that the graphical representation is easier to understand. As indicated in BPMDS2013 , it might be recommendable to avoid representing declarative models in a way similar to imperative models, especially when semantic differ considerably (cf. Mindshift Learning theory ArHa07 ). However, a pure textual representation does not seem to be the right solution. To accomplish our goal of a better understandability of declarative process models, further investigations are needed. Particularly, replications utilizing an adapted hybrid representation seem to be appropriate means for additional empirical tests.
References
- (1) Mylopoulos, J.: Information modeling in the time of the revolution. Information Systems 23 (1998) 127–155
- (2) Reijers, H.A., Mendling, J.: A Study into the Factors that Influence the Understandability of Business Process Models. IEEE Transactions on Systems, Man and Cybernetics, Part A 41 (2011) 449–462
- (3) Reichert, M., Weber, B.: Enabling Flexibility in Process-Aware Information Systems: Challenges, Methods, Technologies. Springer (2012)
- (4) Zugal, S., Pinggera, J., Weber, B.: The impact of testcases on the maintainability of declarative process models. In: Proc. BPMDS’11. (2011) 163–177
- (5) Pesic, M.: Constraint-Based Workflow Management Systems: Shifting Control to Users. PhD thesis, TU Eindhoven (2008)
- (6) Barba, I., Weber, B., Valle, C.D., Ramírez, A.J.: User Recommendations for the Optimized Execution of Business Processes. Data & Knowledge Engineering 86 (2013) 61–84
- (7) Haisjackl, C., Zugal, S., Soffer, P., Hadar, I., Reichert, M., Pinggera, J., Weber, B.: Making Sense of Declarative Process Models: Common Strategies and Typical Pitfalls. In: Proc. BPMDS’13. (2013) 2–17
- (8) Armstrong, D.J., Hardgrave, B.C.: Understanding Mindshift Learning: The Transition to Object-Oriented Development. MIS Quarterly 31 (2007) 453–474
- (9) Aalst, W., Pesic, M.: Decserflow: Towards a truly declarative service flow language. In: Proc. WS-FM’06. (2006) 1–23
- (10) Baddeley, A.: Working Memory: Theories, Models, and Controversies. Annual Review of Psychology 63 (2012) 1–29
- (11) Paas, F., Renkl, A., Sweller, J.: Cognitive Load Theory and Instructional Design: Recent Developments. Educational Psychologist 38 (2003) 1–4
- (12) Sweller, J.: Cognitive load during problem solving: Effects on learning. Cognitive Science 12 (1988) 257–285
- (13) Zugal, S., Pinggera, J., Reijers, H., Reichert, M., Weber, B.: Making the Case for Measuring Mental Effort. In: Proc. EESSMod’12. (2012) 37–42
- (14) Pinggera, J., Zugal, S., Weber, B.: Investigating the process of process modeling with cheetah experimental platform. In: Proc. ER-POIS’10. (2010) 13–18
- (15) Scaife, M., Rogers, Y.: External cognition: how do graphical representations work? International Journal on Human-Computer Studies 45 (1996) 185–213
- (16) Kalyuga, S., Ayres, P., Chandler, P., Sweller, J.: The Expertise Reversal Effect. Educational Psychologist 38 (2003) 23–31
- (17) Zugal, S., Pinggera, J., Weber, B.: Creating Declarative Process Models Using Test Driven Modeling Suite. In: Proc. CAiSE Forum’11. (2011) 16–32
- (18) Mendling, J., Strembeck, M., Recker, J.: Factors of process model comprehension—Findings from a series of experiments. Decision Support Systems 53 (2012) 195–206
- (19) Ottensooser, A., Fekete, A., Reijers, H.A., Mendling, J., Menictas, C.: Making sense of business process descriptions: An experimental comparison of graphical and textual notations. Journal of Systems and Software 85 (2012) 596–606
- (20) Whitley., K.: Visual programming languages and the empirical evidence for and against. J. Vis. Lang. Comput. 8 (1997) 109–142
- (21) Hildebrandt, T.T., Mukkamala, R.R.: Declarative Event-Based Workflow as Distributed Dynamic Condition Response Graphs. In: Proc. PLACES’10. (2010) 59–73