Sunrise Mission Highlights
Abstract:
Solar activity is controlled by the magnetic field, which also causes the variability of the solar irradiance that in turn is thought to influence the climate on Earth. The magnetic field manifests itself in the form of structures of different sizes, starting with sunspots (10-50 Mm) down to the smallest known magnetic features that often have spatial extents of 100 km or less. The study of the fine scale structure of the Sun’s magnetic field has been hampered by the limited spatial resolution of the available observations. This has recently changed thanks to new space and ground-based telescopes. A significant step forward has been taken by the Sunrise observatory, built around the largest solar telescope to leave the ground, and containing two science instruments. Sunrise had two successful long-duration science flights on a stratospheric balloon in June 2009 (solar activity minimum) and in June 2013 (at a high activity level) and a number of scientific results have been obtained that have greatly advanced our understanding of solar magnetism, with data analysis still ongoing. After a brief introduction to the Sunrise mission, an overview of a selection of these results will be given.
1 Introduction
In order to understand which processes control solar activity, we must know how the Sun’s magnetic field interacts with the solar plasma and how it influences the conversion of energy between its mechanical, magnetic, thermal, and radiative forms. In the photosphere the thermal, kinetic, and magnetic energy have the same order of magnitude, so that this layer of the solar atmosphere plays a key role because there the energy can easily be transformed from one form into another. This interaction is responsible for the creation of a variety of magnetic structures, starting with sunspots (10000-50000 km), pores (1000-5000 km), and micropores (300-1000 km) down to bright points (200 km or less), among the smallest known magnetic features.
Bright points (BPs) are brightness enhancements in the dark lanes separating solar granules. BPs are caused by magnetic flux concentrations in the kilogauss range and are important for, e.g., the analysis of the solar influence on the Earth’s climate. In the last 35 years, measurements of satellite-based instruments revealed that the solar constant (which is the solar irradiance integrated over all wavelengths) is not constant, but varies over an 11 year cycle by about 0.1 %. Surprisingly, the solar constant is on average higher during maximum solar activity than during minimum (Willson & Hudson 1988). The darkness of the sunspots is overcompensated by the increased brightness of BPs, whose number density is considerably higher around sunspots than in the quiet Sun (Fröhlich 2013; Solanki et al. 2013).
The magnitude of the variation of the solar irradiance is not uniformly distributed over the electromagnetic spectrum, but 60 % of the variations (Krivova et al. 2006) or even more (Harder et al. 2009) are produced at wavelengths shorter than 400 nm. A variation of the ultraviolet (UV) radiation changes the chemistry of the stratosphere which can propagate into the troposphere and hence influence the weather and climate on Earth (London 1994; Haigh et al. 2010; Ermolli et al. 2012). The most famous indication of a solar influence on the terrestrial climate is the so-called Maunder minimum, the period between 1645-1715 in which almost no sunspots were observed and which coincides with the coldest part of the little ice age in Europe and Northern America.
One possibility to gain time series of the photosphere in the UV spectral range with high spatial and temporal resolution is to fly a telescope in the gondola of a stratospheric balloon. Such balloon flights have a long tradition in solar physics, which was extended by the Sunrise mission described below (an overview of the mission is given by Solanki et al. 2010 and Barthol et al. 2011).
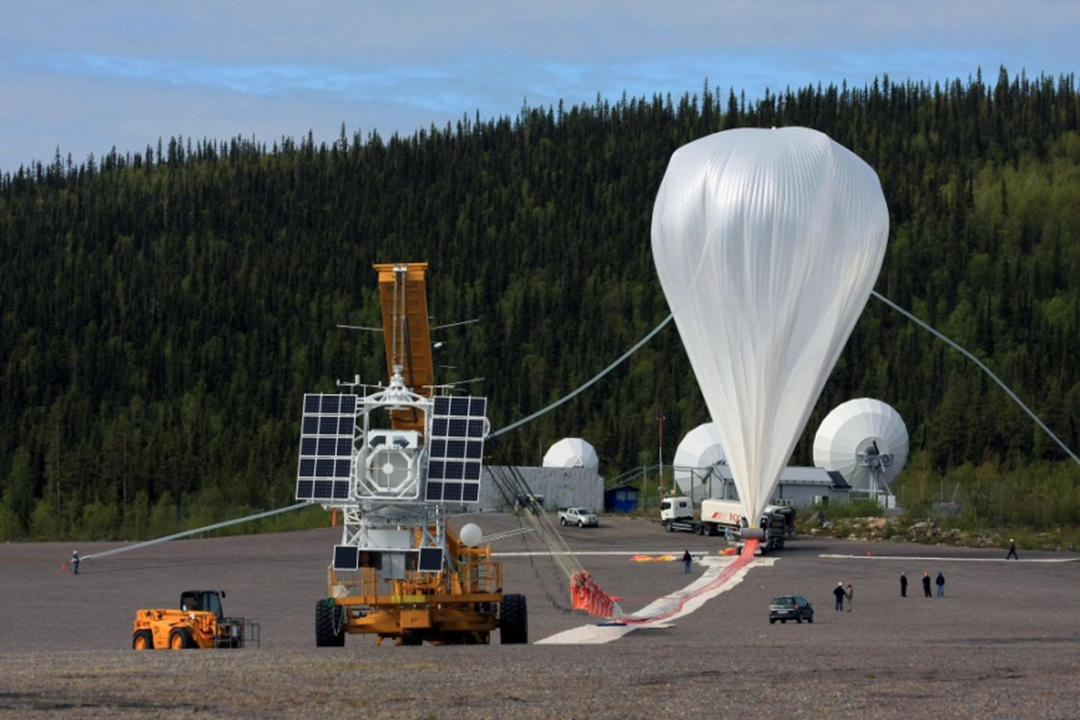
2 Mission and instrumentation
Sunrise is a balloon-borne solar observatory and consists of a 1 m aperture Gregory telescope, a UV filter imager, a vector magnetograph for the visible spectral range, and an image stabilization system. The 1 m primary mirror makes Sunrise the largest solar telescope so far to leave the ground. Up to now two science flights were carried out, the first one in June 2009 during minimum solar activity and a second one in June 2013 at a high activity level. The two flights began from Esrange near Kiruna in northern Sweden (see Figure 1). After a total flight time of about 6 days the gondola with the telescope landed safely on a parachute in northern Canada so that the science data (which were stored on an onboard disk array) could be recovered. The mean flight altitude of 37 km allowed observations in the UV and visible spectral range that were free of atmospheric disturbances. Details about the telescope, the gondola’s pointing system, and the telemetry system can be found in Barthol et al. (2011). Berkefeld et al. (2011) describe the correlation tracker and the six-element Shack-Hartmann wavefront sensor that controlled the telescope’s focus mechanism and the tip/tilt mirror used for image stabilization, while Gandorfer et al. (2011) detail the light distribution unit.
2.1 SuFI
The Sunrise Filter Imager (SuFI) is a phase-diversity assisted broadband imager for the near UV and violet spectral range. SuFI samples the solar photosphere and chromosphere in five different wavelength ranges between 200 nm and 400 nm. The theoretical diffraction limit is 005, corresponding to 40 km on the solar surface. The phase-diversity prism in front of the UV-enhanced CCD delivers a nominally focused image on one half of the detector, while the other half receives an image with a defocus of one wave. In the post-processing, the two half images can be used for a removal of low-order aberrations. The effective field of view (FOV) is . The cadence of SuFI is up to one image per second, depending on the exposure time and the observation mode. Detailed information on SuFI can be found in Gandorfer et al. (2011).
2.2 IMaX
The Imaging Magnetograph eXperiment (IMaX) is an imaging spectropolarimeter in dual-beam configuration that scans the highly Zeeman-sensitive Fe i line at 525.02 nm. The cadence of IMaX is typically about 30 s, the spectral resolution is 85 mÅ, and the FOV is . Several operating modes are available. Most frequently used are a) the V5/6 mode in which the full Stokes vector is measured at five wavelength positions (four within the spectral line and one in the continuum) with six accumulations to increase the signal-to-noise ratio to about in the continuum and b) the longitudinal L12/2 mode in which only Stokes and are measured at twelve wavelength positions with two accumulations. Phase-diversity information can also be obtained since a plate can be inserted into the light path of one of the two synchronized cameras. A full description of IMaX is provided by Martínez Pillet et al. (2011).
3 Highlight results
From the more than 40 refereed publications on science results obtained by the analysis of Sunrise data, a brief overview of a selection of these results will be given in this section.
3.1 Kilogauss fields resolved
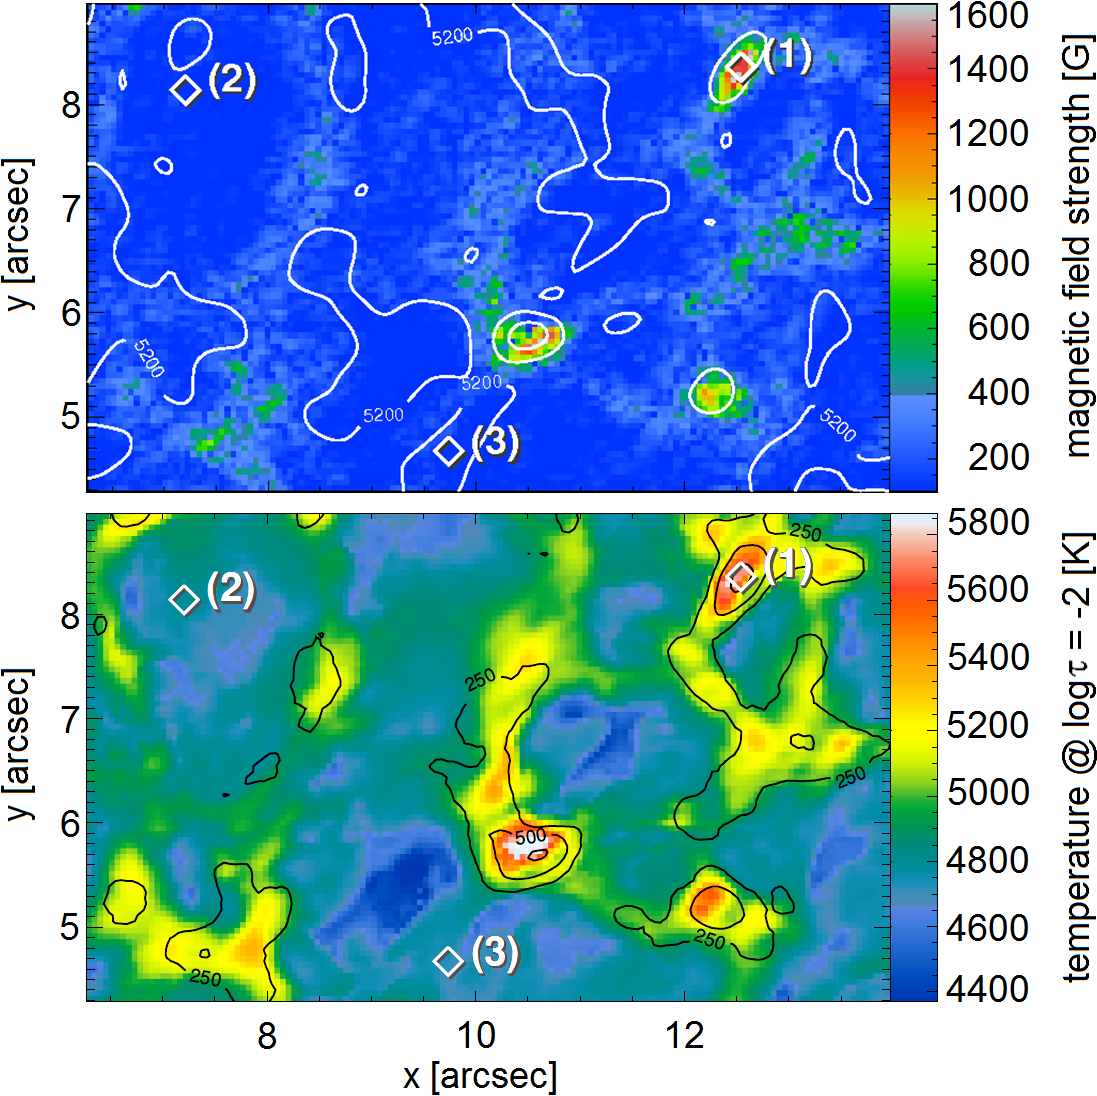
Lagg et al. (2010) analyzed IMaX V5/6 data obtained from a quiet-Sun region at disk center. Stokes maps displayed isolated flux patches. The observed Stokes spectra were inverted with the SPINOR code (Frutiger et al. 2000) that numerically solved the radiative transfer equation. A simple one-component model atmosphere with a height-dependent temperature and a height-independent magnetic field vector and line-of-sight velocity was used. The retrieved magnetic field strength in the isolated flux patches is up to 1.5 kG, while it is weak outside the patches (top panel of Figure 2). The flux patches’ temperature in the mid photosphere is significantly enhanced with respect to its surroundings (bottom panel of Figure 2), which is consistent with semi-empirical flux-tube models. Since the kilogauss fields in the magnetic elements were retrieved without the introduction of a magnetic filling factor we conclude that Sunrise could finally resolve the observed quiet-Sun flux tubes.
3.2 Internal magnetic structure of a network element
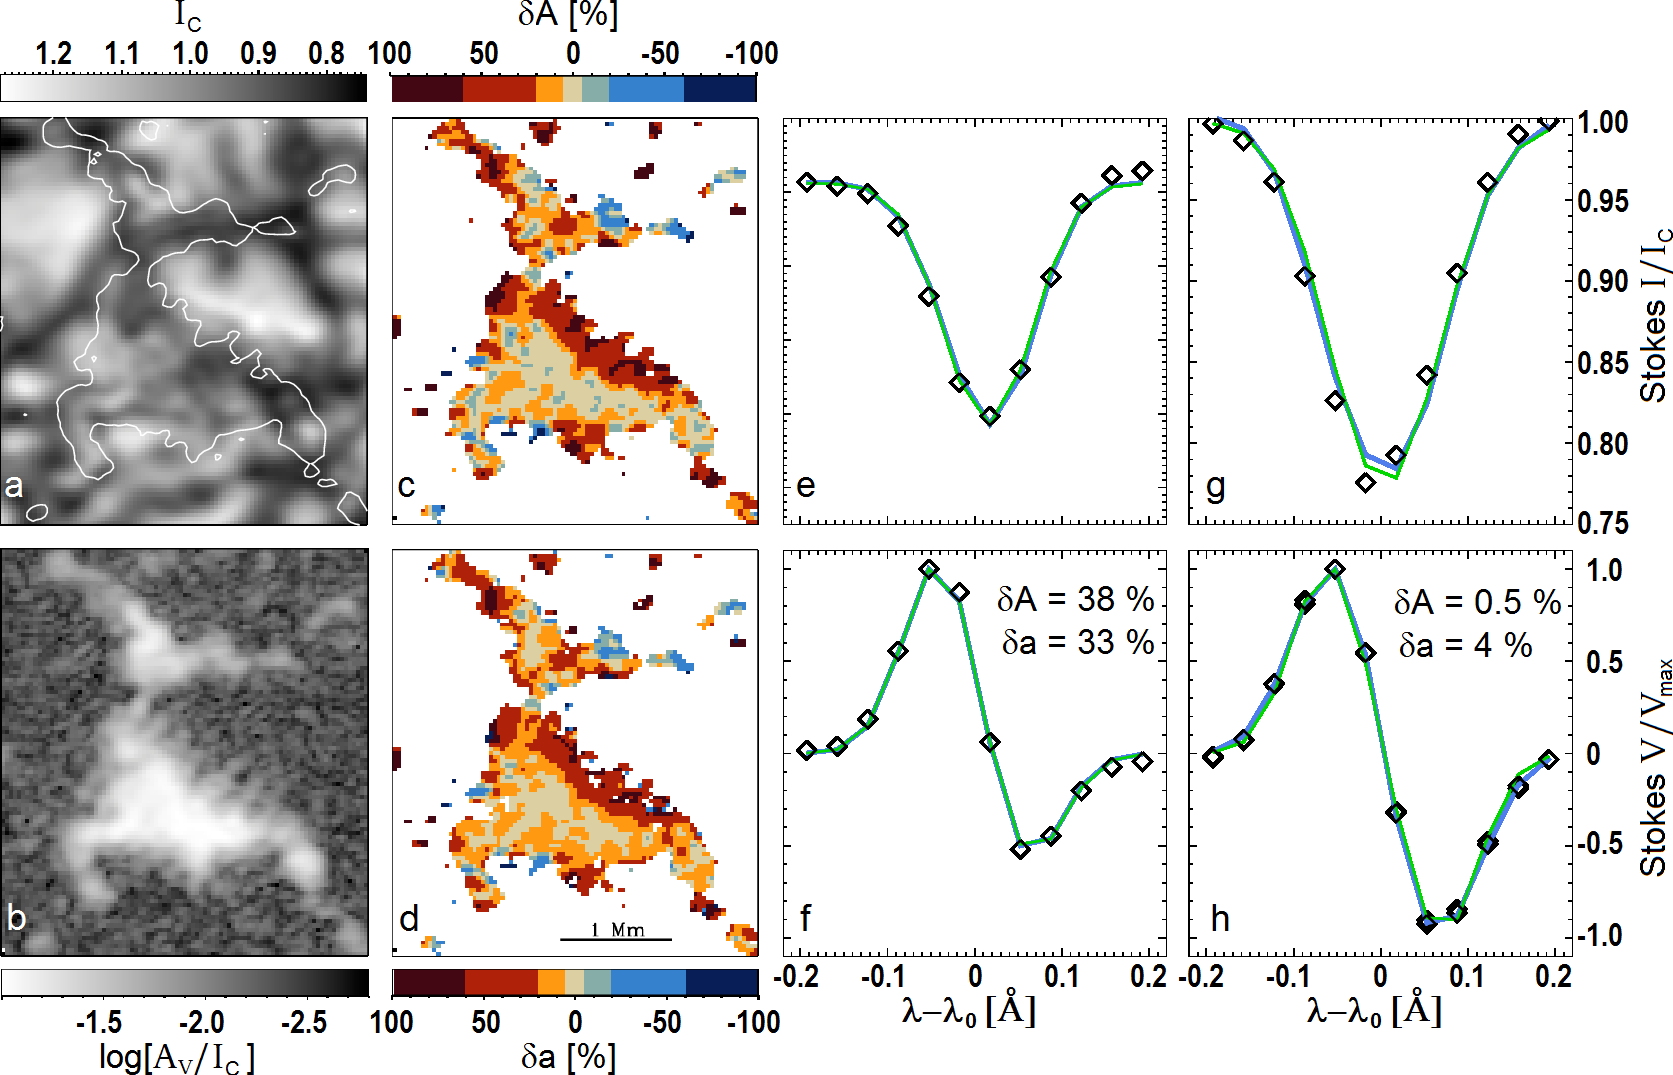
An investigation of the Stokes asymmetries retrieved from IMaX L12/2 data showed that even the internal magnetic structure of a quiet-Sun network element could be resolved with Sunrise (Martínez González et al. 2012). Both the amplitude and area asymmetry of the Stokes profiles increase from very low values at the core of the network element to values close to unity at its periphery (see Figure 3). An asymmetry between the blue and red lobe of Stokes profiles is caused by a gradient in magnetic field and velocity along the line of sight (LOS). The results of Martínez González et al. (2012) are consistent with an expanding magnetic canopy, i.e. a region where the LOS passes through the magnetized atmosphere of the expanding flux tube in the upper photosphere, then hits the nearly field-free atmosphere below the canopy before penetrating the surface and entering the convection zone.
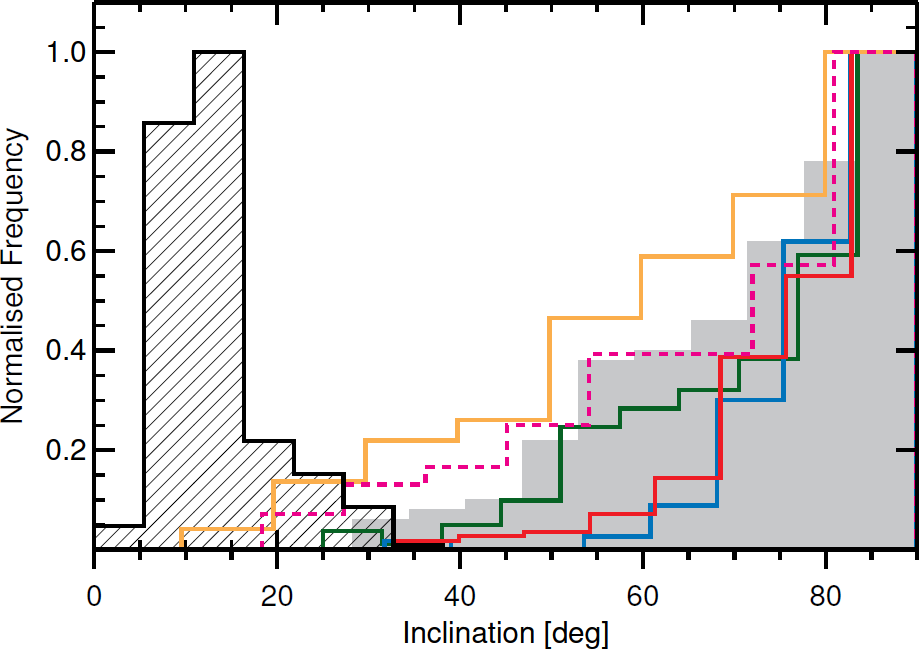
3.3 Inclinations of quiet-Sun magnetic elements
The positions of a set of bright magnetic elements were determined by Jafarzadeh et al. (2014) from Sunrise images recorded in different spectral bands. An estimate of the formation height of these spectral bands provided the inclinations of the magnetic elements from a direct geometrical method. This method returned that the magnetic field in BPs is nearly vertically oriented with a narrow distribution. In contrast, the traditionally used inversions of Stokes profiles provided an almost horizontal field for the same set of magnetic elements (see Figure 4). Since the linear polarization signals in Stokes and are adversely affected by noise, the inversions overestimate the horizontal flux of such magnetic features by an order of magnitude. The almost vertical orientations of the magnetic field in BPs were confirmed by a study of Riethmüller et al. (2014), who compared BP properties between Sunrise observations and magnetohydrodynamical simulations after they were carefully degraded to take into account all the instrumental effects that were present during the observations (spatial and spectral resolution, stray light, noise).
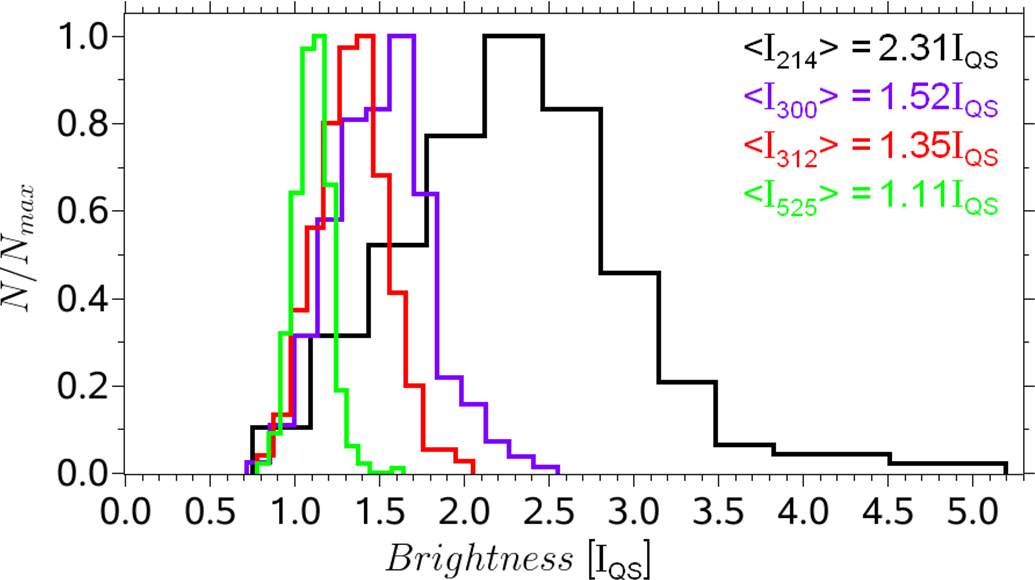
3.4 Bright point contrasts in the ultraviolet
The UV capabilities of Sunrise allowed for the first time high-resolution observations of BPs in this important spectral range. Riethmüller et al. (2010) analyzed quiet-Sun data at disk center and determined BP intensity contrasts that are considerable higher than the rms granulation contrast at all wavelengths observed by SuFI. In particular at 214 nm, BPs are up to 5 times brighter than the mean quiet-Sun, making them brighter than at any other spectral range studied so far (see Figure 5). The high BP contrasts and broad contrast distributions at short wavelengths confirm the assumption that BPs are important for irradiance variations in the UV and hence for a possible solar influence on the climate on Earth.
3.5 First high-resolution images of the Sun in the nm Mg ii k line
First analyses of data from the second Sunrise flight were carried out by Riethmüller et al. (2013) and by Danilovic et al. (2014). The first high-resolution images of quiet Sun, active region plage, and sunspots in the Mg ii k nm line were presented and compared with images recorded in the core of the Ca ii H line. The Mg ii k images show qualitatively very similar structures to those in Ca ii H. In internetwork regions of the quiet Sun the Mg ii k images display reversed granulation or shock waves, while fibril structures are found in plage regions. The Mg filtergrams display higher intensity contrasts and appear more smeared and smoothed in the quiet Sun than in the Ca channel. Both the Mg ii k and the Ca ii H line sample heights in the chromosphere that are important to understand the heat transport from the photosphere to the corona.
4 Conclusion
Stratospheric balloon flights with the Sunrise observatory have provided high-quality UV and spectropolarimetric images with high spatial and temporal resolution at different positions on the solar disk. The above examples have been listed to demonstrate the wide variety of studies carried out with Sunrise data. The low solar activity level at the time of the first science flight means that mainly insights into the quiet Sun could be retrieved from these data. Since the data analysis is still ongoing, in particular for the data of the second science flight at a much higher activity level, many more results are to be expected, e.g., on oscillations along Ca ii H fibrils, on the relation between the magnetic flux density and intensity in the UV, on siphon flows in granule-size, twisted magnetic loops, or on the power spectra of photospheric flows. A third flight of the Sunrise observatory is targeted for 2019 with fully renewed versions of SuFI and IMaX in addition to a third scientific instrument, a slit spectrograph for scanning a photospheric and a chromospheric spectral line. This combination of three instruments allows observations of the 3D structure of the magnetic field which is essential to answer the underlying physical questions.
References
- [1] Barthol, P., Gandorfer, A., Solanki, S. K., Schüssler, M., Chares, B., et al. 2011, Solar Phys., 268, 1
- [2] Berkefeld, T., Schmidt, W., Soltau, D., Bell, A., Doerr, H. P., et al. 2011, Solar Phys., 268, 103
- [3] Danilovic, S., Hirzberger, J., Riethmüller, T. L., Solanki, S. K., Barthol, P. , et al. 2014, ApJ, 784, 20
- [4] Ermolli, I., Matthes, K., Dudok de Wit, T., Krivova, N. A., Tourpali, K., et al. 2012, Atmos. Chem. Phys. Discuss., 12, 24557
- [5] Fröhlich, C. 2013, Space Sci. Rev., 176, 237
- [6] Frutiger, C., Solanki, S. K., Fligge, M., & Bruls, J. H. M. J. 2000, A&A, 358, 1109
- [7] Gandorfer, A., Grauf, B., Barthol, P., Riethmüller, T. L., Solanki, S. K., et al. 2011, Sol. Phys., 268, 35
- [8] Harder, J. W., Fontenla, J. M., Pilewskie, P., Richard, E. C., & Woods, T. N. 2009, Geophys. Res. Lett., 36, 7801
- [9] Haigh, J. D., Winning, A. R., Toumi, R., & Harder, J. W. 2010, Nature, 467, 696
- [10] Jafarzadeh, S., Solanki, S. K., Lagg, A., Bellot Rubio, L. R., van Noort, M., Feller, A., & Danilovic, S. 2014, A&A, 569, A105
- [11] Krivova, N. A., Solanki, S. K., & Floyd, L. 2006, A&A, 452, 631
- [12] Lagg, A., Solanki, S. K., Riethmüller, T. L., Martínez Pillet, V., Schüssler, M., et al. 2010, ApJ, 723, L164
- [13] London, J. 1994, Adv. Space Res., 14, 33
- [14] Martínez González, V., Bellot Rubio, L. R., Solanki, S. K., & Martínez Pillet, V. 2012, ApJ, 758, L40
- [15] Martínez Pillet, V., del Toro Iniesta, J. C., Álvarez-Herrero, A., Domingo, V., Bonet, J. A., et al. 2011, Solar Phys., 268, 57
- [16] Riethmüller, T. L., Solanki, S. K., Berdyugina, S. V., Schüssler, M., Martínez Pillet, V., Feller, A., Gandorfer, A., & Hirzberger, J. 2014, A&A, 568, A13
- [17] Riethmüller, T. L., Solanki, S. K., Hirzberger, J., Danilovic, S., Barthol, P. , et al. 2013, ApJ, 776, L13
- [18] Riethmüller, T. L., Solanki, S. K., Martínez Pillet, V., Hirzberger, J., Feller, A., et al. 2010, ApJ, 723, L169
- [19] Solanki, S. K., Barthol, P., Danilovic, S., Feller, A., Gandorfer, A., et al. 2010, ApJ, 723, L127
- [20] Solanki, S. K., Krivova, N. A., & Haigh, J. D. 2013, Ann. Rev. A&A, 51, 311
- [21] Willson, R. C., & Hudson, H. S. 1988, Nature, 332, 810