Spectroscopic variability of IRAS 22272+5435
Abstract
A time series of high-resolution spectra was observed in the optical wavelength region for the bright proto-planetary nebula IRAS 22272+5435 (HD 235858), along with a simultaneous monitoring of its radial velocity and magnitudes. The object is known to vary in light, color, and velocity due to pulsation with a period of 132 days. The light and color variations are accompanied by significant changes in spectral features, most of which are identified as lines of carbon-bearing molecules. According to the observations, the Swan system and CN Red system lines are stronger near the light minimum. A photospheric spectrum of the central star was calculated using new self-consistent atmospheric models. The observed intensity variations in the Swan system and CN Red system lines were found to be much larger than expected if due solely to the temperature variation in the atmosphere of the pulsating star. In addition, the molecular lines are blueshifted relative to the photospheric velocity. The site of formation of the strong molecular features appears to be a cool outflow triggered by the pulsation. The variability in atomic lines seems to be mostly due variations of the effective temperature during the pulsation cycle. The profiles of strong atomic lines are split, and some of them are variable in a time scale of a week or so, probably because of shock waves in the outer atmosphere.
1 Introduction
The proto-planetary nebula (PPN) phase is an important but still poorly understood stage in the evolution of low- and intermediate-mass stars. Objects in this stage are in transition between the asymptotic giant branch (AGB) and planetary nebula (PN) phases. A PPN is characterized by a central star of intermediate temperature (5,000 – 30,000 K) and low surface gravity surrounded by an expanding circumstellar envelope (CSE) of molecular gas and cool dust (Kwok, 1993).
IRAS 22272+5435 is a well known PPN associated in the optical region with the bright, carbon-rich peculiar supergiant HD 235858 of spectral type G5 (Hrivnak & Kwok, 1991). The star is surrounded by the detached CSE, a result of earlier AGB mass loss. The morphology of IRAS 22272+5435 has been studied at various wavelengths. Mid-IR images at arcsecond and subarcsecond resolutions show an elongated emission core that is interpreted as a result of an inclined dust torus or disk (Meixner et al., 1997; Dayal et al., 1998; Ueta et al., 2001). High-resolution optical images obtained by the Hubble Space Telescope (HST) revealed a reflection nebulosity that is elongated approximately perpendicular to the core elongation seen at the mid-IR images (Ueta et al., 2000). Ueta et al. (2001) carried out a dust radiative transfer model analysis of IRAS 22272+5435, and their best-fit model consists of a central star surrounded by two separate sets of dust shells representing an AGB wind shell and a post-AGB wind shell located in the inner cavity of the PPN shell. They concluded that IRAS 22272+5435 left the AGB about 380 yr ago, after the termination of the superwind, and then experienced post-AGB mass loss with a sudden mass ejection about 10 years ago. Near-IR observations support post-AGB mass ejection for IRAS 22272+5435 (Hrivnak et al., 1994). Nakashima et al. (2012) modeled the mapping of CO emission in the CO (2-1) line by an expanding torus of a constant radial expansion velocity of 7.5 , with an inner/outer radius of 0.4/1.0″, and an expanding sphere representing the AGB wind with an outer radius of 2.5″and a maximum expanding velocity of 10.5 . Their observations revealed an additional axisymmetric region possibly created by the interaction between an invisible jet and the ambient material.
IRAS 22272+5435 is one of the coolest known PPNe and possesses an excess of carbon and sprocess elements in the atmosphere, synthesized during evolution on the AGB (Hrivnak & Kwok, 1991; Začs et al., 1995, 1999; Reddy et al., 2002). Complex light variations are observed for IRAS 22272+5435 (V354 Lac), with a maximum amplitude of 0.5 mag (V) and evidence of multiple periods that modulate the light curve (Hrivnak et al., 2013). The dominant period of about 132 days attributed to pulsations was found both in the light, color, and radial velocity curves. Despite the enhanced carbon abundance in the atmosphere of IRAS 22272+5435, molecular lines should be negligible in the stellar spectrum for a G5 I star. However, Hrivnak & Kwok (1991) detected prominent absorption features of and molecule at 4737, 5165, and 4050 Å using low-resolution spectra. (Začs et al., 1995) confirmed the presence of the strong Swan system (0,0) bandhead at the photospheric velocity using a high-resolution spectrum observed on August 1992. Information about the site of formation of molecular lines is scarce in the published papers. Not clear whether the peculiar spectrum of IRAS 22272+5435 in comparison with that for a typical G5 supergiant is because of the atmospheric or circumstellar anomalies. Bakker et al. (1997) observed a few high-resolution spectra between 25 July and 24 August 1994 in the wavelength region from about 4 000 to 10 000 Å and they detected absorption lines of the (0,0), (1,0) Swan system, the (1,0), (2,0), (3,0) Phillips system, and the CN (1,0), (2,0), (3,0), (4,0) Red system. Most of them were identified to be of circumstellar origin, with a full width at half maximum (FWHM) of 6.0 and a blueshift between 8.7 to 9.1 relative to the adopted systemic velocity, = -43.1 . The line forming region of these sharp molecular lines was attributed to the AGB ejecta (Bakker et al., 1997). In addition - CN Red system lines of the photospheric origin were found; these lines are much broader and belong to higher energy levels. Reddy et al. (2002) detected the (2,0) Phillips system circumstellar lines around 8770 Å using a high-resolution spectrum observed on 2000 June 14. The expansion velocity of the line forming region was measured, with 0.3 km relative to the adopted systemic velocity = -41.0 . However, Reddy et al. (2002) did not find CN and lines of the photospheric origin in the spectrum and concluded that IRAS 22272+5435 is too warm to show photospheric molecular features. The absence of carbon bearing molecular lines of the photospheric origin in the spectrum observed by Reddy et al. (2002) in comparison with the spectrum investigated by Bakker et al. (1997) was not discussed. Moreover, Reddy et al. (2002) concluded that they detected circumstellar molecular lines in the spectrum of IRAS 22272+5435 for the first time. Začs et al. (2009) identified sharp Phillips system and CN Red system lines of circumstellar origin in four high-resolution spectra observed between November 2002 and February 2008. The expansion velocity of line forming region was measured using Phillips system lines as 0.5 , relative to the adopted systemic velocity of = -40.2 . Broad and variable lines of (0,1) Swan system and CN (5,1) Red system lines were observed simultaneously in the spectra, but blueshifted relative to the systemic velocity by about 10–25 . The site of formation for these broad molecular lines was hypothesized to be a cool outflow. Schmidt et al. (2013) compared the expansion velocity measured using the Phillips system lines in the spectrum observed on November 2002 by Začs et al. (2009) with those observed by Bakker et al. (1997) and found a difference of about 3 . A comparison of equivalent widths for selected circumstellar lines of Phillips system revealed differences of up to 50 % between the two spectra. The reasons for such large discrepancies in the measurements are difficult to explain by uncertainties in the analysis of these spectra.
This paper presents the results of an analysis of the time series of high-resolution spectra for IRAS 22272+5435 in the optical region. In total, 17 spectra were observed between November 2002 and November 2011, simultaneously with light and radial velocity monitoring. The character of the spectroscopic variability is described. Synthetic spectra calculated with new self-consistent hydrostatic atmospheric models were fitted in selected wavelength regions to the spectra observed during light maximum and minimum to investigate the reason for the spectroscopic variability.
2 Observations and reduction
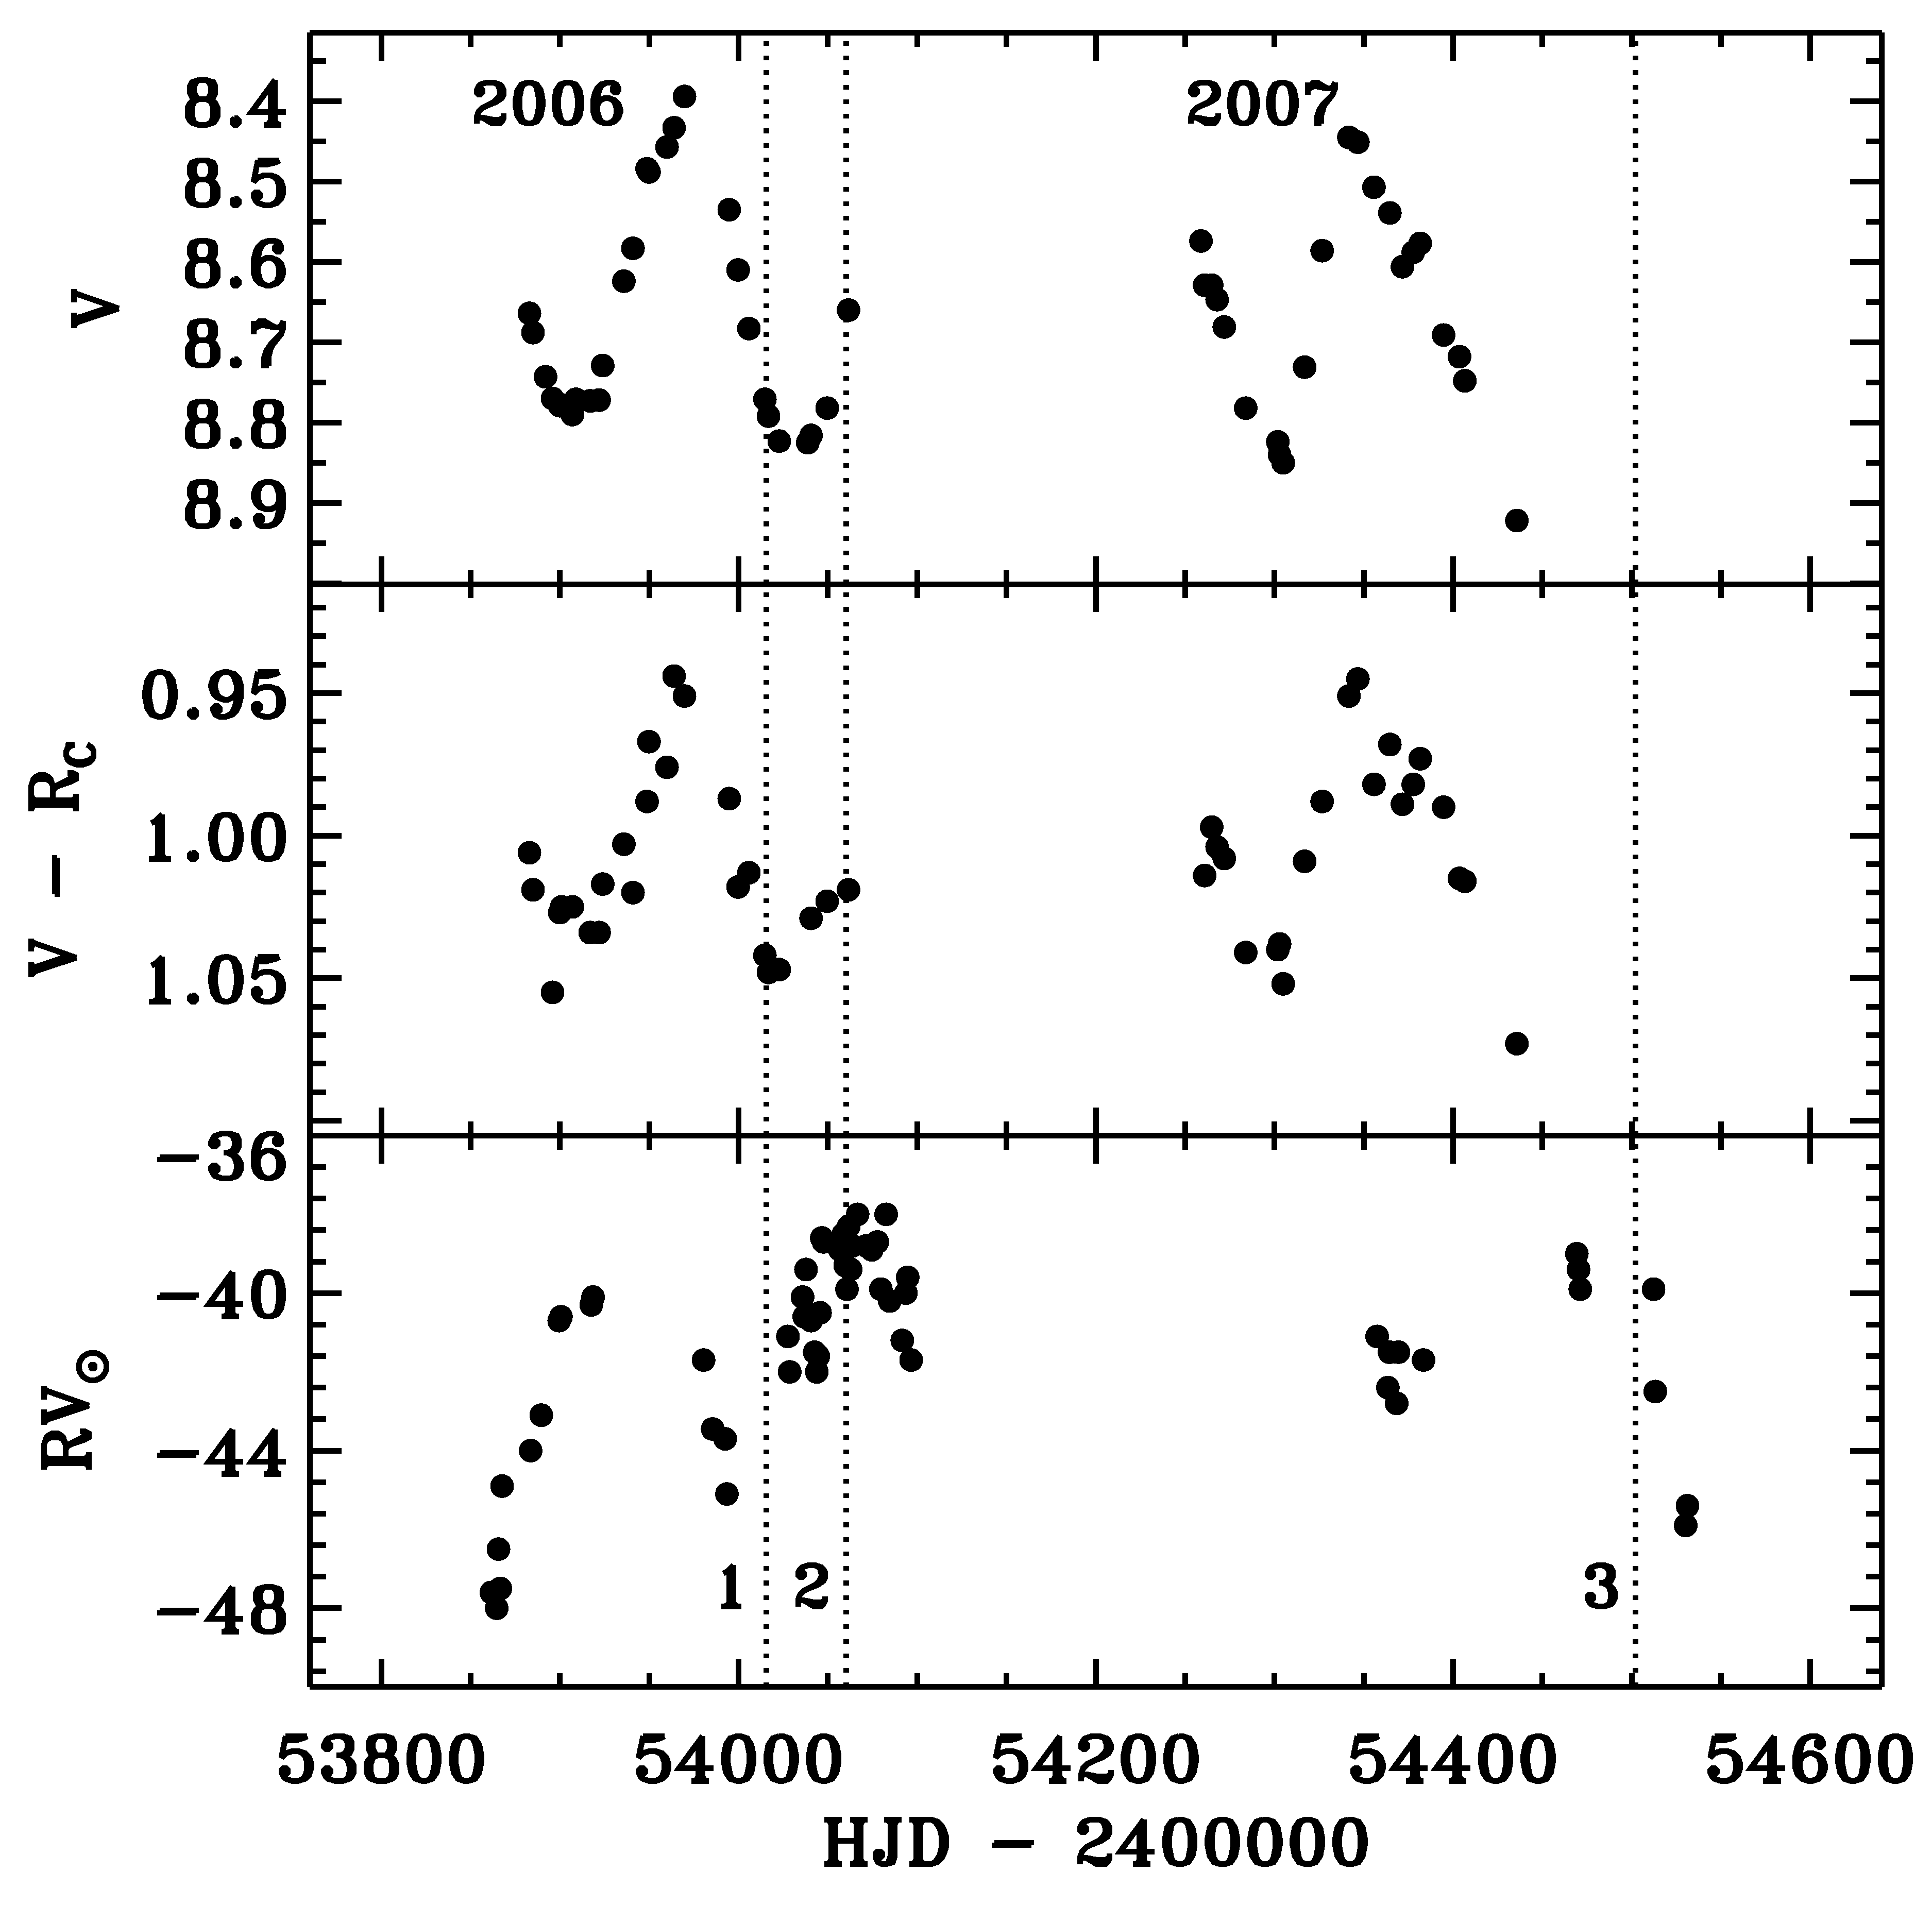
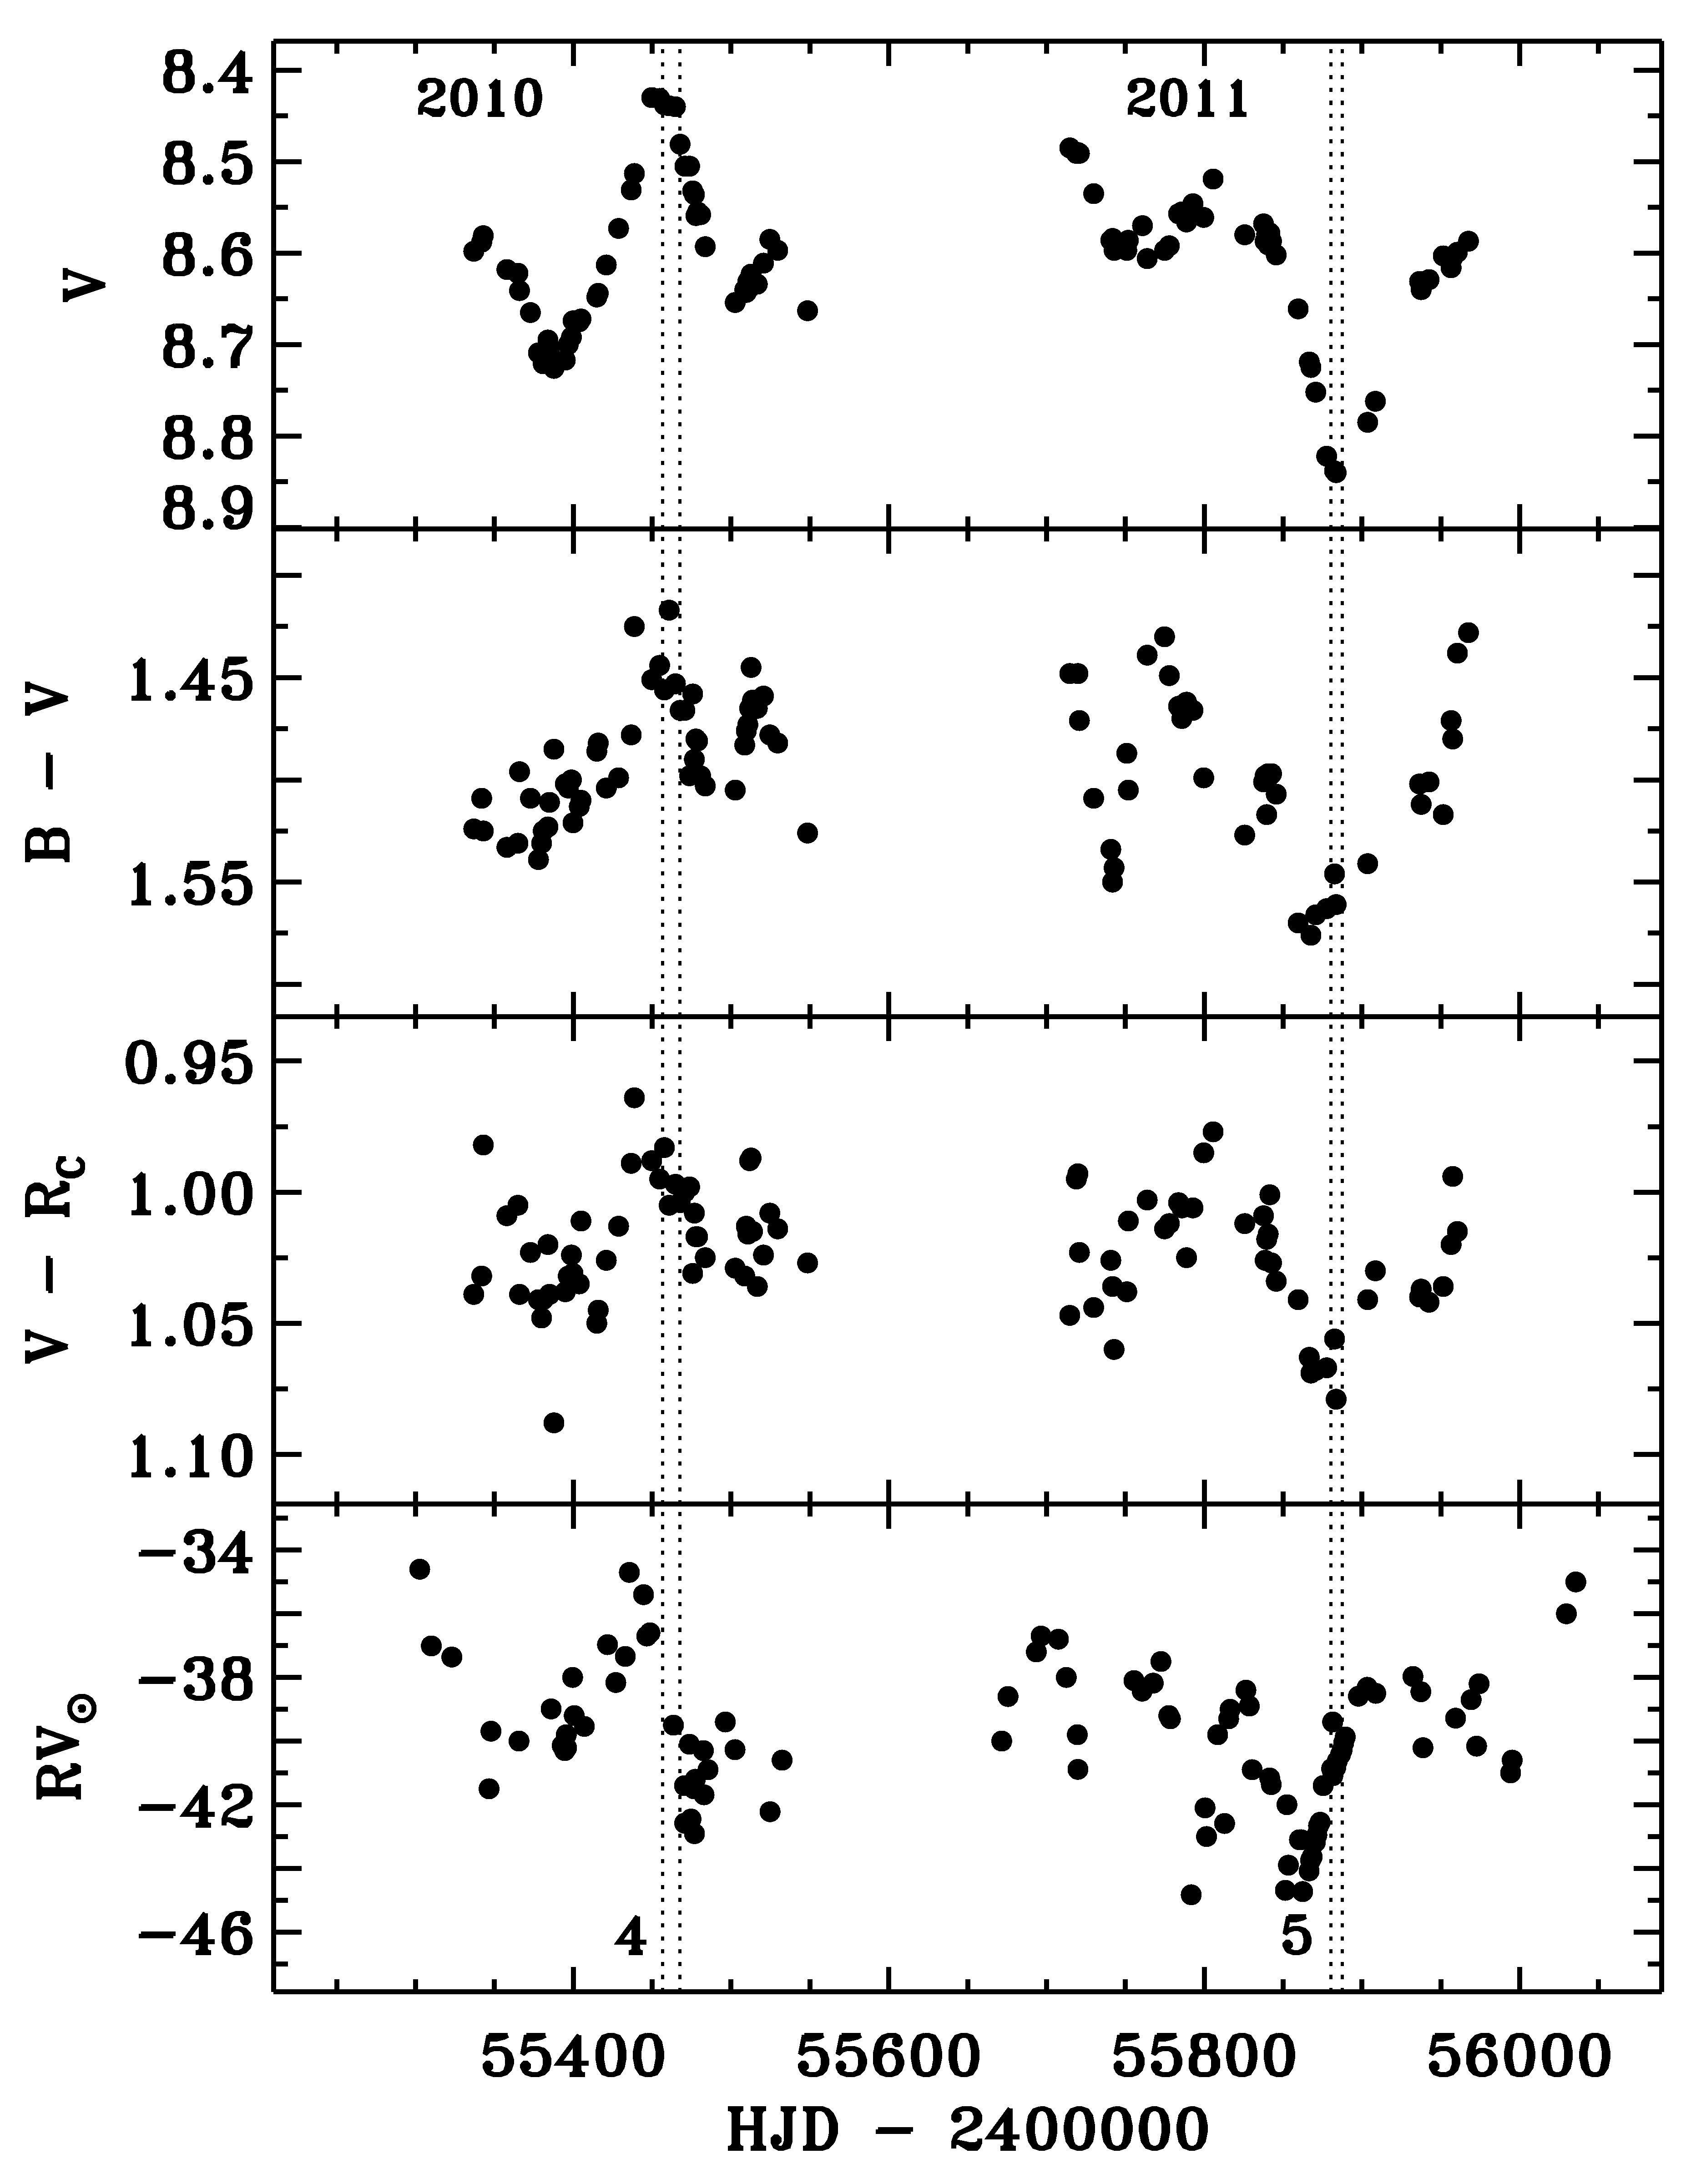
High-resolution spectra of IRAS 22272+5435 were observed with the coudé échelle spectrometer MAESTRO on the 2 m telescope at the Observatory on the Terskol Peak in Northern Caucasus (altitude of 3100 m), equipped with a Wright Instruments CCD detector. Four spectra were initially obtained between 2002 November and 2008 February with the total exposures from 4800 to 7200 s. In addition, two more extensive sets of observations were performed on September 2010 and November 2011; 7 and 6 high-resolution spectra were observed in the time span of 12 and 8 days, respectively. The spectra cover a wavelength region from about 4000 to 9700 Å, overlapping blueward of , and have a resolution R 45 000. The S/N ratios are of the order of 100 near the Na I D doublet. All the spectra were bias subtracted, flat-field corrected, and converted to one-dimensional spectra using the standard DECH20T package.111http://www.gazinur.com/Spectra-Processing.html The wavelength calibration was made using ThAr and sky spectra obtained for each night. In addition, a spectrum of a hot and rapidly rotating star was observed to identify the telluric absorption lines. Details of the spectroscopic observations are included in Table 1. The phases were calculated using the 132 days period where phase 0.0 is defined by the time of the nearest light minimum. The epochs of the high-resolution observations relative to the light, color, and radial velocity curves published by Hrivnak et al. (2013) are shown in Figure 1.
The equivalent widths (EW) of the absorption lines were measured by Gaussian fitting to the observed profiles. The radial velocities were estimated using the standard DECH20T routine: a direct and mirror profile of each selected line was correlated and the shift of the central wavelength from its rest wavelength was measured. For a sample of measured lines, the mean radial velocity and its standard deviation was calculated to characterize the random error. The heliocentric corrections were calculated using the standard DECH20T routine. We adopted the systemic heliocentric velocity = -40.8 calculated on the basis of radial velocity data collected for IRAS 22272+5435 in the time span from 1988 to 2011 (Hrivnak et al., 2013), which is close to the systemic velocity measured using CO emission lines of the CSE, = -40.2 (Hrivnak & Bieging, 2005). The systematic errors of the radial velocity measurements were examined by measurements of wavelengths for telluric lines identified in the stellar spectra. A typical standard deviation for a sample of measured weak and medium strong symmetrical lines is about 0.5 and the systematic errors are below 1.0 . The measured instrumental photospheric radial velocities, heliocentric corrections, heliocentric photospheric radial velocities, and instrumental systemic radial velocities are given in Table 2.
| Time | HJD | Exp | PhaseaaPhase based on P = 132 days, where phase = 0.0 is defined by
the time of nearest light minimum. |
|---|---|---|---|
| dd/mm/yy | (-2450000) | (min) | |
| 18.11.2002 | 2597.3 | 120 | 0.5bbPhase based on the interpolation/extrapolation of the light
curve by a sine wave with P = 132 days. |
| 6.10.2006 | 4015.4 | 90 | 0.9 |
| 20.11.2006 | 4060.3 | 80 | 0.2 |
| 5.02.2008 | 4502.2 | 120 | 0.5bbPhase based on the interpolation/extrapolation of the light
curve by a sine wave with P = 132 days. |
| 17.09.2010 | 5456.5 | 90 | 0.5 |
| 20.09.2010 | 5459.5 | 90 | 0.5 |
| 21.09.2010 | 5460.5 | 120 | 0.5 |
| 22.09.2010 | 5461.5 | 90 | 0.5 |
| 25.09.2010 | 5464.5 | 90 | 0.5 |
| 27.09.2010 | 5466.5 | 90 | 0.5 |
| 28.09.2010 | 5467.5 | 120 | 0.5 |
| 14.11.2011 | 5880.4 | 90 | 0.0 |
| 15.11.2011 | 5881.3 | 90 | 0.0 |
| 18.11.2011 | 5884.3 | 90 | 0.0 |
| 19.11.2011 | 5885.4 | 90 | 0.0 |
| 20.11.2011 | 5886.3 | 120 | 0.0 |
| 21.11.2011 | 5887.4 | 120 | 0.0 |
| Time | RV | |||
|---|---|---|---|---|
| (km s-1) | ||||
| 18.11.02 | -33.1 | -11.54 | -44.6 | -29.3 |
| 6.10.06 | -42.5 | -0.57 | -43.1 | -40.2 |
| 20.11.06 | -25.1 | -11.99 | -37.1 | -28.8 |
| 5.02.08 | -25.7 | -14.04 | -39.7 | -26.8 |
| 22.09.10 | -45.8 | +3.47 | -43.1 | -44.3 |
| 18.11.11 | -28.6 | -11.53 | -40.1 | -29.3 |
3 Analysis and modeling
3.1 Description and comparison of the spectra
The optical spectrum of IRAS 22272+5435 is more complicated than is generally seen in stars of approximately solar temperature. A number of lines of heavy elements from weak transitions are visible which are due to the strong enhancement of neutron-capture elements, and these s-process lines are significantly blended with the lines of another species throughout the spectrum. In addition, a numerous weak and sharp and CN lines are present in the spectrum originated probably in the AGB shell. Moreover, broader in comparison with the shell lines and variable features of carbon bearing molecules are visible in some of the observed spectra (see Figures 2 and 3). We inspected a number of lines from the blue to near-infrared wavelength region and concluded that most of the absorption features are variable in a timescale of a month to a few years. A smaller number of spectral features seem to be variable in a timescale of a week. A correlation of the intensity of the bandheads with the phase of the light variation is clearly visible in the spectra - the Swan system bandheads are weak near light maximums (e.g. on September 2010 and February 2008) and strong near light minimums (e.g. on November 2011 and October 2006). A shift of wavelengths is clearly seen for the bandheads relative to the photospheric radial velocity, the later of which was measured on the basis of weak and symmetrical atomic lines. The intensity variation of CN Red system lines in general follows the intensity variation of Swan system lines (see Figure 3). In addition, the CN (5,1) Red system lines seem display weak emission near the observed light maximums. The profiles of strong atomic lines are broad and split into two or three components that are partly resolved at this resolution (Figure 4). Comparison of seven spectra observed during the set of observations on September 2010 revealed only minor spectroscopic variability, which is seen only in some strong lines (see Section 3.4). Therefore, we combined these spectra, observed in a time span of 12 days, with the goal of increasing the S/N ratio (especially in blue wavelength region). A similar procedure was performed for the six spectra gathered during the set of observations on November 2011. According to the photometry (see Figure 1), IRAS 22272+5435 is at its light maximum on September 2010 and at its light minimum on November 2011. A quantitative analysis of the spectroscopic variability was performed using the combined spectra observed at these two light extrema.
3.2 Atmospheric parameters and abundances
The value of effective temperature for the central star of IRAS 22272+5435 was determined from the constraint that the relation between iron abundances (from individual Fe I lines) and the excitation potential have a zero slope, resulting in = 5600 250 K (Začs et al., 1995). Reddy et al. (2002), using the same method, obtained a similar value within the uncertainty of = 5750 K. The best-fit model of spectral energy distribution (SED) for IRAS 22272+5435 gives 5800 K for the central star (Ueta et al., 2001). The interstellar extinction was found to be = 2.5 mag for this best-fit model, which is larger than the observed value along the line of sight towards IRAS 22272+5435 for the adopted distance of 1.6 kpc (Neckel & Klare, 1980). The determination of the effective temperature on the basis of color indices entails many complicated problems for the post-AGB stars. Chemical peculiarity and the presence of dust are responsible for the continuum depression in the blue and excess in the infrared wavelength regions, both affecting the observed colors. The central star of IRAS 22272+5435 is a pulsating star with time-varying color indices. This pulsation leads to temperature variation in the photosphere of the star where most of the absorption lines are formed. Thus these changes of during the pulsation cycle should contribute to the observed spectroscopic variability. A crude estimation of the temperature variation for the central star was performed using the color index , which is less affected by the continuum anomalies than is . A maximal variation of the color temperature was estimated using the observed at the light maximum on September 2010 and that at the light minimum on November 2011, when two sets of high-resolution spectroscopic observations were gathered. Assuming a color temperature relationship for IRAS 22272+5435 similar to that for a typical supergiant, the color variation of 0.12 mag translates into the temperature variation of about 500 K for the star with = 5750 K (Johnson, 1966). Bearing in mind the published values of effective temperature for IRAS 22272+5435 and the probable temperature variation in the atmosphere due to pulsation, two final temperatures were adopted for the modeling of spectrum for the central star, = 5750 and 5250 (the hotter and cooler atmospheric models, respectively).
The surface gravity was adopted to be = 0.5 (cgs) for the final models, which is a typical value for the cool post-AGB stars (Pereira et al., 2012) and agrees well with the gravity determined for IRAS 22272+5435 using a ionization balance for iron. In addition, we examined some atmospheric models with lower and the gravity in a range from = 0.0 to 1.5 (cgs). According to Pereira et al. (2012), = 0.5 and 0.2 (cgs) on average for post-AGB stars with the = 5750 and 5250 , respectively (see Figure 2 in the cited paper). The microturbulent velocity was adopted to be = 4.5 km s-1, which is close to the mean published value (Začs et al., 1995, 1999; Reddy et al., 2002) found by forcing the calculated abundances from individual iron lines to be independent of the equivalent widths. Začs et al. (1999) found evidence that the value of the estimated microturbulent velocity for IRAS 22272+5435 depends on the upper limit of the used EWs, with a tendency to give larger for stronger lines.
| [Fe/H] | [C/H] | [N/H] | [O/H] | Ref. | ||||
|---|---|---|---|---|---|---|---|---|
| (K) | (cgs) | (km s-1) | (dex) | (dex) | (dex) | (dex) | (dex) | |
| 5600 | 0.5 | 3.7 | -0.49 | +1.19 | … | -0.10 | +1.9 (6) | 1 |
| 5600 | 0.5 | 3.7, 7.0 | -0.5 | +0.8 | … | -0.2 | +1.5 (17) | 2 |
| 5750 | 0.5 | 4.5 | -0.82 | +0.17 | -0.24 | -0.30 | +1.2 (7) | 3 |
| 5800 | … | … | … | … | … | … | … | 4 |
We adopted the abundances of CNO elements calculated by Reddy et al. (2002), [C/H] = 0.17 dex, [N/H] = –0.24 dex, and [O/H] = –0.30 dex, which lead to the carbon-to-oxygen ratio C/O = 1.6. The standard notations are adopted everywhere.222[A/B] = - , where , is the number density of an element A and B.
= + 12.00, where is the number density of hydrogen. A medium iron deficiency, [Fe/H] = –0.7 dex, and an enhanced abundances for all neutron capture elements were adopted, [n/H] = +1.5 dex. We adopted the scaled solar abundances, [X/Fe] = 0.0, for the rest elements, despite of some overabundances reported for IRAS 22272+5435 in the literature. The fits between the synthesized atomic spectra and the observed ones confirm in general the correctness of the adopted atmospheric parameters and chemistry (see Sections 3.4, 3.5, and 3.6), although for some species we detected the difference over a typical value of 0.2 dex in comparison with the abundances calculated by Reddy et al. (2002). The atmospheric parameters and abundances collected from literature are given in Table 3.
Updates of the published abundances are foreseen using the time series of spectra and the new models in a future paper. On the other hand, the optical spectrum of IRAS 22272+5435 originates at various depths in the atmosphere of central star and these are affected differently by pulsations. Due to this, a hydrostatic atmospheric model is not able to describe correctly the formation of all lines. According to the recent studies, the dynamical models fit the observed spectra of long-period variables much better than any hydrostatic model. However, for some spectral features, the variations in the line intensities predicted by dynamical models over a pulsation cycle give values similar to that of a sequence of hydrostatic models with varying temperature and constant surface gravity (Lebzelter et al., 2014). It is expected that absorption lines that are formed deep in the atmosphere of low-amplitude pulsating stars are calculated correctly using hydrostatic models. Loidl et al. (2001) demonstrated that hydrostatic atmospheric models are able to reproduce quite well the observed spectra of cool carbon-rich semiregular variables in the large wavelength region from 0.7 to 2.5 .
3.3 Atmospheric models and spectral synthesis
The standard atmospheric models prepared by Kurucz (1993) were used for the first iteration of the spectrum synthesis to examine the published abundances. Then a grid of new self-consistent atmospheric models were calculated in the range of effective temperature and surface gravity suitable for the central star of IRAS 22272+5435 (Table 4) to check the impact of models on the calculated spectrum. The new atmospheric models were calculated using the code SAM12 (Pavlenko 2003), a modification of the Kurucz code ATLAS12 (Kurucz, 2005), designed to calculate atmospheric models of red giants of a given chemical composition. The modifications are as follows. The boundfree absorption caused by the C i, N i, and O i atoms was added (Pavlenko & Zhukovska, 2003) to the continuum absorption sources included in ATLAS12. We also take into account collision induced absorption – absorption of the molecular complexes He and induced by collisions – which becomes an important source of opacity in the atmospheres of cool metal-poor stars (Borysow et al., 1997). Molecular and atomic absorption in the SAM12 code are taken into account by using the opacity sampling technique (Sneden et al., 1976). A compiled list of spectral lines includes atomic lines from the VALD3 database (Piskunov et al., 1995; Kupka et al., 1999) and molecular lines of CN, C2, CO, SiH, MgH, NH, OH from the Kurucz database (Kurucz, 1993). In addition, the absorption by the HCN bands was taken into account according to Harris et al. (2003, 2006). We also took into account the isomers HCN and NHC absorption. SAM12 was used successfuly for calculations of the atmospheric models for chemically peculiar stars like R CrB stars, Sakurai’s object, and other evolved stars.
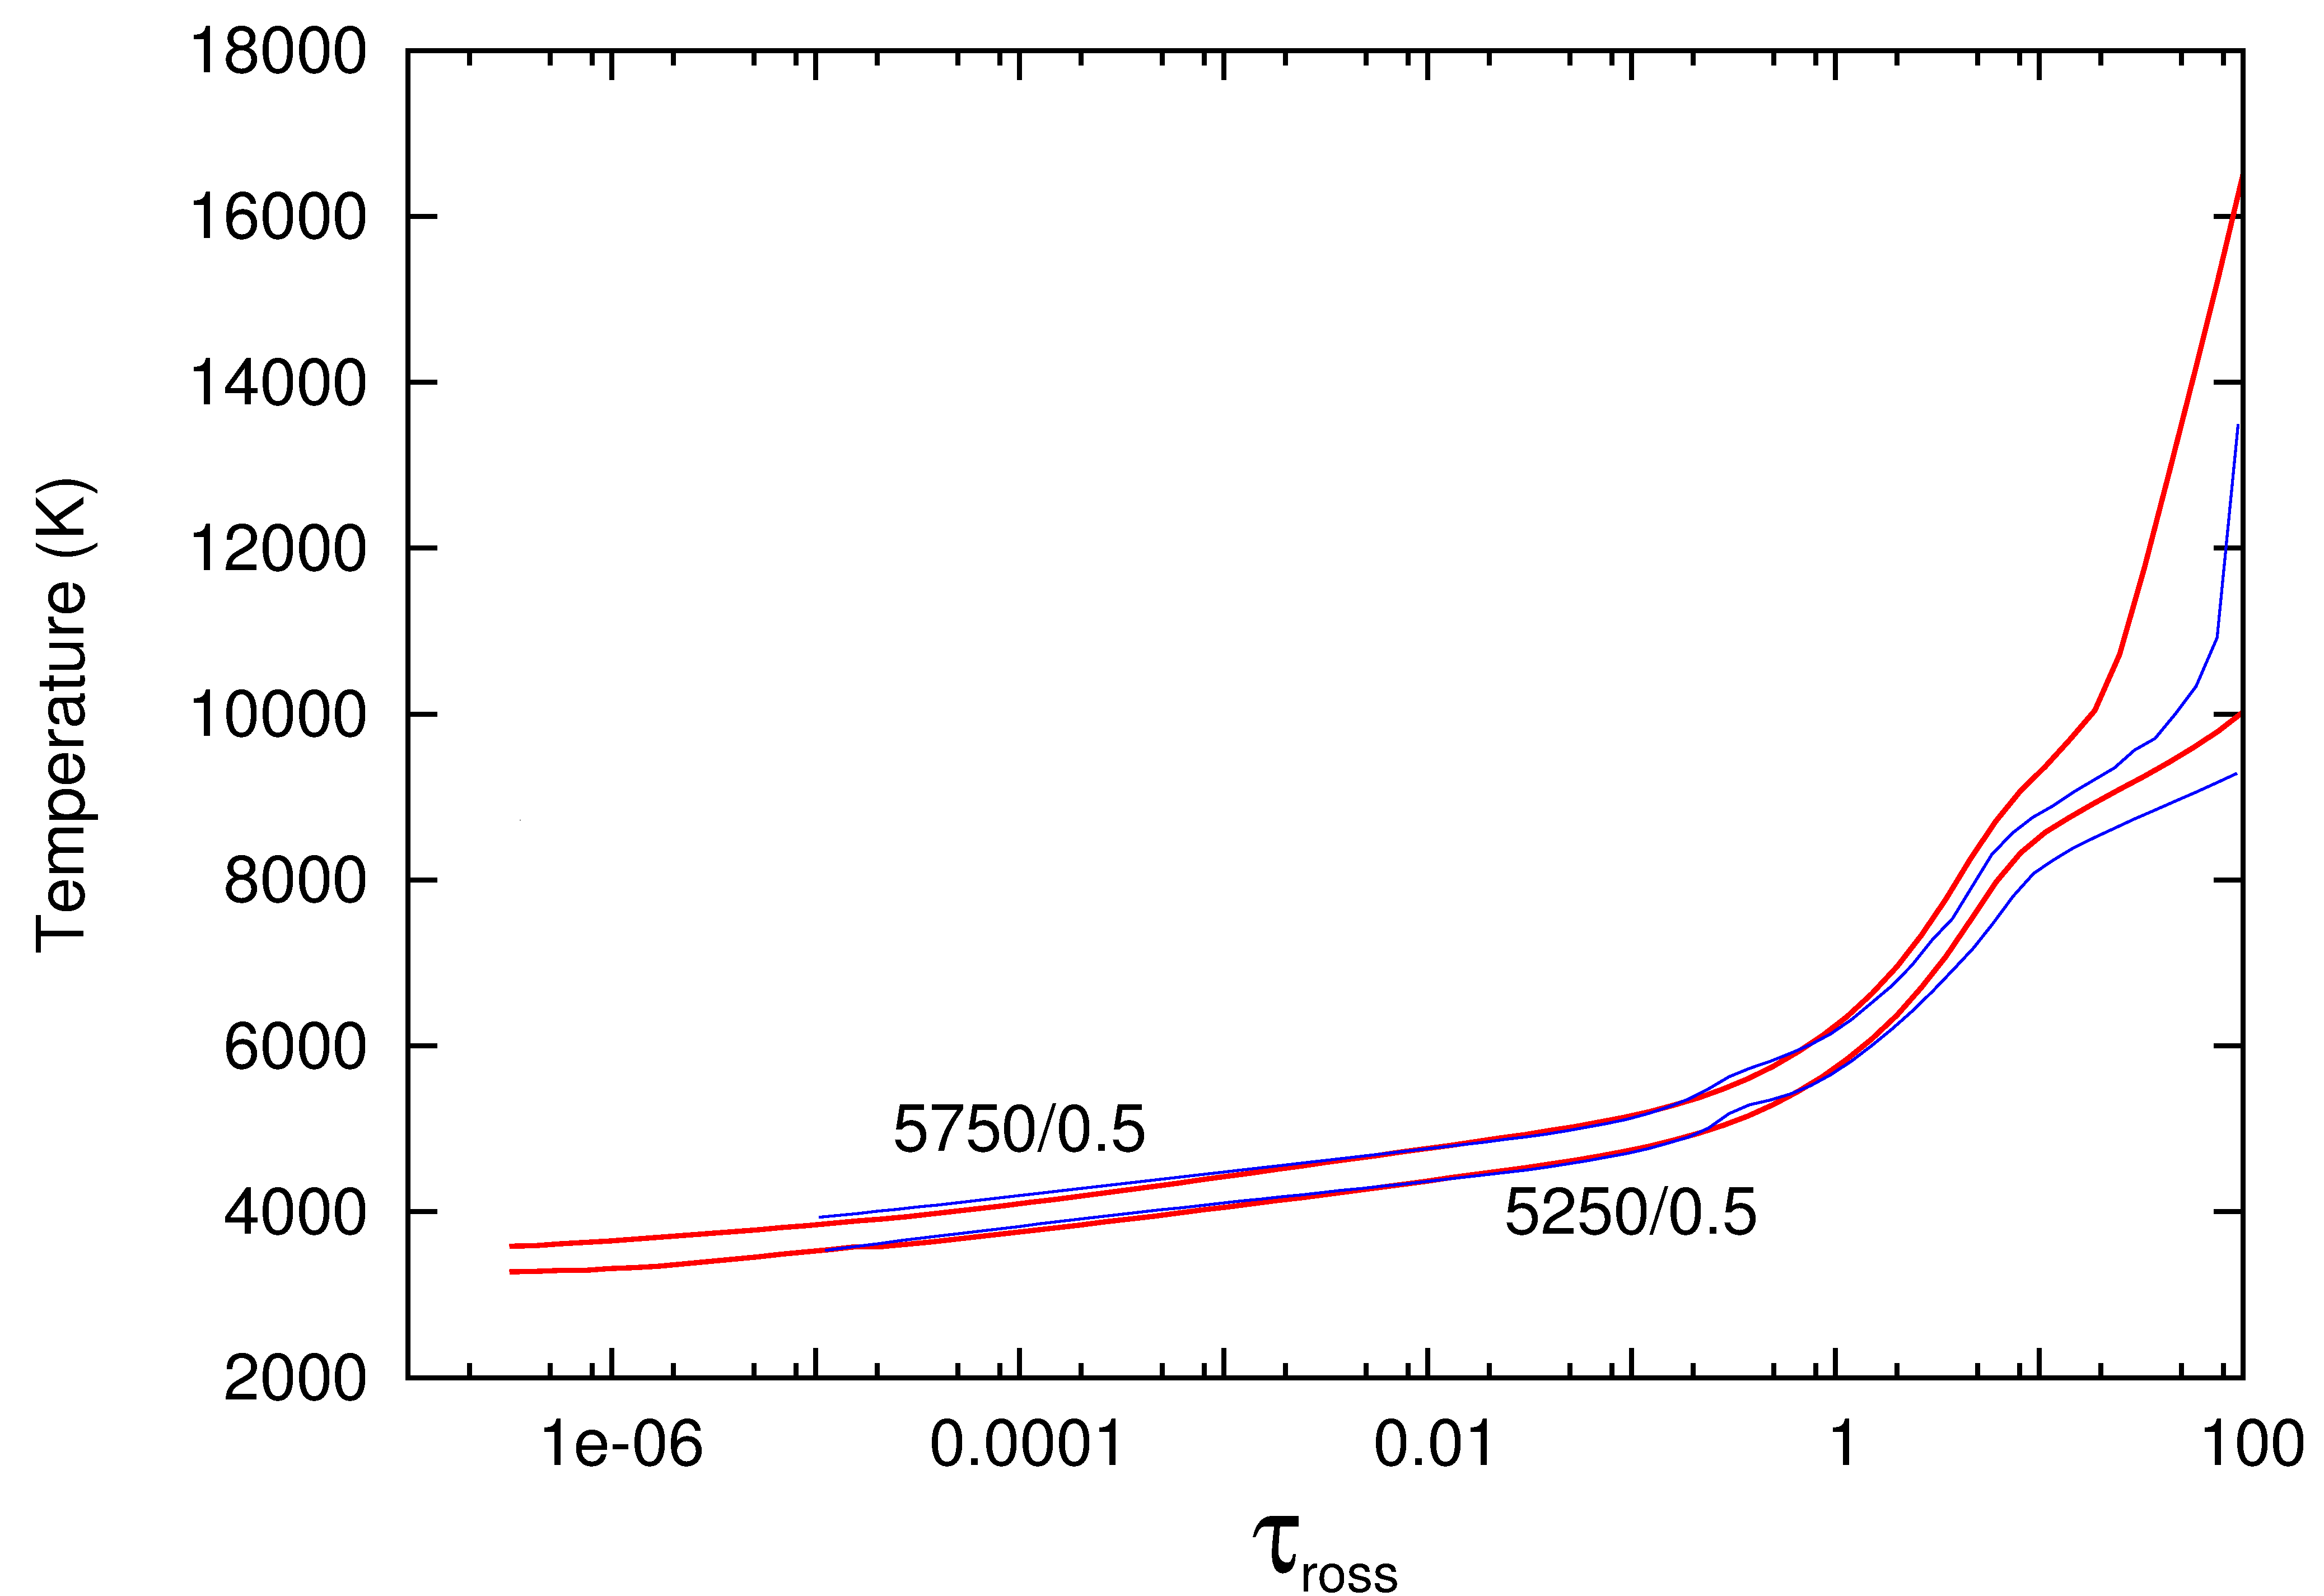
Structure of the calculated atmospheric models depends on the adopted chemical composition, therefore, we used the actual abundances for IRAS 22272+5435 retrieved from the literature (see Section 3.2). The published metallicities for IRAS 22272+5435 are in the range of 0.3 dex and the mean weighted metallicity was adopted for calculation, [Fe/H] = 0.7 dex. We adopted the carbon and oxygen abundances estimated by Reddy et al. (2002) because of higher resolution of their spectrum (lower blending effects) and larger number of employed lines in comparison with the previous papers. The published abundances for neutron capture elements are contradictory - the differences between estimations for some elements are much larger than the predicted uncertainties (Začs et al., 1995, 1999; Reddy et al., 2002). The mean enhancement calculated on the basis of seventeen neutron capture elements, [n/H] = +1.5 dex, was adopted for all the ncapture elements in the SAM12 models. A comparison of temperature structure of two SAM12 atmospheric models and the corresponding Kurucz models is given in Figure 5. As can be seen, the models are similar; however, the outer layers for the SAM12 models are cooler in comparison with the Kurucz models. The synthetic spectra were calculated in selected wavelength regions with the code WITA (Pavlenko, 1997) and were appropriately convolved with a Gausian profile with FWHM ranging from about 0.4 (blue) to 0.8 (near-infrared) Å depending on the wavelength region. The VALD3 database was used as a primary source of atomic and molecular data for synthesis of the spectra. The list of molecular lines was adopted from the Kurucz database (Kurucz 1993) and SCAN tape (Jørgensen & Larsson, 1990).
| g | [M/H] | C/O | [n/H] | |
|---|---|---|---|---|
| (K) | (cgs) | (dex) | (dex) | |
| 5750 | 1.5 | -0.7 | 1.6 | +1.5 |
| 5750 | 0.5 | -0.7 | 1.6 | +1.5 |
| 5750 | 0.1 | -0.7 | 1.6 | +1.5 |
| 5250 | 0.5 | -0.7 | 1.6 | +1.5 |
| 5250 | 0.0 | -0.7 | 1.6 | +1.5 |
| 4750 | 0.5 | -0.7 | 1.6 | +1.5 |
| 4750 | 0.0 | -0.7 | 1.6 | +1.5 |
3.4 Atomic lines
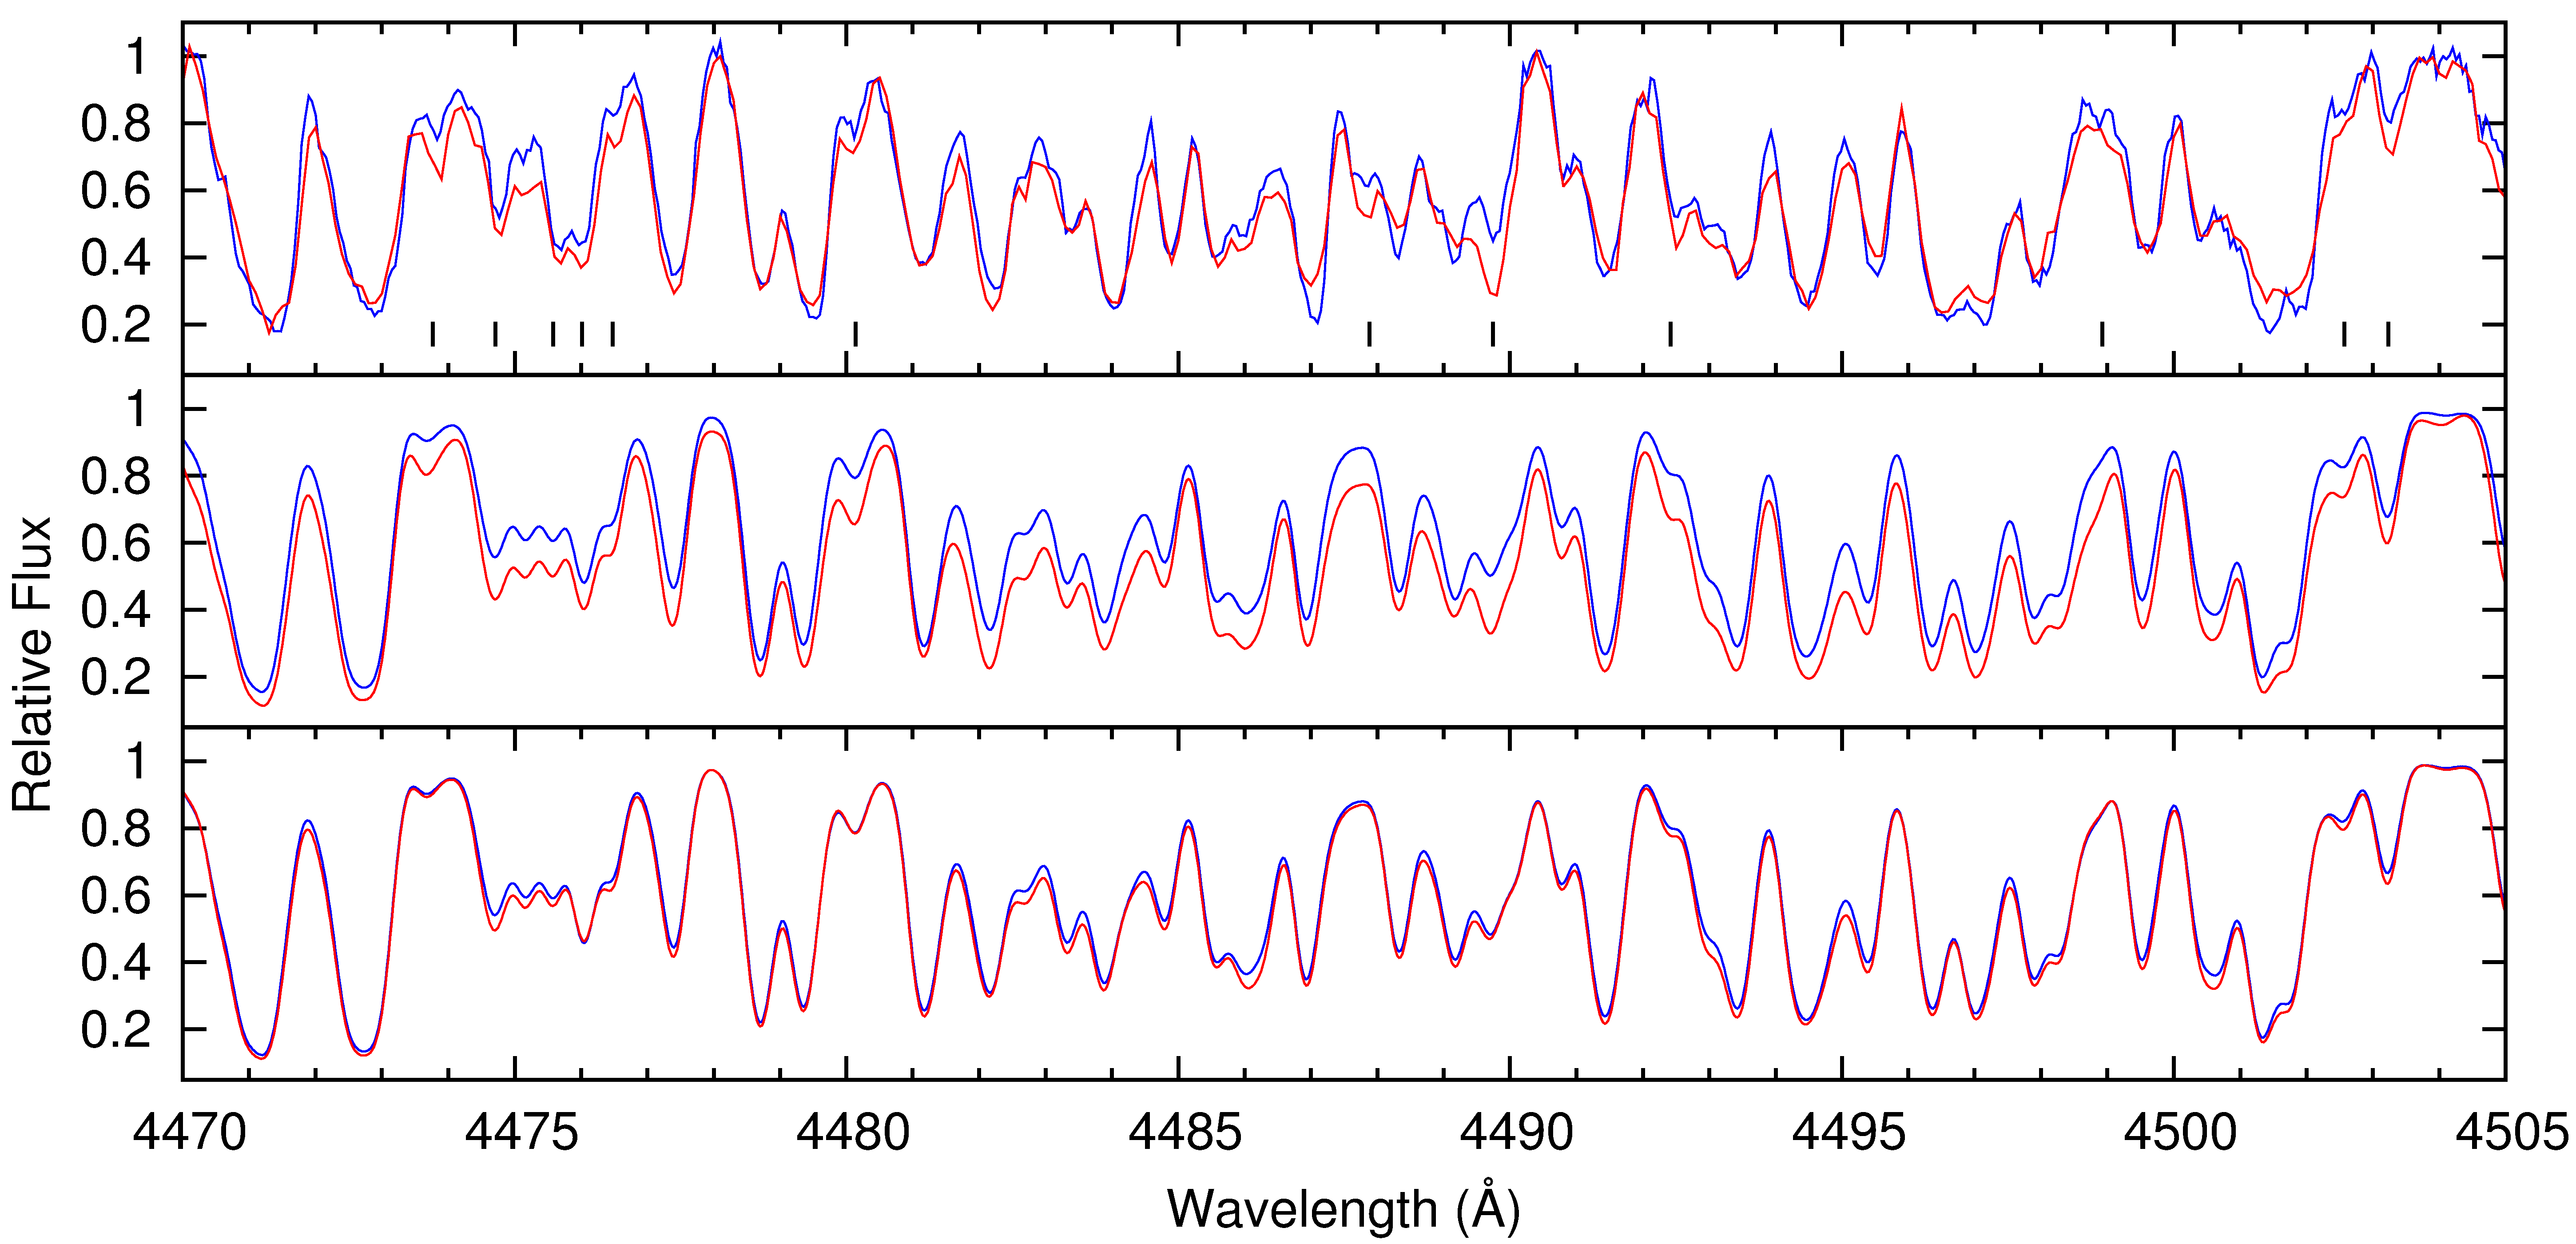
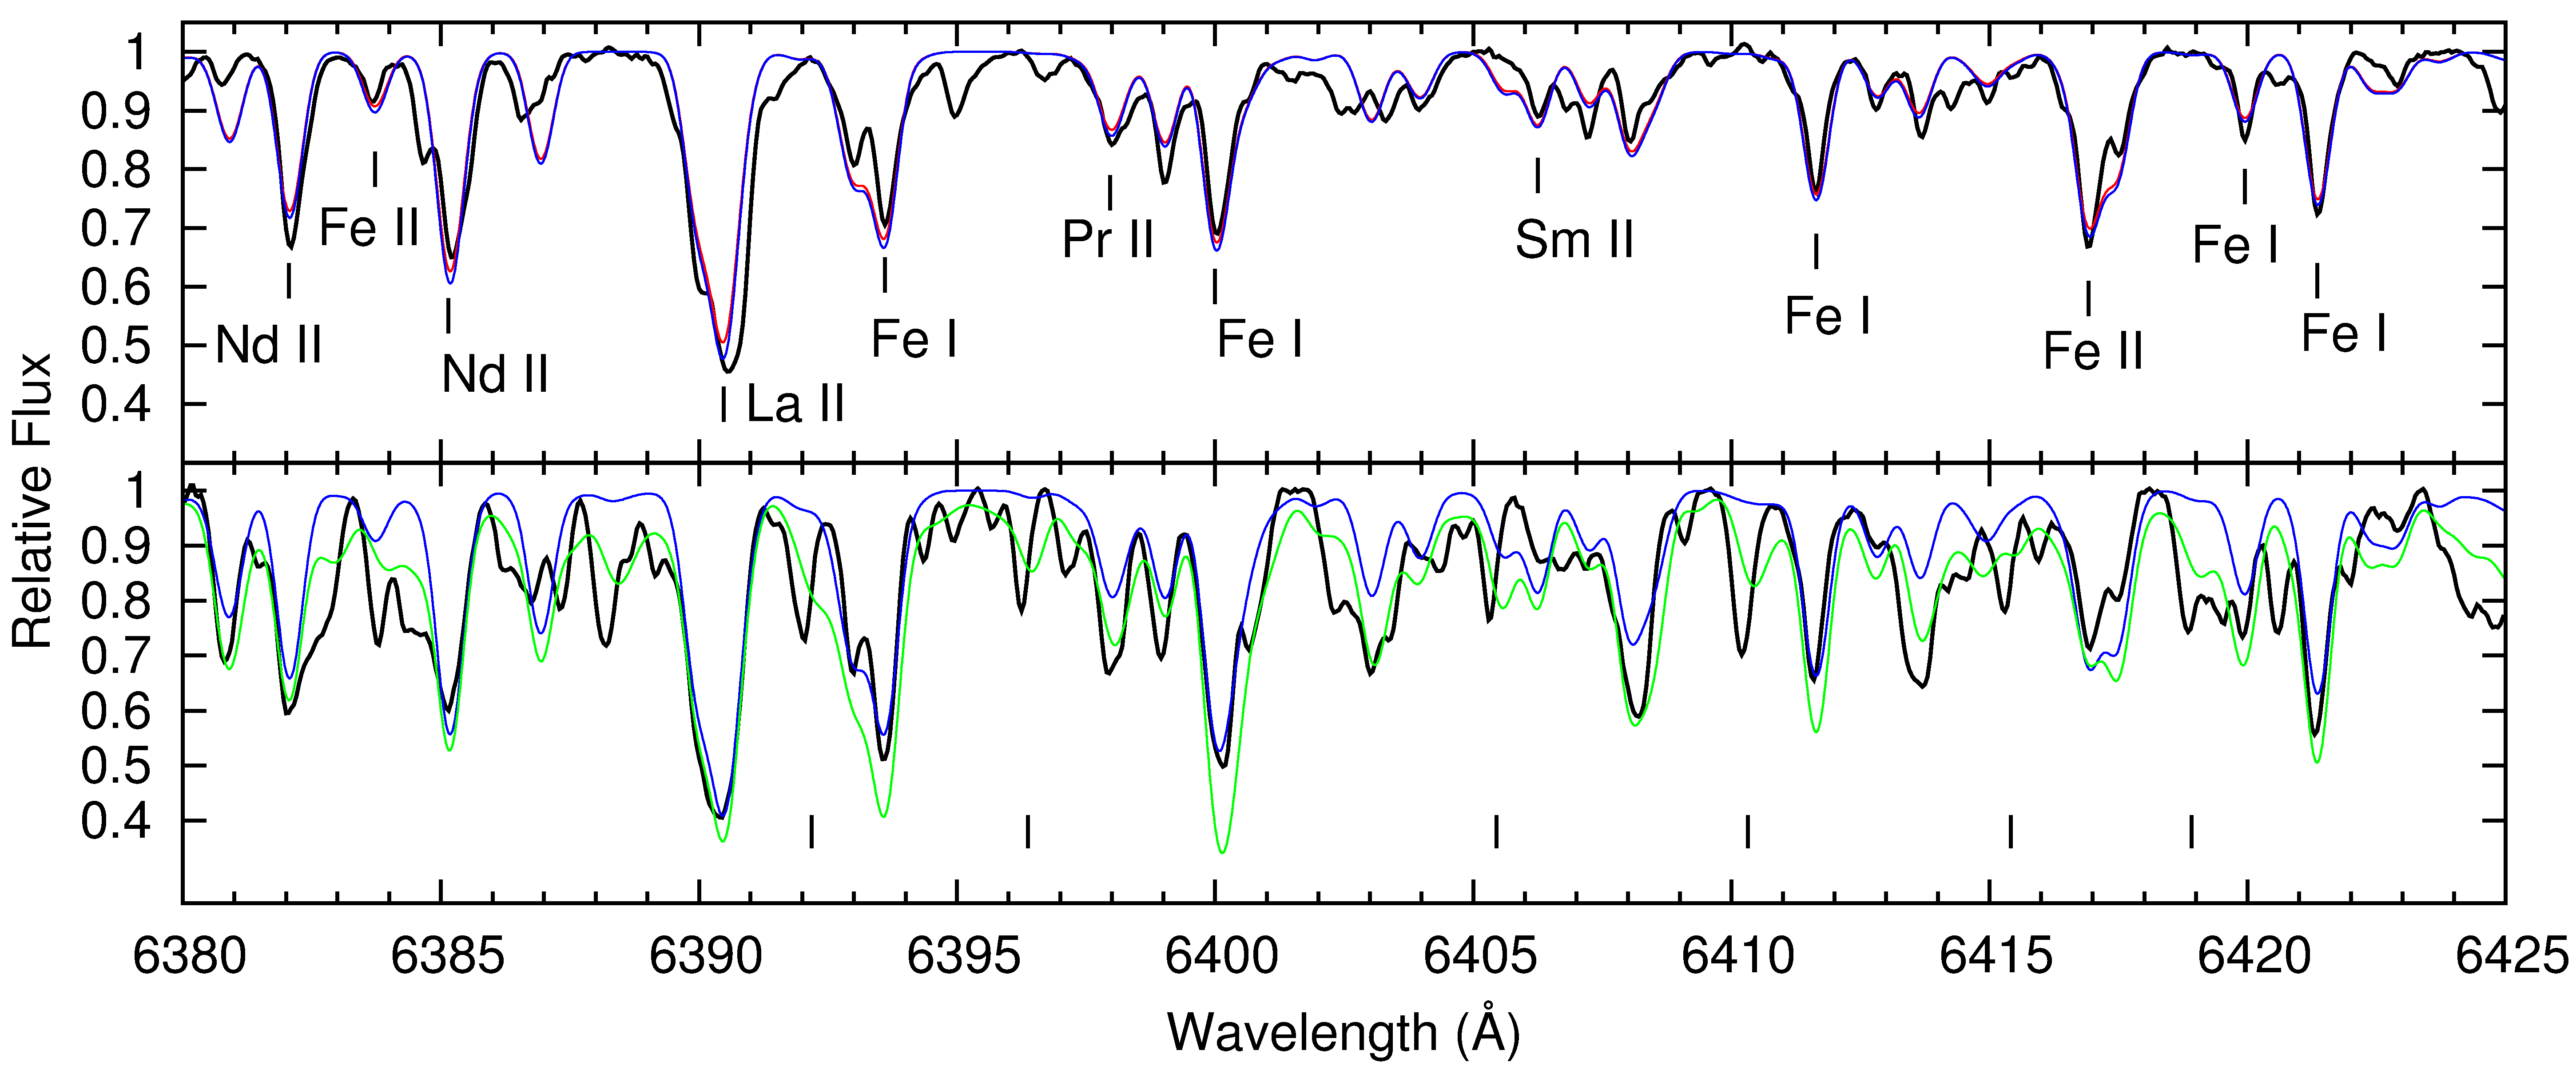
Comparison of the observed spectra shows that most of the absorption lines are variable. However, the largest variations are seen mainly in the molecular lines (see Section 3.5 and 3.6). Numerous lines of carbon-bearing molecules of different strengths are blended with atomic lines throughout the spectrum, especially near the light minima, mimicking a variability in the blended atomic lines. On the other hand, the atomic lines could be intrinsically variable as well because of variations of the atmospheric parameters for the central star during the pulsation cycles. The intrinsic variability of the atomic lines was examined in the blue wavelength region, where contamination from molecular lines is lower in the observed spectra during all phases of the light cycle. An example of the comparison of the spectra observed at light maximum on September 2010 and that observed at light minimum on November 2011 is shown in Figure 6. The color curve is also at its extreme values on these two dates, being bluer (hotter) when brighter. As can be seen, most of the spectral features reveal some minor variability. However, some of them display large intensity variations between the light and color extrema. The most variable atomic lines are marked by tick marks in Figure 6 and mainly result from neutral low-excitation transitions (Table 5). The variability of the spectrum due to temperature variation was modeled using the hot and cool atmospheric models calculated for IRAS 22272+5435. Synthesized spectra for the final atmospheric models with = 5750 K and 5250 K are displayed in Figure 6 (middle panel). The sensitivity to temperature variation is clearly seen in a number of atomic lines e.g. Ce II at 4473.77 Å, Sm II and Ce II at 4476.5 Å, Fe I at 4489.74 Å, Pr II at 4492.42 Å, and Dy II at 4503.23. The sensitivity of the selected lines to the changes of surface gravity was found to be relatively low (see Figure 6; bottom panel). We conclude that most of the intrinsic intensity variations in the weak and medium strong atomic lines throughout the spectrum of IRAS 22272+5435 are because of temperature variations rather than to changes in surface gravity in the line forming region during the pulsations cycle.
| Species | Wavelength | LEP | Ref. | |
|---|---|---|---|---|
| ( Å ) | (eV) | |||
| Ce II | 4473.77 | 1.48 | -0.489 | PQWB |
| V I | 4474.71 | 1.89 | 0.037 | K09 |
| Nd II | 4475.58 | 0.06 | -1.827 | MC |
| Fe I | 4476.02 | 2.84 | -0.819 | K07 |
| Fe I | 4476.07 | 3.69 | -0.175 | K07 |
| Sm II | 4476.48 | 0.38 | -1.759 | XSQG |
| Ce II | 4476.51 | 0.74 | -1.860 | PQWB |
| Fe I | 4480.14 | 3.05 | -1.932 | BWL |
| Ce II | 4487.88 | 1.49 | -0.789 | PQWB |
| Fe I | 4489.74 | 0.12 | -3.966 | K07 |
| Pr II | 4492.42 | 0.42 | -1.153 | MC |
| Ce II | 4498.92 | 1.32 | -1.349 | PQWB |
| Ce II | 4502.57 | 1.25 | -1.250 | PQWB |
| Dy II | 4503.23 | 0.93 | -1.487 | MC |
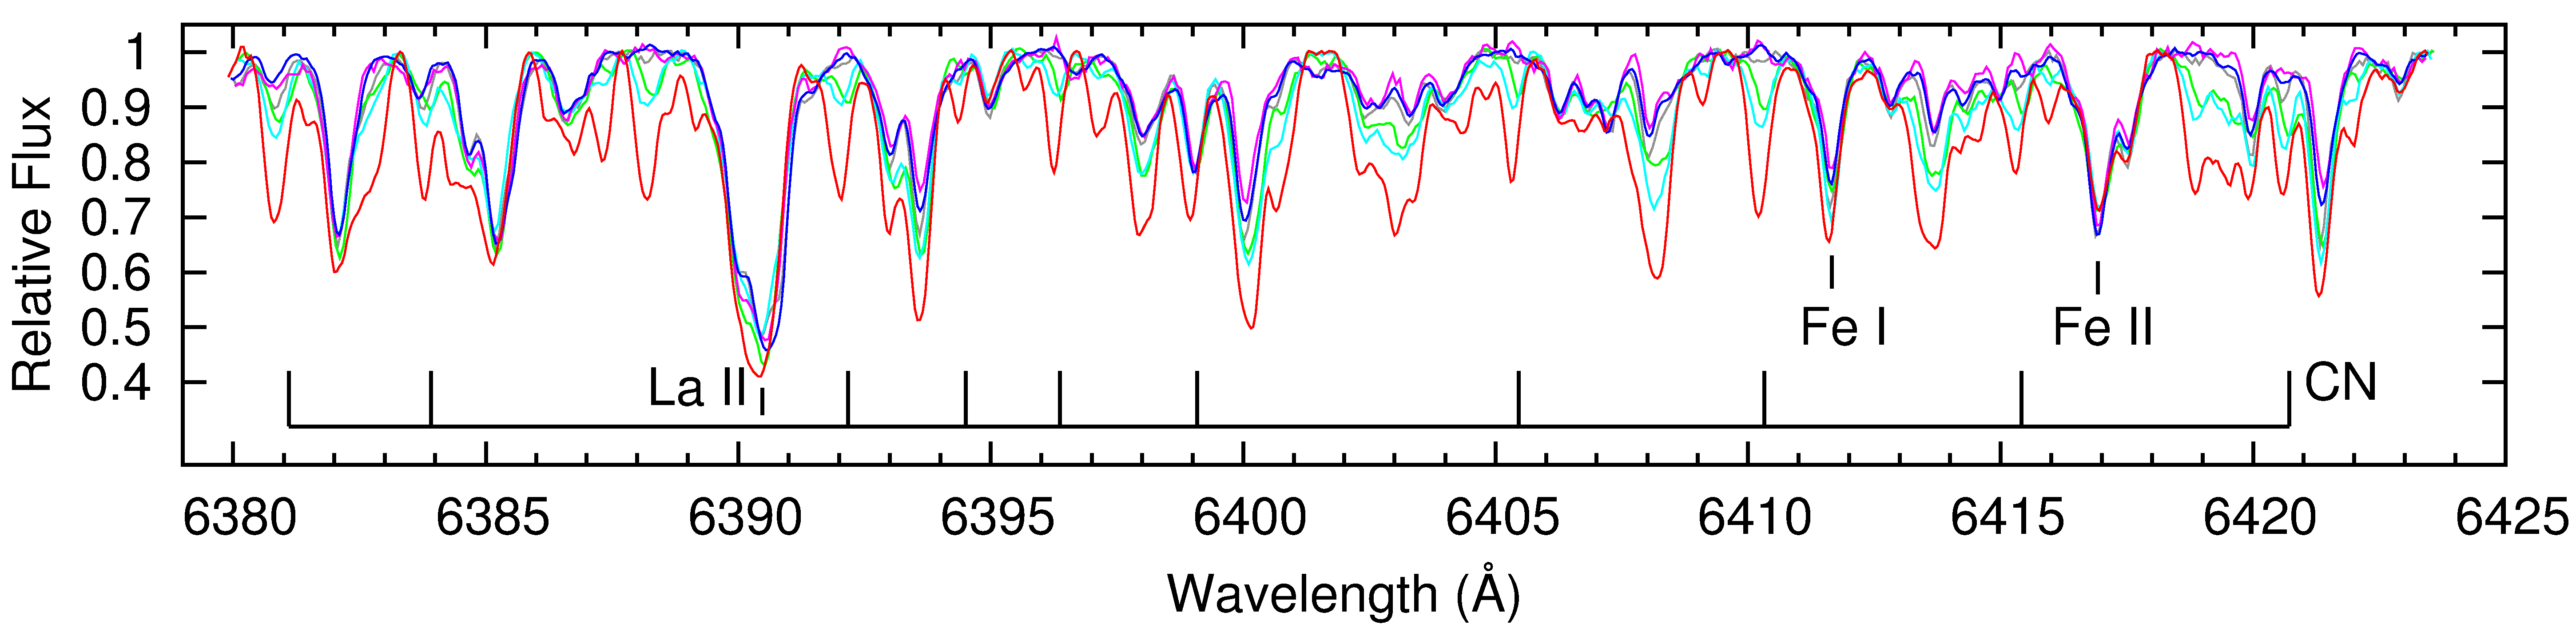
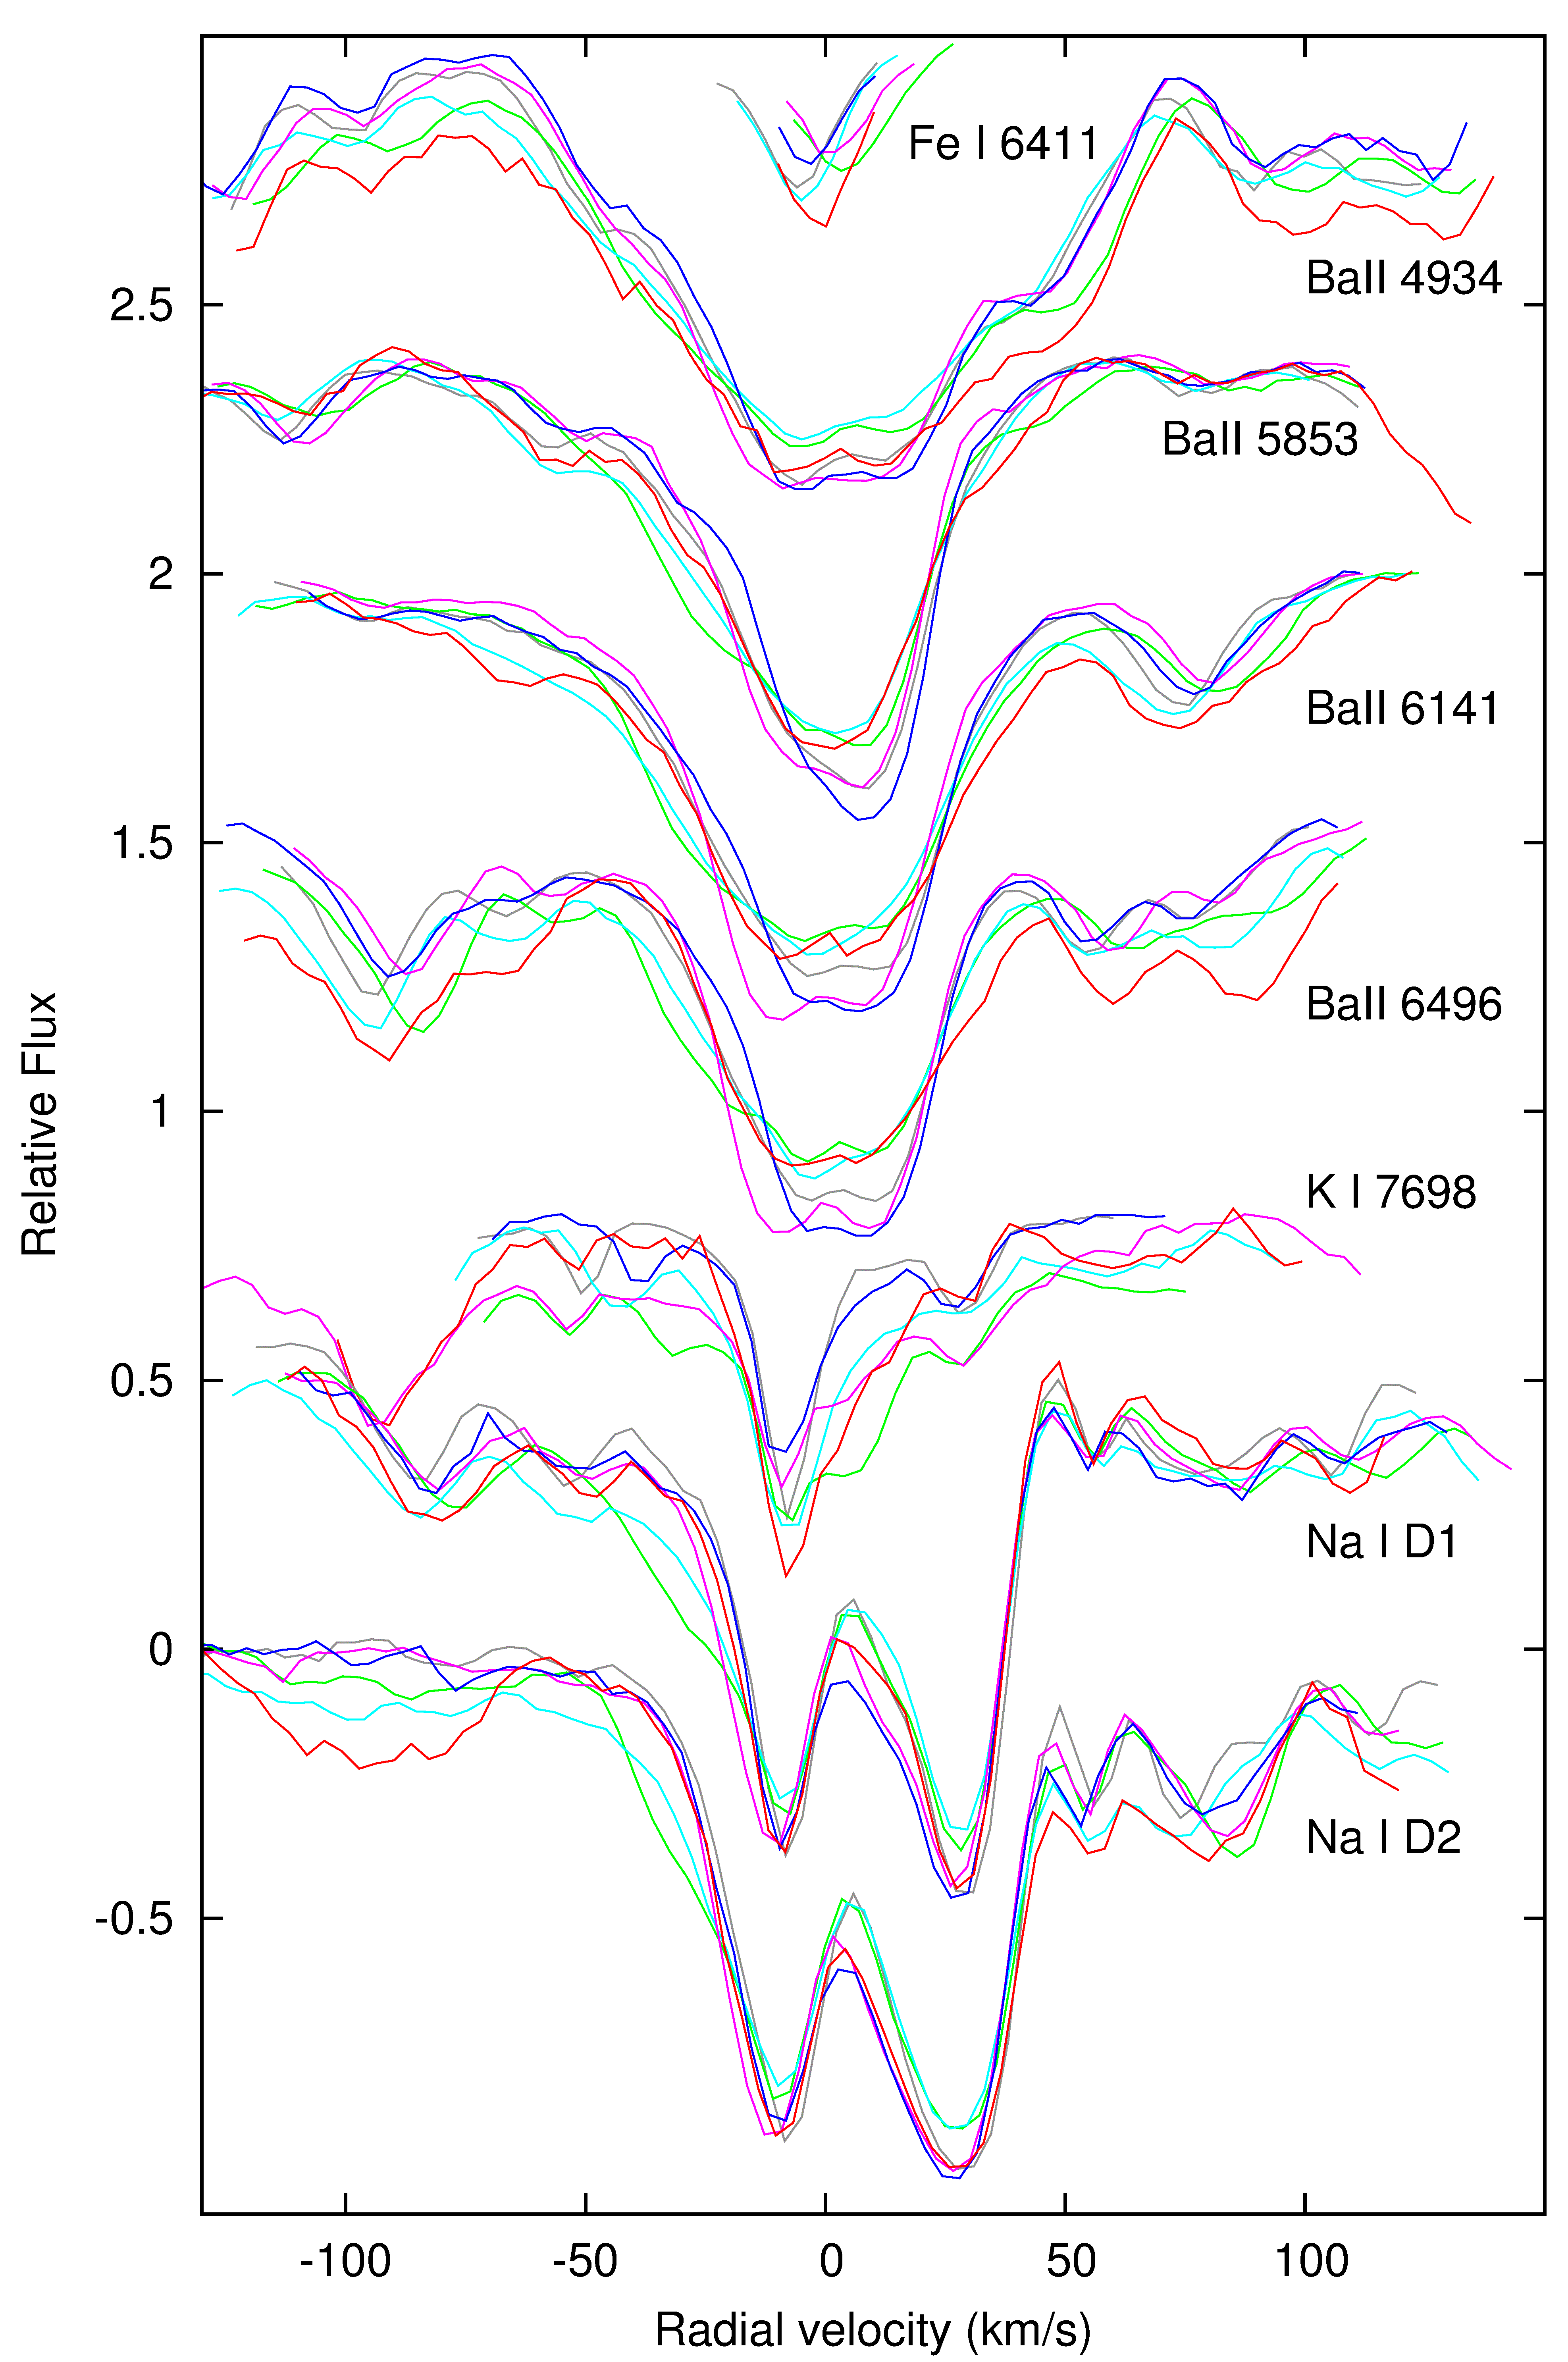
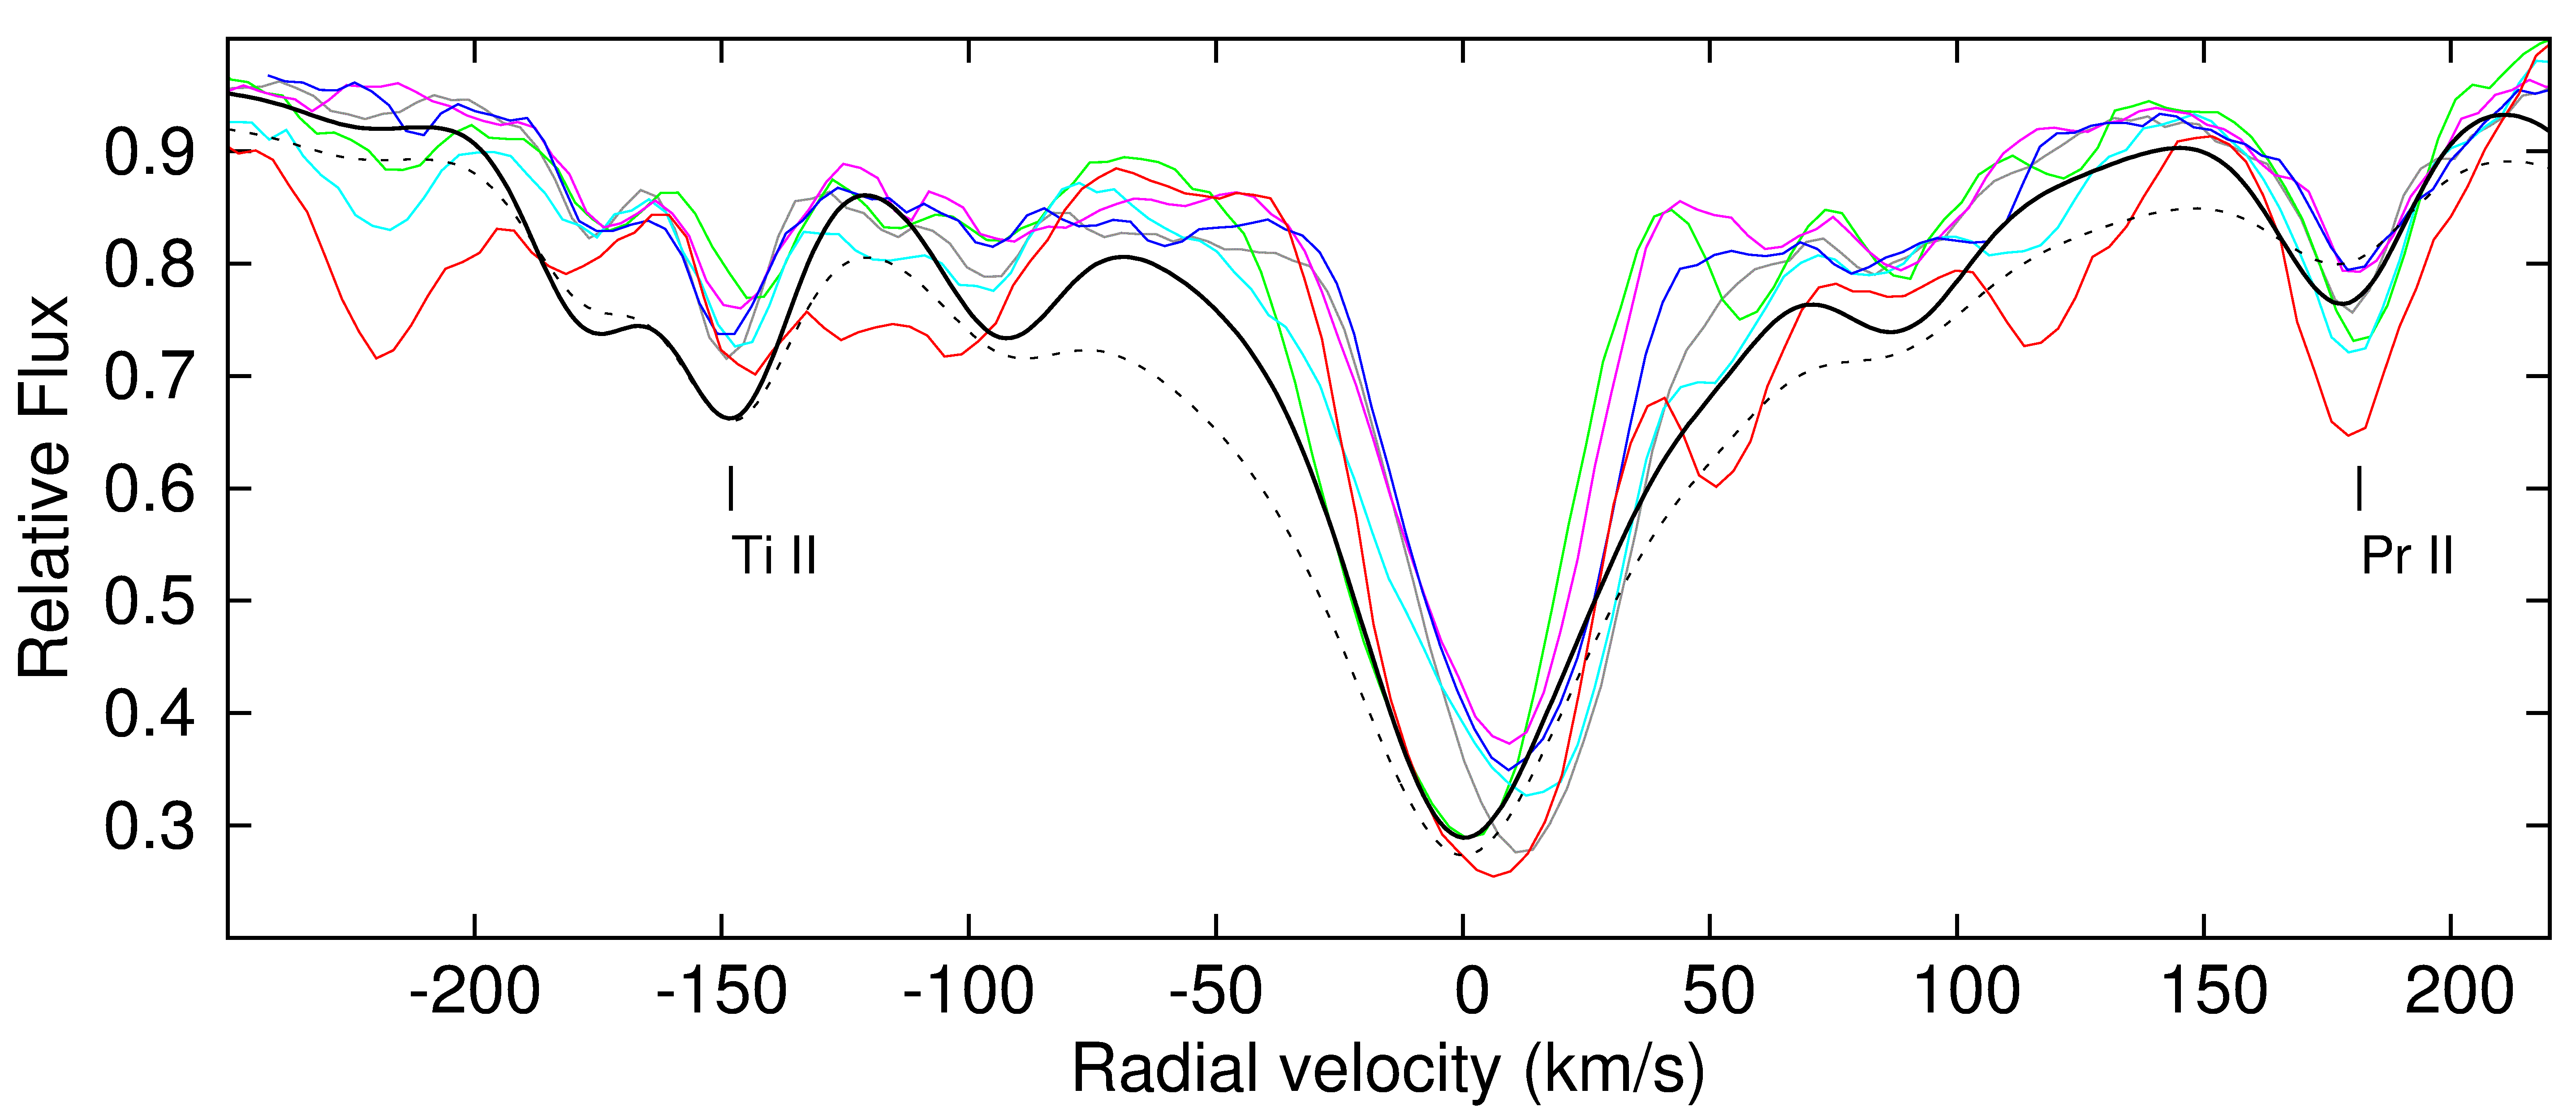
Inspection of the observed spectra gives evidence that some of lines are extremely broad and split. The profiles of four Ba II lines at 4934, 5853, 6141, and 6496 Å, K I line at 7698, and the Na I D doublet in radial velocity scale relative to the systemic velocity, = 40.8 km s-1, are displayed in Figure 4. All of the selected lines are resonance or low-excitation lines those cores are formed mainly in the outer layers of the stellar atmosphere. A medium strong Fe I line at 6411.65 Å with a Gaussian profile is shown for comparison purposes. As can be seen, the profiles of selected lines have a few components in the range of Doppler velocities from about 50 to +50 km s-1 relative to the systemic velocity. The intensity and velocity of these components depends on pulsation phase. Redshifted components of variable intensity are seen at about 25 km s-1 in the Na I D12 and K I profiles and at about 60 km s-1 in the Na I D12 profiles. Blue wings up to about 50 km s-1 are clearly visible in the spectra observed on October and November 2006. One of such broad and split absorption feature at 6390 Å was analyzed in detail using quantitative methods (Figure 7). Some weaker contributing atomic lines are identified and included in the list of lines for synthesis of the absorption profile to understand better the nature of splitting. Their positions are marked by vertical ticks according to the VALD3 database: Sm II line at 6389.83 Å, Nd II line at 6389.97 Å, La II line at 6390.48 Å, and Ce II line at 6390.61 Å. The profile at 6390.48 Å was calculated with two final atmospheric models for and 5250; however, the synthesized profiles are not able to reproduce the observed blue/red-shifted components. Thus, the sequence of profiles indicates probably that expanding and infalling layers are simultaneously present in the outer atmosphere of central star of IRAS 22272+5435. We examined short-term variability in the profiles of split lines employing the time series of spectra observed near the light maximum (Sep 2010) and minimum (Oct 2011). An example of such an analysis is shown in Figure 7 (right panel) for an absorption feature formed mainly by the La II line at 6390.48 Å. We detected a significant variation of intensity in the absorption component shifted to the red relative to the stellar photospheric velocity by about 10 km s-1. A monotonic decrease of the intensity for this component was observed over 12 days from September 17 to September 28. It should be noted that short-term variability was detected in the most of split low-excitation profiles examined here. The splitting and variability in the time scale of a week seem to be observational evidence of shock waves in the outer atmosphere of the star.
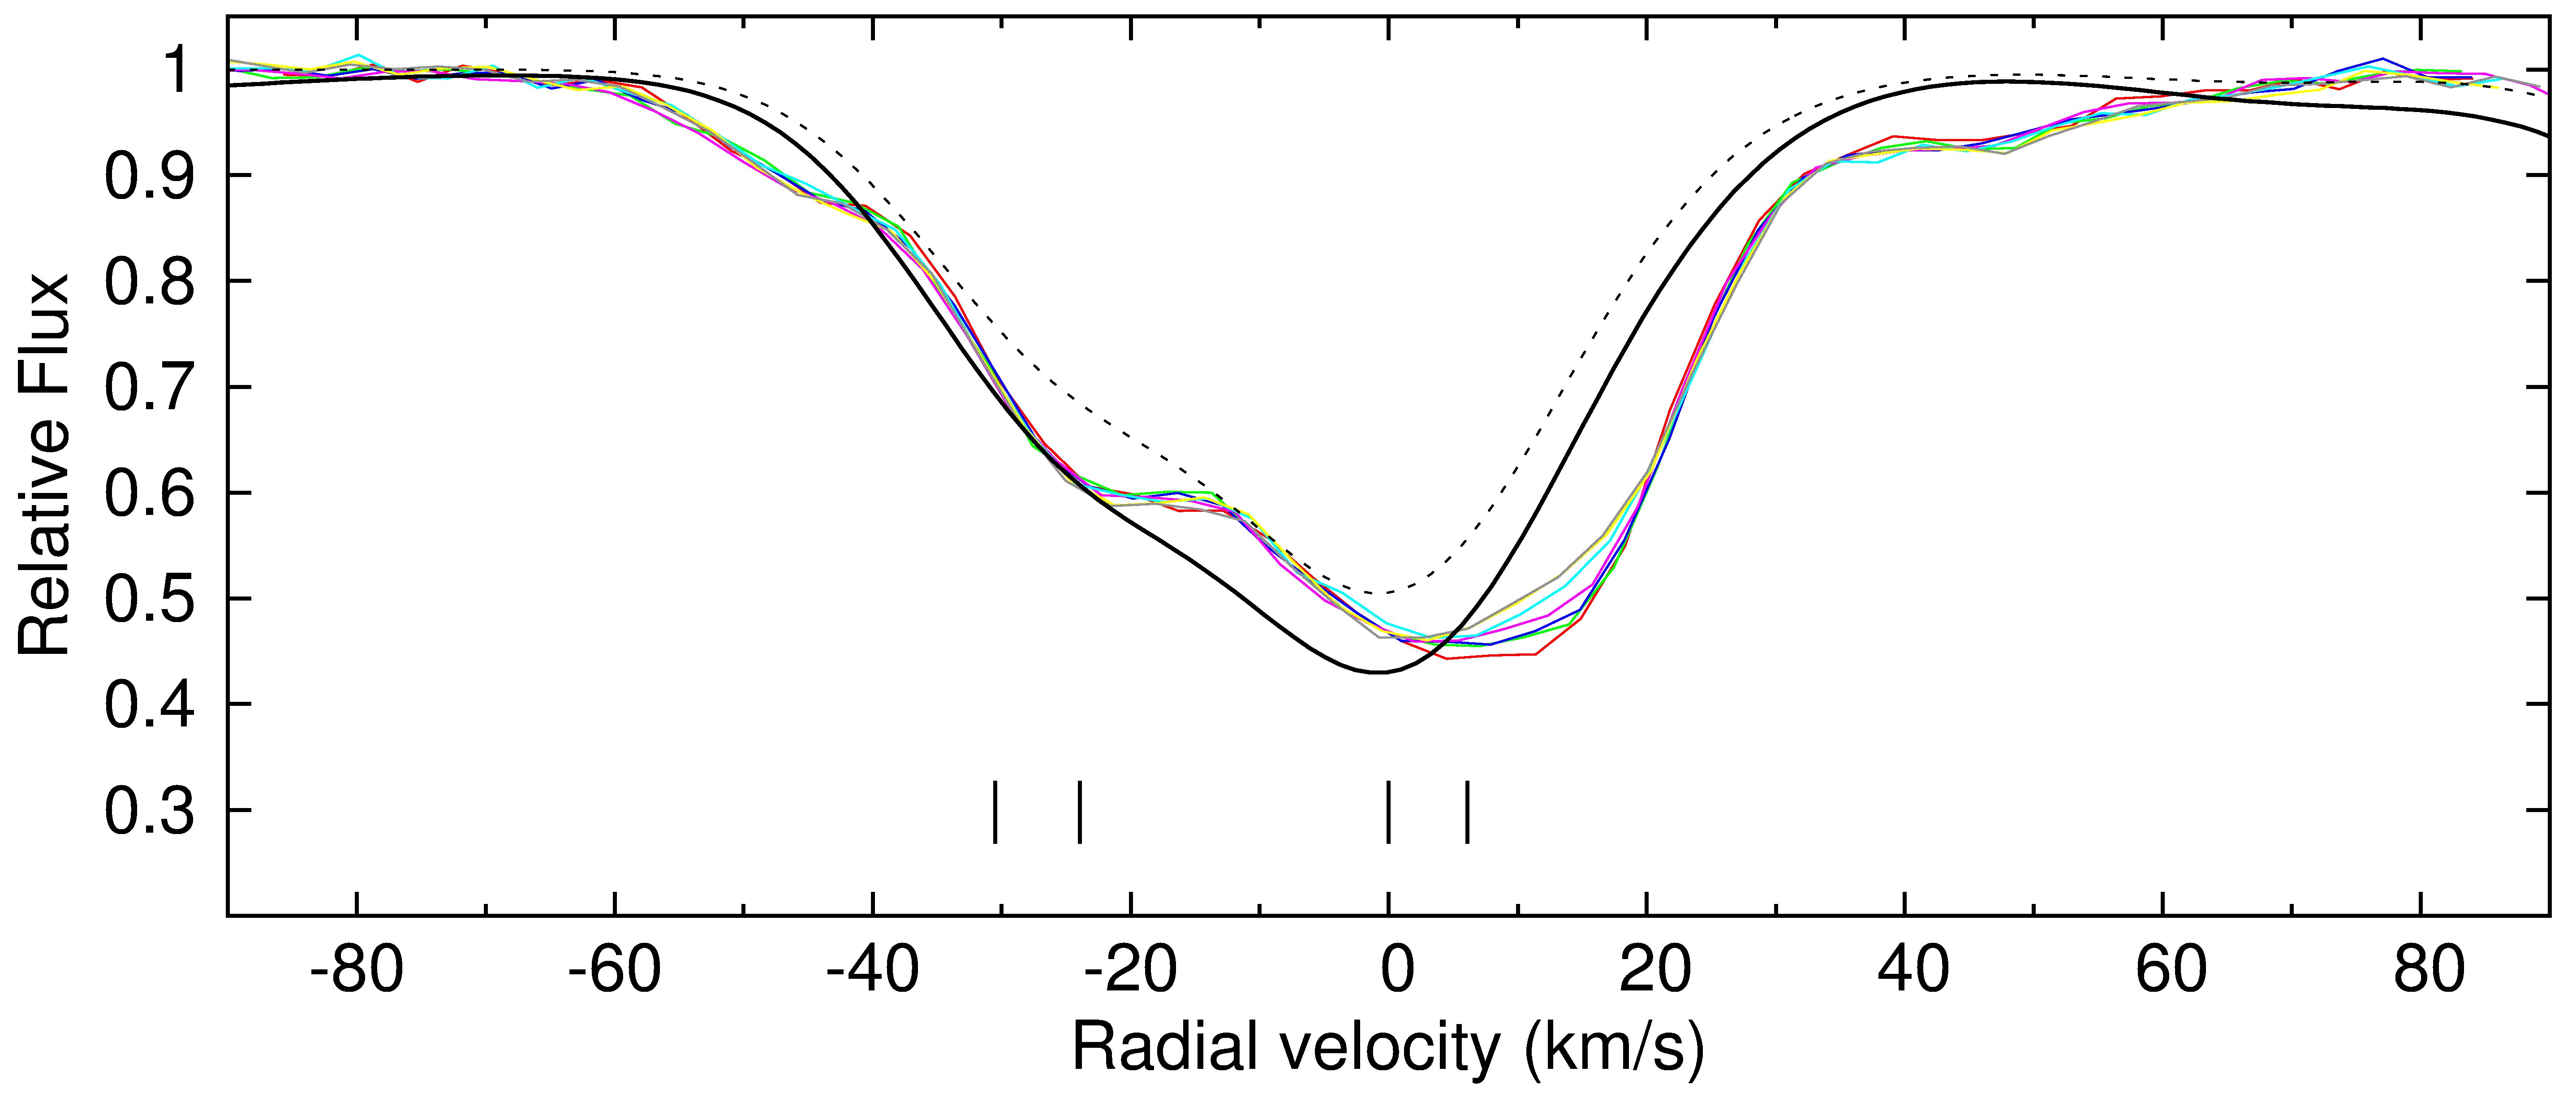
The profile of the Balmer line is complicated and variable in the spectrum of IRAS 22272+5435. The broad wings of the absorption profile are approximately in agreement with those calculated for supergiant with the atmospheric model for = 5250. However, the central part of the profile displays a shell-like emission with a central absorption (see Figure 8). Such profiles with a central absorption within the emission were found to be common for PPNe of spectral type F (Hrivnak & Reddy, 2003). Emission features of about equal height for IRAS 22272+5435 are located on the both sides of the central absorption feature. A time dependence in the profiles is seen in Figure 8, along with the profiles calculated with the two final models for and 5250. The intensity and position of the central absorption feature is variable relative to the calculated profile. As can be seen, in the spectrum observed on 2006 November the position and intensity of the central absorption agree well with that calculated for the photosphere. In the other observed spectra the central absorption is redshifted relative to the photospheric velocity. Radial velocities measured for the central absorption in the spectra observed on November 2002, October 2006, November 2006, February 2008, September 2010, and November 2011 are, relative to the systemic velocity, RV = +7.5, +9.7, +3.8, +9.7, +8.9, +4.8 km s-1, respectively. Thus, the central absorption is redshifted relative to the systemic velocity in all the observed spectra. The Balmer line is in absorption at approximately the photospheric velocity.
3.5 Swan system lines
Inspection of the observed high-resolution spectra revealed a significant intensity variation in the wavelength regions where the bandheads of Swan system are located. The spectra around Swan system bandhead (0,0) at 5165 Å and the bandhead (0,1) at 5635 Å were examined in details. We varied the effective temperature of atmospheric models and measured the radial velocity of selected lines to understand the reason of variation.
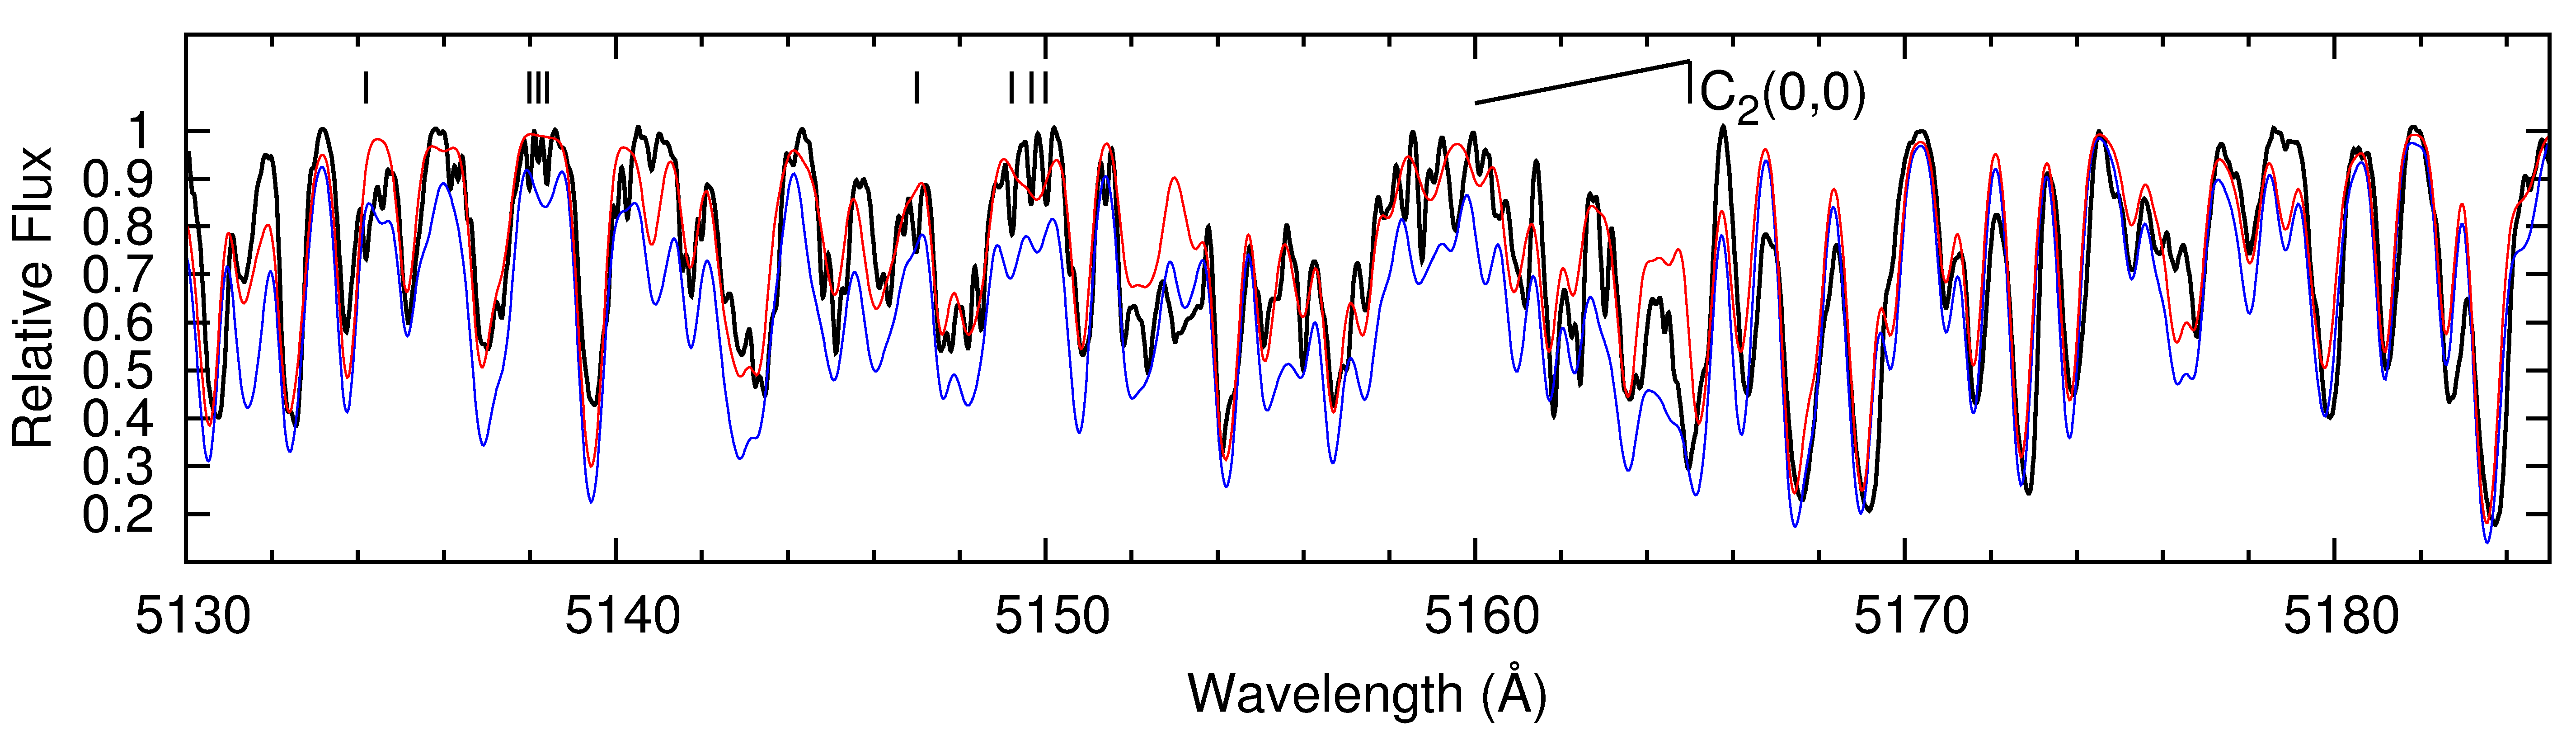
Seven high-resolution spectra in the wavelength region from 5125 to 5187 Å gathered for IRAS 22272+5435 during the set of observation from 2010 September 17 to September 28 at the light maximum (color index minimum) are displayed in the Figure 9. The spectra are shifted in the intensity scale for clarity. We concluded that there are no variations in the intensity and wavelength of the absorption lines among the individual spectra that are above the limit of detection in the this wavelength region. Thus the resulting combined spectrum has a very high S/N ratio. This combined spectrum is given on the top of the Figure 9. The photospheric spectrum for the central star of IRAS 22272+5435 was calculated with the standard Kurucz (1993) model for the atmospheric parameters ( = 5750 K, g = 0.5, [M] = –0.5) determined by Reddy et al. (2002) and for the atmospheric chemistry given in the Section 3.2. The agreement between the observed and synthesized spectra for the atomic lines is quite good, confirming in general the correctness of the adopted atmospheric parameters and abundances. However, the intensity of absorption features around 5165 Å was found to be larger in the observed spectrum in comparison with the calculated one. A weak band head in the spectrum observed at the light maximum was suspected. Redward of the (0,0) band head we detected weak and narrow lines that were identified with single lines (Table 6). Unfortunately, the intensity of (0,0) band head in the calculated spectrum was found to be below the limit of detection rejecting the photospheric origin of the observed band head. However, the bandhead could be stronger for the chemically peculiar atmospheric model. Therefore, the photospheric spectrum of IRAS 22272+5435 was calculated with new self consistent SAM12 atmospheric models for two effective temperatures, = 5750 (estimated temperature at maximum light) and 5250 K (estimated temperature at minimum light), with the goal to check the impact of the adopted models on the synthesized spectrum and of helping to clarify the formation site of the detected features. For the hot SAM12 atmospheric model the intensity of band head in the calculated spectrum is still below the limit of detection. The fit between observed and calculated line intensities for the SAM12 model with = 5250 K is quite good near the bandhead, except for the position of the bandhead (Figure 10). However, the calculated intensities of the photospheric lines blueward of the bandhead are too strong in the cool model and the profiles are broader in comparison with the observed ones. For these reasons we conclude that the site of formation of the weak (0,0) band head and narrow single lines lies outside the photosphere of the central star of IRAS 22272+5435.
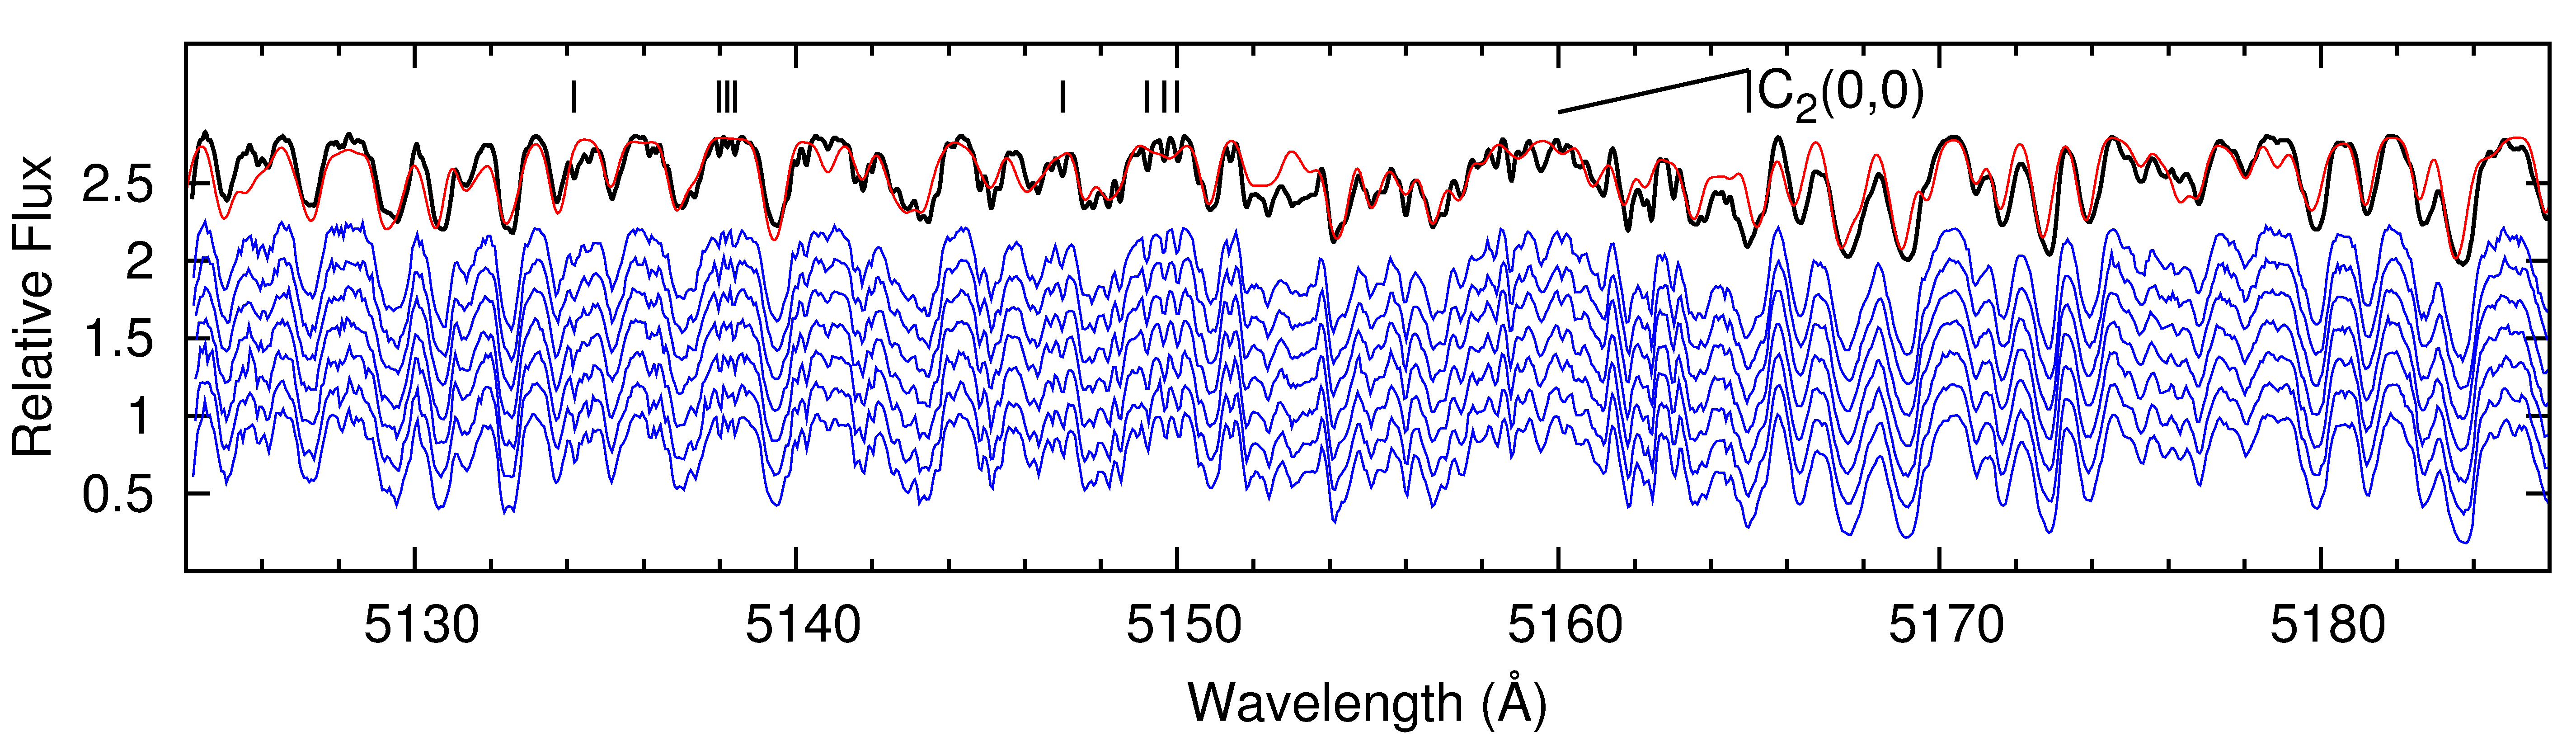
| Wavelength | Id | RV | FWHM | EW |
|---|---|---|---|---|
| ( Å ) | (km s-1) | ( Å ) | (mÅ ) | |
| Sep 2010 | ||||
| 5134.31 | -8.8 | … | … | |
| 5138.10 | -8.3 | 0.12 | 15 | |
| 5138.31 | -7.9 | … | … | |
| 5138.50 | -7.7 | 0.12 | 15 | |
| 5147.11 | -8.3 | … | … | |
| 5149.32 | -7.6 | … | … | |
| 5149.78 | -8.1 | 0.14 | 25 | |
| 5150.12 | -7.4 | 0.17 | 28 | |
| 5635.22: | -16.8 | 0.49 | 41 | |
| 7865.88 | -8.9 | 0.29 | 25 | |
| 7868.66 | -8.8 | 0.25 | 27 | |
| 7871.65 | -8.2 | 0.27 | 30 | |
| Nov 2011 | ||||
| 5149.32 | -8.2 | 0.30 | 188 | |
| 5149.78 | -7.1 | 0.18 | 65 | |
| 5150.12 | -7.3 | 0.24 | 104 | |
| 5629.14: | -6.0 | 0.40 | 146 | |
| 5631.05: | -5.4 | 0.44 | 165 | |
| 5635.22: | -10.5 | … | … | |
| 6372.79 | -4.7 | 0.34 | 61 | |
| 6392.18 | -6.0 | 0.41 | 120 | |
| 6394.50 | -6.1 | 0.28 | 40 | |
| 6396.37 | -5.0 | 0.32 | 73 | |
| 6405.44 | -5.4 | 0.34 | 88 | |
| 6415.41 | -5.1 | 0.37 | 89 | |
| 6420.72 | -6.5 | 0.42 | 120 | |
| 7865.88 | -8.7 | 0.32 | 74 | |
| 7868.66 | -8.9 | 0.32 | 76 | |
| 7871.65 | -7.7 | 0.25 | 45 |
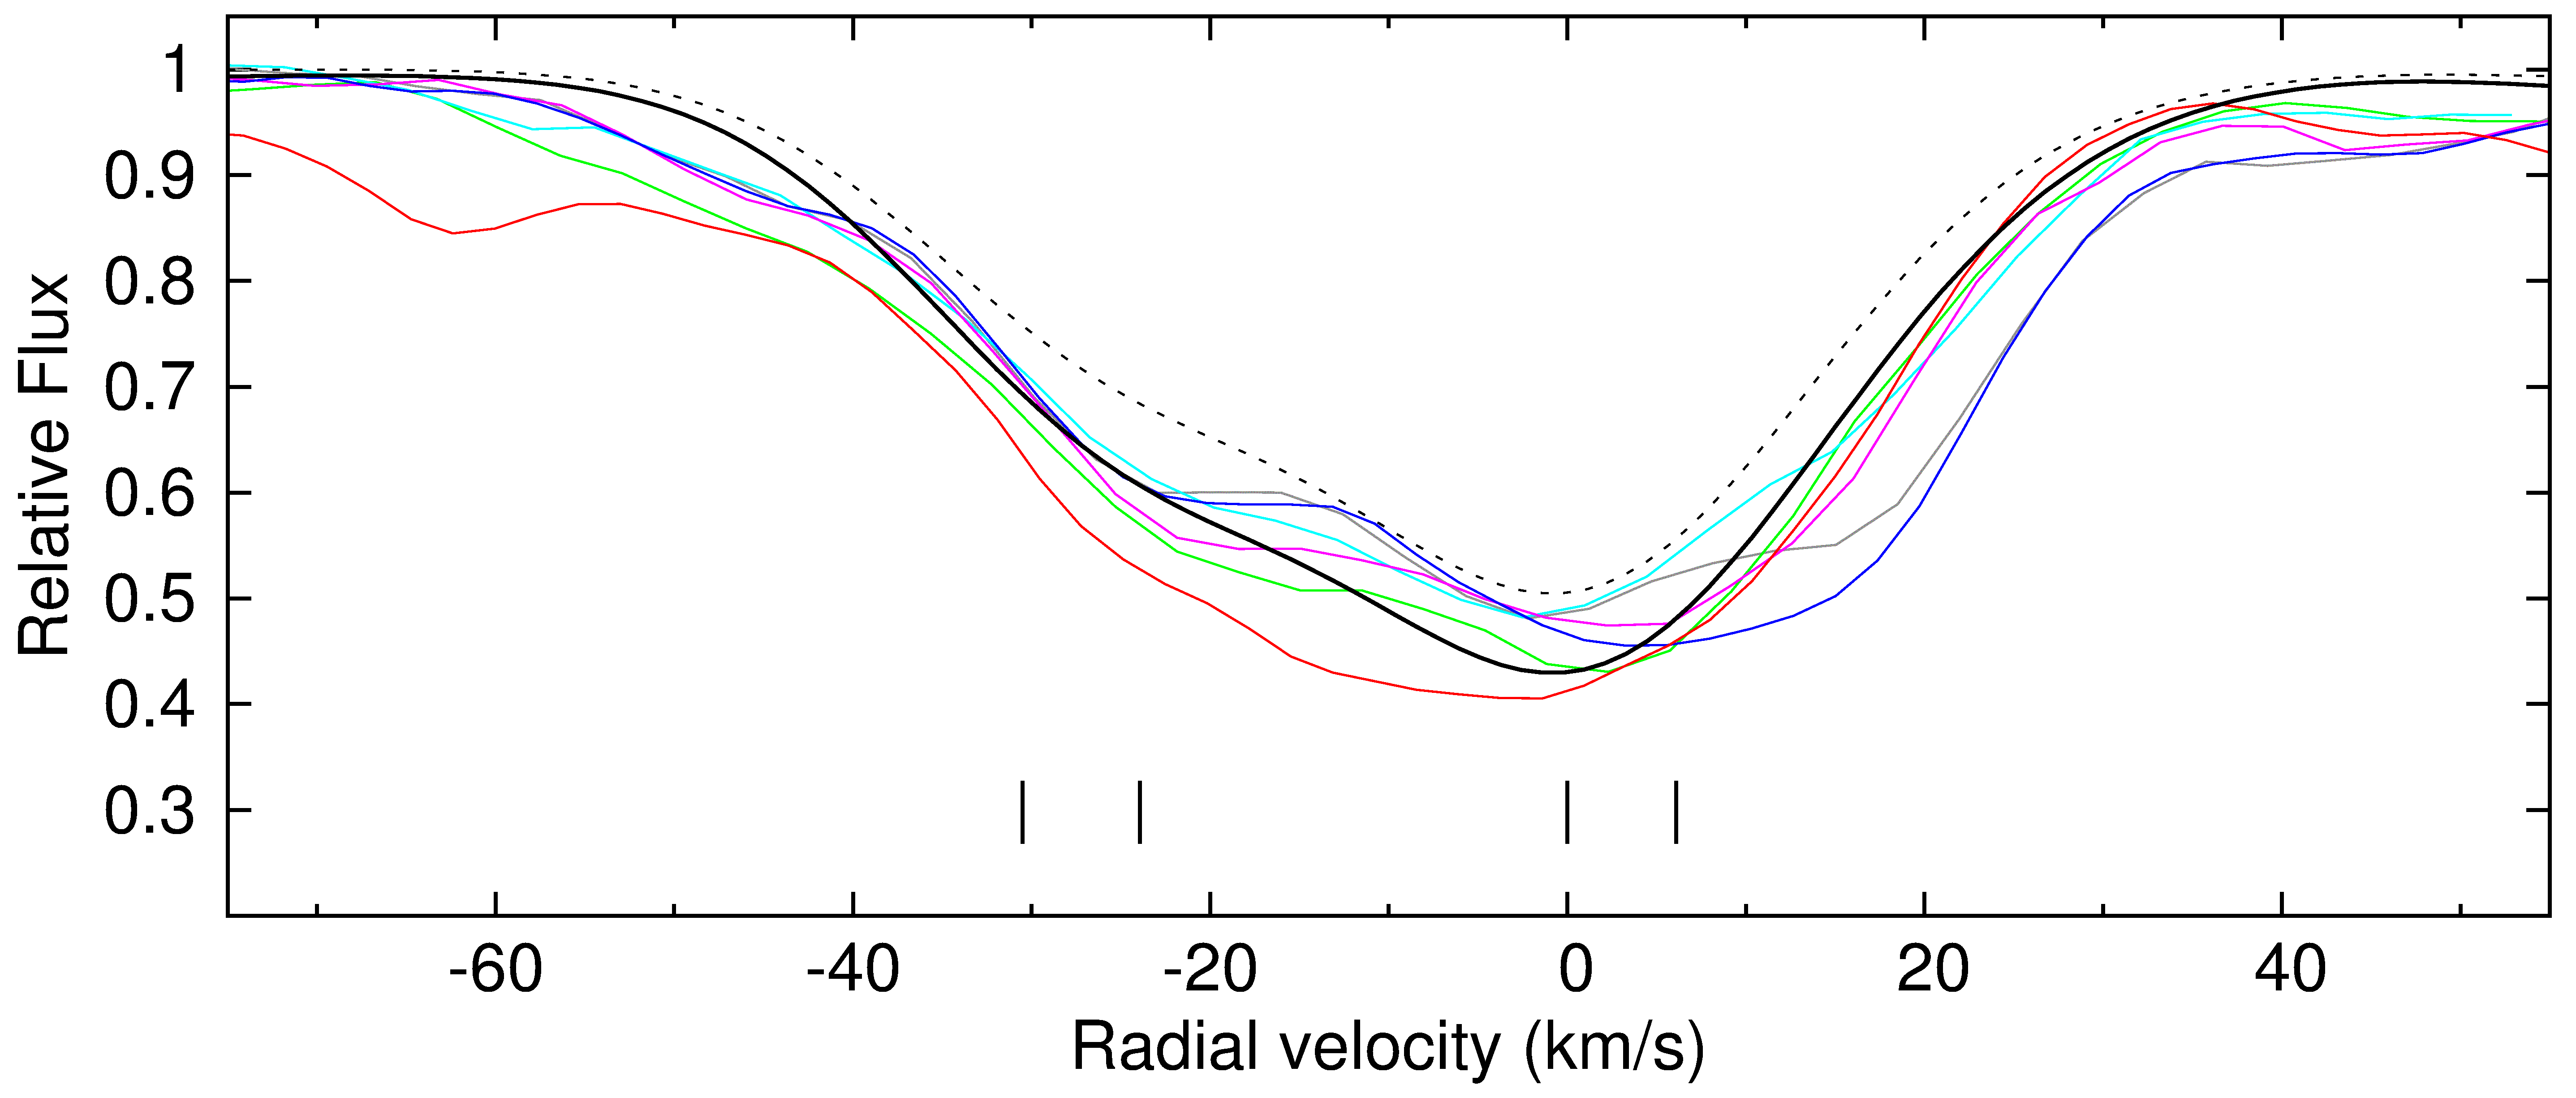
The profiles of seven narrow lines shortward of the (0,0) bandhead observed at the light maximum on September 2010 are displayed in Figure 11 (panel a) in radial velocity scaled relative to the systemic velocity (see Table 2). The lines are shifted by RV = –8.0 0.4 km s-1 relative to the systemic velocity. The blueshift and the width of these lines agree well with those observed for the circumstellar Phillips system lines in the spectrum of IRAS 22272+5435, RV = –8.4 0.5 km s-1 (Začs et al., 2009). This would lead one to conclude that the site of formation of the narrow Swan system lines is the AGB shell. However, in the spectra observed on November 2011 at the light minimum (color index maximum), the (0,0) Swan system lines are much stronger. Because most of them are blends at light minimum, we selected for quantitative comparison only three less blended lines from the eight lines measured in the spectrum at the light maximum. The measured radial velocities, FWHMs, and EWs are given in Table 6 and the profiles are compared in Figure 11 (panel a). As can be seen, the radial velocity of the blueshift lines relative to the systemic velocity is the same to within the 2 at the light maximum on September 2010 and at the light minimum on November 2011, RV = –7.5 0.6 km s-1, despite of the increased EWs and FWHMs at minimum light.
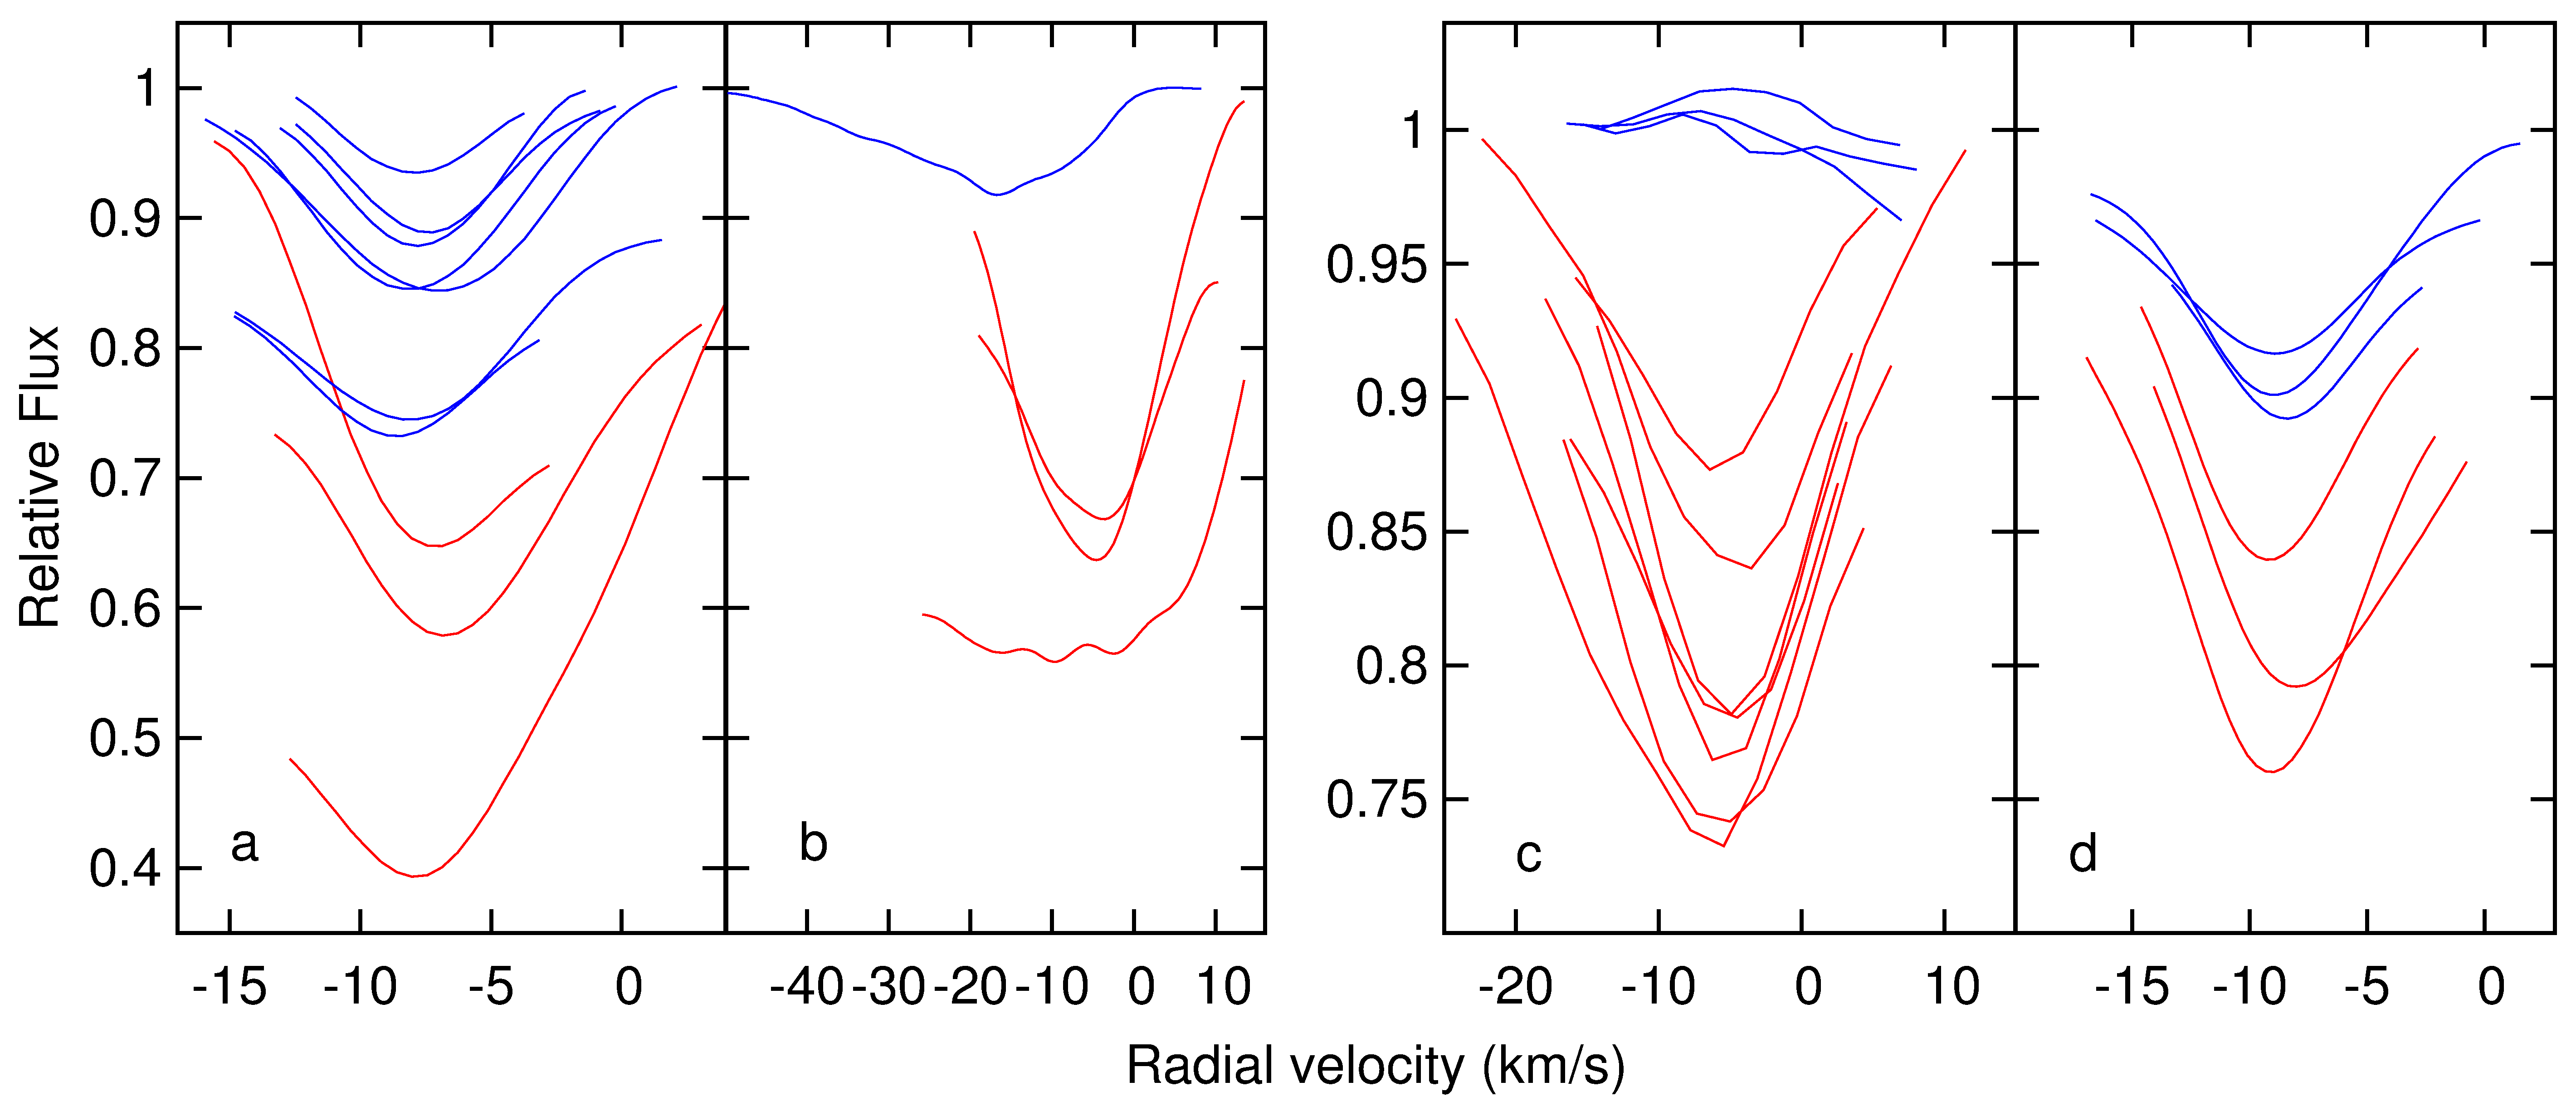
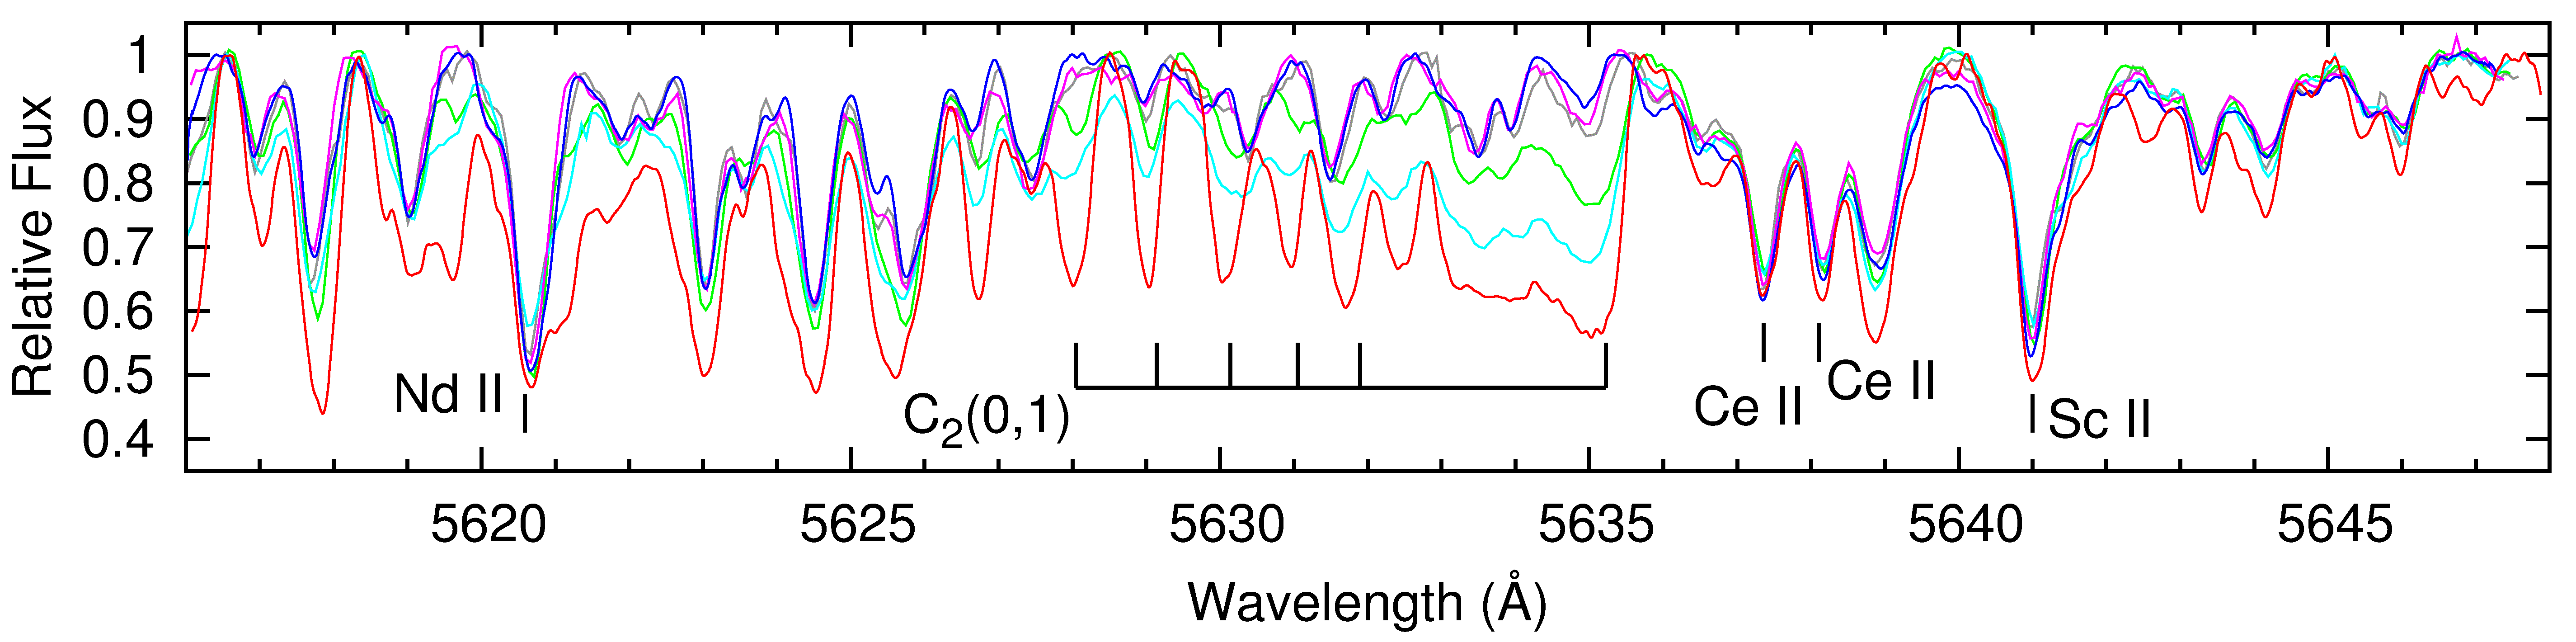
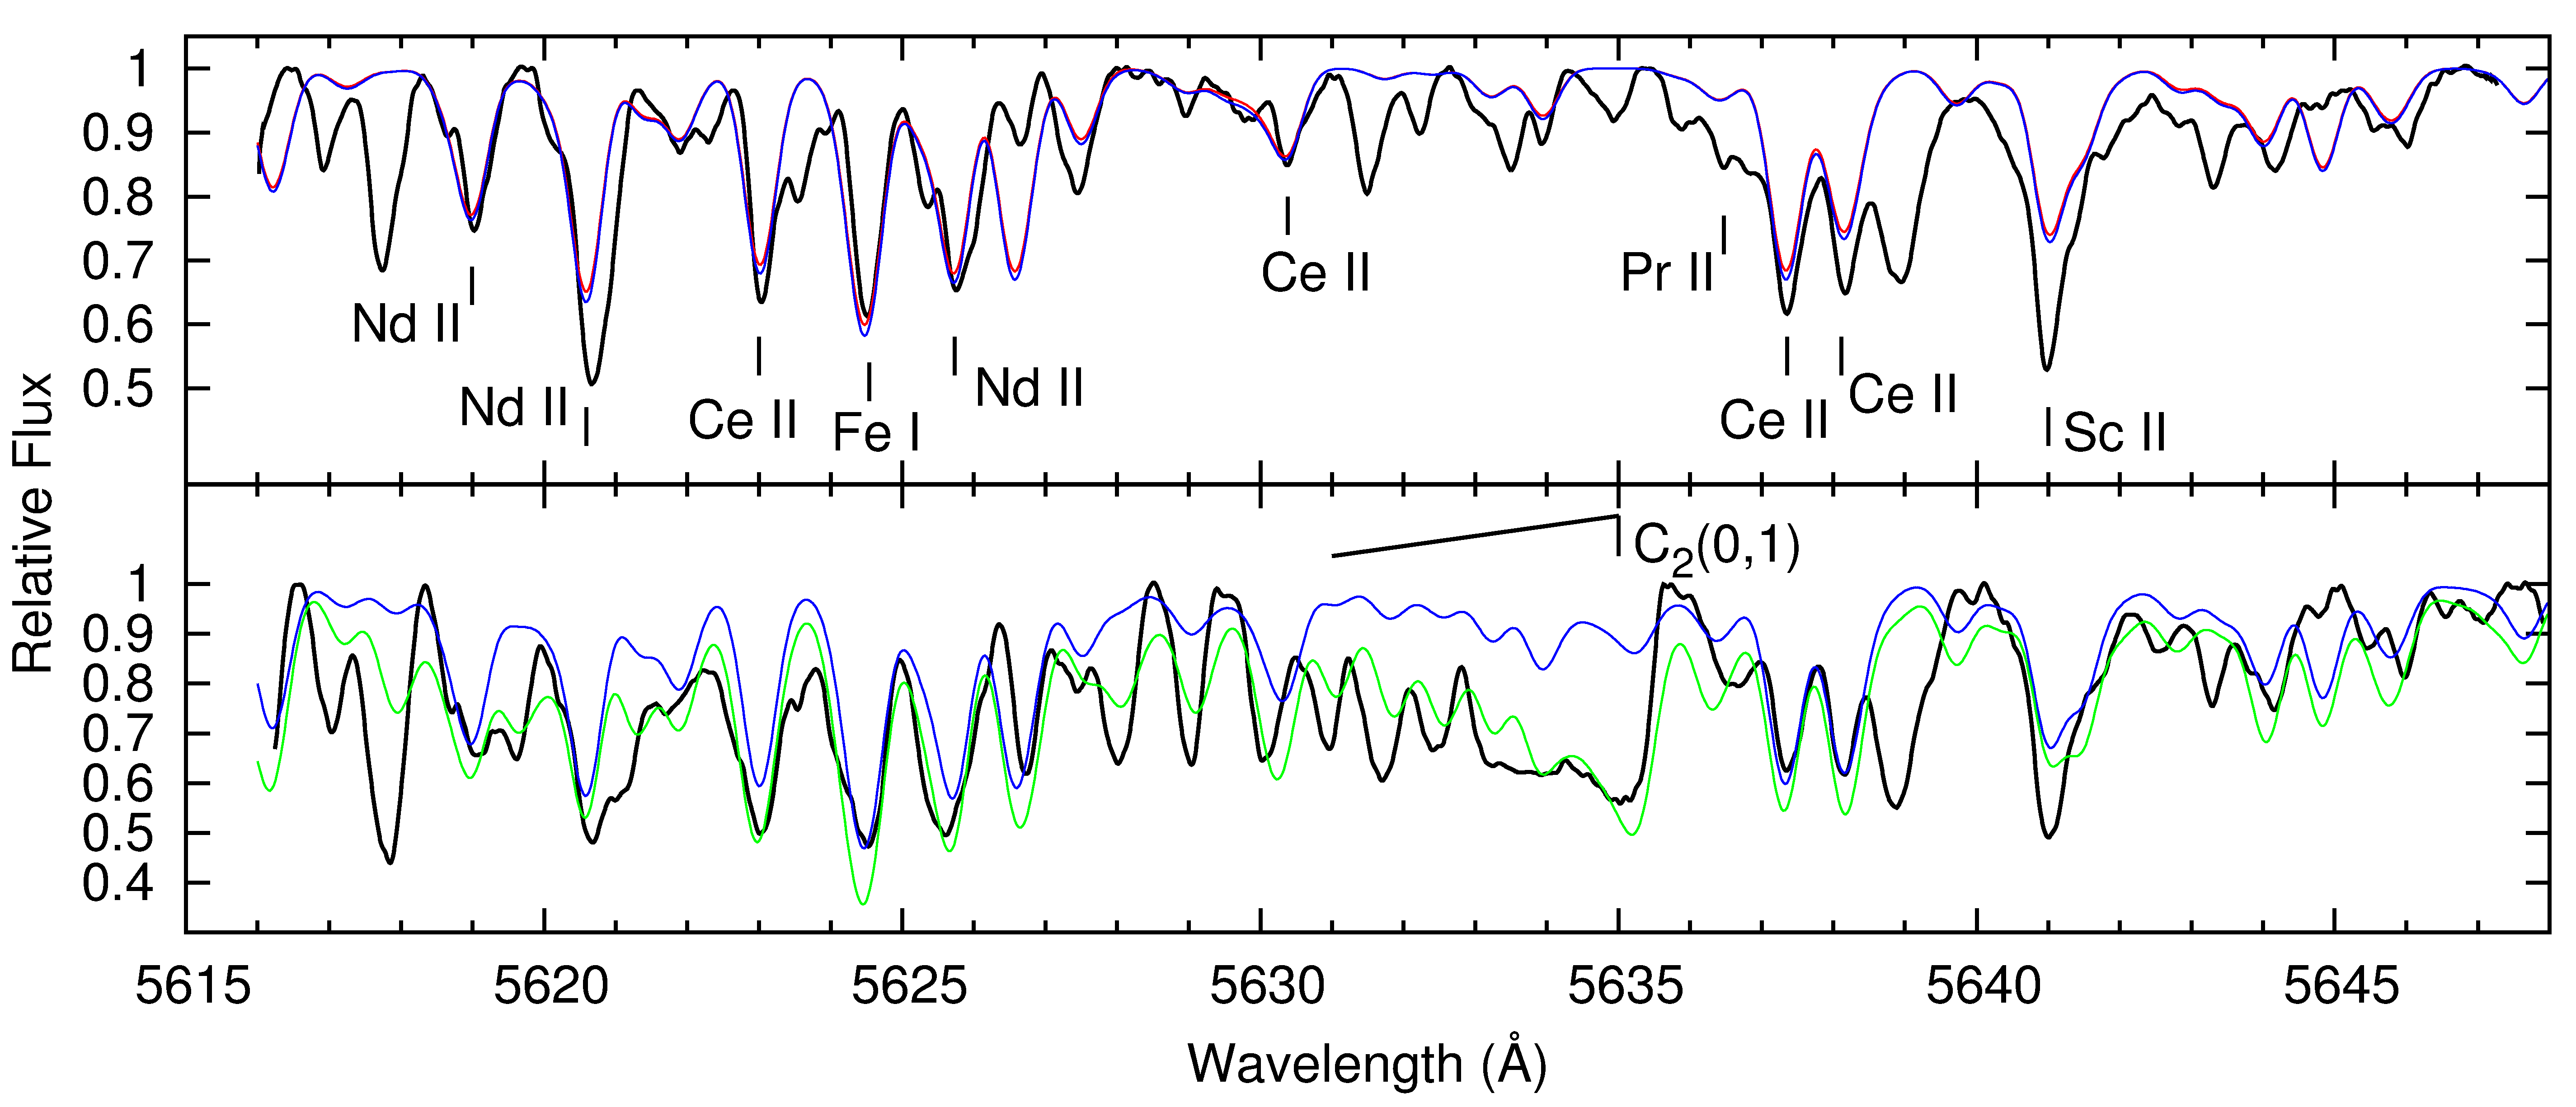
The spectra of IRAS 22272+5435 obtained in different epochs and phases display large changes around the position of the Swan System (0,1) band head (Figure 2). The spectra observed near the light maximum on September 2010, on February 2008, and on November 2002 are similar and with a low molecular contribution. The band head of the (0,1) Swan system is clearly seen, with an equivalent width of about 60 mÅ on average. However, other lines of the Swan system are too weak to be identified with certainty. The bandhead is blueshifted by about 17 km s-1 relative to the systemic velocity (Figure 11; panel b) in the spectrum observed on September 2010 and its equivalent width changes from 87 to 60, and then 40 mÅ in the spectra observed near the light maximums on November 2002/February 2008/September 2010. In the spectrum observed at the light minimum on November 2011 the bandhead and the lines of (0,1) system are extremely strong. The measured blueshift of the bandhead is about 10 km s-1 relative to the systemic velocity (lowest curve in Figure 11, panel b). Two less blended lines at 5629 and 5631 Å give the blueshift of 6 km s-1 on average relative to the systemic velocity for the line forming region.
The spectrum around the Swan system (0,1) bandhead was synthesized using the Kurucz (1993) and SAM12 models, and the comparison is given in Figure 12. A fit between the spectrum observed at the light maximum and the spectra calculated with the hot atmospheric model for = 5750 K (estimated temperature at maximum light) is quite good for most of the identified sprocess lines, indicating a correctness of the adopted sprocess abundances. However, the synthesized spectra have not reproduced the bandhead at 5635 Å and a number of weak lines of unknown nature. In addition, the synthesis of strong atomic lines is problematic, e.g. a poor fit for the feature at 5641 Å identified with the Sc II line. The spectra calculated with the Kurucz’s and the SAM12 models are similar, with the lines calculated with the SAM12 model being just a bit deeper. The spectrum observed at the light minimum on November 2011 was modeled with the cool SAM12 model for = 5250 K. In additional, the atmospheric model with = 4750 K was employed to reproduce formally the observed intensity of the bandhead. As can be seen, the calculated photospheric spectra with = 5250 K (estimated temperature at minimum light) and 4750 K have not reproduced the observed molecular spectrum at minimum light. The observed spectrum is blueshifted relative to the calculated ones and the molecular lines (e.g. at 5631.05 Å) are more narrow in comparison with those in the modeled photospheric spectrum. This argues that the site of formation of the Swan system (0,1) bandhead is outside the photosphere. At the same time, one does see from the atmospheric models calculated for different temperatures in the current region that the variability observed in the atomic lines (e.g. Ce II at 5637.36, 5638.11 Å) is partly because of temperature variation in the atmosphere of star.
| Species | Wavelength | LEP | Ref. | |
|---|---|---|---|---|
| ( Å ) | (eV) | |||
| Fe I | 5166.28 | 0.00 | -4.194 | K07 |
| Nd II | 5170.94 | 0.55 | -1.686 | MC |
| Fe I | 5171.60 | 1.48 | -1.792 | K07 |
| Pr II | 5175.27 | 0.22 | -1.241 | MC |
| Pr II | 5175.84 | 0.42 | -1.282 | MC |
| Gd II | 5176.29 | 1.06 | -0.739 | DLSC |
| Nd II | 5618.99 | 1.77 | -0.649 | HLSC |
| Nd II | 5620.59 | 1.54 | -0.309 | XSCL |
| Ce II | 5623.00 | 0.96 | -1.150 | PQWB |
| Ce II | 5623.03 | 0.56 | -3.260 | PQWB |
| Fe I | 5624.54 | 3.42 | -0.754 | K07 |
| Nd II | 5625.73 | 0.93 | -1.119 | HLSC |
| Ce II | 5630.38 | 1.64 | -0.940 | PQWB |
| Pr II | 5636.47 | 1.05 | -1.062 | BLQS |
| Ce II | 5637.36 | 1.4 | -0.501 | PQWB |
| Ce II | 5638.11 | 0.6 | -1.720 | PQWB |
| Pr II | 5638.79 | 0.63 | -1.070 | MC |
| Sc II | 5641.00 | 1.5 | -1.131 | LD |
| Nd II | 6382.06 | 1.44 | -0.750 | HLSC |
| Fe II | 6383.72 | 5.55 | -2.070 | BSScorr |
| Nd II | 6385.15 | 1.16 | -0.770 | MC |
| Nd II | 6385.19 | 1.6 | -0.360 | XSCL |
| Sm II | 6389.83 | 1.17 | -1.959 | MC |
| Nd II | 6389.97 | 1.5 | -0.770 | HLSC |
| La II | 6390.48 | 0.32 | -1.410 | LBS |
| Ce II | 6390.61 | 0.61 | -2.41 | PQWB |
| Fe I | 6393.60 | 2.43 | -1.432 | K07 |
| Pr II | 6397.97 | 1.05 | -0.940 | BLQS |
| Fe I | 6400.00 | 3.6 | -0.289 | K07 |
| Sm II | 6406.25 | 1.36 | -1.339 | LD-HS |
| Fe I | 6411.65 | 3.65 | -0.594 | K07 |
| Fe II | 6416.92 | 3.89 | -1.877 | BSScorr |
| Fe I | 6419.95 | 4.73 | -0.240 | K07 |
| Fe I | 6421.35 | 2.28 | -2.027 | K07 |
| Ti II | 6559.56 | 2.05 | -2.175 | K10 |
| Pr II | 6566.77 | 0.22 | -1.721 | MC |
| Ce II | 7850.03 | 0.74 | -1.289 | PQWB |
| Ce II | 7857.55 | 0.9 | -1.289 | PQWB |
| Ce II | 7860.98 | 0.7 | -2.560 | PQWB |
| Y II | 7881.88 | 1.84 | -1.569 | K11 |
| Ce II | 7898.97 | 0.9 | -1.119 | PQWB |
| Nd II | 7900.39 | 1.35 | -1.500 | MC |
3.6 CN Red system lines
A comparison of the observed spectra revealed a significant intensity variation of lines in the wavelength region around 6400 Å (Figure 3). Most of the variability was found to be in the lines of the CN Red system. We varied atmospheric models and measured radial velocity of selected lines again to understand the reason of variation. The spectrum observed at the light maximum on September 2010 was synthesized with the hot atmospheric model for = 5750 K (estimated temperature at maximum light). The fit among the calculated and the observed spectra is given in Figure 13. We conclude that the intensity of CN Red system lines as calculated with the hot Kurucz (1993) and SAM12 models are to weak to be identified in the spectra. In the spectrum observed on September 2010, weak emissions are suspected at the positions of CN (5,1) lines. We examined the presence of such emissions in the rest spectra and confirmed it in the spectra observed at light maximum on February 2008 and November 2002. On the other hand, a good fit between observed and calculated spectra was found for the sprocess elements (Nd, La, Pr, Sm) and for the neutral and ionized iron lines (see list in Table 7), confirming the correctness of the adopted gravity, metallicity, and abundances of the selected sprocess elements. The fit between the spectrum observed at the light minimum on November 2011 and the synthesized spectra is shown in Figure 13 (bottom panel). We concluded, that the synthesized spectrum calculated with the cool atmospheric model for = 5250 K (estimated temperature at minimum light) reproduce correctly the atomic lines, however, the modeled molecular lines are too weak in comparison with the observed ones. At the light minimum, CN Red system lines are strong and there is significant blending with the atomic lines in this region. We concluded, that the synthesized spectrum calculated with the cool atmospheric model for = 5250 K reproduces correctly the atomic lines but the modeled molecular lines are too weak in comparison with the observed ones. Even the spectrum calculated with the extremely cool model for = 4750 K does not produce strong molecular lines. In addition, the observed molecular lines are more narrow than the calculated photospheric lines and they are blueshifted relative to the systemic velocity (Table 6). The radial velocity measurements for selected CN Red system lines confirmed a blueshift of the site where the CN (5,1) lines are formed at light minimum, RV = –5.5 (Figure 11, panel c).
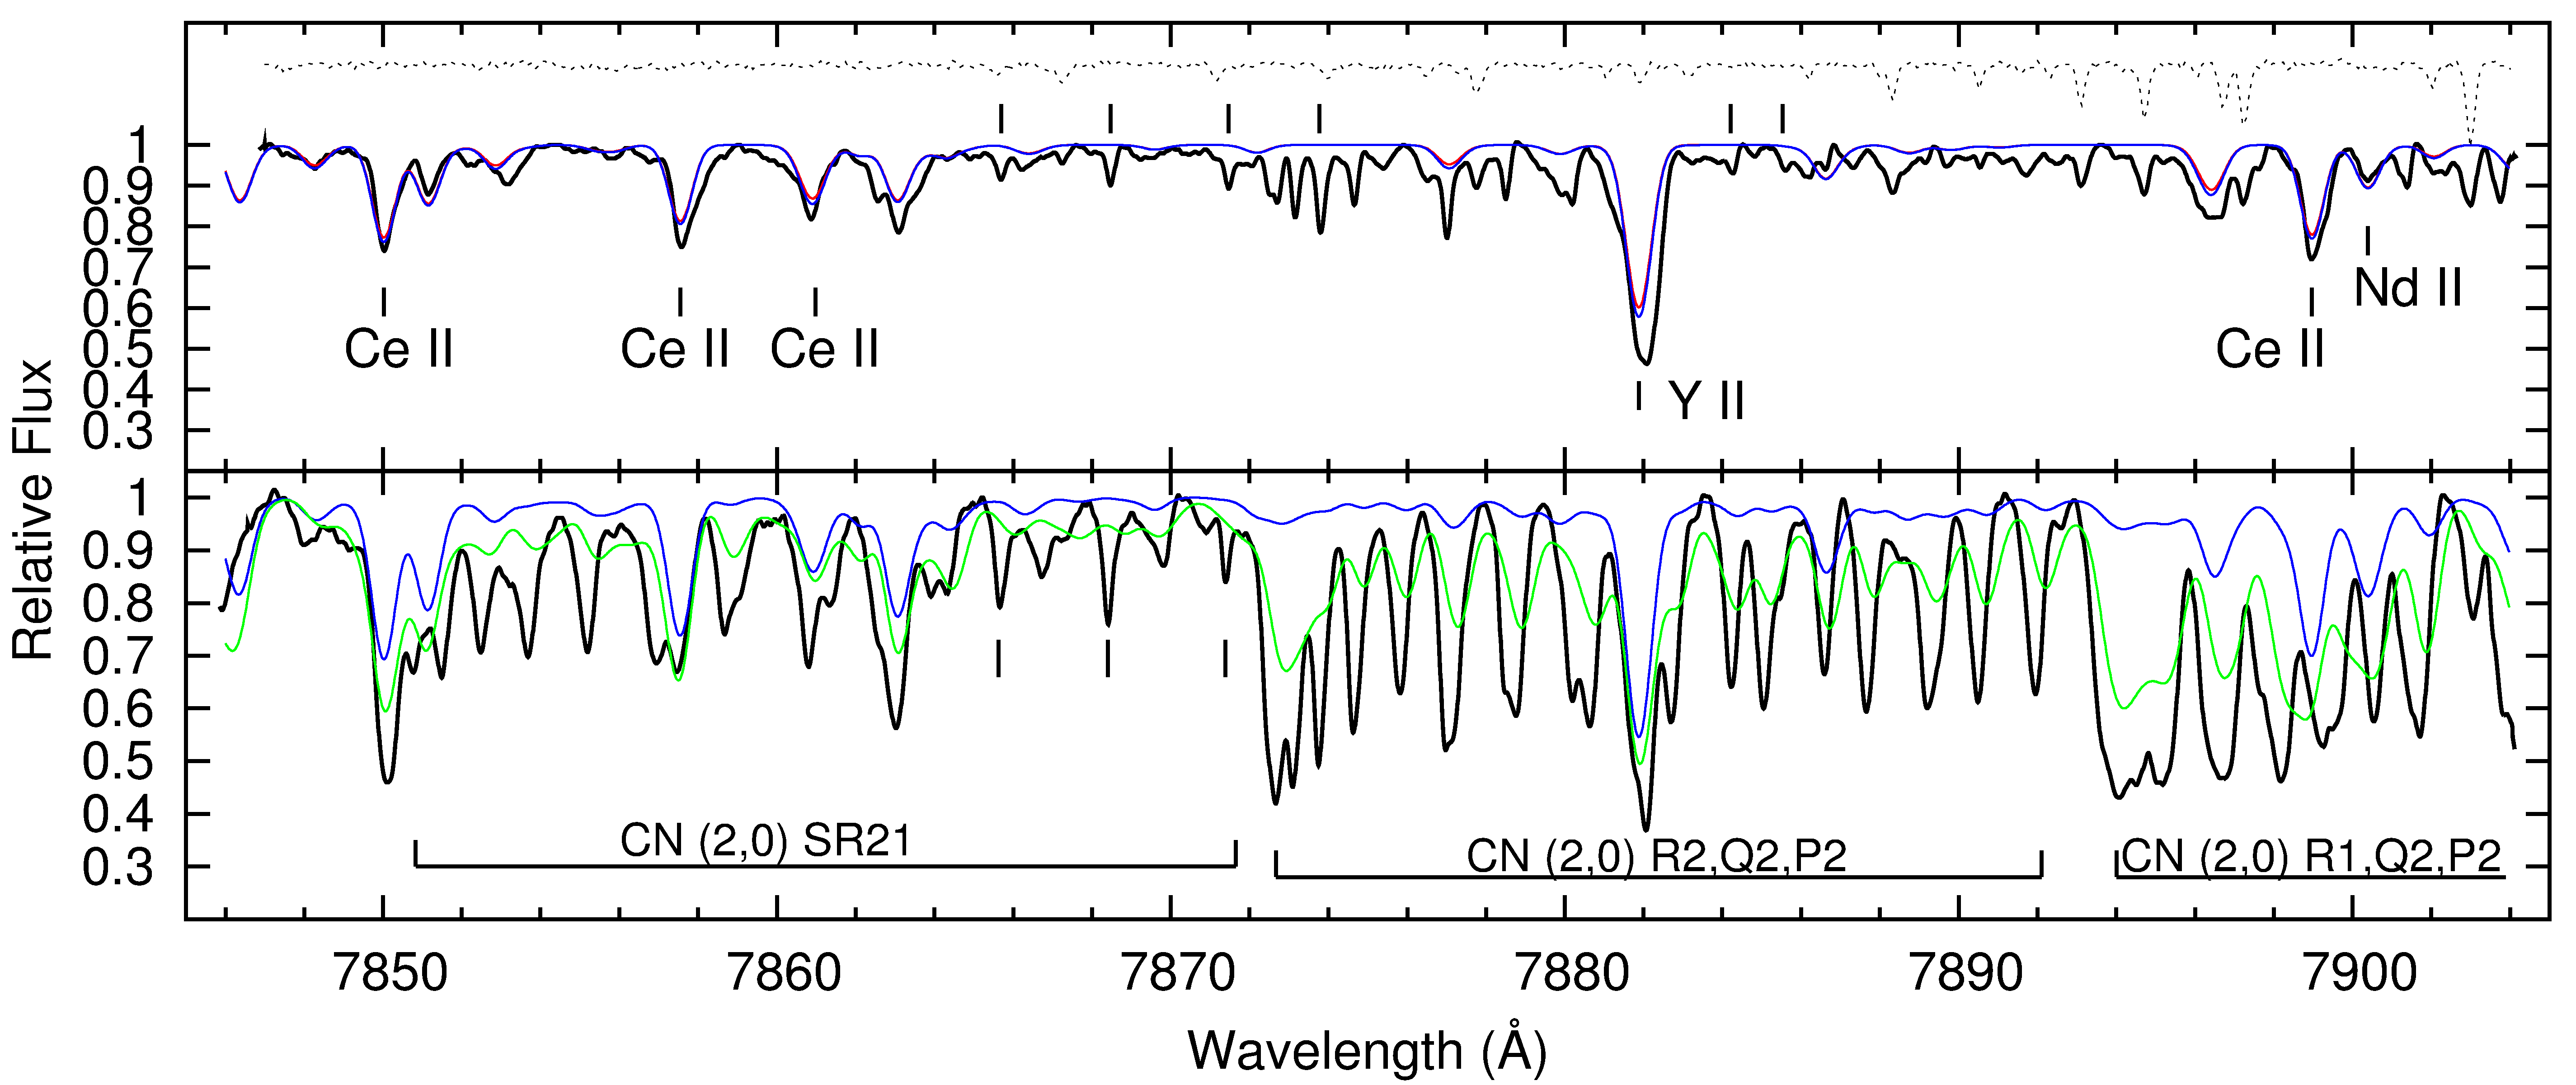
A comparison of the observed spectra for IRAS 22272+5435 in the near-infrared region around 7900 Å revealed a dramatical intensity variation. In Figure 14 is displayed the spectra observed at the light maximum on September 2010 and at the light minimum on November 2011, along with a telluric spectrum observed simultaneously (upper panel). The atomic lines (see Table 7) and the narrow CN Red System (2,0) lines (see Table 6) were identified in the spectrum observed at light maximum. A fit between the observed spectrum and that calculated for the hot model with = 5750 K (estimated temperature at maximum light) confirms in general the accepted sprocess abundances and some previously noted problems in fitting the profiles for strong atomic lines (Figure 14). We see that photospheric CN lines are too weak in the synthetic spectrum calculated with the hot atmospheric model to expect them to be visible in the photosphere of the star. Thus their presence points to a non-photospheric formation region. The width and shift of the identified CN (2,0) lines confirm their circumstellar origin, with RV = –8.6 (Figure 11; panel d). The CN (2,0) Red system lines are extremely strong in the spectrum observed at the light minimum on November 2011 and the atomic lines are significantly blended in that wavelength region. The spectra calculated with the cool atmospheric model for = 5250 K (estimated temperature at minimum light) and with the extra cool atmospheric model for = 4750 K have not reproduced the observed spectrum – the observed CN lines are much stronger and narrower in comparison with the modeled photospheric lines. The radial velocity measured in the spectrum observed on November 2011, using the three less blended CN lines, confirms a blueshifted of the line forming site, with RV = –8.4 , relative to the systemic velocity (Table 6). Thus, the blueshift of the CN lines relative to the systemic velocity is the same within 1 at the light maximum and at the light minimum, despite of the large changes in their EWs and FWHMs.
4 Discussion and conclusions
A time series of high-resolution spectra in the optical wavelength region was collected and analyzed for the cool proto-planetary nebula IRAS 22272+5435. In total seventeen spectra were observed between 2002 November and 2011 November and the phase of pulsation was estimated for each spectrum based upon simultaneous light and radial velocity monitoring. Inspection of the spectra revealed a significant intensity variation in the molecular and atomic lines. The spectral variations could be an objective reason of the contradictory spectral classifications and abundances published for the central star (Skiff, 2014; Začs et al., 1995; Reddy et al., 2002).
The Swan system and the CN Red system lines are stronger near the light minimum when the star is cooler according to the observed color indices. The effective temperature was accepted to be = 5750 K at maximum light for the central star and the probable variation of the effective temperature due to the pulsation was estimated using the color index (), 500 K. A grid of self consistent hydrostatic atmospheric models was calculated for a range of effective temperatures to reproduce approximately the maximum changes of the atmospheric structure for the central star over the pulsation cycle. The photospheric spectrum of the central star was synthesized using models for the effective temperatures between 4750 and 5750 K, and these modeled spectra were compared with the observed spectra to help clarify the reasons for the spectroscopic variability. The observed intensity variations in Swan system and CN Red system lines were found to be much larger than could be due to the temperature variation in the atmosphere of the central star. In addition, the observed molecular lines are more narrow in comparison with the photospheric atomic lines and they are blueshifted relative to the photospheric velocity. Thus, the site of the formation of molecular lines should be outside the atmosphere of the central star. The intensity variations in the atomic lines seem to be mostly due to variations in the effective temperature during the pulsation cycle. However, the profiles of the strong atomic lines bear evidence of shock waves in the atmosphere of IRAS 22272+5435.
The profiles of strong low-excitation atomic lines were found to be split into two or more components. The intensity and radial velocity of these components depends upon the pulsation phase. The velocities range between about 50 and +50 km s-1 with the most common blueshifts and redshift of about 10 km s-1. The profiles calculated using the hydrostatic atmospheric models were not able to reproduce the observed multi-component features. Moreover, intensity variations in a timescale of days were observed in the split profiles. It is generally accepted that complex line profiles in the spectra of long-period variables are related to the shock wave and the associated velocity gradient in the atmosphere of the pulsating star. The occurrence of shock fronts for the Mira variables has been suspected from observations of emission lines around the light maximum (Richter & Wood, 2001) and from splitting of the profiles of molecular and atomic lines (Hinkle et al., 1982; Alvarez et al., 2000). The role of velocity fields in the formation of split absorption lines has been confirmed thanks to the cross-correlation technique and monitoring of Miras (Alvarez et al., 2000). Alvarez et al. (2001) observed the line-splitting phenomena for 54 % stars in the sample of 81 long-period variables (LPV) of various periods, spectral types, and brightness ranges, and most of them display emission in the Balmer lines. The measured velocity differences between the blue and red peaks for LPVs range from 10 to 25 km s-1. The velocity of the shock front is a matter of debate, because a large shock-wave velocity of the order of 60 km s-1 is required to ionize the hydrogen atoms (Gillet et al., 1989; Alvarez et al., 2001). Nowotny et al. (2005a, b) studied the atmospheric dynamics of carbon-rich Miras using model atmospheres and synthetic line profiles and confirmed a splitting phenomena in the absorption lines. The models confirmed propagation of the shock (compression) waves throughout the stellar atmosphere, with the outward and downward waves reaching amplitudes of about 20 and 10–15 km s-1, respectively. Thus, the observed splitting and short-term variability in low-excitation atomic lines provide strong evidence that shock waves are present in the outer layers of the atmosphere of the central star IRAS 22272+5435. The variable emission features inside the shell-like profile of the Balmer line could be one more indication of the propagation of shock waves through the photosphere of this pulsating star (Lèbre et al., 1996). The lack of line splitting phenomena in the high excitation-potential lines is most likely because these lines are formed deeper in the atmosphere.
The appearance of strong and variable absorption lines of carbon-bearing molecules in the spectrum of IRAS 22272+5435 raised the question about their site of formation. The Swan system band heads and the CN (2,0) Red system lines are weak in the spectra observed at the light maximum. The photospheric spectrum calculated with the atmospheric model suitable for the central star at the light maximum ( = 5750 ), when the star is hottest, has not reproduced the observed intensity of the band heads – the model for lower effective temperature is needed. Photospheric lines of the CN Red system calculated with the model for = 5750 are below the level of detection. The lines of the CN Red system (5,1) are suspected to be in a weak emission at the light maximum on November 2002, February 2008, and September 2010. Weak and narrow Swan system (0,0) and CN Red system (2,0) lines identified in the spectra at the light maximum on September 2010 are blueshifted by 8.3 km s-1 relative to the systemic velocity, and are attributed to formation in the AGB shell with the expansion velocity in range between 7.5 to 9.0 km s-1 estimated using CO emission lines by Hrivnak & Bieging (2005). The site of formation of the (0,0) band head at light maximum, which is blueshifted relative to the systemic velocity by about 17 km s-1, is uncertain.
The Swan system band heads and lines of the system (0,1) are extremely strong and blueshifted relative to the systemic velocity in the spectra observed at light minimum. The spectrum calculated with the atmospheric model for effective temperature suitable for the central star of IRAS 22272+5435 at the light minimum ( = 5250 ), when the star is the coolest, has not reproduced the intensity of the band heads – a lower effective temperature is needed. A blueshift measured using less blended lines was found to be RV = –7.0 km s-1 relative to the systemic velocity, which is slightly lower in comparison with that measured at the light maximum; However, agrees still within uncertainty with the expansion velocity of the AGB shell. Notice that the expansion velocity of the AGB remnant estimated using a number of and CN absorption lines by Bakker et al. (1997) and Reddy et al. (2002) ranges between 6.5 to 11.4 km s-1 relative to the the systemic velocity accepted in this paper, = -40.8 . Notice, too, that Nakashima et al. (2012) introduced two circumstellar expanding structures for their IRAS 22272+5435 model with the expansion velocities of 7.5 and 10.5 , respectively. Thus, the strong lines observed at light minimum could be attributed to formation in the AGB ejecta according to the measured blueshift. However, the observed intensity variation in time and phase dependence reject to attribute them to formation in the AGB shell which is located at the distance of about cm from the star (Ueta et al., 2001; Nakashima et al., 2012). We concluded instead that the strong features observed at light minimum were formed in a cool outflow triggered by pulsation. For the measured CN lines our conclusion is similar. The CN Red system lines at light minimum are strong and the spectra calculated with the cool atmospheric model ( = 5250 ) and with the extra cool model ( = 4750 ) have not reproduced the intensity of the observed lines. In addition, the observed CN lines are more narrow than would be expected in the atmosphere of the star and they are blueshifted. The blueshift value for the CN lines is the same within uncertainties at both the light minimum and at the light maximum. The strong and blueshifted CN lines are apparently formed near the star, e.g. in the cool outflow, with an expansion velocity similar to that measured for the AGB ejecta of IRAS 22272+5435. Thus the molecular lines which are formed in the pulsationally-triggered cool outflow and those formed in the AGB shell are overlapping. Spectra of higher resolution are needed to confirm such an interpretation.
References
- Alvarez et al. (2000) Alvarez, R., Jorissen, A., Plez, B., Gillet, D., & Fokin, A. 2000, A&A, 362, 655
- Alvarez et al. (2001) Alvarez, R., Jorissen, A., Plez, B., Gillet, D., Fokin, A., & Dedecker, M. 2001, A&A, 379, 305
- Bakker et al. (1997) Bakker, E.J., van Dishoeck, E.F., Waters, L.B.F.M., & Schoenmaker, T. 1997, A&A, 323, 469
- Borysow et al. (1997) Borysow, U.G., Jørgensen, U.G., & Zheng, C. 1997, A&A, 324, 185
- Dayal et al. (1998) Dayal, A., Hoffmann, W.F., Bieging, J.H., et al. 1998, ApJ, 492, 603
- Gillet et al. (1989) Gillet, D., Lafon, J.P., David, P. 1989, A&A, 220, 185
- Harris et al. (2003) Harris, G.J., Pavlenko, Y.V., Jones, H.R.A., & Tennyson, J. 2003, MNRAS, 344, 1107
- Harris et al. (2006) Harris, G.J., Tennyson, J., & Kaminsky, B.M. 2006, MNRAS, 367, 400
- Hinkle et al. (1982) Hinkle, K.H., Hall, D.N.B., & Ridgway, S.T. 1982, ApJ, 252, 697
- Hrivnak & Kwok (1991) Hrivnak, B.J., & Kwok, S. 1991, ApJ, 371, 631
- Hrivnak et al. (1994) Hrivnak, B.J., Kwok, S., & Geballe, T.R. 1994, ApJ, 420, 783
- Hrivnak & Bieging (2005) Hrivnak, B.J., & Bieging, J.H. 2005, ApJ, 624, 331
- Hrivnak & Reddy (2003) Hrivnak, B.J., & Reddy, B.E. 2003, ApJ, 590, 1049
- Hrivnak et al. (2013) Hrivnak, B.J., Lu, W., Sperauskas, J., et al. 2013, ApJ, 766, 116
- Johnson (1966) Johnson, H.L. 1966, ARA&A, 4, 193
- Jørgensen & Larsson (1990) Jørgensen, U.G., & Larsson, M. 1990, A&A, 371, 222
- Kupka et al. (1999) Kupka, F., Piskunov, N., Ryabchikova, T.A., Stempels, H. C.; & Weiss, W. W. 1999, A&AS, 138, 119
- Kurucz (1993) Kurucz, R.L. 1993, KurCD, 1–22, Smithsonian Astrophysical Observatory
- Kurucz (2005) Kurucz, R.L. 2005, MSAIS, 8, 73
- Kwok (1993) Kwok, S. 1993, ARA&A, 31, 63
- Lèbre et al. (1996) Lèbre, A., Mauron, N., Gillet, D., & Barthès, D. 1996, A&A, 310, 923
- Lebzelter et al. (2014) Lebzelter, T., Nowotny, W., Hinkle, K.H., et al. 2014, A&A, 567, A143
- Loidl et al. (2001) Loidl, R., Lancon, A., Jørgensen, U.G. 2001, A&A, 371, 1065
- Meixner et al. (1997) Meixner, M., Skinner, C.J., Graham, J.R., et al. 1997, ApJ, 482, 897
- Nakashima et al. (2012) Nakashima, J., Koning, N, Volgenau, N.H., et al. 2012, ApJ, 759, 61
- Neckel & Klare (1980) Neckel, Th., & Klare, G. 1980, A&AS, 42, 251
- Nowotny et al. (2005a) Nowotny, W., Aringer, B., Höfner, S., et al. 2005a, A&A, 437, 273
- Nowotny et al. (2005b) Nowotny, W., Lebzelter, T., Hron, J., & Höfner, S. 2005b, A&A, 437, 285
- Pavlenko (1997) Pavlenko, Y.V. 1997, Ap&SS, 253, 43
- Pavlenko (2003) Pavlenko, Ya.V. 2003, ARep, 47, 59
- Pavlenko & Zhukovska (2003) Pavlenko, Ya.V., & Zhukovska, S.V. 2003, KFNT, 19, 28
- Pereira et al. (2012) Pereira, C.B., Gallino, R., Bisterzo, S. 2012, A&A, 538, A48
- Piskunov et al. (1995) Piskunov, N. E., Kupka, F., Ryabchikova, T. A., Weiss, W. W., & Jeffery, C. S. 1995, A&AS, 112, 525
- Reddy et al. (2002) Reddy, B.E., Lambert, D.L., Gonzalez, G., & Yong, D. 2002, ApJ, 564, 482
- Richter & Wood (2001) Richter, He., & Wood, P.R. 2001, A&A, 369, 1027
- Schmidt et al. (2013) Schmidt, M.R., Začs, L., Pułecka, M., & Szczerba, R. 2013, A&A, 556, 46
- Skiff (2014) Skiff, B.A. 2014, CDS/ADS Collection of Electronic Catalogues, 1, 2023
- Sneden et al. (1976) Sneden, C., Johnson, H.R., & Krupp, B.M. 1976, ApJ, 204, 281
- Ueta et al. (2000) Ueta, T., Meixner, M., & Bobrowsky, M. 2000, ApJ, 528, 861
- Ueta et al. (2001) Ueta, T., Meixner, M., Hinz, P.M., et al. 2001, ApJ, 557, 831
- Začs et al. (1995) Začs, L., Klochkova, V.G., & Panchuk, V.E. 1995, MNRAS, 275, 764
- Začs et al. (1999) Začs, L., Schmidt, M.R., & Szczerba, R. 1999, MNRAS, 306, 903
- Začs et al. (2009) Začs, L., Sperauskas, J., Musaev, F.A., et al. 2009, ApJ, 695, L203