Influence of hydrostatic pressure on the bulk magnetic properties of Eu2Ir2O7
Abstract
We report on the magnetic properties of Eu2Ir2O7 upon the application of hydrostatic pressure by means of macroscopic and local-probe techniques. In contrast to previously reported resistivity measurements, our dc magnetization data unambiguously demonstrate a non-monotonic -dependence for , i. e., the critical transition temperature to the magnetic phase. More strikingly, we closely reproduce the recently calculated behaviour for under the assumption that lowers the ratio (i. e., Coulomb repulsion energy over electronic bandwidth). Zero-field muon-spin spectroscopy measurements confirm that the local magnetic configuration is only weakly perturbed by low values, in agreement with theoretical predictions. The current results experimentally support the preservation of a -in/-out ground state and, simultaneously, a departure from the single-band model across the accessed region of the phase diagram.
pacs:
62.50.-p, 71.30.+h, 75.40.Cx, 76.75.+iThe arrangement of magnetic moments at the vertices of a pyrochlore lattice (i. e., a geometrically-frustrating crystalline structure composed of corner-sharing tetrahedra) leads to a great variety of exotic electronic ground states for O7 materials Gar10 . One important finding common to several families of these oxides is that changes in , the ionic radius of the rare-earth ion , gradually tune the local crystalline environment around the transition metal ion and the overall electronic behaviour of the compound, accordingly. This is verified for ions belonging to the (e. g., Mo) Kez06 ; Pra14 and (e. g., Ir) Yan01 ; Mat11 ; Wit14 ; Tak14 groups. Here, the characteristic temperature for the development of a MIT (metal-to-insulator transition) is directly controlled by the average value related to a gradual substitution Kat00 ; Mor01 ; Han07 ; Ued15 . However, a chemical dilution is generally delicate to handle as it necessarily introduces a non-negligible degree of quenched disorder, possibly detrimental for most of the intrinsic physical properties under investigation. Moreover, ions may also be characterized by localized magnetic moments arising from their incomplete electronic shells and this fact may influence measurements when the actual magnetic properties are being studied.
These aspects are particularly relevant as the MIT in Mo2O7 and Ir2O7 is associated with a dramatic change in the magnetic behaviour as well. Antiferromagnetic insulating and metallic paramagnetic states compose indeed the two main regions of the EPD (electronic phase diagram) of Ir-based pyrochlores Mat11 , even if this is only a very simplistic description. Theory predicts that comparable energy scales for the Coulomb repulsion and the spin-orbit coupling make the EPD of pyrochlore iridates extremely rich with exotic states. In the insulating regime, a non-collinear state is theoretically predicted Wan11 ; Wit12 ; Wit13 and experimentally claimed Sag13 ; Dis14 for Ir magnetic moments, pointing along the local directions all inside or all outside the tetrahedron at whose vertices they sit (-in/-out configuration). Theory suggests that such an arrangement is necessary for the achievement of topologically non-trivial properties such as, e. g., the Weyl semimetallic phase Wan11 ; Sus15 .
A cleaner structural approach in order to fine-tune the ground state of the system is to vary (external pressure). This method has been very successful for = Mo Ish04 ; Ape06 ; Mir06 ; Igu09 and, more recently, for the case of Ir Sak11 ; Taf12 where gradually suppresses the insulating state and triggers metallicity in several compounds Taf12 ; Ued15 . Transport properties have been mainly discussed in the literature and, although the trend is clear, a purely metallic phase is never properly achieved. Moreover, discrepancies exist among the results for different compounds. While is clearly sensitive to pressure for Sm2Ir2O7, Nd2Ir2O7, and Pr2Ir2O7 (and intermediate compositions) Ued15 , no sizeable effect of is reported for this quantity in Eu2Ir2O7 Taf12 . Finally, a detailed investigation of the magnetic properties of these compounds under is still missing.
In this paper we focus on the magnetic properties of Eu2Ir2O7 under pressure, both from macroscopic (dc magnetometry) and local (SR, muon-spin spectroscopy) perspectives. The absence of a localized magnetic moment from shells in Eu2Ir2O7 is a great advantage in the study of the intrinsic magnetic properties of the Ir sublattice. From our magnetization measurements, we deduce a clearly non-monotonic -dependence of pointing to its departure from Taf12 . As striking result, we closely reproduce the behaviour recently reported for from relativistic LDA (local density approximation) + DMFT (dynamical mean-field theory) calculations Shi15 under the assumption that linearly influences the ratio ( representing the electronic bandwidth). By confirming this theoretical scenario, our measurements support the departure from the single-band model for iridates Wit14 ; Kim08 , in favour of a hybridized state between and bands, and the preservation of a -in/-out ground state across the whole accessed magnetic region of the phase diagram. ZF (zero-field) SR measurements confirm indeed that the local magnetic configuration is only weakly perturbed by pressure in the kbar range.
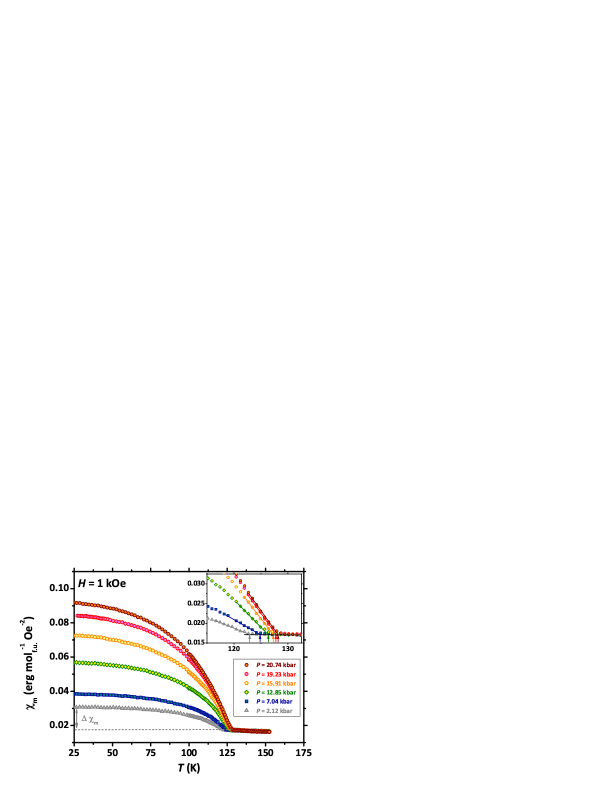
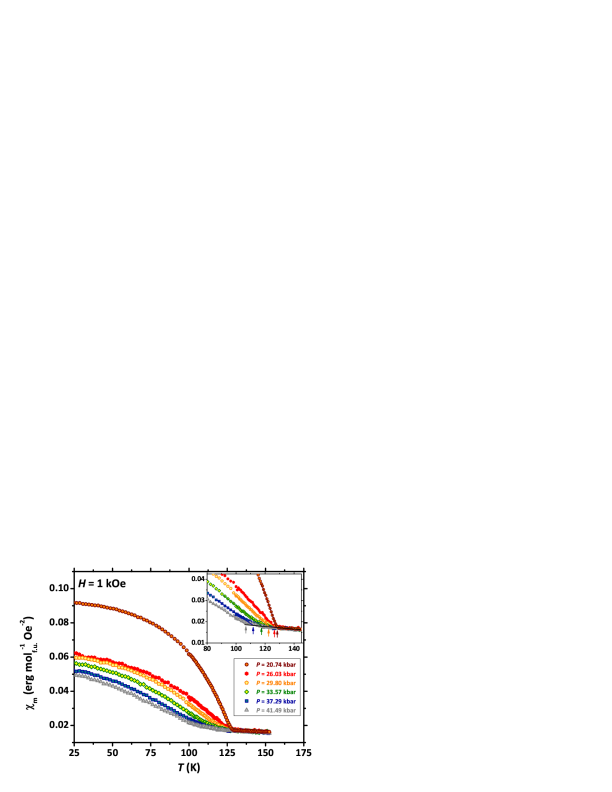
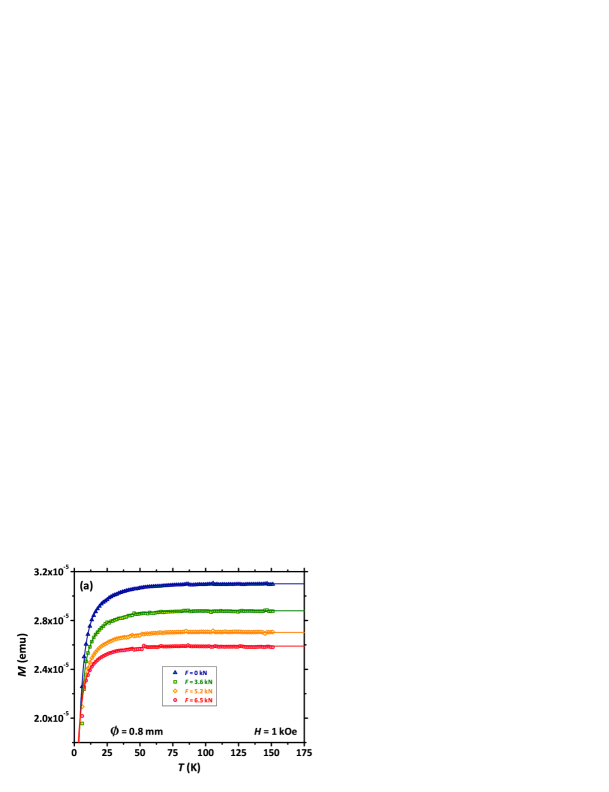
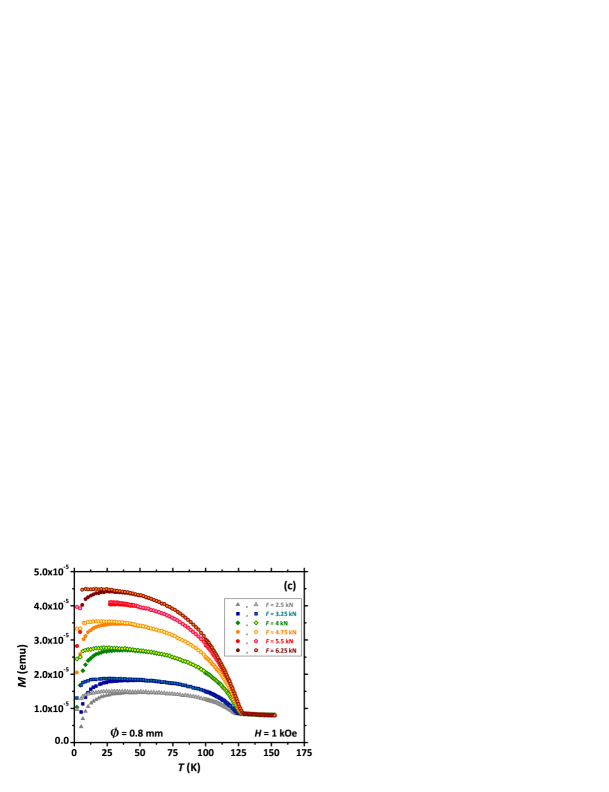
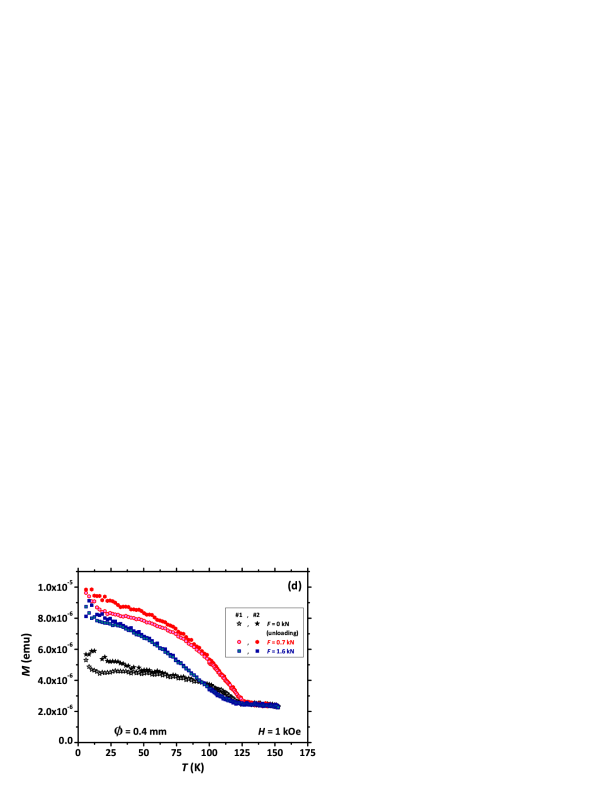
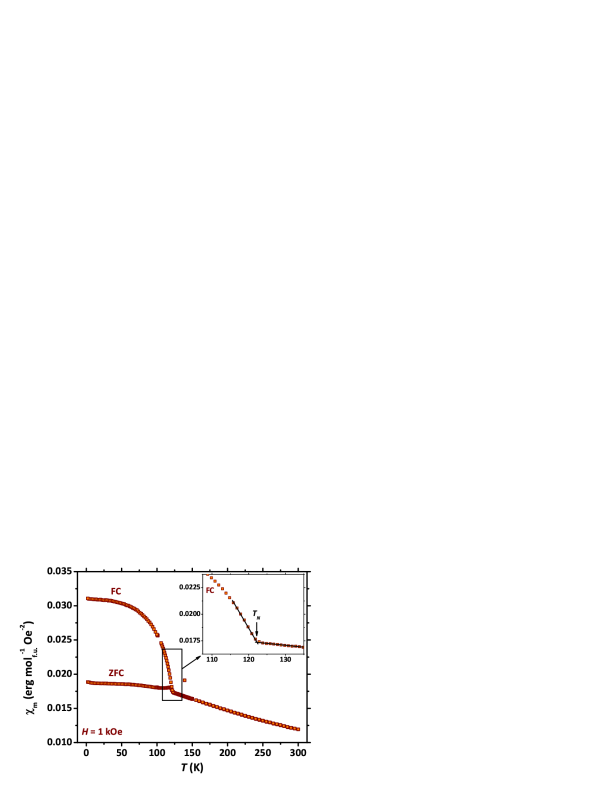
We measured (dc magnetization) for a polycrystalline Eu2Ir2O7 sample as a function of (temperature) for K K and under hydrostatic pressures kbar SM . Measurements were performed at a fixed value of the external magnetic field kOe always by warming the sample after a FC (field-cooling) protocol. Representative results for the magnetic susceptibility in molar formula units at the different investigated values are shown in Fig. 1. We define the transition temperature to the LRO (long-range ordered) phase from the kink-like anomaly in (see the double-linear fitting procedure graphically shown in the insets of Fig. 1). We also define the amount of FC susceptibility associated with the magnetic phase upon investigation as (see the left panel of Fig. 1). The choice of K is due to residual extrinsic background contributions from the pressure cell preventing us from fully exploiting measurements at lower values. However, K is safely in the saturation regime for at ambient SM .
We distinguish between two qualitatively different regimes for Eu2Ir2O7 under (see Fig. 1). For kbar, both and increase with increasing , while for kbar both quantities decrease. The situation is summarized later on in Fig. 4, where the actual dependence of both and is reported. exhibits a smooth and continuous dependence on clearly passing through a maximum at kbar. While the crossover between the two regimes in is marked by a discontinuity whose origin could be accounted for by an instrumental artefact FootNote , the observation of a qualitatively different behaviour of for kbar and kbar is unambiguous.
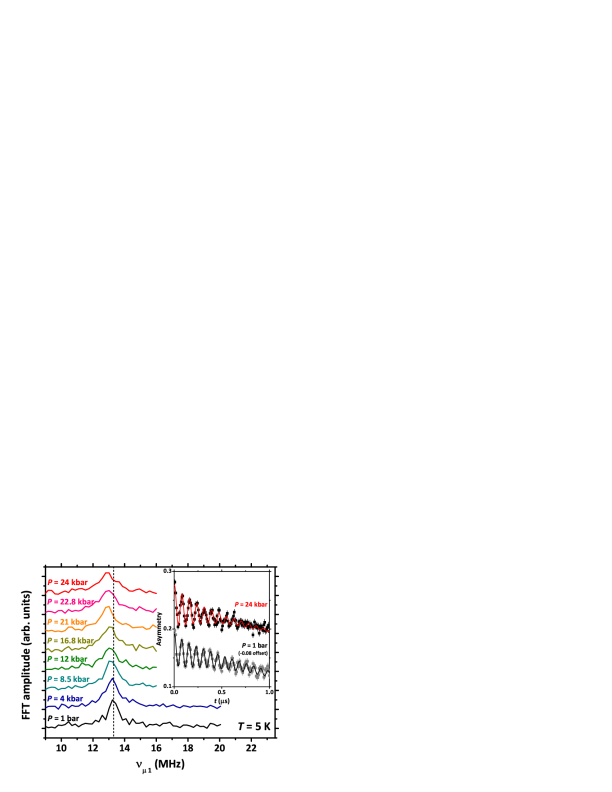
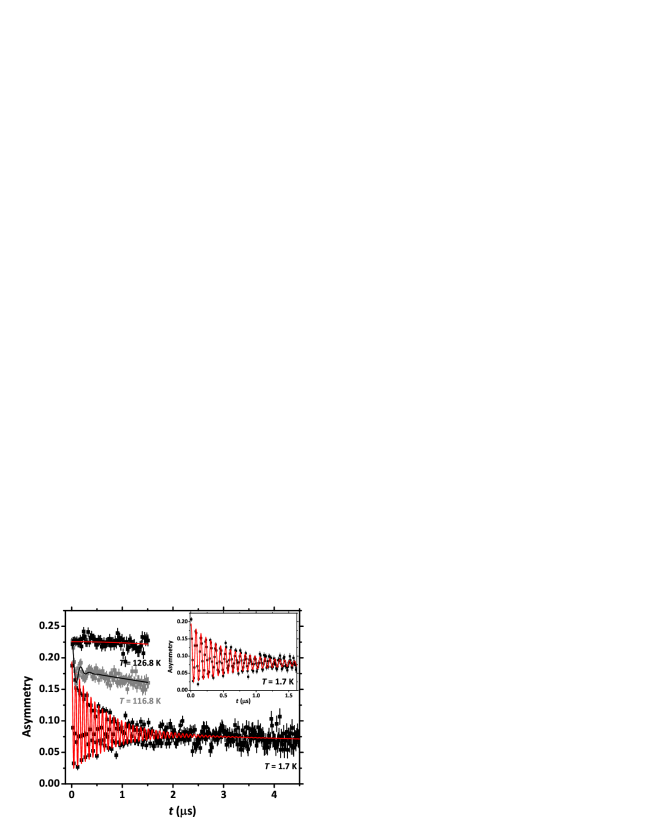
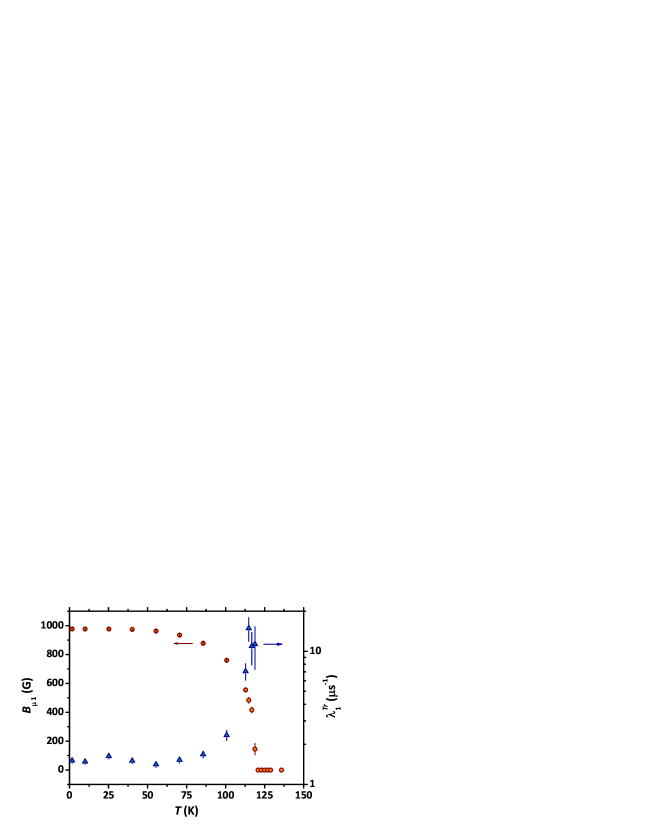
In order to investigate the effect of on the magnetic moments’ arrangement at the microscopic level, we performed ZF-SR experiments for kbar (i. e., the current maximum value achievable by the employed setup). We show representative raw data for the ZF spin depolarization in the time domain in the inset of Fig. 2. Continuous lines are best-fitting curves according to a standard treatment of ZF-SR data for magnetic materials SM . The well-defined spontaneous magnetic field at the muon site is indicative of a LRO magnetic phase Zha11 ; Dis12 , resulting in the coherent oscillations shown in the inset of Fig. 2. The characteristic frequency is directly proportional to the order parameter of the magnetic transition and, in the current case, to the magnetic moment of Ir ions SM . From this, we can confirm that no drastic qualitative changes are induced in the Ir magnetic moment by up to kbar.
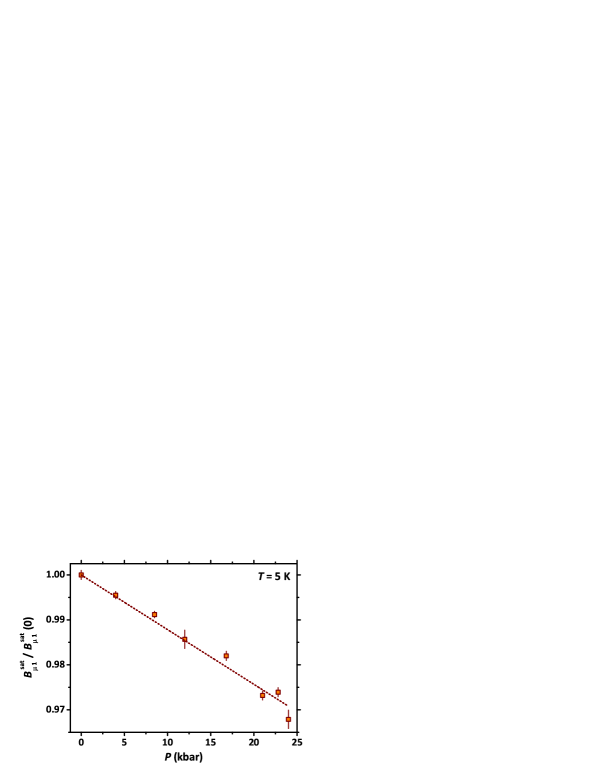
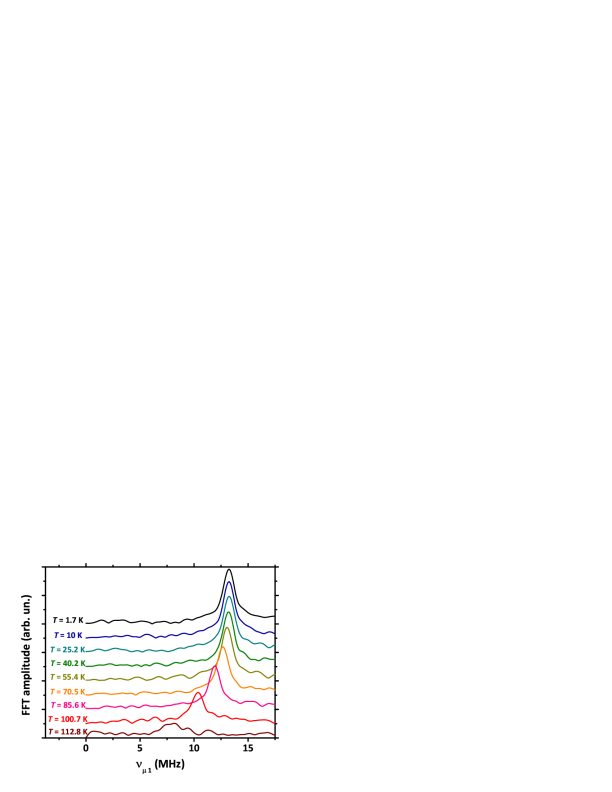
A closer examination of data PraTBP reveals other features, better visualized by FFT (fast Fourier transform) of the signal in the main panel of Fig. 2. A gradual increase of the transversal relaxation, i. e., the oscillations damping, is observed upon increasing . Accordingly, this is reflected in a progressive broadening of the FFT spectra. We relate this effect to the inevitable progressive increase in inhomogeneity with increasing rather than to any intrinsic effect. At the same time, (i. e., the local field at the muon site in saturation) is continuously shifted to lower values upon increasing . For the aim of clarity, we summarize these latter data in Fig. 3 clearly showing a linear dependence on . The smoothness of the vs. trend denotes the absence of any dramatic magnetic or structural effect induced by . Remarkably, we also notice that the relative variation is tiny ( % at the maximum ) and this aspect is not consistent at all with any appreciable change in the Ir4+ moment or a change from the -in/-out magnetic configuration. In particular, the observed behaviour could be well explained by a gradual modification in the lattice parameters gradually influencing the muon implantation site and the probed dipolar magnetic field in turn Pra13a ; Bon15 . This argument should be substantiated by ab-initio calculations of the muon implantation site and by a detailed measurement of the structural parameters of this current sample under comparable conditions. Unfortunately, the current setup at the GPD facility does not allow to reach higher values which would allow us to compare data with our results of dc magnetization over the whole range.
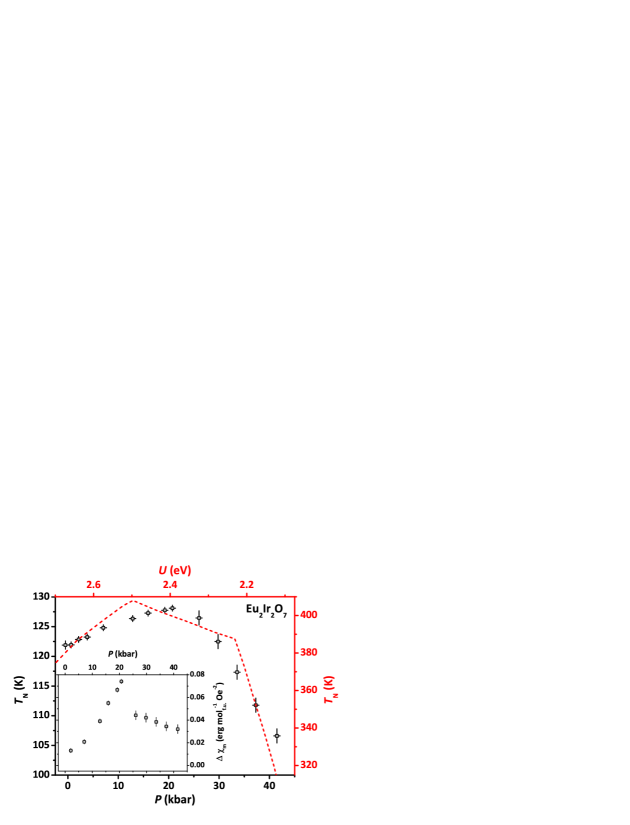
Remarkably, the non-monotonic behaviour of is highly reminiscent of what was recently calculated by means of relativistic LDA-DMFT for the analogue material Y2Ir2O7 Shi15 . In the current case of Eu2Ir2O7, we exploit the presence of Eu3+ at the site (i.e., a non-magnetic ion such as Y3+) allowing us to neglect any – interaction Che12 which, although interesting on its own, could in principle hide the intrinsic magnetic properties of the Ir sublattice. We report here data from the calculated EPD Shi15 superimposed to our experimental results (see the dashed red line in Fig. 4). While the absolute values for the calculated are clearly overestimating the experimental result (an issue associated by Shinaoka et al. with the neglecting “of spatial fluctuations in the DMFT approximation” – see Ref. Shi15, ), these can be rescaled by an empirical factor under the constraint that the scale zero matches the experimental one. Results clearly display a striking agreement with our measurements under the assumption that increasing is effectively reducing (e. g., by widening the electronic bandwidth by purely geometrical arguments).
Several interesting observations follow from the results presented above. First of all, the substantial agreement of the experimental and calculated EPDs allows us to rule out that the non-monotonic trend observed for is arising from, e. g., -induced structural phase transitions at kbar but rather points towards an intrinsic underlying electronic mechanism. At the same time, by considering the investigation of transport properties reported in Ref. Taf12, , we notice a possible departure of and under which would solve the current controversy between Mott- vs. Slater-character of the transition in favour of the former. In fact, Tafti et al. report that is mostly unaffected by up to kbar Taf12 , contrasting with our current reports on . However, it would be interesting to extend magnetic measurements to higher values in this respect. Moreover, we stress that the two current datasets are associated with two different samples, making direct comparisons difficult.
The behaviour of vs. needs to be commented further as well. We argue that the initial ( kbar) fast rise of could be due to two different phenomena. On the one hand, may be inducing different configurations for magnetic domains whose DWs (domain walls) would carry non-trivial exotic properties together with a net magnetization, according to recent theoretical proposals Yam14 . However, our finding of a LRO phase with non-zero local magnetic field over a bulk fraction of the sample (see below) fails to verify the prediction of a vanishing uniform magnetization in the bulk Yam14 . Another possible scenario is a gradual modification of the crystalline environment of Ir under slightly departing from the ideal cubic symmetry. This would imply an increasing degree of canting for the Ir magnetic moments, possibly resulting in an increased magnetic susceptibility in the presence of an external magnetic field. The subsequent decrease of with further increasing can be again understood from Ref. Shi15, as an actual decrease of the Ir magnetic moment, whose reduction develops in the same region of the fast suppression of .
It is worth emphasizing that our experimental validation of the trend calculated in Ref. Shi15, suggest a direct verification of other important conclusions of that theoretical study. In the first instance, our data support a departure from the single-band scenario originally proposed for other iridium-based oxides such as, e. g., Sr2IrO4 Kim08 in favour of a hybridized state between the and manifolds. At the same time, independently from the breakdown of the model, we confirm that the -in/-out ground state is preserved across the whole accessed magnetic region of the EPD. Moreover, we also confirmed previous observations by Ishikawa et al. Ish12 about the absence of any thermal hysteresis across (not shown), characterizing the phase transition as second-order. This is also in good agreement with the results in Ref. Shi15, where the first-order character of the transition is reported only very close to the full disruption of the antiferromagnetic ground state.
Summarizing, in this paper we focussed on the magnetic properties of Eu2Ir2O7 under reporting on an unprecedented non-monotonic dependence of on and showing that the local magnetic configuration is only weakly perturbed by applied pressure kbar. Our results verify the main findings of a recent theoretical study of pyrochlore iridates and, accordingly, they support both a departure from the model conventionally accepted for several iridium-based oxides and the preservation of a -in/-out ground state across the whole accessed magnetic region of the electronic phase diagram.
We thank M. Vojta, J. van den Brink, L. Balents, and Y. Ran for useful discussions and A. Amato, R. Khasanov and H. Luetkens for technical support during the SR measurements. G. Prando acknowledges support by the Humboldt Research Fellowship for Postdoctoral researchers. G. Prando and B. Büchner acknowledge support by the Sonderforschungsbereich (SFB) 1143 project granted by the Deutsche Forschungsgemeinschaft (DFG). S. D. Wilson and M. J. Graf acknowledge support by NSF Grant No. DMR-1337567. R. Dally and S. D. Wilson acknowledge support by NSF CAREER Grant No. DMR-1056625. The experimental SR work was performed at the Swiss Muon Source (SS) at the Paul Scherrer Institut, Switzerland.
References
- (1) J. S. Gardner, M. J. P. Gingras, and J. E. Greedan, Magnetic pyrochlore oxides, Rev. Mod. Phys. 82, 53 (2010).
- (2) I. Kézsmárki, N. Hanasaki, K. Watanabe, S. Iguchi, Y. Taguchi, S. Miyasaka, and Y. Tokura, Variation of the charge dynamics in bandwidth- and filling-controlled metal-insulator transitions of pyrochlore-type molybdates, Phys. Rev. B 73, 125122 (2006).
- (3) G. Prando, P. Carretta, A. U. B. Wolter, R. Saint-Martin, A. Revcolevschi, and B. Büchner, Amorphous ferromagnetism and re-entrant magnetic glassiness in single-crystalline Sm2Mo2O7, Phys. Rev. B 90, 085111 (2014) and references therein.
- (4) D. Yanagishima and Y. Maeno, Metal-Nonmetal Changeover in Pyrochlore Iridates, J. Phys. Soc. Jpn. 70, 2880 (2001).
- (5) K. Matsuhira, M. Wakeshima, Y. Hinatsu, and S. Takagi, Metal-Insulator Transitions in Pyrochlore Oxides Ir2O7, J. Phys. Soc. Jpn. 80, 094701 (2011).
- (6) W. Witczak-Krempa, G. Chen, Y. B. Kim, and L. Balents, Correlated Quantum Phenomena in the Strong Spin-Orbit Regime, Annu. Rev. Condens. Matter Phys. 5, 57 (2014).
- (7) H. Takatsu, K. Watanabe, K. Goto, and H. Kadowaki, Comparative study of low-temperature x-ray diffraction experiments on Ir2O7 ( = Nd, Eu, and Pr), Phys. Rev. B 90, 235110 (2014).
- (8) T. Katsufuji, H. Y. Hwang, and S.-W. Cheong, Anomalous Magnetotransport Properties of Mo2O7 near the Magnetic Phase Boundary, Phys. Rev. Lett. 84, 1998 (2000).
- (9) Y. Moritomo, S. Xu, A. Machida, T. Katsufuji, E. Nishibori, M. Takata, M. Sakata, and S.-W. Cheong, Chemical pressure control of exchange interaction in Mo pyrochlore, Phys. Rev. B 63, 144425 (2001).
- (10) N. Hanasaki, K. Watanabe, T. Ohtsuka, I. Kézsmárki, S. Iguchi, S. Miyasaka, and Y.Tokura, Nature of the Transition between a Ferromagnetic Metal and a Spin-Glass Insulator in Pyrochlore Molybdates, Phys. Rev. Lett. 99, 086401 (2007).
- (11) K. Ueda, J. Fujioka, C. Terakura, and Y. Tokura, Pressure and magnetic field effects on metal-insulator transitions of bulk and domain wall states in pyrochlore iridates, Phys. Rev. B 92, 121110 (2015).
- (12) X. Wan, A. M. Turner, A. Vishwanath, and S. Y. Savrasov, Topological semimetal and Fermi-arc surface states in the electronic structure of pyrochlore iridates, Phys. Rev. B 83, 205101 (2011).
- (13) W. Witczak-Krempa and Y. B. Kim, Topological and magnetic phases of interacting electrons in the pyrochlore iridates, Phys. Rev. B 85, 045124 (2012).
- (14) W. Witczak-Krempa, A. Go, and Y. B. Kim, Pyrochlore electrons under pressure, heat, and field: Shedding light on the iridates, Phys. Rev. B 87, 155101 (2013).
- (15) H. Sagayama, D. Uematsu, T. Arima, K. Sugimoto, J. J. Ishikawa, E. O’Farrell, and S. Nakatsuji, Determination of long-range all-in-all-out ordering of Ir4+ moments in a pyrochlore iridate Eu2Ir2O7 by resonant x-ray diffraction, Phys. Rev. B 87, 100403(R) (2013).
- (16) S. M. Disseler, Direct evidence for the all-in/all-out magnetic structure in the pyrochlore iridates from muon spin relaxation, Phys. Rev. B 89, 140413(R) (2014).
- (17) A. B. Sushkov, J. B. Hofmann, G. S. Jenkins, J. Ishikawa, S. Nakatsuji, S. Das Sarma, and H. D. Drew, Optical evidence for a Weyl semimetal state in pyrochlore Eu2Ir2O7, arXiv:1507.01038 (2015).
- (18) H. Ishikawa, S. Xu, Y. Moritomo, A. Nakamura, Y. Ohishi, and K. Kato, High-pressure structural investigation of ferromagnetic Nd2Mo2O7, Phys. Rev. B 70, 104103 (2004).
- (19) A. Apetrei, I. Mirebeau, I. Goncharenko, D. Andreica, and P. Bonville, Microscopic Study of a Pressure-Induced Ferromagnetic–Spin-Glass Transition in the Geometrically Frustrated Pyrochlore (Tb1-xLax)2Mo2O7, Phys. Rev. Lett. 97, 206401 (2006).
- (20) I. Mirebeau, A. Apetrei, I. Goncharenko, D. Andreica, P. Bonville, J. P. Sanchez, A. Amato, E. Suard, and W. A. Crichton, Pressure-induced ferromagnet to spin-glass transition in Gd2Mo2O7, Phys. Rev. B 74, 174414 (2006).
- (21) S. Iguchi, N. Hanasaki, M. Kinuhara, N. Takeshita, C. Terakura, Y. Taguchi, H. Takagi, and Y. Tokura, Emergence of a Diffusive Metal State with No Magnetic Order near the Mott Transition in Frustrated Pyrochlore-Type Molybdates, Phys. Rev. Lett. 102, 136407 (2009).
- (22) M. Sakata, T. Kagayama, K. Shimizu, K. Matsuhira, S. Takagi, M. Wakeshima, Y. Hinatsu, Suppression of metal-insulator transition at high pressure and pressure-induced magnetic ordering in pyrochlore oxide Nd2Ir2O7, Phys. Rev. B 83, 041102(R) (2011).
- (23) F. F. Tafti, J. J. Ishikawa, A. McCollam, S. Nakatsuji, and S. R. Julian, Pressure-tuned insulator to metal transition in Eu2Ir2O7, Phys. Rev. B 85, 205104 (2012).
- (24) H. Shinaoka, S. Hoshino, M. Troyer, and P. Werner, Phase Diagram of Pyrochlore Iridates: All-in–All-out Magnetic Ordering and Non-Fermi-Liquid Properties, arXiv:1504.03962 (2015).
- (25) B. J. Kim, H. Jin, S. J. Moon, J.-Y. Kim, B.-G. Park, C. S. Leem, J. Yu, T. W. Noh, C. Kim, S.-J. Oh, J.-H. Park, V. Durairaj, G. Cao, and E. Rotenberg, Novel Mott State Induced by Relativistic Spin-Orbit Coupling in Sr2IrO4, Phys. Rev. Lett. 101, 076402 (2008).
- (26) See Supplemental Material, which also includes Refs. Sch15, ; Ali09, ; Pie73, ; Cla78, ; Blu99, ; Yao11, ; Pra13a, ; Pra15b, ; Zha11, ; Pra13b, ; Tai01, ; Ish12, , for detailed information about the growth and characterization of the sample, both structural and compositional. Technical details about the pressure measurements (dc magnetometry and SR) are given as well. Finally, the magnetic characterization of the sample by means of ambient-pressure resistivity, ZF-SR and dc magnetization is provided.
- (27) W. Schottenhamel, Aufbau eines hochauflösenden Dilatometers und einer hydrostatischen SQUID-Druckzelle sowie Untersuchungen an korrelierten Übergangsmetalloxiden, Ph. D. Thesis, Technische Universität Dresden (2015 – submitted).
- (28) P. L. Alireza and G. G. Lonzarich, Miniature anvil cell for high-pressure measurements in a commercial superconducting quantum interference device magnetometer, Rev. Sci. Instr. 80, 023906 (2009).
- (29) G. J. Piermarini, S. Block, and J. D. Barnett, Hydrostatic limits in liquids and solids to kbar, J. Appl. Phys. 44, 5377 (1973).
- (30) M. Clark and T. Smith, Pressure dependence of for lead, J. Low Temp. Phys. 32, 495 (1978).
- (31) S. J. Blundell, Spin-polarized muons in condensed matter physics, Contemp. Phys. 40, 175 (1999).
- (32) A. Yaouanc, P. Dalmas de Réotier, Muon Spin Rotation, Relaxation, and Resonance: Applications to Condensed Matter (Oxford University Press, Oxford, 2011).
- (33) G. Prando, P. Bonfà, G. Profeta, R. Khasanov, F. Bernardini, M. Mazzani, E. M. Brüning, A. Pal, V. P. S. Awana, H.-J. Grafe, B. Büchner, R. De Renzi, P. Carretta, and S. Sanna, Common effect of chemical and external pressures on the magnetic properties of RCoPO (R = La, Pr), Phys. Rev. B 87, 064401 (2013).
- (34) G. Prando, G. Profeta, A. Continenza, R. Khasanov, A. Pal, V. P. S. Awana, B. Büchner, and S. Sanna, Common effect of chemical and external pressures on the magnetic properties of CoPO ( = La, Pr, Nd, Sm). II., Phys. Rev. B 92, 144414 (2015).
- (35) S. Zhao, J. M. Mackie, D. E. MacLaughlin, O. O. Bernal, J. J. Ishikawa, Y. Ohta, and S. Nakatsuji, Magnetic transition, long-range order, and moment fluctuations in the pyrochlore iridate Eu2Ir2O7, Phys. Rev. B 83, 180402(R) (2011).
- (36) G. Prando, O. Vakaliuk, S. Sanna, G. Lamura, T. Shiroka, P. Bonfà, P. Carretta, R. De Renzi, H.-H. Klauss, C. G. F. Blum, S. Wurmehl, C. Hess, and B. Büchner, Role of in-plane and out-of-plane dilution in CeFeAsO: Charge doping versus disorder, Phys. Rev. B 87, 174519 (2013).
- (37) N. Taira, M. Wakeshima, and Y. Hinatsu, Magnetic properties of iridium pyrochlores Ir2O7 ( = Y, Sm, Eu and Lu), J. Phys.: Cond. Matt. 13, 5527 (2001).
- (38) J. J. Ishikawa, E. C. T. O’Farrell, and S. Nakatsuji, Continuous transition between antiferromagnetic insulator and paramagnetic metal in the pyrochlore iridate Eu2Ir2O7, Phys. Rev. B 85, 245109 (2012).
- (39) In particular, the observed behaviour may be associated with the two experimental setups employed for dc magnetization measurements, as discussed in Ref. SM, . This issue is currently still not completely understood and will be the subject of further experimental investigation.
- (40) S. M. Disseler, C. Dhital, A. Amato, S. R. Giblin, C. de la Cruz, S. D. Wilson, and M. J. Graf, Magnetic order in the pyrochlore iridates Ir2O7 ( = Y, Yb), Phys. Rev. B 86, 014428 (2012).
- (41) G. Prando et al., manuscript under preparation.
- (42) P. Bonfà, F. Sartori, and R. De Renzi, Efficient and reliable strategy for identifying muon sites based on the double adiabatic approximation, J. Phys. Chem. C 119, 4278 (2015).
- (43) G. Chen and M. Hermele, Magnetic orders and topological phases from exchange in pyrochlore iridates, Phys. Rev. B 86, 235129 (2012).
- (44) Y. Yamaji and M. Imada, Metallic Interface Emerging at Magnetic Domain Wall of Antiferromagnetic Insulator: Fate of Extinct Weyl Electrons, Phys. Rev. X 4, 021035 (2014).
I SUPPLEMENTARY MATERIAL
II Sample synthesis
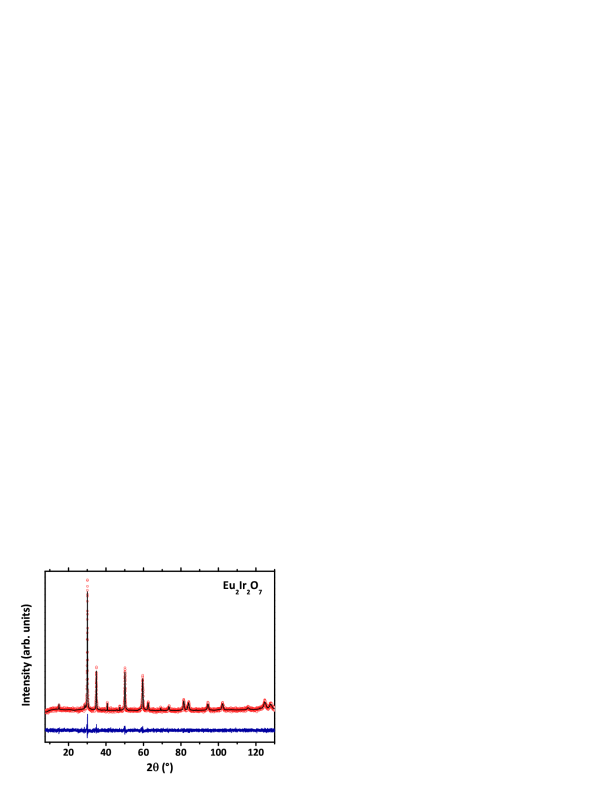
Stoichiometric amounts of Eu2O3 (Alfa %) and IrO2 (Alfa %) were mixed and sintered at ∘C for hours, ∘C for hours, and ∘C for hours. The powder was mixed and pelletized with an isostatic cold press in between each sintering step. Sample purity was tested via laboratory XRD (x-ray diffraction) measurements in a Brucker D Phaser system. Other than a small impurity fraction of % Ir, powder diffraction data (see Fig. 5) revealed a phase pure specimen of Eu2Ir2O7.
III Experimental details
III.1 dc magnetometry
III.1.1 Experimental setup and pressure quantification
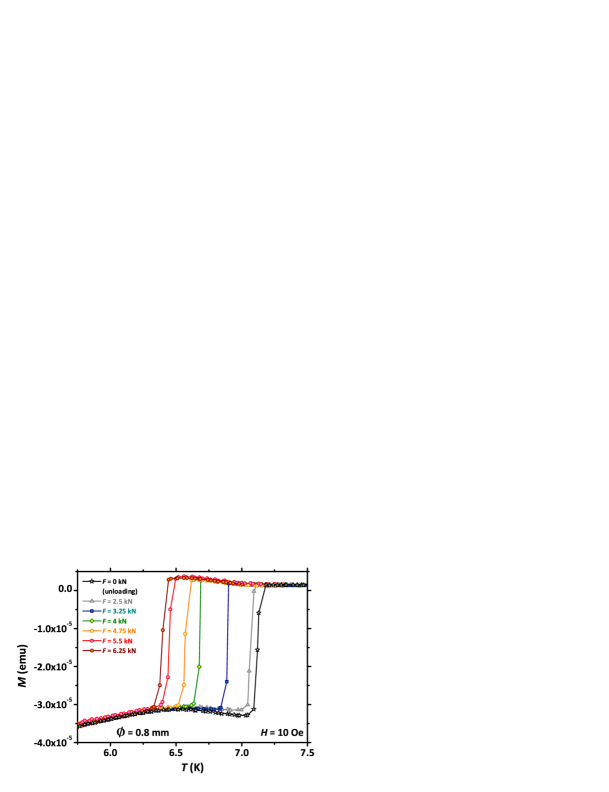
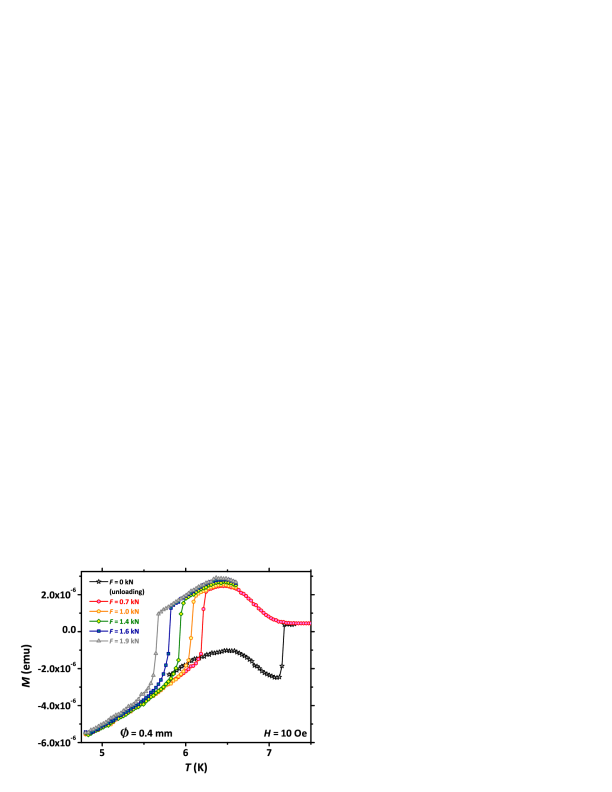
We performed measurements of dc magnetization by means of a commercial MPMS (magnetic property measurement system) magnetometer by Quantum Design based on a SQUID (superconducting quantum interference device) for temperature values K K. We employed a home-made CuBe PC (pressure cell) in order to apply external pressure . Here, two opposing cone-shaped ceramic anvils compress a CuBe gasket with a cylindrical hole used as sample chamber Sch15 ; Ali09 . The uniaxial force is applied at ambient temperature and it is converted into hydrostatic pressure in the sample chamber by a homogeneous mixture of ethanol ( part) and methanol ( parts). This choice for the transmitting medium is among the best ones in order to keep the degree of non-hydrostaticity as low as possible within the accessed range Pie73 . We employed two different disk-shaped CuBe gaskets with sample space diameter mm and mm currently allowing us to reach maximum pressure values kbar and kbar, respectively. In the case of the former setup, we performed measurements with Daphne oil as transmitting medium as well, allowing us to achieve slightly higher maximum values ( kbar). In all the cases mentioned above, we checked the value and its homogeneity at low temperature by measuring the FC (field-cooling) diamagnetic response associated with the superconducting transition of a small Pb manometer inserted in the sample space. We performed these measurements upon the application of a small magnetic field Oe. Transition widths K denote good homogeneity at all the investigated values (see Fig. 6). Accordingly, the value at low was estimated from the expression Cla78
| (1) |
being the measured mid-point of the diamagnetic transition.
III.1.2 Subtraction of the background signal from the PC
Measurements of Eu2Ir2O7 were performed at kOe in FC conditions, most of them upon gradually increasing . The full reversibility of the observed dependence was checked and verified while unloading the PC, both for the Pb transition and for the actual magnetic properties of the sample. The design of the currently used PC is such that a dramatic reduction of the background signal is achieved which enables measurements of small and weakly magnetic samples. Still, we performed a detailed characterization of the empty PC magnetization within the same experimental conditions for the aim of a quantitative and reliable disentanglement of the sample signal from the overall magnetic response. Representative steps of this procedure are shown in Fig. 7 and explained below in detail for both employed setups.

-
•
The magnetic behaviour of the empty pressure cell is presented in Fig. 7(a) and Fig. 7(b) for the specific cases of the mm and mm gaskets, respectively. Measurements have been performed upon the application of different in order to check for the effects of gasket distortion on the overall magnetic response. Data have been approximated by an empirical function composed of one linear plus two exponential terms [see the continuous lines in Fig. 7(a) and Fig. 7(b)] and the extracted characteristic parameters have been used to properly interpolate for the required values within the successive stages.
-
•
In the case of the mm gasket and within the accessed experimental range, the absolute variation of the signal from the sample is much stronger than that of the cell background. This can be observed by comparing Fig. 7(c) with Fig. 7(a). The subtraction of the linear term of the background contribution from the raw data (not shown) results in the full points reported in Fig. 7(c). Here, the empty points are the results of subtracting the two exponential terms as well and, after proper normalization by the sample mass, these are presented in Fig. 1. The background contribution from the PC cannot be fully subtracted at low values, as observed in Fig. 7(c). The actual reason is related to the employment of different gaskets for the background calibrations and the real measurements.
-
•
In the case of the mm gasket the sample amount is smaller and, within the accessed experimental range, the absolute variation of the signal from the sample is smaller than that of the cell background. This can be observed by comparing Fig. 7(d) with Fig. 7(b). This fact makes the subtraction procedure more delicate and, for this reason, two different approaches are followed.
-
–
The procedure #1 is analogous to what is described above for the case of mm gasket and it gives the results denoted by empty symbols in Fig. 7(d). However, small discrepancies between the signal from different gaskets (see above) may be critical.
-
–
Within procedure #2, ZFC (zero-field cooling) data are subtracted from the FC data with the advantage of carefully “cleaning” measurements from the cell contribution. This is expected to better account for the dependence of the background if compared to what performed in procedure #1 as, in the current case, the signal from the very same gasket is being accounted for. Here we exploit the fact that the background term is not exhibiting any irreversible behaviour, i. e., differences between ZFC and FC branches. However, procedure #2 will also give a null result above the magnetic transition, where no ZFC/FC opening is observed. A linear contribution is then added to the result in order to match data from procedure #1 above the magnetic transition. We notice that this procedure, while not rigorous, can be applied to Eu2Ir2O7 after considering its peculiar overall shape of the ZFC curve (see later on, in the right panel of Fig. 11). In particular, it is observed that the ZFC branch can be approximately mimicked by a linear contribution over the whole accessed range (from K up to K). The overall result of the subtraction procedure #2 is shown in Fig. 7(d) by full symbols.
As is shown, the discrepancies between the two methods are essentially irrelevant at relatively high temperatures, while the low-temperature side is still dominated by the differences between the gaskets used for calibration and for actual measurements. In the main paper, results from both the procedures have been used (see Fig. 1 – the same meaning for symbols is used).
-
–
III.2 Muon spin spectroscopy (SR)
We performed SR measurements Blu99 ; Yao11 at the SS muon source (Paul Scherrer Institut, Switzerland) on the GPD spectrometer (E1 beamline) for K K, in ZF conditions. We applied external pressures at ambient by means of a double-wall piston-cylinder PC made of MPN alloy. The transmitting medium Daphne oil assured nearly-hydrostatic conditions in the whole experimental range. The value and its homogeneity was checked at low . In particular, the diamagnetic response associated with the superconducting transition of a small In wire in the sample space was measured by means of ac susceptibility (not shown).
We performed the analysis of our ZF-SR data similarly to what is discussed in, e. g., Refs. Pra13a and Pra15b . The general expression
| (2) |
was employed for all the investigated values as the best-fitting function for the (time) dependence of the measured asymmetry function . The maximum value for (measured at ) is a spectrometer-dependent parameter denoted as and it corresponds to full spin polarization ( %) for the implanted (positive muons). It can be shown Blu99 ; Yao11 that the quantity defines the spin (de)polarization for the implanted . – mainly accounts for the fraction of incoming stopping in the PC [when performing ambient calibration experiments on the low-background GPS spectrometer (M3 beamline), arises from the implanted into the sample holder, into the cryostat walls, etc]. Within the PC, is affected by the nuclear magnetism of the MPN alloy. This leads to a damping governed by the Gaussian and Lorentzian parameters and , whose dependence was independently estimated in a dedicated set of measurements on the empty PC. In the current case of Eu2Ir2O7, the function
| (3) | |||||
was employed in order to describe the spin (de)polarization arising from the remaining fraction of (i. e., implanted into the sample). is the fraction of probing static local magnetic fields and, due to the random implantation of , it is equivalent to the magnetic volume fraction of Eu2Ir2O7. For (high temperatures), only nuclear magnetic moments can cause a damping of the signal. Typically this damping is of Gaussian nature with a characteristic rate s-1. Below the critical transition temperature to the magnetic phase, the superscript () refers to probing a local static magnetic field in a parallel (perpendicular) direction with respect to the initial spin polarization. Accordingly, one has for the so-called “longitudinal” ( or ) and “transversal” ( or ) fractions. Here, denotes two different inequivalent crystallographic sites of implantation for , as reflected in two different signals at very low- values (in agreement with the previous observations in Ref. Zha11 ). Our experimental results suggest a different statistical population of these two sites ().
The longitudinal components typically probe dynamical spin-lattice-like relaxation processes resulting in slow exponentially-decaying functions . Due to the typically low values measured for ( s-1) in comparison with the overall experimental -window ( s), the two different components cannot be resolved in the longitudinal fraction and only one averaged is reported in Eq. (3), accordingly. On the other hand, the component yields valuable information about the static magnetic properties of the investigated phase. A coherent precession of around the local field generated by a LRO (long-range ordered) magnetic phase (static within the mean lifetime s) can be observed in the transversal amplitude indeed. This is typically described by oscillating functions , with the common choice , s-1/T being the gyromagnetic ratio for and phase terms. At the same time, the damping functions reflect a static distribution of local magnetic fields at the site of the . In the current case of Eu2Ir2O7, the oscillating signal from the site is clearly visible and allows us to quantify both (proportional to the order parameter of the magnetic phase) and its distribution . On the other hand, we find that is so high to cause an overdamping of oscillations for this site and, accordingly, we set . Otherwise stated, we find and .
Summarizing, the fitting function we employed for ZF-SR measurements of Eu2Ir2O7 can be re-written as
| (4) | |||||
The fitting results are in good agreement with our experimental data at all and values (statistical ).
IV Sample characterization at ambient pressure
IV.1 Transport properties
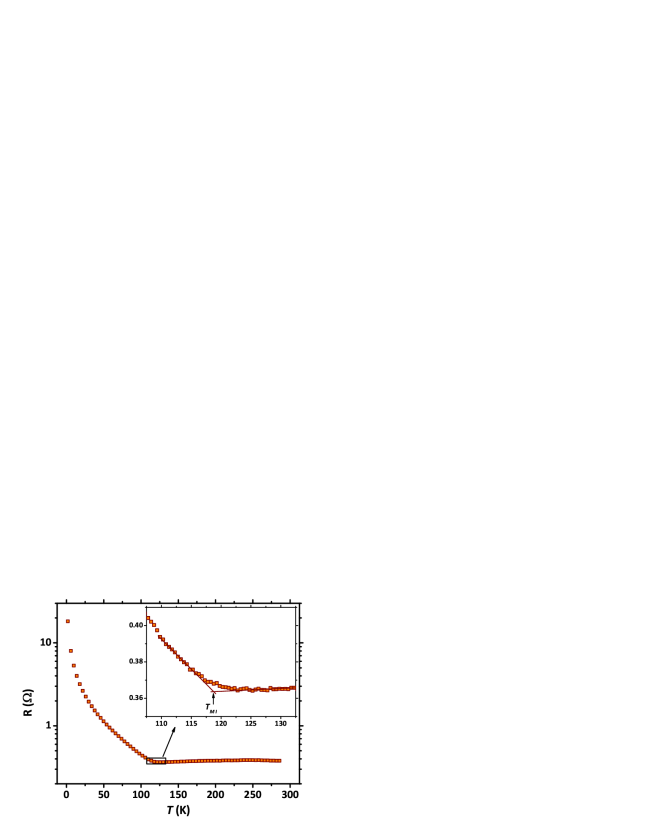
Fig. 8 shows the dependence of the resistance of our currently investigated Eu2Ir2O7 sample. Measurements were performed at ambient and in ZF conditions with a -terminal ac setup (the dependence on the current amplitude was checked). A clear anomaly is detected at K, corresponding to the metal-to-insulator transition (the inset shows an enlargement of the transition region and the graphical procedure to estimate ). strongly increases with decreasing below while a conventional metallic state is observed above the transition.
IV.2 Magnetic properties
Representative ZF-SR -depolarization curves for Eu2Ir2O7 measured on the low-background spectrometer GPS are reported in the left panel of Fig. 9. The sudden development of a static internal magnetic field is clearly observed below K, being reflected in the appearance of long-lived coherent oscillations in . As can be clearly observed both in the time and frequency domain (after a FFT, Fast Fourier Transform, of the signal), the condition discussed above is well verified (see the right panel of Fig. 9). The central frequency at low is MHz, in good agreement with the value MHz from previous reports Zha11 . The transversal component from the second site () is damped with the characteristic rate s-1 and, as such, it only involves very short times of the depolarization (see also Fig. 1 in Ref. Zha11 ). Concerning the phase value, we systematically observe negative values °.
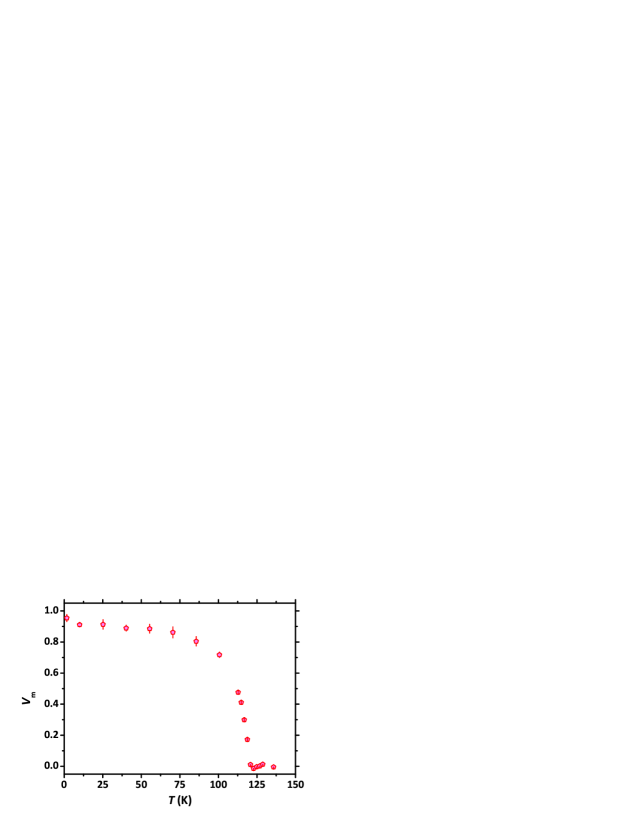
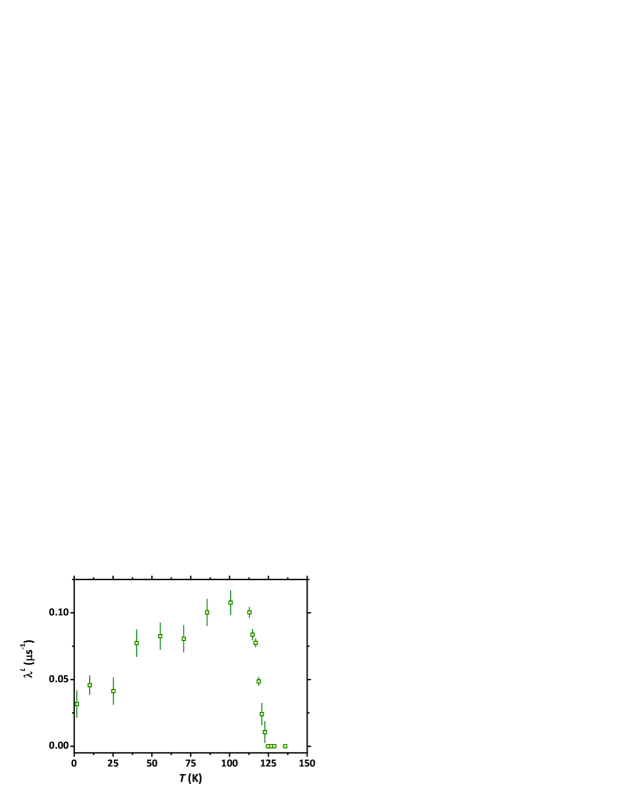
Fig. 10 and Fig. 11 show the dependence of the parameters derived from fitting Eq. (2) and Eq. (4) to the time-domain depolarization curves in the left panel of Fig. 9. The left panel of Fig. 10 displays the magnetic volume fraction . Here, we observe a sudden development of a bulk magnetic fraction below K, saturating at , in good agreement with what is also reported in Ref. Zha11 . The remaining non-magnetic fraction can be well accounted by the background amplitude plus a tiny segregated non-magnetic phase in the sample. As commented in the main text of the paper, it should be remarked that the actual shape of is quite unusual. It was commented in Ref. Zha11 that this shape for may arise from a statistical distribution of different values for the transition temperature. However, this scenario seems quite unrealistic in view of the good static properties of the internal field (discussed below). Moreover, in the presence of an inhomogeneous distribution of transition temperatures, one would expect a symmetrical shape for around the mid-point of the overall transition with the typical functional form Pra13b
| (5) |
the complementary error function being
| (6) |
At the same time, we report in the right panel of Fig. 10 the dependence of the longitudinal dynamical relaxation rate . Remarkably, and different from what has been reported previously Zha11 , we can clearly detect a well-defined critical peak when approaching the magnetic transition from above, followed by a slow decrease approaching s-1 with further decreasing . While the sharp increase at K is the expected behaviour for canonical magnetic phase transitions, the slow decrease below is more unconventional and points towards the persistence of anomalous spin dynamics within the magnetic phase.
The static local quantities probed by are reported in Fig. 11 (left panel). The dependence of is in good agreement with what has been reported previously Zha11 . At the same time, the transversal damping parameter saturates at low at s-1, a value almost times smaller than what has been reported in Ref. Zha11 . This can be already seen in the inset of Fig. 9 (left panel), where clear oscillations are still well detected at s. Together with the observation of a dynamical critical peak (see Fig. 10), these indications generally suggest better magnetic properties for the currently investigated sample if compared to previous results in Ref. Zha11 .
The dependence of the molar magnetic dc susceptibility on temperature is displayed in the right panel of Fig. 11, showing a behaviour in excellent agreement with previous reports Tai01 ; Ish12 . The absence of sizeable upturns of for K denotes negligible contributions from possible spurious magnetic phases in our currently investigated sample Tai01 ; Ish12 . We observe a well-defined opening of ZFC and FC curves at K, which is in good agreement with what is observed from ZF-SR results. This value has been estimated from the double-linear procedure graphically shown in the inset of Fig. 11 (right panel). Throughout the main text of this paper, this is the adopted definition for .