Email: gogami@scphys.kyoto-u.ac.jp (T. Gogami)
Development of Water Čerenkov Detector for On-line Proton Rejection in Hypernuclear Spectroscopy via the () Reaction
Abstract
The missing mass spectroscopy of hypernuclei with the (,) reaction is planned to be performed at the J-PARC K1.8 beam line by using a new magnetic spectrometer, Strangeness Spectrometer (S-2S). A Čerenkov detector with a radiation medium of pure water (refractive index of 1.33) is designed to be used for on-line proton rejection for a momentum range of 1.2 to 1.6 GeV/ in S-2S. Prototype water Čerenkov detectors were developed and tested with positron beams and cosmic rays to estimate their proton-rejection capability. We achieved an average number of photoelectrons of greater than 200 with the latest prototype for cosmic rays, which was stable during an expected beam time of one month. The performance of the prototype in the cosmic-ray test was well reproduced with a Monte Carlo simulation in which some input parameters were adjusted. Based on the Monte Carlo simulation, we expect to achieve proton-rejection efficiency while maintaining survival ratio in the whole S-2S acceptance. The performance satisfies the requirements to conduct the spectroscopic study of hypernuclei at J-PARC.
I Introduction
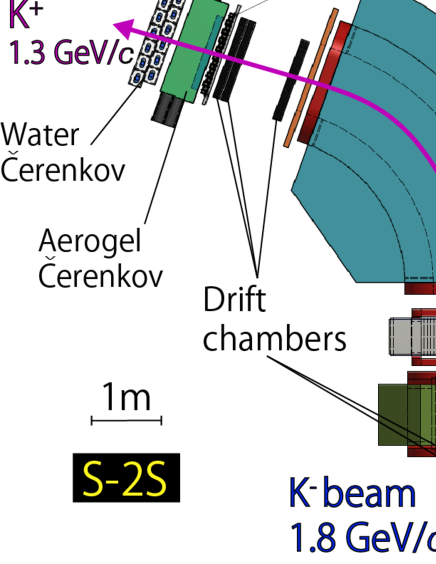
A spectroscopic study of the hypernucleus via the (,) reaction at an incident momentum of 1.8 GeV/ (J-PARC E05) cite:nagae is planned at the K1.8 beam line of the hadron experimental hall in J-PARC cite:takahashi . The experiment is the first attempt to investigate the hypernucleus, Be, with an energy resolution of a few MeV (FWHM) by using a new magnetic spectrometer, Strangeness -2 Spectrometer (S-2S). The S-2S consists of two quadrupole magnets (Q1, Q2) and one dipole magnet (D), as shown in Fig. 1.
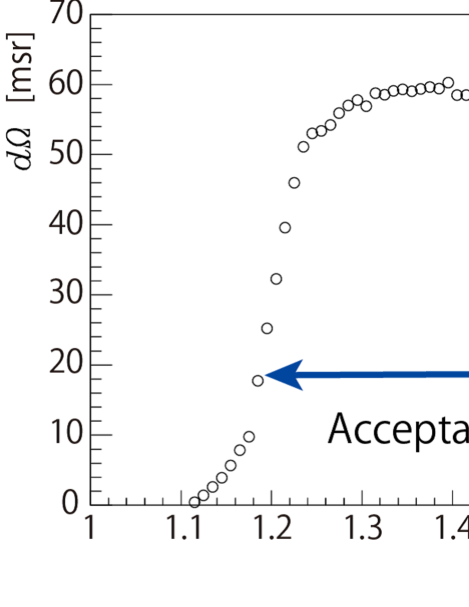
The momentum acceptance of S-2S was estimated using the same simulation setting as that presented in Sec. VI, and a solid angle was obtained as a function of incident momentum, as shown in Fig. 2. The solid angle for a particle at 1.3 GeV/ is approximately 60 msr. A momentum coverage greater than 30 of the solid angle at 1.3 GeV/ ranges from approximately 1.2 to 1.6 GeV/. The S-2S was designed to measure the momentum with a momentum resolution of (FWHM) in the momentum range of 1.2 to 1.6 GeV/.
The expected major background particles are protons and s. According to our Monte Carlo simulation based on the JAM code cite:jam , rates of background triggers from protons and s approximately a thousand times higher than that of s are expected in the S-2S acceptance. Therefore, background suppression at a trigger level (on-line) is essential to conduct the experiment in a given beam time while maintaining sustainable rates for our data acquisition system (DAQ).
Background-particle suppression with Čerenkov detectors was well established in past hypernuclear experiments in a similar momentum range cite:sks1 ; cite:sks2 ; cite:gogami . In the J-PARC E05 experiment, background-particle suppression is also designed to be performed with a combination of Čerenkov detectors. s will be rejected with an existing aerogel (refractive index of 1.05) Čerenkov detector, which has been used in hypernuclear experiments with the Superconducting Kaon Spectrometer (SKS). On the other hand, a Čerenkov detector suppressing protons in the S-2S momentum and geometrical acceptance does not exist. In the present work, we developed a threshold-type Čerenkov detector with radiation medium of pure water (refractive index of 1.33) for proton suppression in S-2S, and the results of prototype tests are described here.
II Requirements for Water Čerenkov Detector
Figure 1 shows a schematic drawing of the top view of S-2S. The S-2S detector system consists of drift chambers for particle tracking, a time-of-flight (TOF) detector for trigger and off-line particle identification (PID), and Čerenkov detectors for on-line PID.
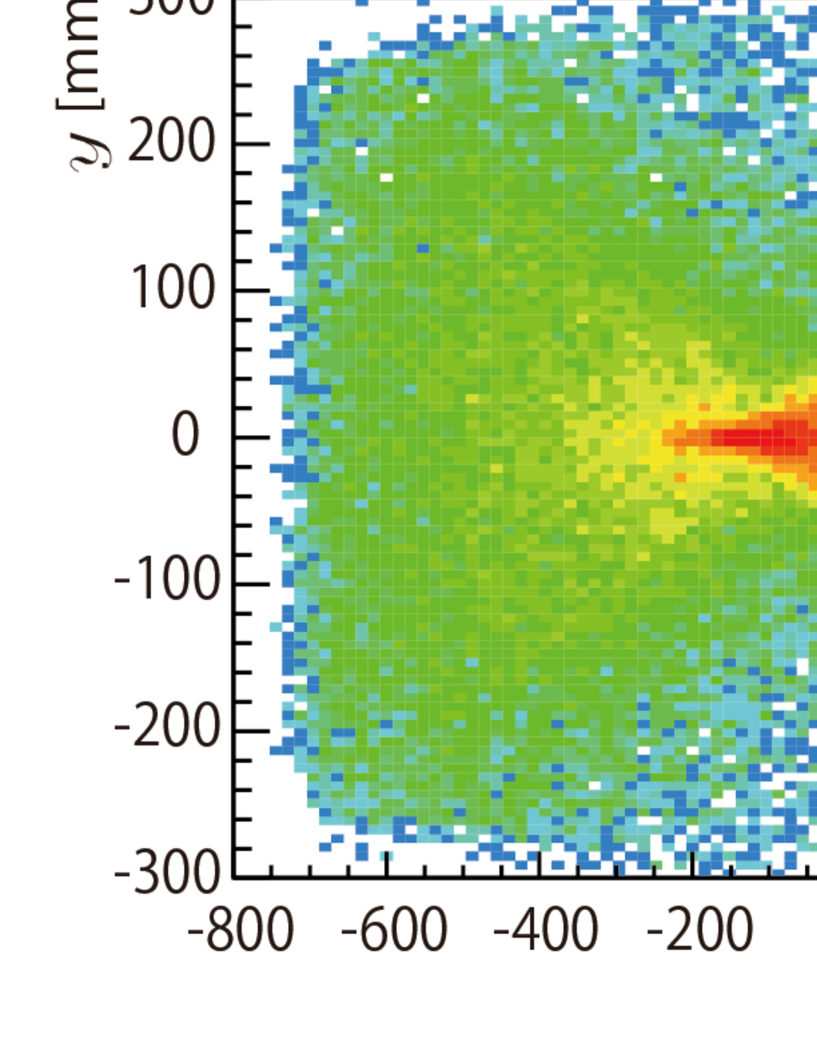
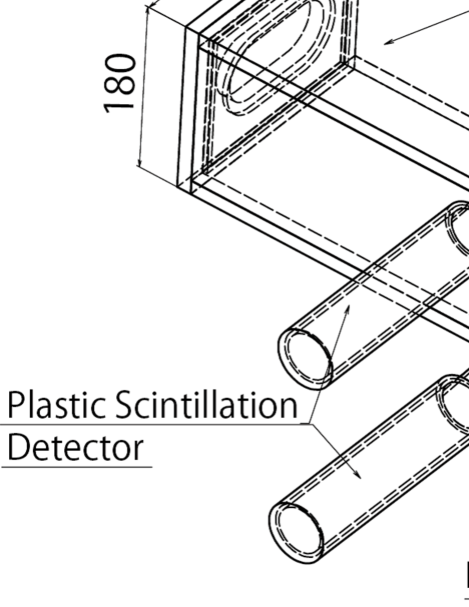
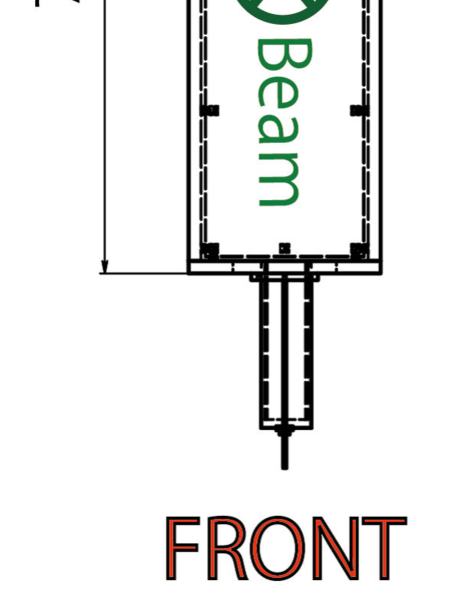
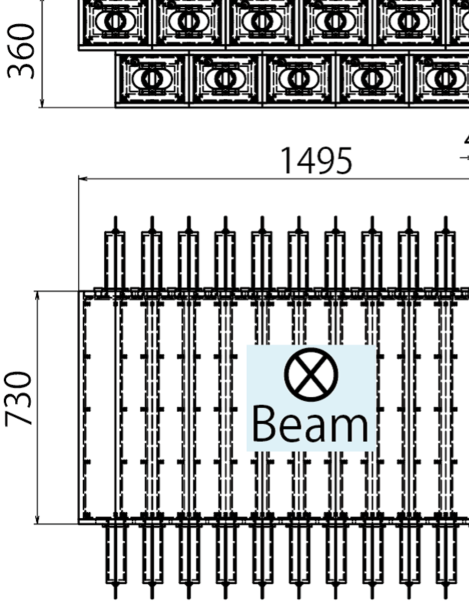
A water Čerenkov detector with two layers to avoid dead spaces in each layer (Fig. 1 and Fig. 33) is planned for installation at the downstream end of the detector system. The water Čerenkov detector is designed to be segmented into six per layer. The segmented size was optimized for handling and maintenance, in addition to considerations of track multiplicity and the number of photoelectrons in each segment. Two photo-multiplier tubes (PMTs) are attached on each segment (Fig. 6). Analog pulses of the two PMTs are summed up, and the summed signal is input to a discriminator with a threshold avoiding protons to produce one of the trigger signals. Figure 3 shows particle distributions (momentum vs. , vs. , vs. , vs. ) 3 cm upstream of the water Čerenkov detector in S-2S obtained through a Monte Carlo simulation (Sec. VI). We need to construct a water Čerenkov detector that accepts particles as shown in Fig. 3.
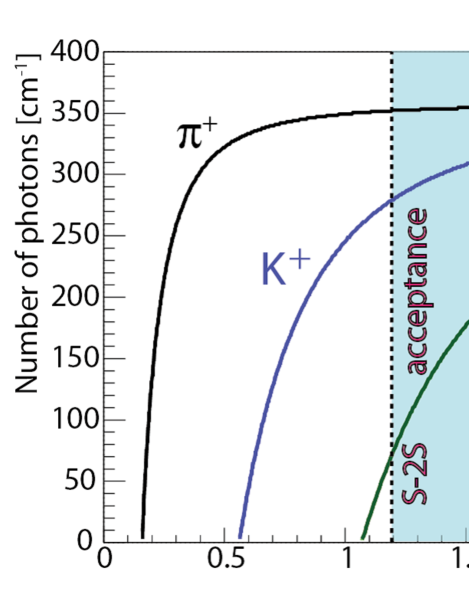
S-2S measures momenta of particles with a range of 1.2–1.6 GeV/. Figure 4 shows the photon yield of Čerenkov light per cm in water as a function of incident particle (, , ) momentum calculated as follows cite:pdg :
| (1) |
where and are the number of photons and wavelength of Čerenkov light, respectively; , , and are the path length, charge, and velocity factor of the incident particle, respectively; and () is the refractive index of the radiation medium. In Fig. 4, the wavelength was integrated from 300 nm to 600 nm, which roughly corresponds to the light-sensitive region of a PMT, and () is fixed at 1.33, which is the nominal refractive index of pure water. All three particles yield Čerenkov light in water in the S-2S momentum acceptance, but can be identified by a difference of photon yield. Protons are planned to be suppressed at a trigger level (on-line) by cutting the photon yield of the water Čerenkov detector.
Čerenkov light is converted to electrons (photoelectrons) and multiplied by a PMT to be detected as signals. Photon yield, which is measured as the number of photoelectrons (NPE), depends on the container shape of the radiation medium, window material used between the radiation medium and PMT, reflection material at the inside of the container, and PMT performance etc. The top panel of Fig. 5 shows the expected NPE distributions assuming simple Poisson distributions for proton and with a momentum of 1.3 GeV/, in two cases when the mean values for 1.3 GeV/ are 25 (dashed line, ) and 50 (solid line, ). In the bottom two panels of Fig. 5, survival ratios of protons and s as a function of threshold are shown. If one chooses a threshold rejecting 99 of protons, the survival ratios of s for and are 92.7 and 99.8, respectively.
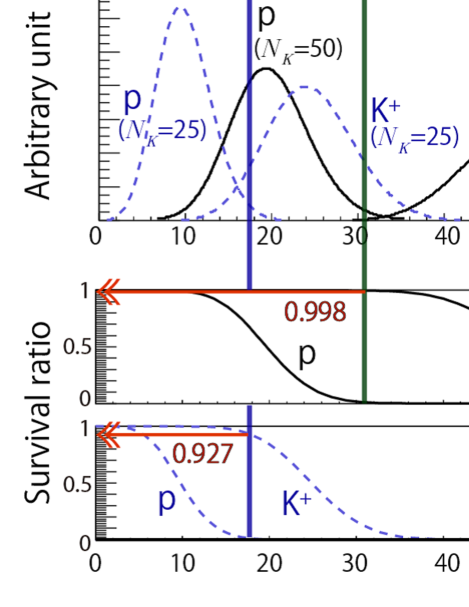
As described above, a higher survival ratio can be achieved with a detector having a larger NPE detection power, when the proton rejection efficiency is fixed.
In the J-PARC E05 experiment, we plan to use a counts/spill beam*1*1*1Two seconds of flat top is expected at the moment. at the K1.8 beam line in J-PARC. The counting rates of protons, s, and s from a 3.0 g/cm2 12C target are estimated to be 150, 1, and 20 [counts/ beams], respectively, according to a Monte Carlo simulation (Geant4 cite:geant4 ). Background particles, which do not originate from the target, such as decay particles from beams, are also simulated by the Monte Carlo method, and the counting rate is estimated to be a few tens [counts/ beams]. We have confirmed that the rate estimation is not far from the reality in S-2S, because the Monte Carlo simulation is able to reproduce particle rates (proton, , and ) in a test experiment by using the SKS with beams at J-PARC in 2015. A safety factor of five was multiplied to the estimated background counting rate ( [counts / beams]), and this value was used for the S-2S detector design. A DAQ trigger rate would be desirable to maintain the rate below a few hundred counts/spill in order to obtain data with sufficient efficiency. The existing aerogel Čerenkov detector is able to reject of s with a survival rate of approximately at the trigger level cite:ota ; cite:ichikawa . Therefore, a proton-rejection efficiency of , keeping a survival rate of , is the goal for the water Čerenkov detector at the trigger level.
It is noted that a PMT gain is deteriorated by a magnetic field. The water Čerenkov detector is planned to be installed a few meters away from the S-2S dipole magnet. We measured the magnetic field around positions where PMTs of the water Čerenkov detector will be, and found that there is about G at maximum*2*2*2: magnetic field parallel to the axis of PMT.. In the study of cite:gogami , the gain of a PMT (Hamamatsu H7195), which is the similar PMT type to ours (Hamamatsu H11284-100UV), is reduced by in the case that the magnetic field of G is yielded on the PMT. Therefore, the magnetic field on the PMTs should be suppressed in order to avoid a deterioration of the proton-rejection power which is caused by PMT-gain reductions. For the water Čerenkov detector in S-2S, we plan to adopt the bucking coil method which was proven to work to recover the PMT gain against the similar strength of magnetic field (–6 G) in an experiment of hypernuclear spectroscopy with the () reaction cite:gogami .
III Prototype Water Čerenkov Detector
A prototype water Čerenkov detector was constructed and tested by irradiating positron beams at the Research Center for Electron Photon Science, Tohoku University (ELPH) to study the basic performance of the prototype. In this section, the prototype design and results of the beam test are described.
III.1 Design of the Prototype Water Čerenkov Detector
A water Čerenkov detector was used in experiments of hypernuclear spectroscopy with the () reaction at Jefferson Lab (JLab) cite:gogami . There are accumulated studies about the water Čerenkov detector in the () experiment at JLab cite:wc_theses , and our design and choices of materials for a prototype were inspired by them cite:wc_theses2 .
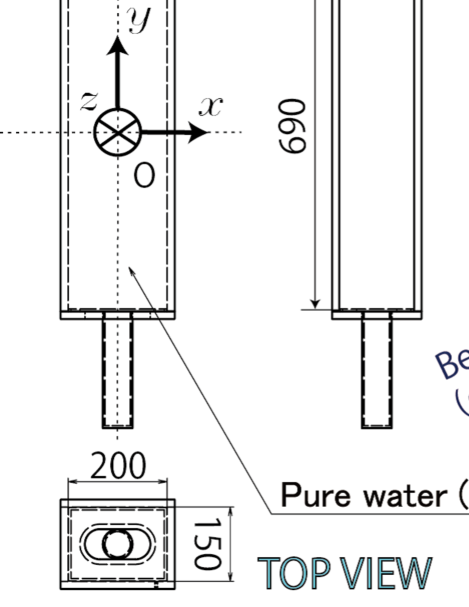
The prototype water Čerenkov detector consists of a white acrylic container filled with pure water (purified water Clean Clean*3*3*3KOGA Chemical Mfg Co., Ltd., http://www.kykk.jp/, electrical conductivity of mS/m at 25∘C) with a transparent acrylic window attached to a PMT photocathode at the top/bottom side. The container was made of 15-mm-thick white acrylic boards bonded by polymerization bonding, except for a cap part. The cap part was attached to the main container by winding with polypropylene bands (PP bands). A diffuse reflection material, Tyvek sheet (Tyvek 1060B*4*4*4DuPont, http://www.dupont.com/), which is widely used as a building material, was attached on the inside of the container by a support structure. PMTs (Hamamatsu H11284-100UV cite:hamamatsu ) were attached on the top and bottom of the container by using silicon optical coupling grease (BC-630*5*5*5Saint-Gobain Crystals, https://www.saint-gobain.com/fr, ). Between the radiation medium and the PMT, 5 mm windows made of transparent acrylics (Acrylite001*6*6*6Mitsubishi Rayon company, http://www.mrc.co.jp/acrylite/) were inserted. After the above materials were assembled, we winded the black sheets (thickness of 0.1 mm), which is made of polyvinyl chloride (PVC), around the container more than twice for light shielding. Figure 6 shows a drawing of the prototype water Čerenkov detector. The effective volume was mm3.
III.2 Experimental Setup
A test experiment was performed using positron beams in the positron/electron beam line at ELPH cite:ishikawa1 ; cite:ishikawa2 in order to investigate the basic performance factors of the prototype water Čerenkov detector such as position and angular dependencies of NPE.
Figure 7 shows a schematic drawing of the experimental setup.
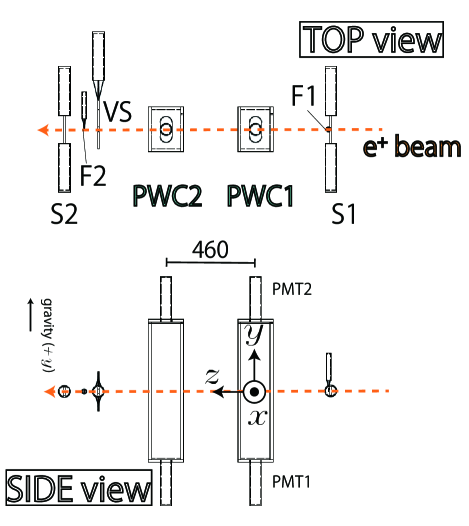
Positron beams with () impinged on two sets of prototype water Čerenkov detectors (PWC1, PWC2). Two plastic scintillation detectors (S1, F1) before PWCs and three plastic scintillation detectors (VS, F2, S2) after PWCs were installed. VS had a 25 mm hole at the center so as to reject background particles in the off-line analysis. S1, S2, and F1 were used for both data-taking trigger and off-line analysis. Detector sizes and distances with respect to S1 are summarized in Table 1.
| Detector | Distance | Size [mm] | Remarks |
| [mm] | |||
| S1 | 0 | Plastic scintillation detector | |
| (used for trigger) | |||
| F1 | 6 | Plastic scintillation detector | |
| (used for trigger) | |||
| PWC1 | 382 | Water Čerenkov detector | |
| PWC2 | 842 | Water Čerenkov detector | |
| VS | 1190 | Plastic scintillation detector | |
| with a 25 hole at the center | |||
| (used for off-line analysis) | |||
| F2 | 1266 | Plastic scintillation detector | |
| (used for off-line analysis) | |||
| S2 | 1369 | Plastic scintillation detector | |
| (used for trigger) |
PWCs could be displaced and tilted using a movable frame in order to change incident positions and angles of the beams on PWCs. - and -coordinates are defined in Fig. 7, and and are the angles of incident beams on PWC.
III.3 Analysis
III.3.1 NPE calibration
The number of photoelectrons was obtained from the analog-to-digital converter (ADC) spectrum of each PMT of the water Čerenkov detector. The ADC was calibrated with light from a light-emitting diode (LED) (Para Light LED 3.0 mm L-314LBD*7*7*7Para Light Electronics company, http://www.para.com.tw/), which was installed in the container of the water Čerenkov detector. The LED light intensity was adjusted to generate a few NPE signals on each PMT by controlling the height and width of input rectangular pulses generated by an arbitrary/function generator.
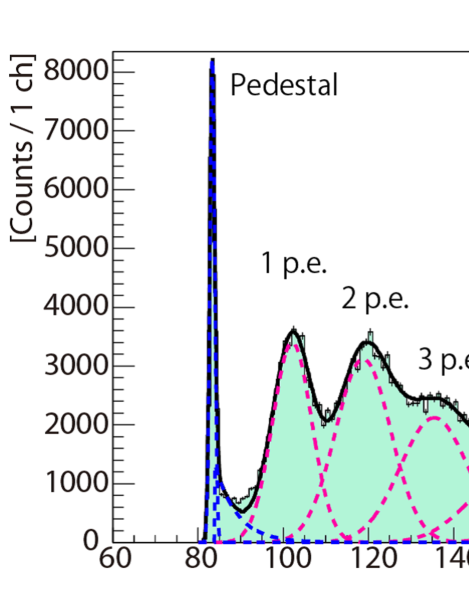
Fig. 8 shows an ADC histogram of H11284-100UV obtained using the LED light. The ADC histogram was fitted with a convolution of a Gaussian function for the pedestal, Poisson functions for photoelectron peaks, and an exponential function for residual background events between the pedestal and a single photoelectron peak (1 p.e.) cite:wcfit . The ADC channel for a single photoelectron () was then obtained from the fitting, and it was used for conversion from an ADC histogram to an NPE histogram as follows:
| (2) |
III.3.2 Mean NPE Derivation
In order to obtain a mean NPE value (MNPE), the converted NPE histogram was fitted with a Gaussian function. An event selection was applied in the NPE analysis as follows:
| (3) |
where S1, S2, F1, F2, and VS correspond to ADC and TDC selections for each detector. In addition, TDC*8*8*8Time to Digital Converter selections of PWCs were also applied to select events in an appropriate timing window. Fig. 9 shows a typical NPE histogram with a fitting result after the above event selections were applied.
III.4 Results
III.4.1 Mean NPE at Center position
The mean NPEs obtained for PWC1 and PWC2 at are summarized in Table 2.
| PWC1 | PWC2 | ||
|---|---|---|---|
| MNPE | PMT1 (top) | ||
| PMT2 (bottom) | |||
| MsNPE | PMT1+PMT2 (sum) | ||
The MNPE detected in each PMT was approximately 65, except for the bottom PMT of PWC1 (PWC1-2). The smaller NPE of PWC1-2 could be possibly caused by an air gap between the PMT and acrylic window. As described in Sec. V.2.8, an air gap causes an NPE reduction of approximately . If the NPE of PWC1-2 is corrected by a factor of , the NPE becomes NPE, which is then consistent with the others within the standard deviation of PMT individual performance difference (, Sec. V.2.6). The air gap was considered to be caused by loose PMT attachment to the frame.
III.4.2 Incident Angle () Dependence
Mean summed NPEs*9*9*9Summed NPE; a mean NPE obtained by fitting to a summed NPE spectrum (NPE sum of top and bottom PMTs). (MsNPE) of PWC1 were obtained as follows:
| (4) | |||||
| (5) |
at and , respectively. There was a large reduction in compared to . The NPE reduction would be caused by the detachment of PMTs from acrylic windows when the PWC was tilted to observe the angular dependence as well as the situation of PWC1-2 in Sec. III.4.1. If the is corrected by :
| (6) |
The MsNPE variation was obtained to be approximately in the range from to deg by comparing the two values in Eq. (4) and Eq. (6).
III.4.3 Vertical Position () Dependence
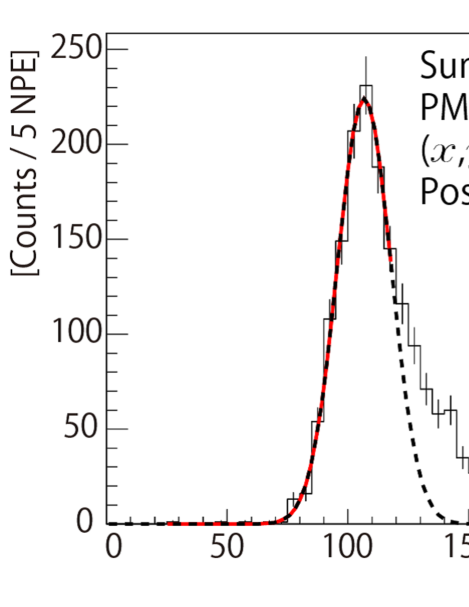
Figure 10 shows the -position dependence of M(s)NPE at for and 8 deg. The M(s)NPE values were normalized so as to make the M(s)NPEs at unity.
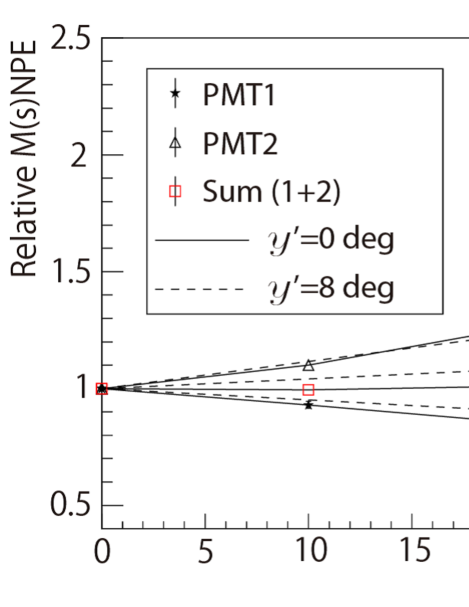
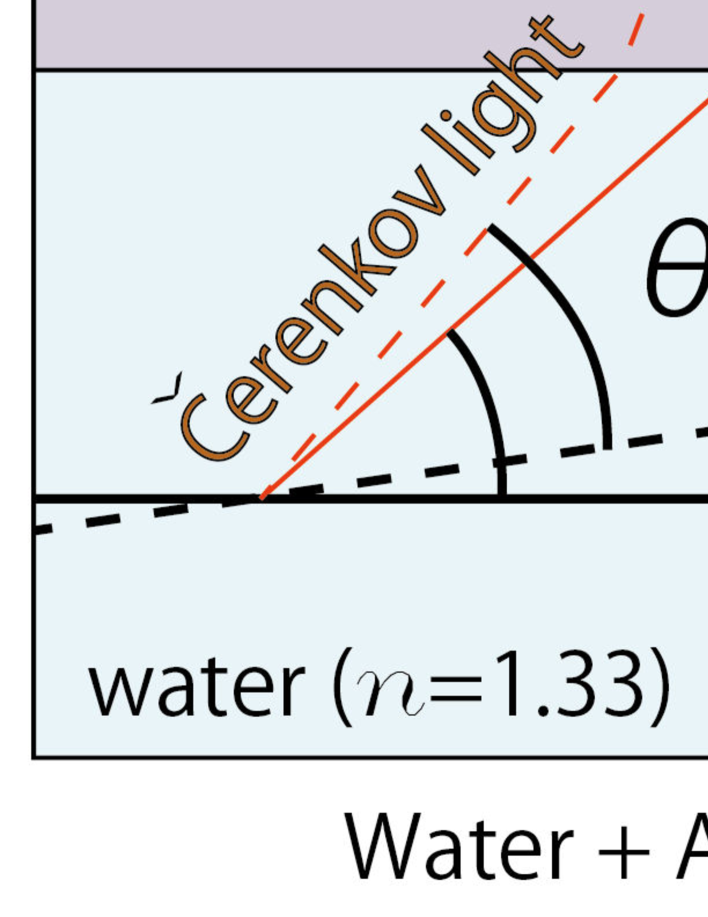
The MNPE of PMT2 for deg steeply increases at approximately cm. This is considered to be caused by direct Čerenkov light detection in the PMT. The Čerenkov radiation angle relative to an incident particle direction is calculated as follows cite:pdg :
| (7) |
Thus, the radiation angle of a particle in water () is obtained as follows:
| (8) |
Taking into account the radiation angle, the geometry of the prototype water Čerenkov detector and the refraction between water and the acrylic window (), the direct Čerenkov light arrives at the PMT photocathode at cm and cm for and 8 deg, respectively. In the results, however, the NPE increase starts at approximately cm for deg. The difference might be due to the air gap between the optical coupling grease and PMT. Moreover, there is no such increase for deg. This could also be explained by the air gap. Čerenkov light directly reaches the PMT photocathode if there is no air gap, as shown in the left schematic diagram of Fig. 11. On the other hand, Čerenkov light that satisfies the following condition does not reach the PMT photocathode directly owing to total reflection at a boundary between the air and optical coupling grease:
| (9) |
where () is the angle of light with respect to the -axis on the -plane and and are, respectively, the refractive indexes of water () and air (). In the calculation, it is assumed that the thickness of the optical grease is zero. Using Eq. (8), for deg and deg are obtained as follows:
| (10) | |||
| (11) |
According to Eq. (9), Eq. (10), and Eq. (11), total reflection occurs for deg, but does not for deg, as shown in the right schematic diagram of Fig. 11, which is consistent with what we observed in Fig. 10.
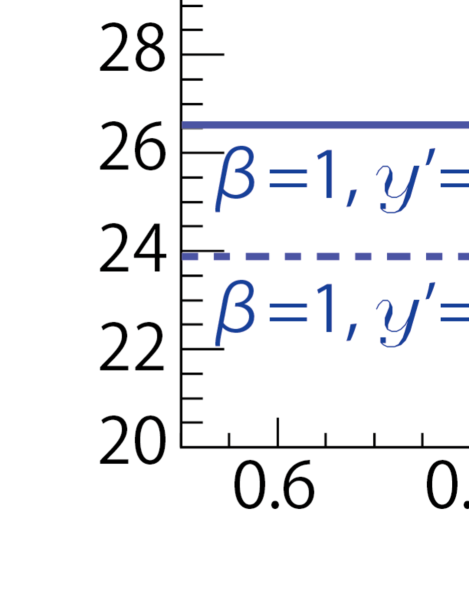
In the S-2S experiment, the proton-rejection efficiency would be reduced if direct Čerenkov light detection occurs while keeping the same detection efficiency. Figure 12 shows a threshold () for Čerenkov light directly arriving at a PMT photocathode as a function of proton momentum for and 8 deg. The for particles with is also shown as a reference. The S-2S acceptance is shown as a colored box, and the thresholds of protons are barely in the acceptance. However, the ratio of the number of events that would cause direct Čerenkov light detection to those in the whole S-2S acceptance is estimated to be according to a Monte Carlo simulation. Therefore, the effect of reduction in proton rejection efficiency due to direct Čerenkov light detection is considered to be negligibly small.
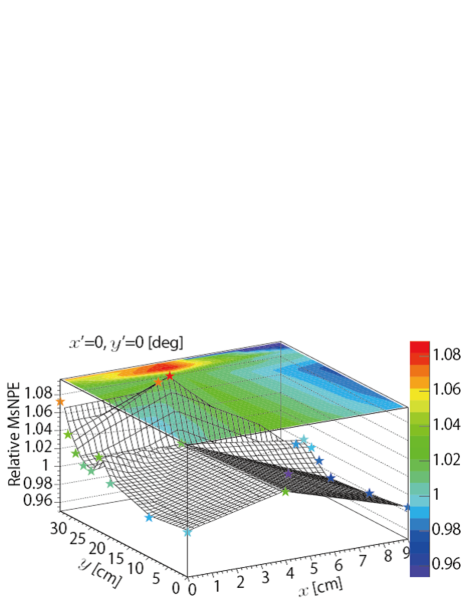
III.4.4 -Position Dependence
Figure 13 shows an MsNPE histogram in two-dimensions for . The MsNPE at is normalized to unity in the figure. It was found that the MsNPE is higher for larger and lower for larger . The incident-beam-position dependence of the MsNPE was measured to be .
III.4.5 Incident Angle () Dependence
The horizontal beam angle, , was also varied in the beam test ( deg), but no dependence on was observed within the error.
III.4.6 Summary of the Beam Test
In summary of the positron beam test, the prototype water Čerenkov detector was able to achieve a summed NPE of for a particle. An MsNPE variation of due to the beam position and angular dependencies is confirmed for almost all particle tracks to be measured in the S-2S acceptance.
IV Selection of Čerenkov Light Window Material
Based on the measured NPE mean value for the previous prototype, the proton-rejection efficiency was estimated by using a Monte Carlo simulation. The Monte Carlo simulation showed that the proton rejection efficiency at the higher momentum region in S-2S would not be sufficient. We attempted to improve the NPE detection power by optimizing the choice of Čerenkov light window material.
IV.1 Motivation
We achieved in the prototype water Čerenkov detector (PWC) for a particle, as shown in the previous section. A Monte Carlo simulation was performed to estimate the proton-rejection efficiency with the same simulation framework as that described in Sec. VI, taking into account the obtained MsNPE and its dependence on incident-particle angles and positions. Figure 14 shows estimated survival ratios for protons and s as a function of particle momentum in S-2S assuming that *10*10*10The assumed NPE value is smaller by approximately 10 than that obtained in the positron beam test. for particles. The proton-rejection efficiency at approximately 1.6 GeV/ is less than our goal of when maintaining the survival ratio of .
Thus, further development to improve NPE was needed.
IV.2 Effect of Window Material on NPE
Figure 15 shows the calculated number of photons of Čerenkov light per unit length of incident particle per wavelength as a function of the wavelength for proton, , and with the momentum of 1.3 GeV/ (Eq. (1)). As shown in the figure, Čerenkov radiation yields more photons of shorter wavelength because the number of photons is inversely proportional to the wavelength ( in Eq. (1)).
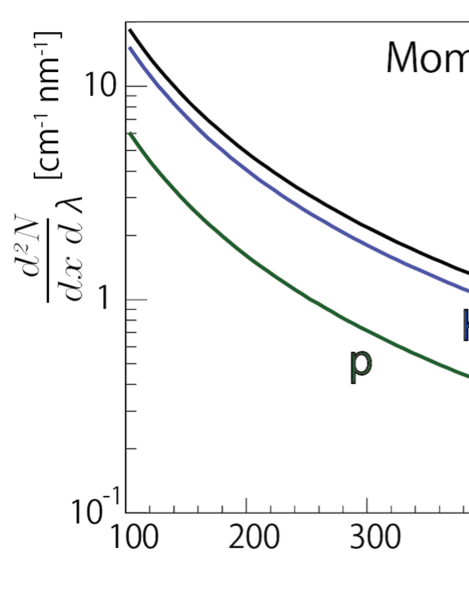
Therefore, it is a key point to minimize light absorption particularly for ultraviolet light in order to achieve larger NPE. Light loss is mainly caused by the water, reflection material, acrylic window, optical coupling grease, and PMT window glass. The quantum efficiency of PMT should be also considered as it is related to the detection of Čerenkov light. Thus, a figure of merit (FoM) is defined as follows:
| (12) | |||||
where is the light-transmitting efficiency for each material and is the PMT quantum efficiency. Here, the absorption by the reflection material is neglected as the wavelength dependence of the light absorption is nearly flat in the range we consider. We attempted to determine the best configuration that maximizes the FoM with our choice of materials, taking into account the cost.
Light Absorption by Water
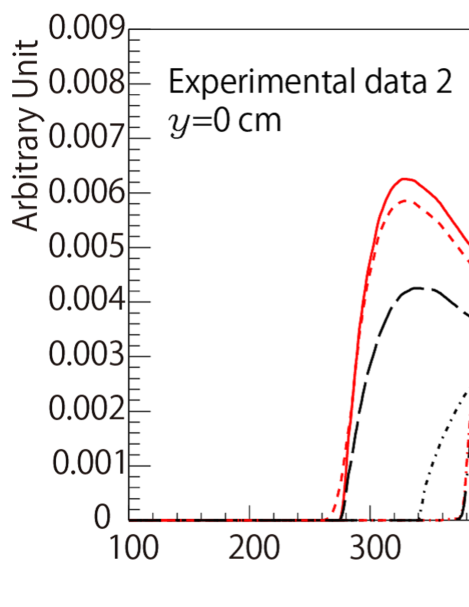
Examples of water-absorption spectra are shown in Fig. 16. In the figure, three experimental data were plotted. One is taken from cite:water1 and is labeled as “Experimental data 1”. The others are taken from cite:water3 and cite:water2 with covered ranges of 200–320 nm and 380–700 nm, respectively. These two data are labeled as “Experimental data 2”. Dashed lines represent extrapolations and an interpolation of the experimental data. Although the extrapolation and interpolation of data would not be valid, we used them for the calculation of as shown later (Fig. 21).
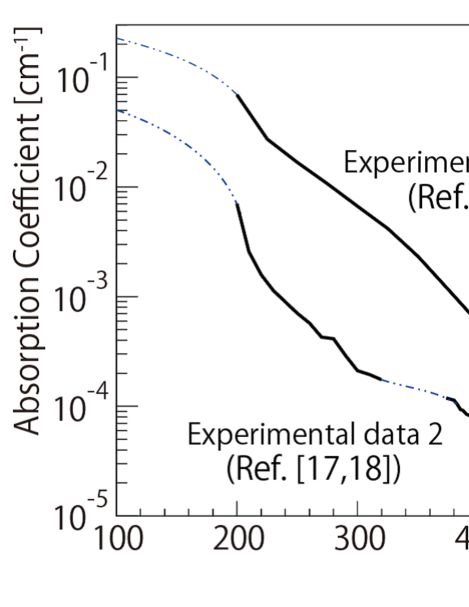
The absorption coefficients, especially for the UV region, are quite different between “Experimental data 1” and “Experimental data 2”. The difference is caused by a difference of water purity, and purer water has a smaller absorption coefficient for the UV region cite:water3 . Thus, the water used in the water Čerenkov detector should be as pure as possible, and the water should be handled carefully to avoid any contamination.
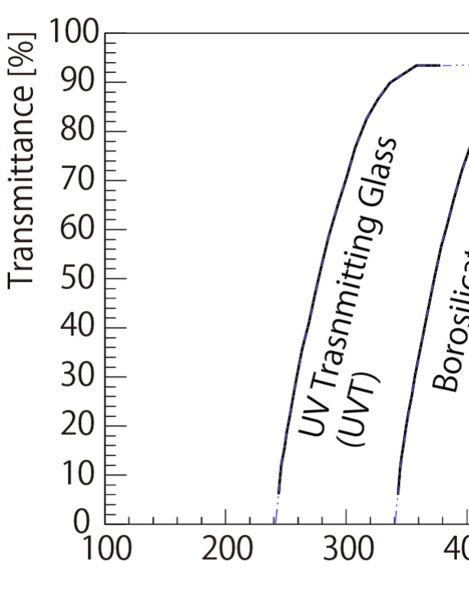
Transmittance of Acrylic Window
We measured the transmittances of the following acrylic materials with thicknesses of 5 mm by using a spectrophotometer (Shimazu Corporation MPS-2000):
-
•
Acrylite001
-
•
Acrylite000*11*11*11Mitsubishi Rayon company, https://www.mrc.co.jp/
-
•
UV00*12*12*12Kuraray company, http://www.kuraray.co.jp/
-
•
S-0*13*13*13Nitto Jushi Kogyo company, http://www.clarex.co.jp/
The results are shown in Fig. 17.
The transmittance of Acrylite, which was used for the previous prototype water Čerenkov detector (Sec. III), drops at approximately 380 nm. On the other hand, the transmittances of other acrylics drop at approximately 280 nm.
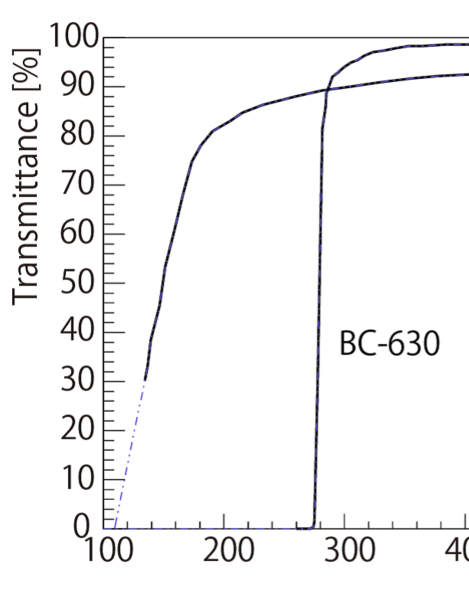
Transmittance of Optical Coupling Grease
The transmittance of an optical coupling grease, Saint-Gobain BC-630 (), which was taken from cite:bc630 , is shown in Fig. 18. For comparison, the nominal transmittance of an optical crystal, OKEN*14*14*14Ohyo Koken Kogyo company, http://www.oken.co.jp/weboken/indexen.htm BaF2 (*15*15*15This value is at the wavelength of 400 nm.), is also shown (dashed lines for BaF2 represent extrapolations of the data).
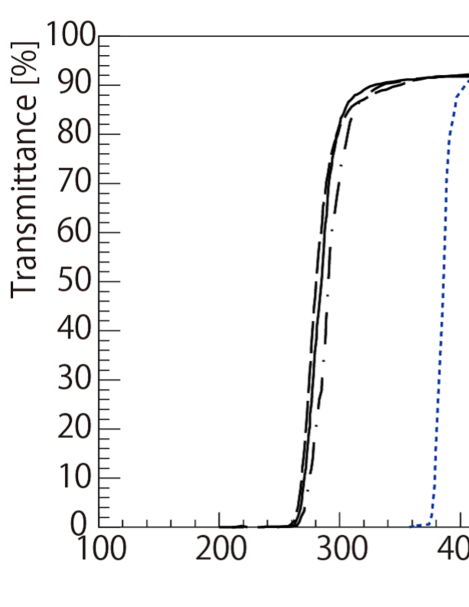
Transmittance of PMT Window
Before Čerenkov light reaches a PMT photocathode, the light has to pass through a PMT window. The nominal transmittances of PMT windows (UV transmitting glass (UVT), borosilicate glass (BSG)) are shown in Fig. 19 cite:hamamatsu (dashed lines represent extrapolations of the data). The transmittance of the UVT is higher in the UV region compared to that of BSG.
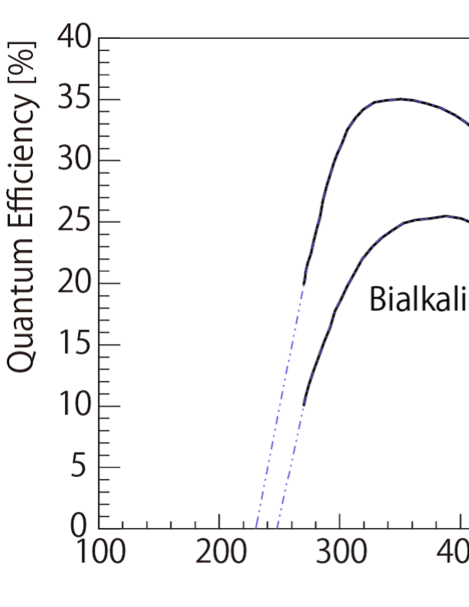
PMT Quantum Efficiency
Fig. 20 shows the nominal quantum efficiencies of PMT photocathodes (bialkali (BA) and super bialkali (SBA)) cite:hamamatsu . The quantum efficiency of SBA is higher than that of BA by approximately at the wavelength of 350 nm (dashed lines represent extrapolations of the data).
Search for the Best Configuration
The in Eq. (12) for a different choice of the above materials was calculated, and some of results at cm using Experimental data 2 are shown in Fig. 21. The results were calculated for a with a momentum of 1.3 GeV/, assuming that the path length of generated Čerenkov light in the container is cm.
The ordinate axis was normalized so as to make the FoM with a configuration of (BC-630+UV00+SBA+UVT) unity. FoM calculation results for some typical configurations are listed in Table 3. It is noted that the FoM with configuration 1 (BC-630+UV00+SBA+UVT) using Experimental Data 2 is normalized to unity in Fig. 21.
| Configuration | Data of | Normalized FoM |
|---|---|---|
| Water Absorption | ||
| 1) | 1 | 0.916 |
| BC-630+UV00+SBA+UVT | 2 | 1 |
| 2) | 1 | 0.866 |
| BaF2+UV00+SBA+UVT | 2 | 0.948 |
| 3) | 1 | 0.868 |
| BaF2+S-0+SBA+UVT | 2 | 0.952 |
| 4) | 1 | 0.848 |
| BaF2+000+SBA+UVT | 2 | 0.923 |
| 5) | 1 | 0.675 |
| BC-630+UV00+BA+UVT | 2 | 0.73 |
| 6) | 1 | 0.396 |
| BC-630+UV00+BA+BSG | 2 | 0.404 |
| 7) | 1 | 0.438 |
| BC-630+000+SBA+UVT | 2 | 0.444 |
| 8) | 1 | 0.352 |
| BC-630+000+BA+UVT | 2 | 0.356 |
The prototype water Čerenkov detector used for the positron beam test (Sec. III) adopted configuration 7 (BC-630++SBA+UVT) in Table 3. If one changes the acrylic window (Acrylite) to one transmitting UV light such as UV00 (configuration 1), the NPE is expected to be significantly improved compared to that of the previous configuration. This significant improvement is caused by a recovery of the light spectrum in the UV region, as shown in Fig. 21. In order to confirm the above estimation and determine a Čerenkov light window material maximizing NPE, we performed a cosmic-ray test, which is described in the next section.
IV.3 Cosmic-ray Test for Optimizing the Window Material
Figure 22 shows a schematic drawing of the experimental setup for optimizing the window material using cosmic rays. The container was the same as that used in the beam test (Sec. III), but a cap part was newly designed and constructed in order to change the acrylic windows easily. A PMT of H11284-100UV was attached on the UVT acrylic window by using BaF2. The cap part was attached to the container using a PP band, and the container was filled with pure water. An LED was attached on the PMT near the photocathode for use in the NPE calibration, as described in Sec. III.3.1. The container was sandwiched between two plastic scintillation counters, which were used as data-taking triggers. The plastic scintillation detectors were set at cm during this test.
In the test, NPEs with UVT acrylic materials of UV00, S-0, and Acrylite (Fig. 17) were studied and compared with that resulting from Acrylite.
A conversion from ADC to NPE was performed using data with LED light, as described in Sec. III.3.1. A typical NPE histogram is shown in Fig. 23. The NPE spectrum was fitted with a single-Gaussian function to obtain the mean value (MNPE), which was used as the optimization parameter in this cosmic-ray test.
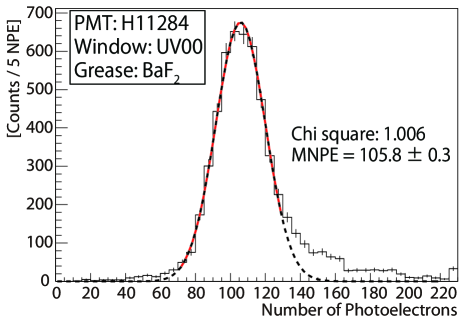
The MNPE results for UV00, S-0, and Acrylite are summarized in Table 4. Errors in the results are statistical and systematic (, Sec. V.2.2). Each acrylic window was tested twice to check the reproducibility, and the MNPEs of two measurements for each window usage were consistent within the errors. All the tested windows were able to achieve better MNPEs than that of Acrylite by . The NPEs with UV00 and S-0 were larger than that of Acrylite by , though a difference of NPEs between UV00 and S-0 was not observed within the errors. Consequently, we decided to use UV00 as the Čerenkov window material.
| Window material | MNPE | Trial |
|---|---|---|
| UV00 | 1 | |
| 2 | ||
| S-0 | 1 | |
| 2 | ||
| Acrylite000 | 1 | |
| 2 |
It is noted that BaF2 was used as an optical coupling grease in this test. We also measured MNPE with BC-630 instead of BaF2, but no difference was observed. However, BaF2 has the lower viscosity than that of BC-630. In terms of stability, we decided to use BC-630.
V New Prototype Water Čerenkov Detector
The window material was optimized as described in the previous section. A new prototype was constructed with the new window material, which has high transmittance in the UV region. In this section, the design of the new prototype and the performance test with cosmic rays are described.
V.1 Design
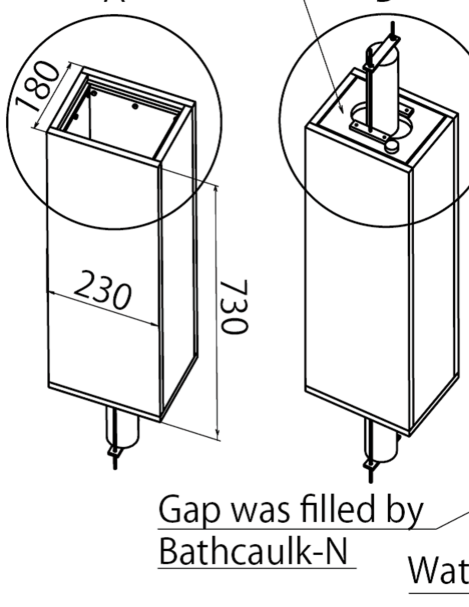
The design of the new prototype water Čerenkov detector is similar to that of the previous prototype, as described in Sec. III.1, except for window material, cap part and the way to attach the reflection material inside the container. Figure 24 shows a drawing of the new prototype water Čerenkov detector.
UV00 was chosen (Sec. IV.3) and used as the window material, which was bonded to an inner surface of the container box by polymerization. The cap part was designed as shown in Fig. 25. The size of the cap part is smaller than the opening mouth of the container box. There is a frame on the inner surface of the container to support the cap. Then, a caulking material (CEMEDINE, Bathcaulk N*16*16*16CEMEDINE Co., http://www.cemedine.co.jp/e/index.html) was filled into a gap between the cap part and container box to seal the detector. Small plastic pieces which have a screw hole were bonded to the inner surface of the container box by polymerization, and Tyvek sheets (reflection material) were attached to the plastic pieces by plastic screws. The effective volume was mm3.
V.2 Cosmic-ray Test
In the cosmic-ray test, the dependence of mean NPE (MNPE) on the incident particle position, applied HV, and time after construction were measured. Furthermore, systematic errors in NPE due to calibration, difference in individual PMT performance, and the effect of the optical coupling grease were investigated.
V.2.1 Experimental setup
The experimental setup was similar to that of the cosmic-ray test described in Sec. IV.3. The prototype water Čerenkov detector was sandwiched by two plastic scintillation detectors, which were used as trigger counters for data collection. The two trigger counters could be moved to observe the dependence of mean NPE on the incident particle position. Fig. 26 shows a photograph of the experimental setup.
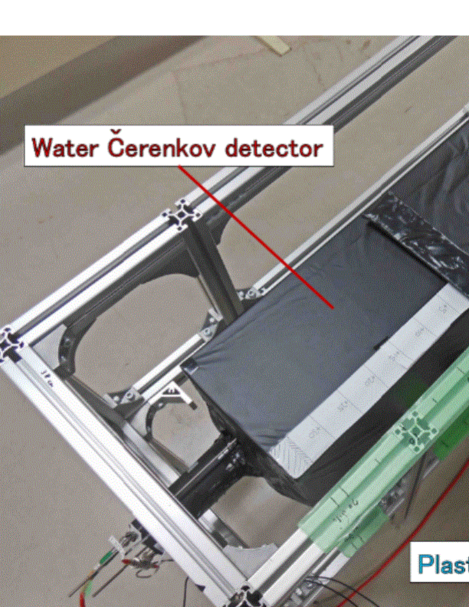
An LED, which was used for the NPE calibration, was attached beside a PMT photocathode*17*17*17Outside of the container box..
V.2.2 LED Calibration and Systematic Error
The ADC channels for a single photoelectron is obtained by fitting an ADC histogram with LED as shown in Fig. 8. Possible fluctuations of the calibration process due to temperature etc. were examined by repeating the calibration measurements for two different PMTs in a period of one week. The obtained ADC channels per photoelectron for H11284-100UV PMTs with serial numbers of ZK6920 ( V) and ZK6922 ( V) are plotted in Fig. 27.
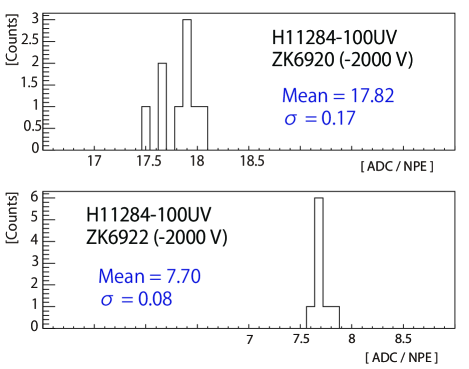
It is found that the standard deviations were for both PMTs. In the present report, the systematic error of the resulting NPE is taken as ().
V.2.3 NPE Detection Performance
The mean NPEs (MNPE) detected by TOP (ZK6922, V) and BOTTOM (ZK6920, V) PMTs at cm*18*18*18Coordinates are defined as Fig. 6. were
| (13) | |||
| (14) |
The mean summed NPE (MsNPE) obtained by fitting to a summed NPE histogram was
| (15) |
The difference between TOP and BOTTOM MNPEs mainly originates from how the Tyvek sheet was attached inside the container, as discussed quantitatively in Sec. V.2.6.
V.2.4 -Position Dependence
The dependence of MNPE on incident particle positions is rather stronger in the -direction than in the -direction, as shown in the positron beam test (Fig. 13). Thus, the -position dependence was investigated by changing the position of trigger scintillation counters in the -direction. Figure 28 shows resulting M(s)NPEs as a function of the -position. The M(s)NPEs were normalized to unity at cm.
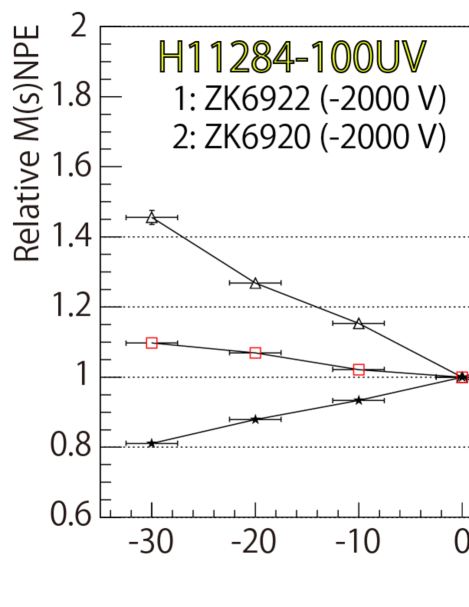
The -position dependence is not flat for the summed NPE. The dependence might be caused by asymmetric tendencies of photon yield (Fig. 15) and absorption coefficients of water (Fig. 16) for Čerenkov light with different wavelengths. For Čerenkov light with a shorter wavelength, the light yield is greater, but the absorption coefficient of water is larger as well. The MsNPE variation depending on the incident -position was obtained as .
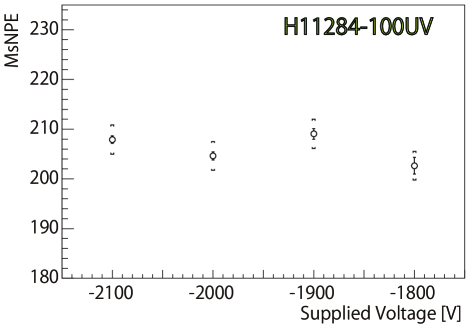
V.2.5 HV Dependence
The supplied high voltages (HVs) for PMTs were varied from V to V, and the HV dependence of NPE was investigated. Figure 29 shows the HV dependence of MsNPE with statistical and systematic errors. The systematic errors are represented by brackets (, Sec. V.2.2). No HV dependence was found within the errors.
V.2.6 Performance Difference of Individual PMTs
The NPE depends on the performance factors of individual PMTs, such as quantum efficiency, and this dependence was studied by measuring NPEs with PMTs of different serial numbers. Table 5 lists serial numbers, applied HVs, ADC channels per photoelectron (ADC/NPE), and obtained MNPEs at cm.
| Serial | HV | ADC/NPE | PMT | MNPE | Normalized |
|---|---|---|---|---|---|
| number | [V] | position | MNPE | ||
| ZK6919 | 11.18 | BOTTOM | |||
| ZK6920 | 19.08 | BOTTOM | |||
| ZK6922 | 7.21 | TOP | |||
| ZK6925 | 7.04 | TOP | |||
| ZK7295 | 6.31 | BOTTOM | |||
| ZK7296 | 4.19 | BOTTOM | |||
| ZK7298 | 9.97 | BOTTOM | |||
| ZK7299 | 6.12 | TOP | |||
| ZK7300 | 7.63 | TOP | |||
| ZK7301 | 6.31 | TOP | |||
| ZK7302 | 7.87 | BOTTOM | |||
| ZK7303 | 4.20 | BOTTOM | |||
| ZK7304 | 5.21 | TOP | |||
| ZK7305 | 4.44 | BOTTOM | |||
| ZK7306 | 3.80 | TOP | |||
| ZK7307 | 13.50 | TOP | |||
| ZK7308 | 11.82 | TOP | |||
| ZK7309 | 7.71 | BOTTOM | |||
| ZK7310 | 4.58 | BOTTOM | |||
| ZK7311 | 10.88 | BOTTOM | |||
| ZK7312 | 6.46 | TOP | |||
| ZK7313 | 7.81 | TOP | |||
| ZK7315 | 8.84 | TOP | |||
| ZK7316 | 3.31 | TOP |
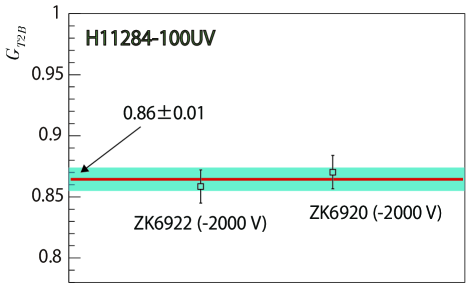
There is a systematic difference between MNPEs detected by TOP and BOTTOM PMTs. The container geometry was not symmetric, because the cap part was only attached to the TOP side. The geometric asymmetry of the container made the reflection-sheet attachments asymmetric, and we observed a systematic NPE difference between TOP and BOTTOM MNPEs. In order to obtain a geometrical correction factor () that normalizes a TOP MNPE to that of BOTTOM, data swapping of TOP and BOTTOM PMTs was performed. Table 6 lists MNPE results of the swapping test.
| ZK6922 ( V) | ZK6920 ( V) | |
|---|---|---|
| TOP | ||
| BOTTOM |
BOTTOM MNPE ratios relative to TOP ones are shown in Fig. 30. The geometrical correction factor was obtained as through a fitting to the results, as represented by a line in Fig. 30.
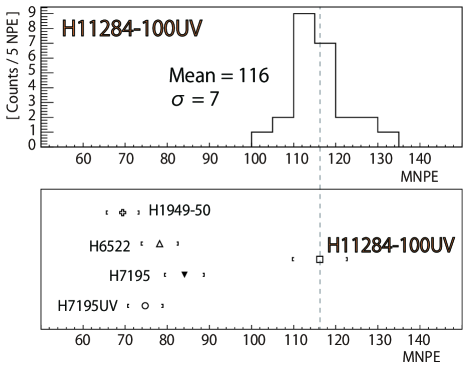
MNPEs normalized using for comparison with each other are listed in the last column of Table 5. The BOTTOM MNPEs were normalized to those of TOP in the table (BOTTOM MNPEs were divided by ). The center values of normalized MNPEs were filled in a histogram and shown in the top panel in Fig. 31. The mean value and standard deviation were obtained as 116 and 7 (), respectively.
The standard deviation also includes errors due to the calibration (), reproducibility of PMT attachment, and statistics (). The errors of reproducibility are expected to be smaller or comparable to that of the calibration (), as indicated in Table 4 and Table 8. Thus, the performance difference of individual PMTs was estimated to be ().
V.2.7 PMT-Type Difference
To confirm the PMT choice of H11284-100UV that has a super bialkali photocathode and UV transmitting window (SBA+UVT), other types of Hamamatsu PMTs (H6522, H1949-50, H7195, H7195UV) were tested with cosmic rays. The MNPE results are listed in Table 7 and the bottom panel of Fig. 31. Errors in the results are statistical and *19*19*19The systematic error () is negligibly small compared to . It was found that the PMT H11284-100UV is able to achieve an MNPE greater than those achieved with the other types of PMTs by more than 30.
| PMT | Normalized | ||
|---|---|---|---|
| Type | Photocathode + Window | Serial Number | MNPE |
| H11284-100UV | SBA + UVT | - | (Sec. V.2.6) |
| H6522 | BA + UVT | LA1537 | |
| H1949-50 | BA + BSG | WA6589 | |
| H7195 | BA + BSG | RD7198 | |
| H7195UV | BA + UVT | LA1528 | |
V.2.8 Effect of Optical Coupling Grease
To observe the NPE difference between the cases with and without the optical coupling grease, data without the use of the grease were taken and compared. The test proceeded as follows:
-
•
The optical coupling grease (Saint-Gobain BC-630) was used between the acrylic windows and PMTs for both the TOP and BOTTOM PMTs in the first trial (Trial 1).
-
•
Then, the grease for the BOTTOM PMT was removed, and the PMT and acrylic window were only physically attached (Trial 2).
-
•
Finally, the grease was used for the BOTTOM PMT again to check reproducibility (Trial 3).
Table 8 shows the MNPE results. The errors in the results are statistical and systematic ().
| Trial | ZK6922 ( V) | ZK6920 ( V) |
|---|---|---|
| [TOP] | [BOTTOM] | |
| 1 | ||
| 2 | ||
| (No Grease) | ||
| 3 |
It was found that the MNPE is reduced by approximately when the optical coupling grease is not used. This reduction might be caused by the air gap between the PMT and acrylic window. If there is an air gap between a PMT window and acrylic window, total reflection occurs for a photon with a certain incident angle at the boundary.
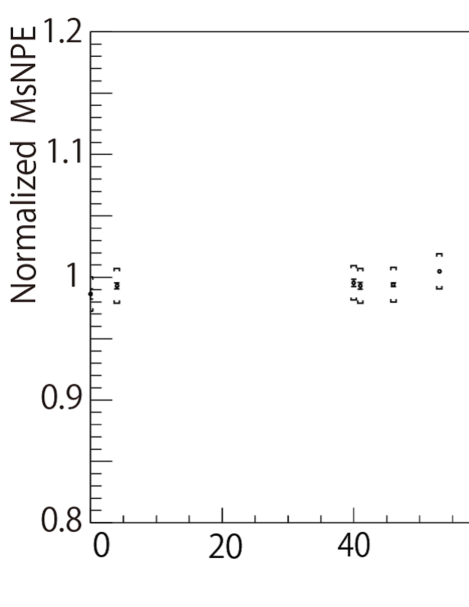
V.2.9 Long-Term Stability
The water Čerenkov detector should work stably during the term of an experiment, which is typically around a month. In order to check long-term stability, NPE measurement was performed with cosmic rays for 100 days. Figure 32 shows MsNPE results of the measurement. The MsNPEs were normalized so as to make the mean value of obtained MsNPEs unity. It was confirmed that the prototype water Čerenkov detector was able to work stably for 100 days.
VI Expected Proton Rejection Power by a Monte Carlo Simulation
The performance of one segment of the water Čerenkov detector was discussed in the above sections. In the experiment J-PARC E05, however, twelve segments of water Čerenkov detectors will be installed in two layers, as shown in Fig. 33. A Monte Carlo simulation (Geant4 cite:geant4 ) was performed in order to study the performance of the water Čerenkov detector as a total system of twelve segments in S-2S. The expected performances of proton rejection efficiency and survival ratio obtained using the Monte Carlo simulation are described in this section.
VI.1 Setup and Conditions in the Monte Carlo Simulation
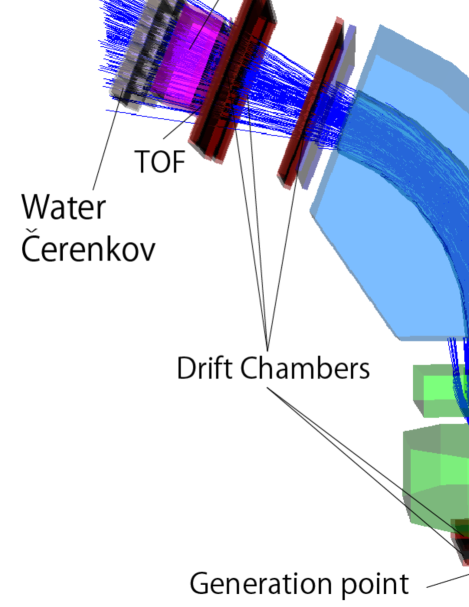
In the simulation, S-2S is modeled as shown in Fig. 1. The magnetic field of S-2S was calculated with a software using the three-dimensional finite-element method, Opera3D (TOSCA) cite:tosca . Materials were defined for the S-2S magnets (QQD), TOF detector, and water Čerenkov detector in the simulation*20*20*20Others were set as vacuum.. The water Čerenkov detector was placed 2.41 m downstream of the dipole magnet exit in the beam direction. Particles were generated at a point 600 mm upstream of the Q1 magnet entrance, where a target is planned to be installed. The MsNPE in the water Čerenkov detector when a particle is perpendicularly incident at the center is assumed to be 200, although the MsNPE was obtained to be in the cosmic-ray test, as described in Sec. V.2.3. The MsNPE value was randomly varied by event by event to take into account the performance difference of individual PMTs () as discussed in Sec. V.2.6. The MsNPE position dependence, which was represented in Sec. V.2.4, was taken into account by scaling MsNPE according to the incident position of a particle. The path length of an incident particle in the medium of the water Čerenkov detector depends on the incident position and angle. Thus, path-length scaling was applied for the MsNPE calculation event by event (Eq. (1)). Fig. 34 shows particle tracks in the simulation. Particles are made to converge sequentially in the longitudinal and transverse directions by using two quadrupole magnets (Q1 and Q2), and they are made to bend in a dispersive plane by using a dipole magnet (D) transporting the particles to the particle detectors.
| Particle Generation | Distribution | Spherical uniform |
|---|---|---|
| at the target point | Momentum [GeV/] | 1.10–1.75 |
| Angle [deg] | 0–25 | |
| Process | Electromagnetic: ON | |
| Hadronic: ON | ||
| Detector | TOF (2t cm plastic scintillator) | |
| Materials | WC (pure water + acrylic) | |
| Assumed MsNPE | 200 | |
| in WC | ( particle) | |
VI.2 Analysis and Results
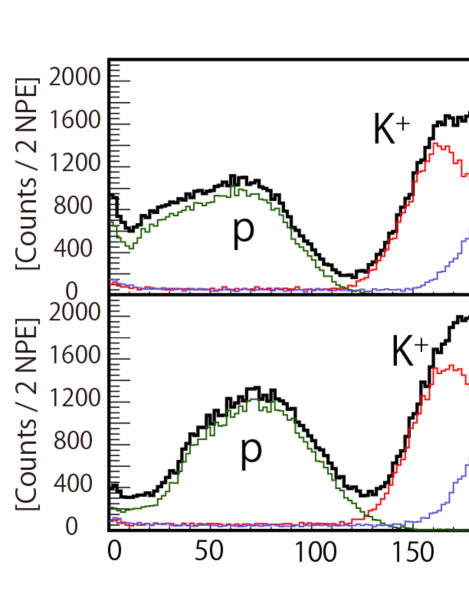
Figure 35 shows the NPE distributions in the first (WC1) and second (WC2) layers of water Čerenkov detectors for protons, s, and s with the same number of events for each kind of particle. The NPE distributions in WC2 are broader than those in WC1 owing to secondary particles that originate from some reactions in the materials and decay.
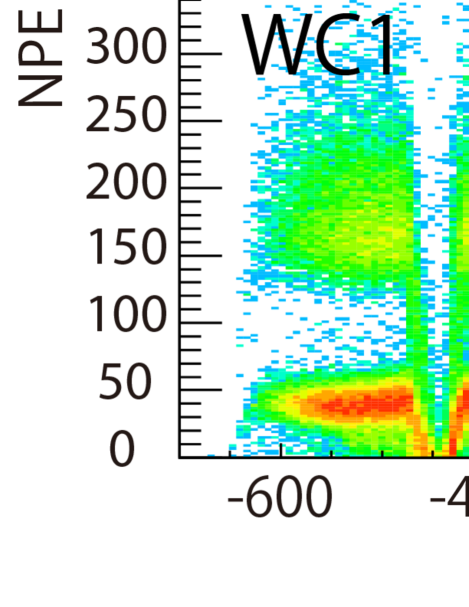
Two-dimensional plots of NPE vs. horizontal () position at the reference plane*21*21*213 cm upstream of the front surface of the water Čerenkov detector. for WC1 and WC2 are shown in Fig. 36. The inefficient region in each layer is covered by another one.
In the experiment, protons will be suppressed on-line by using a logical condition as follows:
| (16) |
and indicate that an incident particle serves an NPE that is above a certain threshold in each layer of the water Čerenkov detector. In order to estimate on-line proton-rejection efficiency, the following event-selection condition was applied:
| (17) |
where
| (18) | |||
| (19) |
The superscript represents the segment number in each layer. The selection thresholds, , were determined so that s survive in each segment.
Survival ratios for protons and s () are defined as follows:
| (20) |
where is the number of events with the event selection of Eq. (17) and is that without the event selection at the reference plane. Fig. 37 shows as a function of particle momentum at the particle generation point.
The figure shows that the water Čerenkov detector is expected to achieve a proton-rejection efficiency while maintaining a survival ratio of for s in the whole S-2S momentum acceptance. We found that the performance satisfies our requirements for hypernuclear spectroscopy at J-PARC.
VII Summary
We have developed a water Čerenkov detector for hypernuclear spectroscopy by using the new magnetic spectrometer S-2S with the (,) reaction at the momentum of 1.8 GeV/. The S-2S, which possesses high momentum resolution ( in FWHM) for the momentum region from 1.2 to 1.6 GeV/, is being constructed for the detection of scattered . Protons and s are expected to be detected in S-2S as major background sources. In order to suppress protons on-line, a water () Čerenkov detector is designed to be installed in S-2S.
We have constructed prototypes of the water Čerenkov detector and tested them by irradiating positron beams and cosmic-rays. The latest prototype was able to achieve for charged particles with long-term stability up to 100 days. A Monte Carlo simulation, taking into account information obtained from the cosmic-ray test such as the MsNPE dependence on the incident particle position etc., was performed to estimate the on-line proton-rejection efficiency. Consequently, it is estimated that the developed water Čerenkov detector is able to achieve a proton-rejection efficiency of while maintaining a survival ratio in the whole S-2S momentum acceptance. The achieved performance satisfies our requirements to perform hypernuclear spectroscopy using the (,) reaction at J-PARC.
Acknowledgment
We would like to thank Aquarium Suiso-Kobo company for their technical support in the prototype design and construction. We would also like to thank Tohoku ELPH (ELPH experiment ) and J-PARC for providing us opportunities for test experiments using beams. This work was supported by JSPS KAKENHI Grant Numbers 23000003, 13J01075.
References
-
(1)
Proposal at J-PARC, T. Nagae et al.,
P05: Spectroscopic Study of -Hypernucleus B, via the 12C Reaction, http://j-parc.jp/researcher/Hadron/en/Proposale.html - (2) T. Takahashi et al., Prog. Theor. Exp. Phys., 02B010 (2012).
- (3) Y. Nara, N. Otuka, A. Onishi, A. Niita and S. Chiba, Phys. Rev. C 61, 024901 (1999).
- (4) T. Hasegawa et al., Nucl. Instrum. Methods Phys. Res. A 342, 383-388 (1994).
- (5) T. Fukuda et al., Nucl. Instrum. Methods Phys. Res. A 361, 485-496 (1995).
- (6) T. Gogami et al., Nucl. Instrum. Methods Phys. Res. A 729, 816-824 (2013).
- (7) K. Nakamura et al., Journal of Physics G 37, 075021 (2010).
- (8) S. Agostinelli et al., Nucl. Instrum. Methods Phys. Res. A 506, 250-303 (2003).
- (9) R. Ota, Master’s thesis, Osaka University, Osaka, Japan, 2013 (in Japanese).
- (10) Y. Ichikawa, Ph.D. thesis, Kyoto University, Kyoto, Japan, 2015.
- (11) Master’s theses, Tohoku University, Sendai, Japan (all in Japanese): Y. Okayasu, “Development next generation spectrometer for hypernuclear spectroscopy using () reaction”, 2002; M. Kawai, “Development of kaon detector for next generation hypernuclear spectroscopy using () reaction”, 2008; T. Yamamoto, “Study of kaon detector for next generation hypernuclear spectroscopy using electron beam”, 2009; N. Taniya, “Study of Čerenkov counter for JLab E05-115 experiment”, 2010; A. Chiba, “Development and evaluation of Čerenkov detectors for hypernuclear spectroscopy experiments via the () reaction”, 2011.
- (12) Master’s theses, Kyoto University, Kyoto, Japan (all in Japanese): N. Amano, “Development of water Čerenkov detector for proton rejection in the (,) reaction”, 2013; K. Takenaka, “Water Čerenkov counter development for hypernuclear spectroscopy with the (,) reaction”, 2014.
- (13) T. Ishikawa et al., Nucl. Instrum. Methods Phys. Res. A 622, 1-10 (2010).
- (14) T. Ishikawa et al., Nucl. Instrum. Methods Phys. Res. A 694, 348–360 (2012).
- (15) E. H. Bellamy et al., Nucl. Instrum. Methods Phys. Res. A 339, 468–476 (1994).
- (16) G.M. Hale and M.R. Querry, Appl. Opt., 12, 555–563 (1973).
- (17) T.I. Quickenden and J.A. Irvin, Chem. Phys., 72, 4416–4428 (1990).
- (18) R.M. Pope and E.S. Fry, Appl. Opt., 36, 8710 (1997).
- (19) G. Finocchiaro et al., Proceedings of Technology and Instrumentation in Particle Physics 2014 (2014).
- (20) Hamamatsu Photonics, http://www.hamamatsu.com/
- (21) COBHAM, http://www.cobham.com/