Dust as interstellar catalyst - II.
Abstract
Context. Interstellar dust particles, which represent 1 of the total mass, are recognized to be very powerful interstellar catalysts in star-forming regions. The presence of dust can have a strong impact on the chemical composition of molecular clouds. While observations show that many species that formed onto dust grains populate the gas phase, the process that transforms solid state into gas phase remains unclear.
Aims. The aim of this paper is to consider the chemical desorption process, i.e. the process that releases solid species into the gas phase, in astrochemical models. These models allow determining the chemical composition of star-forming environments with an accurate treatment of the solid-phase chemistry.
Methods. In paper I we derived a formula based on experimental studies with which we quantified the efficiencies of the chemical desorption process. Here we extend these results to astrophysical conditions.
Results. The simulations of astrophysical environments show that the abundances of gas-phase methanol and H2O2 increase by four orders of magnitude, whereas gas-phase H2CO and HO2 increase by one order of magnitude when the chemical desorption process is taken into account. The composition of the ices strongly varies when the chemical desorption is considered or neglected.
Conclusions. We show that the chemical desorption process, which directly transforms solid species into gas-phase species, is very efficient for many reactions. Applied to astrophysical environments such as Oph A, we show that the chemical desorption efficiencies derived in this study reproduce the abundances of observed gas-phase methanol, HO2, and H2O2, and that the presence of these molecules in the gas shows the last signs of the evolution of a cloud before the frost.
Key Words.:
dust, extinction - ISM: abundances - ISM: molecules - stars: formation1 Introduction
Observations of cold environments (i.e., pre-stellar cores) have shown unexpected amounts of several molecules in the gas phase (Bacmann et al. 2012) while these species should be depleted in gas and adsorbed onto cold dust grains (T20 K) (Collings et al. 2004). To understand these observations, many experimental studies have focused on the transition between solid and gas phase in conditions similar to the one encounter in the interstellar medium (ISM). Many mechanisms involving thermal processes (Collings et al. 2004, Bisschop et al. 2006) or non-thermal processes, such as photodesorption (DeSimone et al. 2013; Bertin et al. 2013) and sputtering (Johnson et al. 2013; Cassidy et al. 2013) have been studied. Recently, Dulieu et al. (2013) showed that species forming onto dust particles could be directly ejected into the gas phase upon formation. This mechanism, called chemical desorption, links solid and gas phases without the intervention of external agents such as photons, electrons, or other energetic particles. This process could therefore be efficient in environments where UV and cosmic rays (CR) are shielded, and where photodesorption or sputtering cannot account for the release of solid species into the gas phase.
Observations of Oph A reported the presence of species such as O2, HO2, and H2O2 (Bergman et al. 2011; Parise et al. 2012; Liseau et al. 2012) that could be attributed to the effect of warm dust allowing the evaporation of their ices. In particular, the detection of H2O2 in Oph A, a molecule that is known to be present in ices but has never been observed before, raised the question of its origin. Du et al. (2012) modeled the abundances of gas and ice species in environments with similar physical characteristics as Oph A. These authors could reproduce the abundance of H2O2 by assuming a chemical desorption efficiency of 7, derived from the approach of Garrod et al. (2007).
In Minissale et al. (2015) (hereafter Part I of this study), we performed several experiments to measure and quantify the chemical desorption efficiency. We found that this process is mainly sensitive to four parameters: enthalpy of formation, degrees of freedom, binding energy, and mass of newly formed molecules. We quantified the chemical desorption process as a function of these parameters, and we here determine its effect on the chemical composition of an evolving cloud. We re-evaluate the abundances of gas-phase O2, HO2, and H2O2 with the chemical desorption efficiencies derived in this study and consider the change in these efficiencies when the dust surfaces are covered by ice.
This paper is organized as follows: in Sect. 2 we present the law that has been determined to quantify the chemical desorption process, as shown in part I. In Sect. 3 we describe the chemical model that is used to simulate the chemical composition of a cloud when chemical desorption is considered. In Sect. 4 we discuss the necessary careful treatment of the solid phase, which takes into account the chemical desorption process to reproduce the observations of specific chemical species in Oph A. In Sect. 5 we present the main conclusions of this study.
| Reaction | Desorbing | Delta HR (eV) | Experimental | Theoretical | Reaction barrier (K) | |
|---|---|---|---|---|---|---|
| CDice(exp)∗ | CDbare(exp)∗ | CDbare(th) | ||||
| O+H | OH | 4.44 | 2515 | 5025 | 39 | 0 |
| OH+H | H2O | 5.17 | 3015 | 5025 | 27 | 0 |
| O2+H | O2H | 2.24 | 8 | 1010 | 1.4 | 0a,b |
| O2H+H | H2O2 | 3.69 | 8 | 5 | 0.5 | 0 |
| O2H+H | 2 OH | 1.47 | 8 | 5 | 0.3 | 0 |
| H2O2+H | H2O+OH | 2.95 | 5 | 5 | 2.1 | 1000e |
| O3+H | O2+OH | 3.33 | 10 | 8 | 8 | 480c,d |
| O+O | O2 | 5.16 | 5 | 40-80 | 68 | 0 |
| O2+O | O3 | 1.1 | 5 | 5 | 0 | 0 |
| N+N | N2 | 9.79 | 50 | 70 | 89 | 0 |
| CO+H | HCO | 0.66 | – | 108 | 0.7 | 2000f |
| HCO+H | CO+H2 | 3.85 | – | 4020 | 47 | 130 |
| HCO+H | H2CO | 3.91 | – | 8 | 7 | 0 |
| H2CO+H | CH3O | 0.88 | – | 8 | 0 | 2000f |
| H2CO+H | HCO+H2 | 0.61 | – | 105 | 0 | 2200 |
| CH3O+H | CH3OH | 4.56 | 8 | 8 | 2.3 | 0 |
| CO+O | CO2 | 5.51 | 5 | 5 | 22 | 650i |
| H2CO+O | CO2+H2 | 5.45 | 10 | 10 | 8 | 350i |
| CH3O+H | H2CO + H2 | 3.64 | – | – | 1.3 | 150 |
| CH3OH + H | CH3O+H2 | -0.04 | – | – | 0 | 3200 |
| OH+O | O2 + H | 0.72 | – | – | 1.9 | 0 |
| HO2+O | O2+OH | 2.2 | – | – | 17 | 0 |
| O3+O | O2+O2 | 4.06 | – | – | 39 | 2500g |
| O+H2v=1 | OH+H | -0.08 | – | – | 0 | 4600h |
| CO2+H | CO+OH | -1.0 | – | – | 0 | 10000 |
| O+HCO | CO2+H | 4.85 | – | – | 10 | 0i |
| O+H2CO | CO2+H2 | 5.45 | – | – | 8 | 350j |
| OH+H2 | H2O+H | 0.65 | – | – | 0 | 2100k |
| OH+OH | H2O2 | 2.21 | – | – | 0 | 0 |
| OH+CO | CO2+H | 1.07 | – | – | 0 | 400l |
| OH+HCO | CO2+H2 | 4.93 | – | – | 6 | 0 |
| HO2+H2 | H2O2+H | -0.82 | – | – | 0 | 5000e |
| H2O+H | OH+H2 | -0.65 | – | – | 0 | 9600 |
| H2O2+H | H2O+OH | 2.95 | – | – | 2 | 1000 |
Note that the table is longer than in part I. Here we report the theoretical CD efficiency for more reactions than have been measured experimentally.a Mokrane et al. 2009, b Chaabouni et al. 2012, c Mokrane et al. 2009, d Romanzin et al. (2011), e Lamberts et al. 2013, f Awad et al. 2005, g Minissale et al. (2014),h Weck & Balakrishnan 2005, i Minissale et al. (2013) from ER, j Minissale et al. (2015), k Oba et al. 2012, l Noble et al. 2011 ∗ work reported in part I.
2 Chemical desorption process
In part I of this study, experiments have been performed using the FORMOLISM setup (Amiaud et al. 2006; Congiu et al. 2009) to quantify the chemical desorption process. A typical experiment proceeds as follows: one layer (or less) of molecules is deposited at low temperatures ( 10 K) on amorphous silicates, oxidized graphite, or compact amorphous water substrate. Immediately after deposition, another beam is aimed at the solid sample and the desorption flux is monitored. These measurements, referred to as during-exposure desorption (DED), allow determining the efficiency of the chemical desorption process for many of the considered reactions. In a second phase, called temperature-programmed desorption experiments (TPD), the surface temperature is increased and the desorption flux is monitored, which allows determining the amount of formed products that did not desorb upon formation. By combining TPD and DED experiments for selected reactions on several surfaces, we were able to obtain a precise measurement of the chemical desorption efficiency for each reaction. The different reactions are reported in part I of this study. In Table 1 we summarize the different reactions that have been studied with their enthalpy of formation and the experimental chemical desorption efficiency that has been derived on bare (amorphous silicates, oxidized graphite) and icy surfaces.
In part I, we used a simple assumption of equipartition of energy to reproduce the chemical desorption observed experimentally, assuming that the total energy budget (see Table 1) is shared between all the degrees of freedom . To desorb from the surface, the newly formed products bound with binding energies have to gain velocity in the direction perpendicular to the surface. By considering an elastic collision, the fraction of kinetic energy retained by the product colliding with the surface, which has an effective mass can be determined as
| (1) |
where we considered an effective mass of 120 a.m.u. Therefore the total chemical energy available for the kinetic energy perpendicular to the surface is . We assumed that the only velocity perpendicular to the surface corresponds to a distribution of speed or temperature such as kT = . The probability of the product to have an energy (or liberation velocity) higher than the binding energy becomes
| (2) |
For a water substrate (np-ASW), the experimental results show that the chemical desorption becomes much less efficient and that most of the reactions cannot be determined. Only the reactions O+H, OH+H, and N+N show efficiencies of 25, 30, and 50, respectively.
3 Chemical model
We used a three-phase chemical model that combines gas-phase chemistry with surface and bulk chemistry. The grain surface chemistry model (surface + bulk) takes into account the different binding energies of the species on bare or icy surfaces and includes evaporation, photodissociation, and photodesorption processes, which transform surface species either into other surface species or into gas-phase species. Our model does not take into account the diffusion from species from bulk to surface and from surface to bulk, however. In this sense, when the coverage has reached one layer, the accreting species become bulk species with higher energies and lower diffusion rates (because the diffusion depends on the binding energy). The gas-phase chemical model was adopted from the KIDA database (Wakelam et al. 2012).
3.1 Grain surface chemistry
Our grain surface chemistry model considers the following species: H, H2, O, O2, O3, OH, HO2, H2O, H2O2, CO, CO2, HCO, H2CO, CH3O, and CH3OH, adapted from Hocuk & Cazaux (2015). Their binding energies on bare and icy surfaces are listed in Table 2. In the submonolayer regime (coverage 0) the surface is considered bare, and the binding energies correspond to Ebare. As the surface becomes covered with ices, we estimate the fraction of the species bound to the bare surface, with Ebare, and the fraction bound to the ice with Eice. In the multilayer regime (coverage 100), the surface is considered to be covered by ices, and the binding energies correspond to Eice. Our chemical network combines surface and gas-phase species. Gas-phase species are calculated in units of cm-3, while surface or bulk species are usually calculated in monolayers (1 ML = 100 surface coverage). To convert cm-3 into monolayers, division by ndustnsites is needed, which is the number of sites on the dust surface per cm-3. This can be written as
| (3) |
where ass is the distance between two sites, typically 3 Å, and n is the total cross section of dust, which is 10-21 nH cm-2 following Mathis et al. (1977) (hereafter MRN), and therefore ndust n 4.4 10-6 nH. We here report surface species and reactions rates in cm-3 to allow a direct comparison with the gas phase. The density of the surface species shown in our calculations can therefore be converted into monolayers by dividing by ndust nsites.
| Species | Ebare | Eice |
|---|---|---|
| H | 550a,b | 650c |
| H2 | 300a,d | 500e |
| O | 1500b | 1400f |
| OH | 4600g | 4600g |
| H2O | 4800g | 4800h |
| O2 | 1250i | 1200i |
| O3 | 2100j | 2100j |
| HO2 | 4000g | 4000g |
| H2O2 | 6000g | 6000g |
| CO | 1100i | 1300i,k |
| CO2 | 2300i | 2300i,k |
| HCO | 1600l | 1600l |
| H2CO | 3700m | 3200m |
| CH3O | 3700l | 3700l |
| CH3OH | 3700n | 3700n |
| N | 720 | 720f |
| N2 | 790o | 1140p |
aCazaux & Tielens (2004), bBergeron et al. (2008), cAl-Halabi & van Dishoeck (2007), Amiaud et al. (2007),dPirronello et al. (1997), eAmiaud et al. (2006) for low coverage f Minissale et al. (2015), gDulieu et al. (2013), hSpeedy et al. (1996), Fraser et al. (2001) energy derived of 5800 K with pre-factor of 1015 s-1 here corrected to have pre-factor of 1012 s-1, iNoble et al. (2012a), jBorget et al. (2001), Minissale (2014), kKarssemeijer & Cuppen (2014),lGarrod & Herbst (2006), mNoble et al. (2012b), nCollings et al. (2004), oFuchs et al. (2006), p extrapolated from Kimmel et al. (2001)
In the following subsections, we describe the different processes occurring on dust surfaces or in the bulk.
3.1.1 Accretion
Species from the gas phase can collide with dust grains. The rate for this process (cm-3 s-1), which depends on the density of the species, their velocity, and the cross section of the dust, can be written as
| (4) |
where nX is the density of the species X (cm-3) and vX is the thermal velocity of the species X, which can be written as v cm s-1. is the sticking coefficient of the species with the dust. Here we consider , meaning that every species that arrives on dust sticks.
3.1.2 Evaporation
The species present on the dust surface can return to the gas phase because they evaporate. This evaporation rate depends on the binding energy of the species with the surface. However, the binding energies are very different if the species is bound to a bare or icy surface, as shown in Table 2. In our model, we define the fraction of the dust that remains bare as fbare and the fraction of the dust that is covered by ices as fice=1-fbare to apply the changes in binding energies as the dust becomes covered by ices. The evaporation rate (cm-3 s-1) of the species X can be written
| (5) |
where is the oscillation factor of the atom on the surface, which is typically =1012 s-1, and Ebare(X) and Eice(X) the binding energies of the species X on bare and icy dust, respectively. When one monolayer is reached (4.4 nH cm-3), fice becomes 1 and the binding energies and mobilities depend only on Eice.
3.1.3 Mobility
Surface species can move on grain surfaces through thermal hopping. The diffusion rate (in s-1) for a species X to move on bare surface or in the bulk can be written as
| (6) |
| (7) |
We consider that the barrier for thermal hopping is two thirds of the binding energy. Moreover, as the dust surface evolves from bare to icy, we change the species mobility according to the physical-chemical conditions of surface (from bare to icy). In our model, we only consider mobility through thermal hopping. This is a good approximation for the mobility of H atoms at Tdust12K. Below this temperature, or if reactions involving chemisorption are considered, diffusion through tunneling should be taken into account (Cazaux & Tielens 2004). We also do not consider the tunneling of O atoms in the bulk, which can be efficient until 25 K (Minissale et al. 2013).
3.1.4 Surface reactions
Species on bare surfaces or in the bulk can meet and react to form products that will either stay on the surface or in the bulk, or be released into the gas phase. The different reactions and their associated barriers are reported as Ea in Table 1. When the barrier for a reaction was not studied on the surface, we assumed that the reactions are similar to gas-phase reactions. The probability of chemical desorption is taken from Eq. 2 for bare grains (with values shown in Table 1). For icy surfaces, we considered the chemical desorption mechanism to be (1) reduced by one order of magnitude (with the exception of O+H, OH+H and N+N for which measurements were obtained) and (2) equal to zero.
The reactions occurring on dust surfaces are reported in Table 1. The products can be either released into the gas phase with a probability for reactions on bare surfaces, or for reactions on icy surfaces. The reaction rate (in cm-3 s-1) for the formation of the species X through encountering of species Y and Z can be written as
| (8) | |||||
If there is a barrier for the reaction to occur with an energy Ea (in K), this barrier can be crossed by tunneling with a probability Ptun= or through thermal hopping with a probability Ptherm=. In these expressions, a is the width of the barrier of 1 Å and mred is the reduced mass of the reaction mred=. Ptun can be simply written as Ptun=, with mred in atomic numbers and Ea in kelvin. The probability of reaction, Preac, depends on the rate for the species to react compared to the rate for the species to escape the site where they meet. This probability can be written as Preac=, where is the mobility of the species X and Y. The rate Rgas directly gives the formation rate of the gas-phase species X in cm-3s-1 and can therefore be directly coupled with gas-phase reactions.
A reaction occurring on the dust surface can lead to products that remain on the surface. The probability of products remaining on the surface/bulk is noted as (1-). The reaction rate (in cm) for the formation of species X through encountering of species Y and Z can be written as
| (9) | |||||
One of the reactions O+ H2 OH + H is energetically not accessible at low temperatures since the reaction has a barrier of 0.57 eV and is endoergic with an energy of 0.1 eV for H2(v = 0) (Weck et al. 2006). However, this reaction becomes exoergic for 0 and the barrier decreases to 0.4 eV for = 1 (Sultanov & Balakrishnan 2005). The reaction O(3P) + H2 (=1) proceeds through tunneling at low temperatures, as shown by Weck et al. (2006). In our model, we considered only the reaction of H2 vibrationally excited with O(3P). For a population in equilibrium at a temperature Tdust, the fraction of molecules in the J = 1 state is – in the range of Tdust considered in this study (12 – 30 K).
3.1.5 UV photons and cosmic-ray-induced UV photons
Interstellar dust grains can be present in environments that are subject to radiation. Stars in the neighborhood can emit far-UV photons that impinge on the interstellar dust grains. When a UV photon arrives on an adsorbed species, it can be photodissociated. The products of the dissociation can be released directly into the gas phase, or one or both fragments can be trapped on the surface. Andersson & van Dishoeck (2008) calculated the outcomes of the photodissociation of water molecules in water ices. Once a water molecule is broken into OH and H in the first few monolayers of ice, several processes can occur with different probabilities if the ices are crystalline or amorphous (Andersson et al. 2006). In most cases, H atoms are released into the gas phase and OH molecules are trapped (amorphous: 92 , crystalline: 70 ) or H and OH are trapped (amorphous: 5 , crystalline: 14 ). The most probable process is the trapping of OH. One of the possible processes is the reformation of water and its subsequent release into the gas phase. This process is called photodesorption (amorphous: 0.7 , crystalline: 1 ). In our model, we considered that species being photodissociated by UV photons/cosmic ray-induced photons are trapped on the surface. Since we take into account the fact that species such as water can reform and be ejected into the gas through chemical desorption, the photodesorption of molecules is already considered in our model for water. For CO molecules, we considered CO photodesorption with a yield of 10-2, which was obtained experimentally (Fayolle et al. 2011). Furthermore, we considered that only the two first layers of ice can interact with photons or cosmic-ray-induced photons.
We considered that only the photons arriving directly on the species can photodissociate them, meaning that the cross section of reaction is similar to the one in the gas phase. We therefore used the values from the KIDA database to compute the dissociation rates of solid-phase species through photons and cosmic rays. We considered that dissociated solid species remain on the dust.
3.2 Gas-phase reactions
The numerical code Nahoon is publicly available on KIDA to compute the gas-phase chemistry for astrophysical objects (http://kida.obs.u-bordeaux1.fr/models/). A more detailed description of this model and the chemical network can be found in Wakelam et al. (2012). The grain surface chemistry presented in Sect. 2 was added to the existing gas-phase network, and we computed abundances of species in the gas phase and on grain surfaces as a function of time. The abundances derived in our simulations refer to fractional abundances with respect to the density of hydrogen nH. We take into account pure gas-phase chemistry (bimolecular reactions, dissociative and radiative recombinations and associations, electron attachments, dissociations and ionizations induced by cosmic rays and UV photons), interaction between the species in the gas phase and the grain surfaces (adsorption, thermal desorption, desorption by cosmic rays, and chemical desorption), and grain surface reactions (chemical reactions and dissociation by UV photons and cosmic-ray-induced UV photons).
3.3 Simulations
In this section we perform several calculations to study the formation and abundances of O2, HO2 and H2O2 in astrophysical environments. Our study is motivated by the recent detections of O2, HO2 and H2O2 in Oph A (Bergman et al. 2011; Parise et al. 2012; Liseau et al. 2012) and of O2 in Orion (Goldsmith et al. 2011). The detections of O2 in these two distinct environments have been attributed to the effect of warm dust grains that allow the evaporation of the ices covering the dust. Additionally, the recent detection of H2O2 in Oph A, a molecule present in ices but never observed before, raised the question of its origin. Du et al. (2012) modeled the abundances of gas and icy species in environments with similar physical characteristics as Oph A. These authors reproduced the abundance of H2O2 by assuming a chemical desorption efficiency of 7, derived from the approach of Garrod et al. (2007). Here we re-evaluate the abundances of O2, HO2 and H2O2 with the chemical desorption efficiencies derived in this study, and the change in these efficiencies when the dust surfaces are covered by ice. We performed three different simulations that are presented in the following subsections. Since the chemical desorption is very poorly defined on water ices (apart for the formation of OH, H2O, and N2), we performed an additional calculation without considering the chemical desorption on icy grains. Furthermore, to assess the impact of the chemical desorption on the chemical composition of the cloud, we performed a third calculation without the chemical desorption process. These simulations, called cloud 1, 2, and 3, are summarized in Table 3.
| Simulation | Chemical desorption | Chemical desorption |
|---|---|---|
| bare dust | icy dust | |
| Cloud 1 | CDbare=CDbare(th) (eq. 2) | CDice=CDbare(th)/10 |
| CDice(OH)=0.25 | ||
| CDice(H2O)=0.3 | ||
| CDice(N2)=0.5 | ||
| Cloud 2 | CDbare=CDbare(th) (eq. 2) | CDice=0 |
| Cloud 3 | CDbare=0 | CDice=0 |
3.3.1 Initial conditions
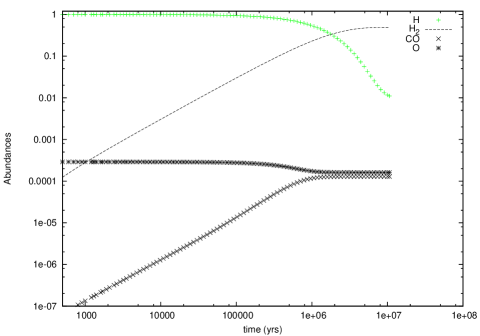
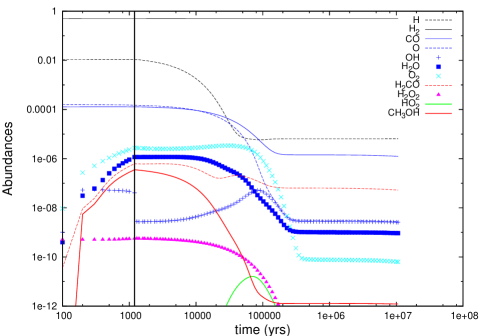
The initial conditions for our cloud model are provided by simulating a cloud at an extinction of 3, for a density of nH=103 cm-3, G0=103, Tgas=100 K, and Tdust=30 K. The model was run until 107 years, and the gas-phase abundances of the different species with time are reported in Fig. 1. The chemical composition of the cloud reaches steady state at 106 years, and the abundances of atomic oxygen and CO are identical, in agreement with the abundances derived by Hollenbach et al. 2009.
3.3.2 Cloud 1: with chemical desorption
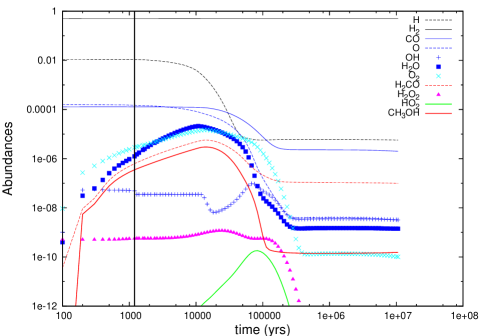
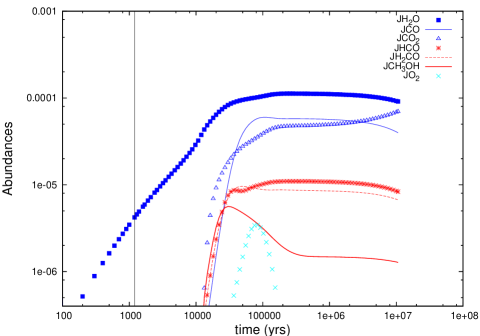
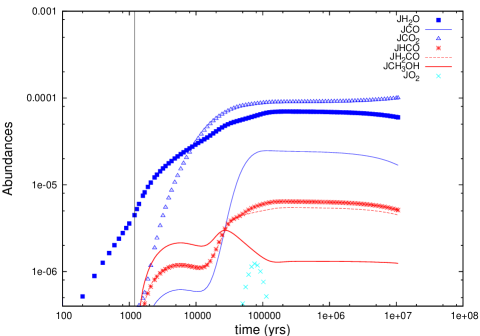
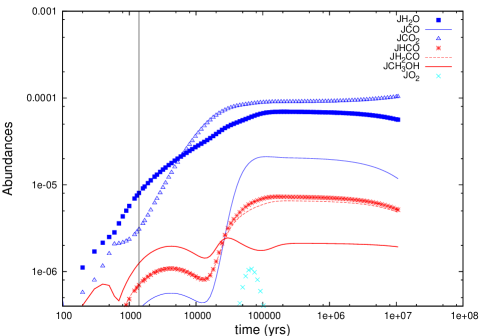
To follow the evolution of a molecular cloud, we used the abundances obtained with our calculations at Av=3 (for long timescale) as initial conditions. To mimic the physical conditions met in Oph A, we assumed a density of 105 cm-3, a radiation field of G0=103, an extinction of AV=15, and a gas and dust temperature of Tgas=Tdust=20 K, as assumed by Du et al. (2012) taken from the observations from Bergman et al. (2011). We considered a chemical desorption efficiency as reported in Eq. 2 (and shown in Table 1) for bare dust, and ten times lower for icy dust apart for the formation of OH, H2O, and N2, which were derived experimentally, and were chosen as 0.25, 0,3 and 0.5, respectively (see Table 3 for a summary). The abundances in the gas phase and in the ices derived with our model are reported in Fig. 2. To distinguish species in the gas phase and in solid phase (on dust or in the ices), we add the letter J in front of the name of the species when they are in solid phase (bottom panel of Fig. 2 where water is mentioned as JH2O). The top panel of Fig. 2 shows the most abundant species in the gas phase as a function of time. The vertical line shows the time at which dust grains are covered by one layer of ice and therefore indicates the transition between submonolayer and multilayer regime (transition between bare and icy surfaces). The abundance of O2 increases with time until a maximum of 10-5 is reached around 5104 years. OH in the gas phase is rapidly transformed into other species such as water, and therefore remains around 10-7 until 105 years. Water increases up to few times 10-5 in the early stages of the cloud evolution, until atomic hydrogen begins to be lacking in the cloud. Species such as H2O2 reach an abundance of 10-9 until 105 years. HO2, on the other hand, reaches a maximum of 10-10 around 105 years. Methanol and H2CO both increase with time until abundances of 610-6 and 2 10-6 are reached at a few 2104 years. The coverage of species on dust is reported in the bottom panel of Fig. 2. Water is accreted slowly with time and reaches one monolayer after 1200 years. This change from bare to icy dust, shown as a vertical line, implies that species from the gas phase accreting onto dust are more closely bound to the surface (change in binding energies, as shown in Table 2). The chemical desorption efficiency is also strongly reduced, which implies that most of the species reacting on the surface (except OH, H2O and N2) desorb less upon formation. After water, solid CO2 and CO become the most abundant species in the ice. This is due to the high temperature of the dust of 20 K. In this case, hydrogenation is less important than oxygenation since H atoms evaporate efficiently from the dust in comparison with oxygen atoms. The abundance of methanol in the ices is of about 1. This is due to the warm temperature at which oxygenation is favored compared to hydrogenation.
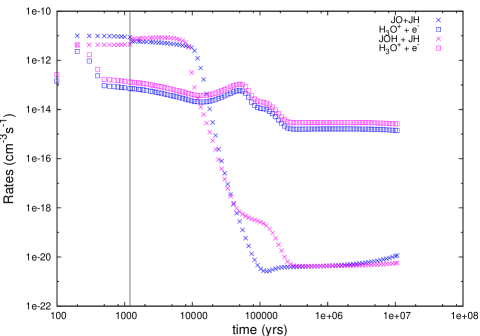
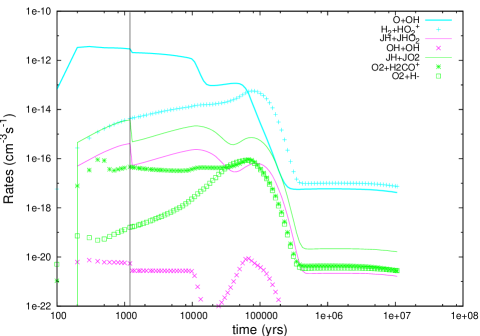
The rates for the formation of OH (blue) and H2O (pink) are reported in Fig. 3, top panel. During the time that dust grains remain uncovered by ices (at 1200 years) and atomic H atoms are still abundant in the gas phase, formation of OH and H2O in the gas phase is dominated by reaction on surfaces and subsequent release in the gas through the chemical desorption process. The reaction of adsorbed hydrogen with adsorbed oxygen and adsorbed OH enhances the gas-phase OH and H2O. This gas enrichment through solid-state reactions dominates until 104 years. After this time, the formation of OH and water is dominated by recombination of H3O+ , which can either form OH + H2 or H2O + H.
The rates for the formation of O2, H2O2 and HO2 are reported in the bottom panel of Fig. 3. The formation of O2 (turquoise) occurs mostly through gas-phase processes that involve OH. In this sense, O2 is a direct by-product of the enhanced formation of OH through the chemical desorption process on dust. The formation H2O2 (pink), on the other hand, is dominated by dust reactions of adsorbed hydrogen with adsorbed HO2 leading to the formation and desorption of H2O2. This process is very efficient on bare dust, until 1200 years, and decreases by one order of magnitude once the dust becomes covered by ices. Even with a much lower efficiency, the chemical desorption process dominates the gas-phase ion-neutral reactions. Therefore, the H2O2 molecules present in the gas phase are due to the chemical desorption process, which dominates in the early time of the cloud evolution, when dust grains are still bare. The formation of HO2 (green) is dominated by the hydrogenation of O2 on dust and its subsequent release into the gas through chemical desorption. After dust becomes covered by ice, the chemical desorption process becomes much less efficient, but still strongly dominates the ions-neutral reactions. This reduced efficiency still allows an increase in gas-phase HO2 until abundances of 10-10 are reached.
3.3.3 Cloud 2: without chemical desorption on icy dust
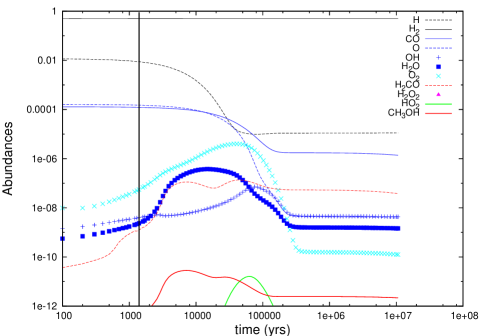
In our second simulation, we considered the chemical desorption on icy dust to be negligible (we set CDice=0, see Table 3). These simulations allow determining the lower limits of the impact of the chemical desorption process because chemical desorption on icy dust is not well defined. The abundances of the species in the gas phase are reported in the top panel of Fig. 4. While the abundances of oxygen, hydrogen, and CO are similar to our previous calculations, many species are formed in the early stages of cloud evolution (in the submonolayer regime, before 1200 years, as presented by the black vertical line), and only decline at later stages. This is the case for H2O2, H2CO, and methanol, which are formed through dust grain reactions and are released into the gas phase through chemical desorption as dust grains are still bare. Once dust becomes covered by ice mantles (time 1200 years), many species are not produced efficiently, such as OH, which declines abruptly and in turn diminishes the abundance of O2. HO2, which was mostly formed though chemical desorption from icy grains in model cloud 1, has an abundance that decreases by almost one order of magnitude. The coverage of species on dust is reported in the bottom panel of Fig. 4. Water is the main component of the ices until 104 years, after which CO2 becomes more abundant. The abundances of solid CO, O2, H2CO, and methanol decrease compared to the abundances reported for model cloud 1. The chemical desorption process not only affects the composition of the gas phase, but also the composition of the solid state. The chemical desorption for the formation of OH and water on icy dust allows an enrichment of the gas phase in these species. Therefore, water can accrete onto the dust, which increases the abundance of water in solid form. By neglecting the chemical desorption on icy dust, the ices are lacking in water ices, and CO2 becomes a dominant species.
3.3.4 Cloud 3: without chemical desorption
To assess the impact of the chemical desorption process on the chemical composition of our cloud model, we performed an additional simulation without chemical desorption. The abundances of the species in the gas phase are reported in the top panel of Fig. 5. While the abundances of oxygen, hydrogen, and CO are similar to the one derived in our previous calculations, the abundance of methanol is decreased by four orders of magnitude, while H2O2 is absent from the figure since its abundance is 10-14. Water and OH abundances are also decreased in the early stages of the cloud evolution, since their formation is not ensured by the chemical desorption process, but by less efficient gas-phase routes as shown in Fig. 3. Since O2 formation involves OH molecules, the lower OH abundance diminishes the abundance of O2, as in the case of model cloud 2. The coverage of species on dust is reported in the bottom panel of Fig. 5. Water molecules that form on the dust do stay on the dust. The building-up of the ices is somewhat faster (1000 years), while the abundances of water in the gas is lower than in our previous simulations. Water ice dominates the solid state in the early stages of the cloud evolution, whereas CO2 becomes the main constituent of the solid phase in the latter stage after 104 years. The other solid species behave in a similar manner as in the case of model cloud 2. To summarize, our simulations show that the chemical desorption process is needed to account for the presence of some species into the gas phase, such as H2O2 and methanol. The chemical desorption process also has an important impact on the chemical composition of interstellar ices.
4 Discussion
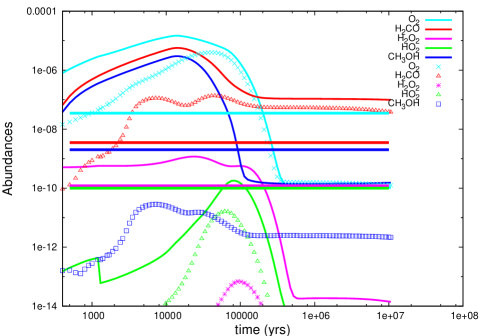
We showed that for the reactions considered in this study, the chemical desorption process is well constrained on bare dust, but is difficult to quantify on icy surfaces since its efficiency is strongly reduced. To account for the uncertainties coming from the ill-defined process on icy surfaces, we performed simulations considering the chemical desorption efficiency on icy dust to be either very low (tenth of its value on bare dust) or zero, or the efficiency to be zero on bare and icy dust. In Fig. 6 we report the abundances of the molecules that have been observed in Oph A. We show the abundances with (lines) and without (dots) chemical desorption. Our simulations show that the presence of species such as H2O2 and methanol can be enhanced by four orders of magnitude due to the chemical desorption process, while this enhancement is one order of magnitude for species such as HO2 and H2CO. This enhancement is very important in the earliest stages of cloud evolution (until 104 years), when dust grains are still bare and the chemical desorption efficiency is very efficient. The species formed at this epoch can remain in the gas phase for very long timescales (until 105 years), until all the species freeze onto the dust grains. The presence of HO2, H2O2 and methanol indicate an enhancement through solid-phase chemistry and the imminent freeze-out of the cloud.
Observations of H2O2 and HO2 in Oph A show that the abundances of these species are 10-10 each (Bergman et al. (2011); Parise et al. (2012)). Methanol has also been observed with an abundance of 10-9 Liseau et al. (2003); Bergman et al. (2011). The observed abundances of these molecules are reported as solid horizontal lines in Fig. 6. The abundances of O2, H2O2, HO2 , and CH3OH are well reproduced by our model cloud 1 (lines) between 105 and 3 105 years, while our cloud model 3 (without chemical desorption) underestimates the abundances by one to three orders of magnitude for HO2 and H2O2 , respectively. To reproduce the abundances observed in Oph A, the chemical desorption mechanism is therefore required, as was shown by Du et al. 2012. We here reconsidered the chemical desorption mechanism by using the efficiencies that we derived experimentally. We also considered the changes in binding energies as the dust becomes covered by icy mantles. In an environment with physical characteristics similar to Oph A, dust grains are warm enough ( 20 K) to allow the formation of oxygenated species on dust surfaces, which leads to the formation of HO2 and H2O2. We showed that the presence of H2O2 is due to the first phases of the evolution of a cloud, when dust grains are bare and chemical desorption is very efficient. For methanol, chemical desorption on bare dust and icy dust is required to account for the abundances that are observed in Oph A of 10-9. We also showed that the abundances of HO2 observed in the gas indicate an enrichment through chemical desorption throughout the evolution of the cloud. Our simulations showed that HO2, H2O2 , and methanol can all be present in interstellar gas around 105 years in conditions similar to Oph A, as shown in Fig. 6.
5 Summary and conclusions
In part I of this study, a collection of experiments has been reported to quantify the fraction of species forming on dust that is ejected into the gas phase upon formation, the so-called chemical desorption process. An analytical expression that we reported here was derived to quantify the efficiency of this process on different substrates such as oxidized graphite and amorphous silicates. This formula depends on the equipartition of the energy of newly formed products and the binding energy of the products, and it reproduces the experimental results on bare surfaces well. However, on icy surfaces the chemical desorption process is strongly reduced and cannot be quantified by our experimental results.
To address the importance of the chemical desorption process on the composition of interstellar gas, we used a three-phase chemical model, which combines gas-phase chemistry and surface and bulk chemistry, and we used our analytical formula to account for the chemical desorption process. We computed the chemical composition of a cloud with similar physical characteristics as Oph A to reproduce species such as HO2 and H2O2 , which have been observed in this environment ((Bergman et al. 2011; Parise et al. 2012). We show that the presence of HO2 and H2O2 in interstellar gas indicates that species are starting to freeze out. H2O2 is produced through the chemical desorption mechanism in the earliest stages of the cloud evolution, when dust grains are still bare, while HO2 is abundant only for a very short period of time, preceding the freeze-out. The presence of these species, enhanced by the chemical desorption process, is an indicator of the imminent freeze-out of the cloud.
Acknowledgements.
S. C. is supported by the Netherlands Organization for Scientific Research (NWO; VIDI project 639.042.017) and by the European Research Concil (ERC; project PALs 320620). We acknowledge the support of the French National PCMI program funded by the CNRS and the support of the DIM ACAV, a funding program of the Région Ile de France. We would like to thank the anonymous referee for the comments and suggestions that considerably improved our manuscripts (part I and part II).References
- Al-Halabi & van Dishoeck (2007) Al-Halabi, A. & van Dishoeck, E. F. 2007, MNRAS, 382, 1648
- Amiaud et al. (2006) Amiaud, L., Dulieu, F., Baouche, S., et al. 2006, in American Institute of Physics Conference Series, Vol. 855, Astrochemistry - From Laboratory Studies to Astronomical Observations, ed. R. I. Kaiser, P. Bernath, Y. Osamura, S. Petrie, & A. M. Mebel, 55–61
- Amiaud et al. (2007) Amiaud, L., Dulieu, F., Fillion, J.-H., Momeni, A., & Lemaire, J. L. 2007, J. Chem. Phys., 127, 144709
- Andersson et al. (2006) Andersson, S., Al-Halabi, A., Kroes, G.-J., & van Dishoeck, E. F. 2006, J. Chem. Phys., 124, 064715
- Andersson & van Dishoeck (2008) Andersson, S. & van Dishoeck, E. F. 2008, A&A, 491, 907
- Awad et al. (2005) Awad, Z., Chigai, T., Kimura, Y., Shalabiea, O. M., & Yamamoto, T. 2005, ApJ, 626, 262
- Bacmann et al. (2012) Bacmann, A., Taquet, V., Faure, A., Kahane, C., & Ceccarelli, C. 2012, A&A, 541, L12
- Bergeron et al. (2008) Bergeron, H., Rougeau, N., Sidis, V., et al. 2008, Journal Phys. Chem. A, 112, 11921
- Bergman et al. (2011) Bergman, P., Parise, B., Liseau, R., & Larsson, B. 2011, A&A, 527, A39
- Bertin et al. (2013) Bertin, M., Fayolle, E. C., Romanzin, C., et al. 2013, ApJ, 779, 120
- Bisschop et al. (2006) Bisschop, S. E., Fraser, H. J., Öberg, K. I., van Dishoeck, E. F., & Schlemmer, S. 2006, A&A, 449, 1297
- Borget et al. (2001) Borget, F., Chiavassa, T., Allouche, A., & Aycard, J. P. 2001, The Journal of Physical Chemistry B, 105, 449
- Cassidy et al. (2013) Cassidy, T. A., Paranicas, C. P., Shirley, J. H., et al. 2013, Planet. Space Sci., 77, 64
- Cazaux & Tielens (2004) Cazaux, S. & Tielens, A. G. G. M. 2004, ApJ, 604, 222
- Chaabouni et al. (2012) Chaabouni, H., Minissale, M., Manicò, G., et al. 2012, J. Chem. Phys., 137, 234706
- Collings et al. (2004) Collings, M. P., Anderson, M. A., Chen, R., et al. 2004, MNRAS, 354, 1133
- Congiu et al. (2009) Congiu, E., Matar, E., Kristensen, L. E., Dulieu, F., & Lemaire, J. L. 2009, MNRAS, 397, L96
- DeSimone et al. (2013) DeSimone, A. J., Crowell, V. D., Sherrill, C. D., & Orlando, T. M. 2013, J. Chem. Phys., 139, 164702
- Du et al. (2012) Du, F., Parise, B., & Bergman, P. 2012, A&A, 538, A91
- Dulieu et al. (2013) Dulieu, F., Congiu, E., Noble, J., et al. 2013, Scientific Reports, 3
- Fayolle et al. (2011) Fayolle, E. C., Bertin, M., Romanzin, C., et al. 2011, ApJ, 739, L36
- Fraser et al. (2001) Fraser, H. J., Collings, M. P., McCoustra, M. R. S., & Williams, D. A. 2001, MNRAS, 327, 1165
- Fuchs et al. (2006) Fuchs, G. W., Acharyya, K., Bisschop, S. E., et al. 2006, Faraday Discuss., 133, 331
- Garrod & Herbst (2006) Garrod, R. T. & Herbst, E. 2006, A&A, 457, 927
- Garrod et al. (2007) Garrod, R. T., Wakelam, V., & Herbst, E. 2007, A&A, 467, 1103
- Goldsmith et al. (2011) Goldsmith, P. F., Liseau, R., Bell, T. A., et al. 2011, ApJ, 737, 96
- Hocuk & Cazaux (2015) Hocuk, S. & Cazaux, S. 2015, A&A, 576, A49
- Hollenbach et al. (2009) Hollenbach, D., Kaufman, M. J., Bergin, E. A., & Melnick, G. J. 2009, ApJ, 690, 1497
- Johnson et al. (2013) Johnson, R. E., Carlson, R. W., Cassidy, T. A., & Fama, M. 2013, The Science of Solar System Ices, 551
- Karssemeijer & Cuppen (2014) Karssemeijer, L. J. & Cuppen, H. M. 2014, A&A, 569, A107
- Kimmel et al. (2001) Kimmel, G. A., Stevenson, K. P., Dohnálek, Z., Smith, R. S., & Kay, B. D. 2001, J. Chem. Phys., 114, 5284
- Lamberts et al. (2013) Lamberts, T., Cuppen, H. M., Ioppolo, S., & Linnartz, H. 2013, Physical Chemistry Chemical Physics (Incorporating Faraday Transactions), 15, 8287
- Liseau et al. (2012) Liseau, R., Goldsmith, P. F., Larsson, B., et al. 2012, A&A, 541, A73
- Liseau et al. (2003) Liseau, R., Larsson, B., Brandeker, A., et al. 2003, A&A, 402, L73
- Mathis et al. (1977) Mathis, J. S., Rumpl, W., & Nordsieck, K. H. 1977, ApJ, 217, 425
- Minissale (2014) Minissale, M. 2014, PhD thesis, University of Cergy-Pontoise
- Minissale et al. (2013) Minissale, M., Congiu, E., Baouche, S., et al. 2013, Physical Review Letters, 111, 053201
- Minissale et al. (2014) Minissale, M., Congiu, E., & Dulieu, F. 2014, J. Chem. Phys., 140, 074705
- Minissale et al. (2015) Minissale, M., Loison, J., Baouche, S., et al. 2015, Accepted in A&A
- Minissale et al. (2015) Minissale, M., Dulieu, F., Cazaux, S., & Hocuk, S. 2015, in press, DOI : 10.1051/0004-6361/201525981 (part I)
- Mokrane et al. (2009) Mokrane, H., Chaabouni, H., Accolla, M., et al. 2009, ApJ, 705, L195
- Noble et al. (2012a) Noble, J. A., Congiu, E., Dulieu, F., & Fraser, H. J. 2012a, MNRAS, 421, 768
- Noble et al. (2011) Noble, J. A., Dulieu, F., Congiu, E., & Fraser, H. J. 2011, ApJ, 735, 121
- Noble et al. (2012b) Noble, J. A., Theule, P., Mispelaer, F., et al. 2012b, A&A, 543, A5
- Oba et al. (2012) Oba, Y., Watanabe, N., Hama, T., et al. 2012, ApJ, 749, 67
- Parise et al. (2012) Parise, B., Bergman, P., & Du, F. 2012, A&A, 541, L11
- Pirronello et al. (1997) Pirronello, V., Liu, C., Shen, L., & Vidali, G. 1997, ApJ, 475, L69+
- Romanzin et al. (2011) Romanzin, C., Ioppolo, S., Cuppen, H. M., van Dishoeck, E. F., & Linnartz, H. 2011, J. Chem. Phys., 134, 084504
- Speedy et al. (1996) Speedy, R. J., Debenedetti, P. G., Smith, R. S., Huang, C., & Kay, B. D. 1996, J. Chem. Phys., 105, 240
- Sultanov & Balakrishnan (2005) Sultanov, R. A. & Balakrishnan, N. 2005, ApJ, 629, 305
- Wakelam et al. (2012) Wakelam, V., Herbst, E., Loison, J.-C., et al. 2012, ApJS, 199, 21
- Weck & Balakrishnan (2005) Weck, P. F. & Balakrishnan, N. 2005, The Journal of Chemical Physics, 123
- Weck et al. (2006) Weck, P. F., Balakrishnan, N., Brandão, J., Rosa, C., & Wang, W. 2006, J. Chem. Phys., 124