Galaxy And Mass Assembly (GAMA): growing up in a bad neighbourhood - how do low-mass galaxies become passive?
Abstract
Both theoretical predictions and observations of the very nearby Universe suggest that low-mass galaxies (log10[M∗/M⊙]) are likely to remain star-forming unless they are affected by their local environment. To test this premise, we compare and contrast the local environment of both passive and star-forming galaxies as a function of stellar mass, using the Galaxy and Mass Assembly survey. We find that passive fractions are higher in both interacting pair and group galaxies than the field at all stellar masses, and that this effect is most apparent in the lowest mass galaxies. We also find that essentially all passive log10[M∗/M⊙] galaxies are found in pair/group environments, suggesting that local interactions with a more massive neighbour cause them to cease forming new stars. We find that the effects of immediate environment (local galaxy-galaxy interactions) in forming passive systems increases with decreasing stellar mass, and highlight that this is potentially due to increasing interaction timescales giving sufficient time for the galaxy to become passive via starvation. We then present a simplistic model to test this premise, and show that given our speculative assumptions, it is consistent with our observed results.
keywords:
galaxies: interactions - galaxies: evolution1 Introduction
A ubiquitous feature of galaxy evolution is the transformation of galaxies from blue actively star-forming systems into red passive systems ( Tinsley, 1968). There has been significant debate about the factors affecting such transitions ( Baldry et al., 2006; Kimm et al., 2009; Peng et al., 2010; Wijesinghe et al., 2012), the likely timescales over which the transformation occurs ( Balogh et al., 2004; Martin et al., 2007; Wetzel et al., 2013; Wheeler et al., 2014; Fillingham et al., 2015) and the morphological changes associated with the quenching of star formation ( Martig et al., 2009; Phillips et al., 2014).
The general consensus is that a complex mixture of both galaxy mass (mass quenching - here we define as quenching processes internal to the galaxy) and local environmental effects (environmental quenching - which we define as externally driven quenching processes) are the two key factors in driving this transition. However, the relative contributions for both effects as a function of other galaxy properties, such as stellar mass, are far from clear. Multiple studies have suggested that at high stellar masses (log10[M∗/M⊙]10) galaxies are predominately quenched via non-environmental effects, which are proportional to their stellar mass and largely independent of local galaxy-galaxy interactions (passive fractions increase to higher stellar masses, Peng et al., 2010; Wetzel et al., 2013). This is likely due to the increasing central to satellite fraction with increasing stellar mass.
At intermediate stellar masses (log10[M∗/M⊙]10.0) passive fractions are lowest (Weisz et al., 2015) and quenching likely occurs via starvation (quenching timescales are comparable to gas depletion timescales; Fillingham et al., 2015; Peng, Maiolino, & Cochrane, 2015), and at the lowest stellar masses (primarily Local Group galaxies at log10[M∗/M⊙]8.0) quenching is likely to occur on much shorter timescales which are comparable to the dynamical timescale of the host halo, and are likely due to ram pressure stripping (Fillingham et al., 2015; Weisz et al., 2015).
These studies suggest that different quenching processes dominate the transition from star forming to passive systems at distinct stellar masses, and that there is a characteristic stellar mass scale between environmental quenching via ram pressure stripping of cold gas, environmental quenching via starvation, and mass quenching - with these transitions occurring around log10[M∗/M⊙]8 and log10[M∗/M⊙]10 respectively. Analysis of these processes is made more problematic by varying gas-to-stellar mass ratios, which are found to increase significantly to lower stellar masses ( Kannappan, Guie, & Baker, 2009) - typically galaxies at these masses are abundant in star-forming gas, prior to being acted on by external processes. Note that historically there has been significant debate regarding the significance of ram pressure stripping in quenching dwarf galaxies in cluster environments ( Davies & Phillips, 1989; Drinkwater et al., 2001; Grebel, Gallagher, & Harbeck, 2003) - with the most recent predictions suggesting it is a necessary processes to produce the observed distribution of dwarf-spheroidal/elliptical galaxies.
However, to date the majority of studies into the environmental effects of star formation are at the higher mass end of these characteristic masses (log10[M∗/M⊙]9.5). The bulk of this analysis comes from the Sloan Digital Sky Survey (SDSS, Ahn et al., 2014) and Galaxy And Mass Assembly survey (GAMA - see following section). In the former, the work of Peng et al. (2010) and others, has highlighted the large scale environmental effects on star-formation in galaxies, while the extensive work of the Galaxy Pairs in SDSS group (Ellison et al., 2008, 2010; Patton et al., 2011; Scudder et al., 2012) have probed deep into the effects of local galaxy-galaxy interactions on star-formation processes. In the latter, the GAMA survey has been used in numerous studies to investigate the local and large-scale environmental affects on star-formation ( Wijesinghe et al., 2012; Alpaslan et al., 2015; Taylor et al., 2015).
More recently, Davies et al. (2015) has shown that the effects of galaxy-galaxy interactions in modifying star formation in GAMA galaxies is a complex process, where both pair mass ratio and primary/secondary status within the pair (central/satellite) determine whether a galaxy has its star formation enhanced or suppressed in the interaction. The Davies et al. work only covers the 9.5log10[M∗/M⊙]11.0 range, but directly shows that secondary galaxies in minor mergers (the satellite systems identified in the work discussed above) are the most likely to have their star-formation suppressed by an interaction, and that this suppression is occurring on relatively short timescales ( Myr). As such, we may be directly witnessing starvation occurring in these galaxies as they transition from star-forming to quiescent systems. In contrast, Davies et al also find that enhancements to star formation are strongest in major mergers at around log10[M∗/M⊙], which is close to the lowest passive fraction of satellites (see summary in Figure 6 of Weisz et al., 2015). Hence, it is likely that galaxy interactions at these masses are enhancing star formation in satellite galaxies and reducing satellite passive fractions. These variations in star-formation processes are closely linked to interaction timescale, which is shortest around log10[M∗/M⊙] and increases to lower stellar masses ( Kitzbichler & White, 2008). If interacting galaxies take significant time to become passive ( via starvation, Fillingham et al., 2015) then we may only witness the passive phase in low-mass systems (galaxies around log10[M∗/M⊙] will merge too quickly to reach their passive phase). We explore this premise further in this paper.
In the lower stellar mass regime (log10[M∗/M⊙]9.5) sample sizes are small and/or low mass pairs are not split from the global population ( the Galaxy Pairs in SDSS work). The Peng et al. (2010) work does extend to log10[M∗/M⊙]9.0 and they find that passive galaxies at the low-mass end of their sample predominately reside in over-dense environments, and such galaxies are largely non-existent in the field. They go on to argue that the mass-quenching efficiency for such low-mass galaxies is extremely low, and environmental quenching must be the dominant factor in producing red low-mass systems Peng et al. (2012).
Some recent work has specifically targeted low mass galaxy-galaxy interactions - at around the transition mass between the proposed starvation quenching and ram pressure stripping quenching scenarios. These studies are also largely based on small nearby galaxy samples from SDSS ( Geha et al., 2012; Wheeler et al., 2014) or Local Group galaxies ( Weisz et al., 2015) - which may be atypical of the general galaxy population. However, the results agree that galaxy-galaxy interactions are significant in forming passive low-mass galaxies, and a combination of these results suggest (see Figure 6 of Weisz et al., 2015) that we are beginning to probe the characteristic mass scales between starvation and ram pressure stripping scenarios.
In a converse, but complementary approach, Geha et al. (2012) find that essentially all local log10[M∗/M⊙]9.0 field galaxies are star forming, and that the passive fraction at these stellar masses drops rapidly as a function of distance from massive host galaxies. This also suggests that local environment plays a significant role in producing passive, low-mass systems (also see earlier work of Baldry et al., 2006; Haines et al., 2007, etc), and that isolated evolution alone fails to produce passive low mass galaxies.
However, the environmental quenching of low-mass satellites is far from ubiquitous. Multiple recent studies ( Phillips et
al., 2014; Wheeler et
al., 2014; Phillips et
al., 2015) have shown relatively modest fractions of log10[M∗/M⊙]9.5 satellites are quenched (20-30%) and that the efficiency of satellite quenching is deceasing with time (Tinker et al., 2013). As such, quenching via starvation is likely to be driven by factors other than satellite stellar mass, potentially both host halo mass and interaction timescale.
Theoretical modelling can offer some insights into this process, with contemporary semi-analytic simulations accurately reproducing the observed galaxy merger rates at low redshift (Kitzbichler & White, 2008). These simulations also predict that secular transitions from active to passive galaxies are extremely problematic at the lowest stellar masses (log10(M∗/M⊙)9.0, they predict extremely low passive fractions in field environments, Wheeler et al., 2014), and constrain the likely quenching timescale of interactions - highlighting that these timescales must be comparable to gas depletion timescales for intermediate mass satellites ( Fillingham et al., 2015). Moreover, the relatively simple model predictions of Wheeler et al. (2014) find that in order to produce the observed passive satellite population, requires either very-long quenching timescales or environmental quenching triggers which are not well matched to satellite accretion.
Previously, the GAMA sample has not been used to specifically target quenching in low mass galaxies. However, its extension to dex lower in stellar mass than SDSS at distances 10-100 Mpc - closer to representing a cosmic average, high completeness to close pairs (Robotham et al., 2014), extensive group catalogue (Robotham et al., 2013), and multiple SFR diagnostics (see Davies et al., 2015), allows us to investigate the passive fraction in both pair and group environment and evaluate the relative contribution of environmental effects in producing quiescent galaxies. In the following paper, we identify passive and star-forming galaxies in the GAMA sample and investigate the environmental distribution of passive galaxies as a function of stellar masses, specifically focusing on the mass range close to the proposed starvation/ram pressure stripping transition. While this work displays the distribution of passive/star forming galaxies over a broad range of stellar masses, we specifically focus on passive galaxies at the low-mass end (log10[M∗/M⊙]) and the effect of galaxy-galaxy interactions. For a complementary analysis of the larger scale environmental effects on star-formation in spiral galaxies at log10[M∗/M⊙], we refer the reader to Grootes et al., in prep.
In this work, we take a slightly different approach to previous studies and do not initially define sources as either a central or satellite galaxy, but consider all pair systems. Phillips et al. (2014) find that satellite galaxies are much more likely to be quenched if their host galaxy is also passive. As such, the same environmental effects may drive passive evolution in both centrals and satellites ( is it purely the interaction that drives the quenching in both galaxies, or the large scale environment?). In addition, we also consider major mergers, where the definition of central/satellite is somewhat ambiguous. We do split our sample into the primary/secondary pair galaxy class defined in Davies et al. (2015), which can be considered a central/satellite separation for minor mergers. We also investigate a number of different environments (group, pair, group and not pair, isolated - see Section 2 for details) to evaluate the relative effect of each on forming passive galaxies.
However, care must be taken. In this work we assume that if quenched fractions correlate with specific environmental metrics, that there is a causal relationship between quenching processes and interactions with the local environment. Recent studies have shown that using between numerical simulations and SDSS galaxies, the colour distribution in over-dense environments can be reproduced via halo assembly bias (Gao & White, 2007) alone ( Hearin & Watson, 2013). Moreover, further work has used the ‘galactic conformity’ results of Kauffmann et al. (2013) to show that assembly bias will naturally produce increased passive fractions in over-dense environments in the complete absence of any post infall processes, such as the environmental quenching processes discussed above (Hearin, Watson, & van den Bosch, 2015). However, these works focus on higher mass galaxies than those discussed here (log10[M∗/M⊙]). In addition, the Kauffmann et al. (2013) work only finds conformity in gas rich, star-forming galaxies at log10[M∗/M⊙] - not quenched gas poor systems. We also note that the Kauffmann et al. (2013) ‘galactic conformity’ is consistent with our previous results in Davies et al. (2015), where when considering the full pair galaxy population, both primary and secondary galaxies (i.e. central and satellites) have their SF boosted to a similar degree.
This paper is structured as follows: in Section 2 we outline the GAMA data set and potential sample biases in our analysis, in Section 3 we discuss how we define passive and star-forming systems in our sample, in Section 4 we investigate the passive and star forming fraction as a function of stellar mass in various environments, in Section 5 we discuss the satellite passive fraction and suggest that the observed distribution is likely due to increasing interaction timescales at lower stellar masses, and in Section 5.3 we outline a simplistic model which can reproduce the observed trends in our data.
Throughout this paper we use a standard CDM cosmology with H0 = 70 kms-1 Mpc-1, = 0.7 and = 0.3.
2 Data
The data used in this work is derived and selected in a similar manner to that described in Davies et al. 2015. Here we briefly discuss the datasets used and refer the reader to previous work for further details.
The GAMA survey is a highly complete multi-wavelength database (Driver et al., 2011) and galaxy redshift () survey (Baldry et al., 2010; Hopkins et al., 2013) covering 280 deg2 to a main survey limit of mag in three equatorial (G09, G12 and G15) and two southern (G02 and G23) regions. The spectroscopic survey was undertaken using the AAOmega fibre-fed spectrograph (Sharp et al., 2006; Saunders et al., 2004) in conjunction with the Two-degree Field (2dF, Lewis et al., 2002) positioner on the Anglo-Australian telescope and obtained redshifts for 250,000 targets covering with a median redshift of , and highly uniform spatial completeness (Robotham et al., 2010; Driver et al., 2011). Full details of the GAMA survey can be found in Driver et al. (2011) and Liske et al. (2015). In this work we utilise the first 5 years of data obtained and frozen for internal team use, referred to as GAMA II. The GAMAII is not currently publicly available, but is due to be fully released in the near future.
In this work we shall use galaxy group and pair membership to delineate its local environment. We use the GAMA G3C catalogue which includes the identification of all galaxy groups and pairs (Robotham et al., 2011, also see Robotham et al., 2012, 2013; Robotham et al., 2014; Davies et al., 2015). Briefly, the GAMA group catalogue is produced using a bespoke friends-of-friends based grouping algorithm which was tested extensively on mock GAMA galaxy light cones and assigns of GAMA galaxies to multiplicity pairs and groups (Robotham et al., 2011). In this work we define a group as a system with multiplicity N2. The GAMA pair catalogue is further detailed in Robotham et al. (2014) and Davies et al. (2015), where pair galaxies are selected on both radial velocity and physical positional offset using SDSS imaging and GAMA AAT spectra. In this work we use the full pair sample, defined as galaxies with physical separation 100 h-1 kpc and velocity separation 1000 km s-1 - over which pair galaxies have been found to affect each other’s star-formation ( Scudder et al., 2012; Davies et al., 2015). While we can’t rule out that pair galaxies are not truly interacting systems, but simply chance position and line of sight velocity correlated sources, care is taken in Robotham et al. (2014) to determine the likelihood of pair systems being physically interacting. In this work, all pair systems are visually classified for observed disturbance using SDSS optical imaging. Figure 6 of Robotham et al. (2014) displays the fraction of morphologically disturbed sources as a function of tangential and radial separation, and highlights that the pair selection method in GAMA is robust at identifying visually disturbed (definitively interacting) sources, specifically as small separations. Using the group and pair classifications, we also define samples of systems in pairs and/or groups, isolated galaxies which are not identified as being in a group or pair, and ‘locally isolated group galaxies’ - which are in a group but not in a pair.
Stellar masses for all galaxies are derived from the photometry for all GAMA II galaxies (Taylor et al., 2011). These stellar masses are calculated using a Chabrier (2003) -like IMF. As in Davies et al (2015) we further split pair galaxies into the primary or secondary systems (by stellar mass) and by pair mass ratio to identify pair galaxies as being either part of a potential major merger (mass ratio 3:1) or minor merger (mass ratio 3:1) - assuming the pair galaxies will eventually merge, which will clearly not be the case for all systems. However, in this work we use the well known terms of ‘major’ and ‘minor’ merger to denote pairs of different mass ratio. We restrict our sample to galaxies at and with GAMA redshift quality flag , for which all galaxies have pair/group assignments - the extent of the G3C catalogue is . We also minimise Active Galactic Nuclei (AGN) contamination in our sample, which may potentially bias SFR estimates, by excluding both optically bright AGN and composite sources using the BPT diagnostic diagram (Baldwin et al., 1981) in an identical manner as in Figure 1 of Davies et al. (2015).
2.1 Potential Selection Biases
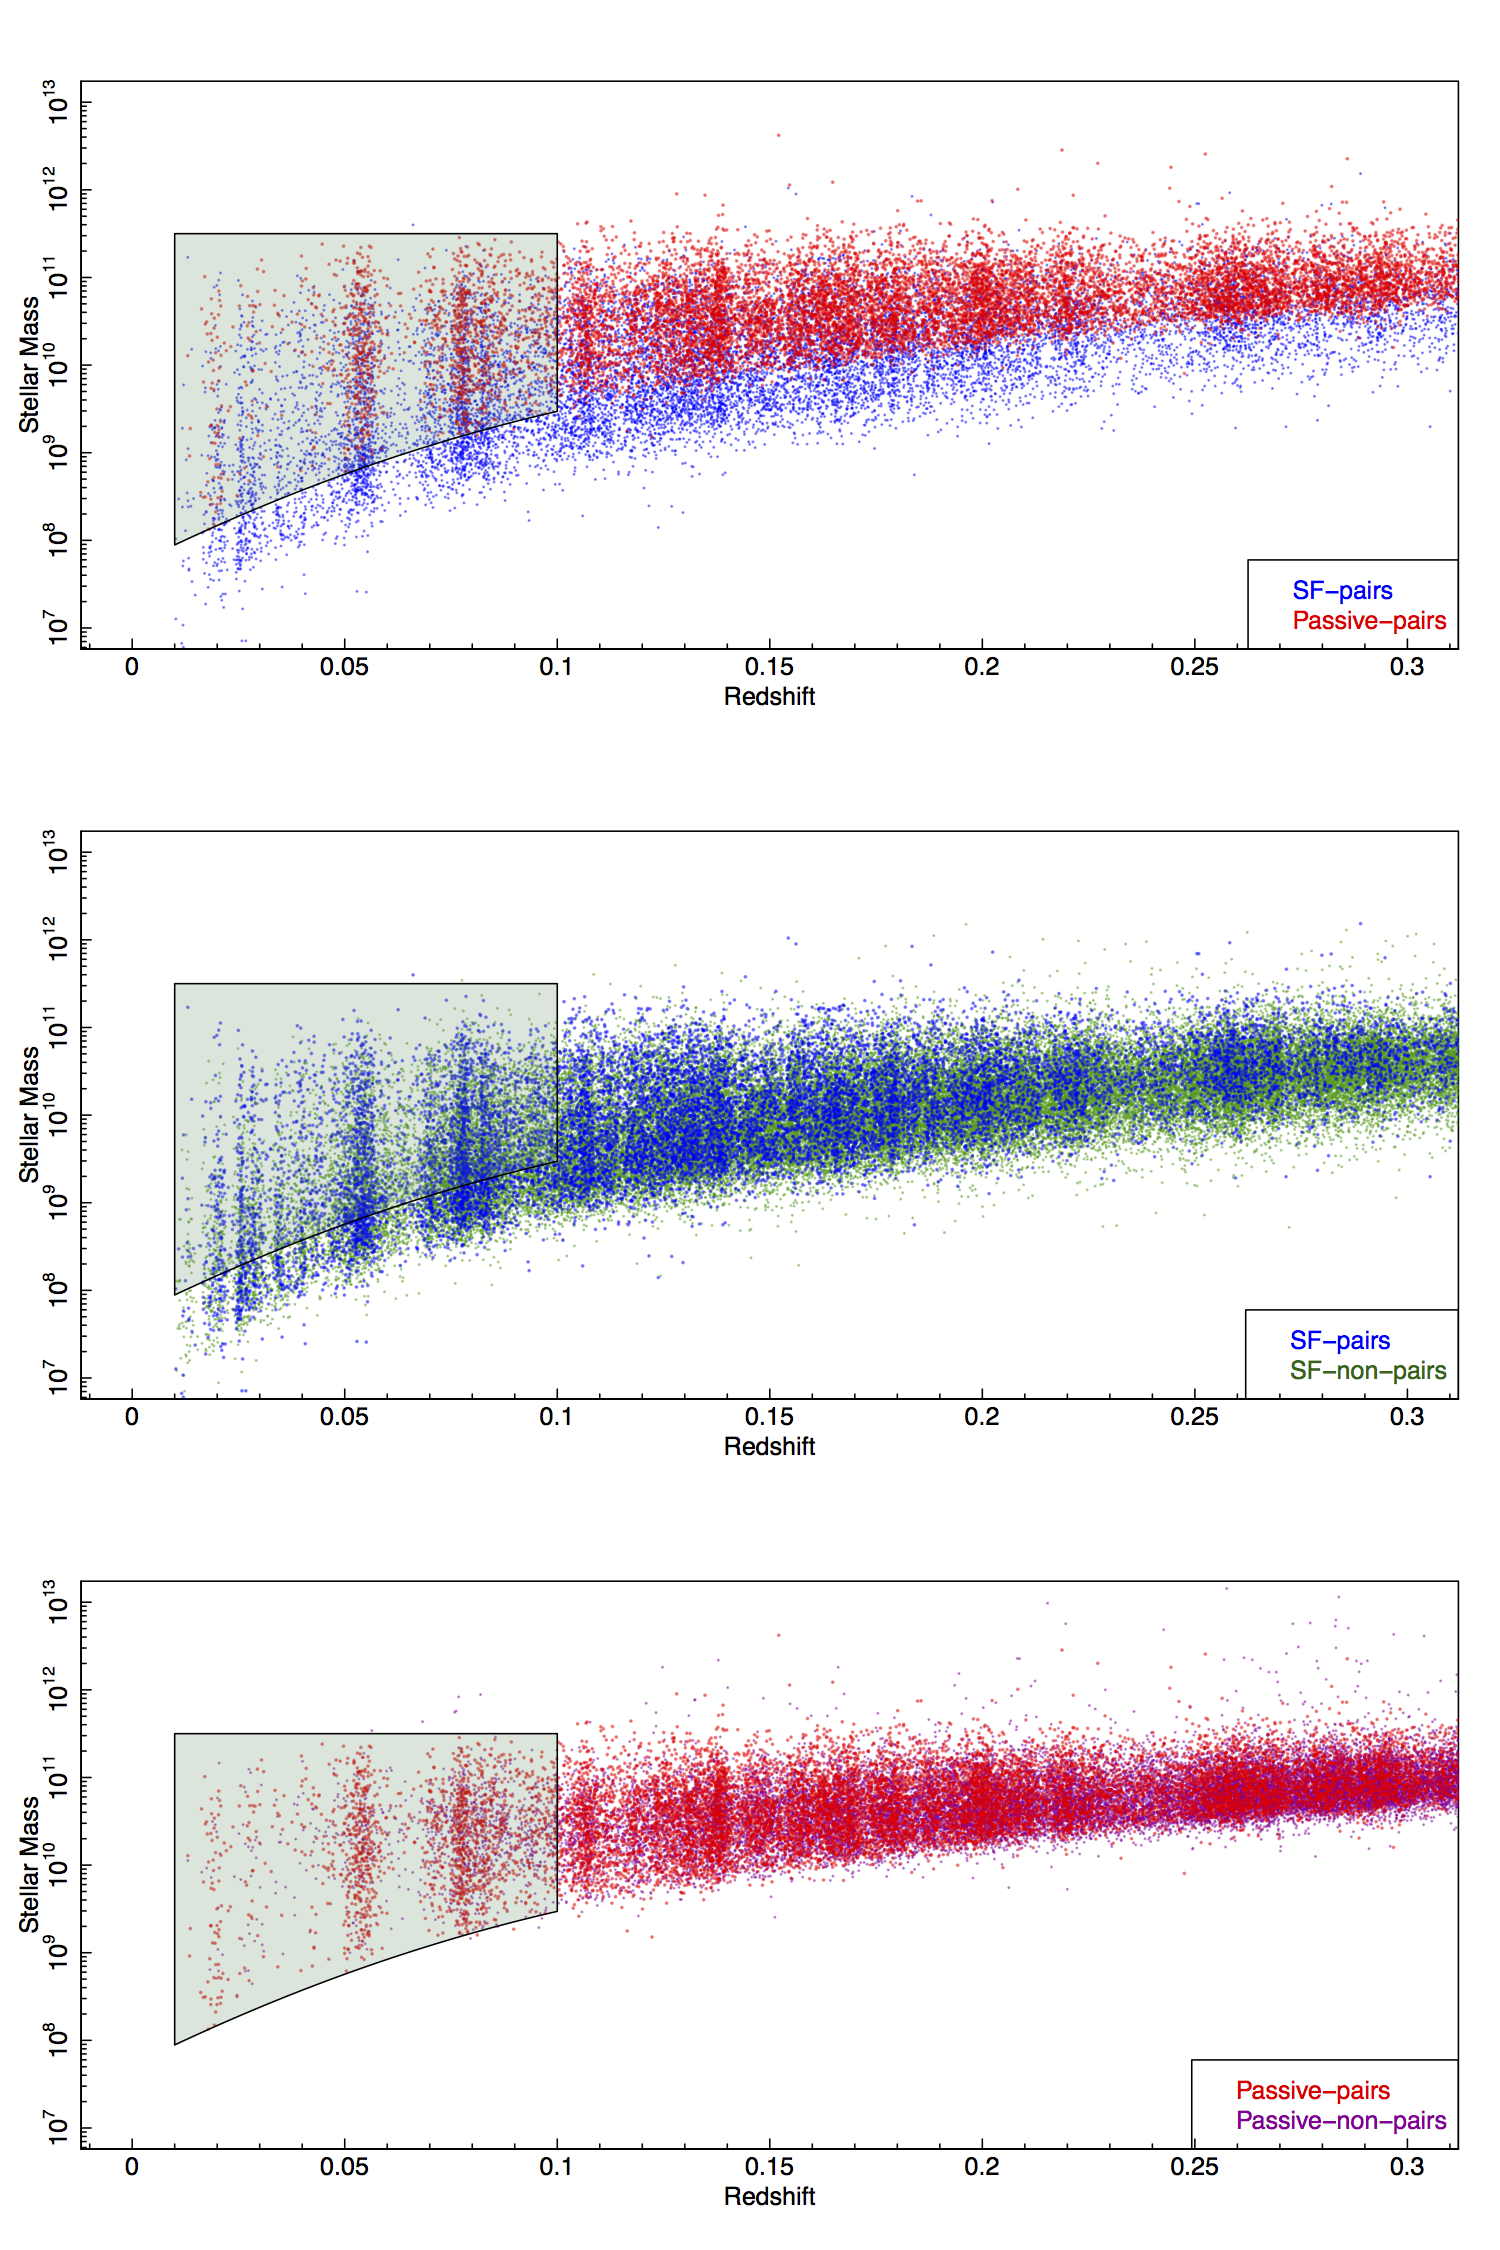
Using the full GAMA data set directly is likely to induce significant biases in our results due to sample selection. Any spectroscopic sample will preferentially identify actively star-forming galaxies over passive galaxies, and this effect will be more apparent with increasing redshift. In order to minimise this, we define a volume limited sample based on the stellar mass detection limits of passive galaxies. Firstly we apply a maximum upper redshift limit of to minimise redshift evolution over our sample and biasing it towards high mass systems. Below we use a rolling sample selection at each stellar mass, defined by the lowest detection limit of the passive systems in GAMA (see the following section for SF/passive selections). To define this limit we split the passive population in bins from and determined the lower stellar mass limit which encompass the mean minus 2.25 the standard deviation in each bin (found to accurately constrain the distribution of passive sources). We then fit a second order polynomial to the lower limits with the form:
| (1) |
Figure 1 shows the volume limited sample used in this work. In this manner, we exclude star-forming systems which would not be detected in our sample if they were in fact passive and at the same stellar mass, and do not bias our selection based on our ability to identify lower-mass star forming systems.
Potential biases in our analysis arise though group/pair assignments discussed above. There is a complex function which defines if systems are assigned to groups and pairs based on redshift, stellar mass, group mass, group occupation, pair mass ratio, etc. For example, we can not rule out that non-pair galaxies in GAMA have a faint companion which sits below the GAMA detection limits, or in fact that non-group galaxies do not have a significant number of sources below this limit (which if detected would cause the system to be identified as a group galaxy).
However, for the former case, this scenario would place the galaxy in question as the central system in a low-mass major merger - where the bulk of this work will focus on satellite galaxies. In the latter, this scenario would place the system as the central galaxy in a low-mass group (M fewM⊙, Robotham et al., 2011) - potentially where group environmental effects are less significant. At some point we must define a group/non-group selection at a specific group mass limit, as ultimately if selections were indefinitely extended to lower and lower stellar mass, almost all systems would reside in a group structure. As such, our group classification is defined as the systems falling within a group of M fewM⊙ - and any results derived in this paper are conditional on this caveat.
Another potential bias arises from the dependance of the identification of pair systems based on the star-forming characteristics of each pair galaxy. Given the differing selection limits for passive and star forming galaxies, pair systems are more likely to be identified if both systems are star-forming, and additionally, passive + star forming pair systems are more likely to be identified if the larger mass galaxy is passive, than if the lower mass galaxy is passive. In order to minimise this bias, we have only included pair galaxies where systems meet our selection limits (as shown in Figure 1). This essentially removes pair systems where one of the galaxies is star-forming, but lies below the selection boundary for passive system. We note that the galaxies in these pairs are completely removed from our analysis - not included in our non-pair samples.
3 Defining Star-Forming/Passive Systems
To determine the affect of local environment on turning galaxies passive, we must first identify passive/star-forming systems in the GAMA dataset. We do this for two separate SFR indicators and both indicators in combination. Firstly, we derive H SFRs as in Davies et al (2015) using the most recent GAMA emission line measurements and the SFR calibration of Gunawardhana et al. (2011), based on the Kennicutt relation (Kennicutt, 1998) - with improved stellar absorption correction from Hopkins et al. (2013). The Gunawardhana et al. (2011) calibration uses the Balmer decrement and GAMA aperture correction to convert observed H fluxes to SFRs - for further details see Davies et al (2015). The GAMA emission line analysis assigns a H measurement to all sources (irrespective of the presence of a detectable H line) and as such, systems with no detectable H, will have low (but non-zero) SFRs.
Secondly, we use the full SED fits to the 21-band photometric data available to all GAMA II sources (GALEX-UV to -500m, Driver et al., 2015) using the energy balance code - magphys (da Cunha et al., 2008). Full details of the GAMA magphys analysis will be presented in Wright et al. (in prep).
Note that the H SFRs described above use Salpeter-like IMFs, while our stellar masses and SED-based SFRs use Chabrier-like IMFs. As such, we scale the H SFRs by a factor of 1.5 to account for this discrepancy (Davé, 2008; Driver et al., 2013). However, our SF/passive selections used in this paper are based solely on the sSFR in our sample, and therefore are not sensitive to choice of IMF ( given a different IMF, we would simply find a different SF/passive selection).
In Davies et al. (2015) we use multiple SFR indicators to probe SF in pair systems (including MIR and FIR). However, in our current analysis we only use the H and magphys SFRs. The MIR and FIR data used in GAMA have a significantly large PSF which may cause contamination between closely separated pair galaxies (see discussion in Davies et al., 2015). While care is taken in the GAMA to deblend flux to the relevant galaxies, this problem become increasingly difficult at low stellar mass, high mass ratio pairs (those primarily of interest in this work). As such, errors in deriving SFR in the MIR/FIR for low mass pair galaxies may be significant. While this error may also cause erroneous magphys fitting results, the energy balance fitting method and application of realistic galaxy templates, goes some way to reduce this issue. In addition, we will only use the magphys SFRs to remove sources from our passive and star-forming H selection to produce a more robust sample (see below), and do not use the SFRs directly in the rest of the work. The H SFR measurements are based on aperture fibre measurements and as such, are not significantly affected by close source confusion. In this manner, we minimise any issues with deblending flux in closely separated sources.
We note that the SFR timescales probed by the H and magphys SFRs are different but comparable. H probes star-formation on timescales of Myr, while the full SED SFRs typically probe Myr (see Davies et al., 2015, for a more comprehensive description of SFR indicator timescales). H is therefore likely to be sensitive to short duration changes in SF - which may be induced by galaxy interactions, but is also sensitive to aperture corrections which may bias derived SFRs. Here we use H both independently and in combination with the more robust, but less sensitive to short timescale variation, full SED SFR.
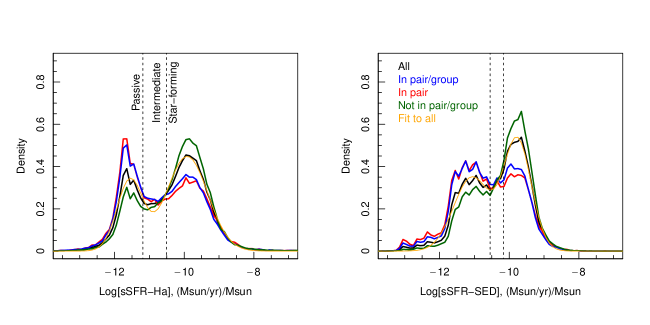
We derive specific SFRs (sSFR) using each indicator and the stellar masses of Taylor et al. (2011), and plot the distribution of all GAMA II sources for both H and magphys SED sSFRs (black line, Figure 2). In Figure 2 we see a clear distinction between star-forming and passive galaxies forming two largely distinct gaussian-like distributions in log[sSFR] space. This separation is more clearly defined for H than the SED SFRs as there is a clear binary split between passive and star-forming systems (the presence or lack of the H emission line). We fit the full distribution of sources (black line) with a double peaked normal distribution (orange line), using a least squares fit, and define sources as passive if they lie below the lower peak plus 1, star-forming if they lie above the upper peak minus 1 and ‘intermediate’ if they fall between these two cuts - we then exclude the ‘intermediate’ sources (see Figure 2 for separation lines). This selection primarily identifies sources which are either definitively passive or star-forming and removes any ambiguous sources. While the sample will be incomplete to all passive/star-forming galaxies, it applies strict constraints on identifying truly passive and star-forming systems and is likely to have little contamination from the ambiguous ‘intermediate’ sources.
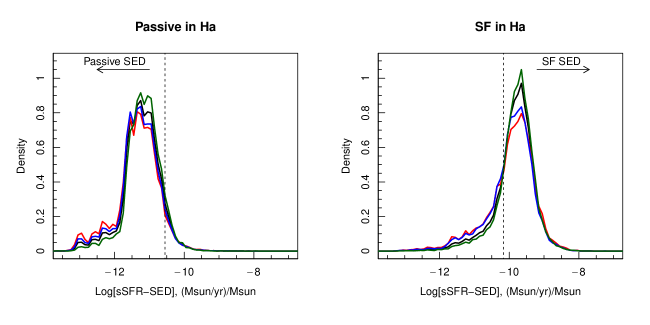
As noted above, initially we perform this selection independently, however, some sources are better defined using H and some better defined using a full SED fit, in addition measurement error may cause either SFR indicator to be spuriously high/low in star-formation (see Figure 3). As such, we also define samples of star-forming and passive galaxies which are selected as such using methods - these sources are likely to have a low contamination from incorrectly assigned sources as their star-formation rates are defined in two completely distinct and separate manners. We have visually inspected all sources in our passive selection at log10M∗9.0 and find that none show evidence of H emission, and hence are likely to be truly passive galaxies. We also visually inspected a subsample of sources in our star-forming selection at the same mass range and find all show evidence of H emission.
In Figures 2 and 3 we also split our sample into those galaxies defined as being in a pair, either pair or group and all other sources (not in a pair or group - which we define as isolated in this work). A higher fraction of passive sources are found in group and pair environments than are isolated - the passive peak is significantly larger for group and pair galaxies than for the isolated galaxies. This highlights the well known trend of galaxy star-formation in group environments, for example see Haines et al. (2007); Haines, Gargiulo, & Merluzzi (2008); Peng et al. (2010); Mahajan, Haines, & Raychaudhury (2010); Mahajan et al. (2015).
4 Passive fractions of galaxies as a function of stellar mass and local environment
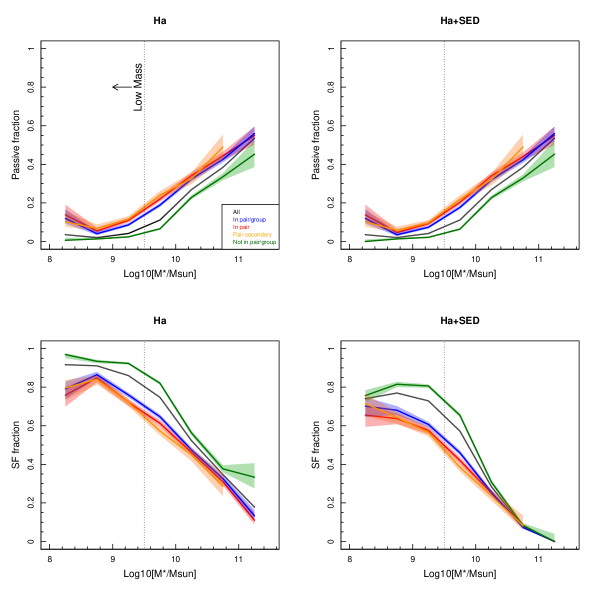
In this work we wish to investigate how local environment affects galaxies as a function of stellar mass, specifically at low stellar masses. In Figure 4 we split our sample in M=0.5log10(M⊙) bins and show the fraction of galaxies defined as passive (top) and star-forming (bottom), in the previous Section, as a function of stellar mass and split by our environmental metrics - in a pair and or group, just in a pair, in pair and the secondary (satellite) galaxy and not in a pair or group. The translucent polygons in these and other plots display the 1 error range derived assuming a binomial distribution (Cameron, 2011).
The passive fraction decreases and star-forming fraction increases with decreasing stellar mass in all environments, as globally low-mass galaxies are more actively star-forming (the well known downsizing paradigm - that low-mass galaxies are more actively star-forming in the local Universe, Cowie et al., 1996). However, it is interesting to note the differences between each environmental metric. Pair and group galaxies have a higher fraction of passive galaxies than the global distribution at all stellar masses (consistent with results seen in Figure 2). We also isolate secondary galaxies in minor mergers (orange line) - these are essentially the satellite systems identified in previous work. While they have the highest low-mass passive fraction of all of our environmental metrics, this fraction is still lower than previous SDSS-based work. At 8.0log10[M∗/M⊙]9.0, Phillips et al. (2014), Geha et al. (2012) and Wheeler et al. (2014) find a passive fraction of (albeit from the same sample), while we find 10-20%. This difference could either be due to sample selection (our passive selection based on H sSFR may be more stringent than their H EW selection) or a difference in stellar mass estimations. For example, if we were to include all ‘intermediate’ defined sources as passive in our H selection, we would obtain a low-mass massive fraction of (comparable to the previous results). We also note that our passive fractions at log10[M∗/M⊙]11.0 are consistent with Phillips et al. (2014), Geha et al. (2012); Wheeler et al. (2014) and Wetzel et al. (2013) at around 30-50% (see Figure 5 & 6 of Weisz et al., 2015, for a summary of passive fractions as a function of stellar mass). Following this, we attribute the differences in normalisation of passive fractions between our current analysis and the previous SDSS-based work to be our sample selection methods, and our more stringent passive classification. From here on, we will continue to compare the overall trends in our results to the previous work, with the caveat that the overall normalisation in passive fractions differ.
At the lowest stellar masses (log10[M∗/M⊙]) we find a very low passive fraction in non-group/pair environments for both of H selection and H+SED SFR indicators combined (). This is consistent with Geha et al. (2012) who find exceptionally low passive fractions for low-mass galaxies in isolated environments ().
We also see an upturn in the passive fractions for pair/group galaxies in our lowest stellar mass bin. This is interesting considering the work on passive fractions of Local Group galaxies in Weisz et al. (2015) in combination with passive galaxies at higher masses. As discussed previously, they find passive fractions decrease with decreasing stellar mass to log10[M∗/M⊙]M⊙ and then rise again at log10[M∗/M⊙]M⊙ for Local Group galaxies - suggesting this transitions represent changes between starvation quenching at intermediate masses, and ram pressure quenching at low-masses. This is consistent with the trends in our results and we may be witnessing the start of the low-mass upturn in passive fractions, potentially driven by the ram pressure stripping scenario. However, we find that this upturn occurs at slightly higher masses than in Weisz et al. (2015) - log10[M∗/M⊙]M⊙. This is not surprising given that the transition point at these masses has not previously been well probed by either the Local Group or nearby galaxy studies, and is consistent with the shape of the satellite passive fraction at these masses seen by Wheeler et al. (2014).
Considering the star-forming fractions, we see the well-studied and general trend of increasing star-forming fractions at low stellar masses, and that non-pair/group environments have a higher star-forming fraction than group/pair galaxies (specifically at the highest stellar masses), once again completely consistent with many previous studies ( Peng et al., 2010).
4.1 Environmental Passive Fraction
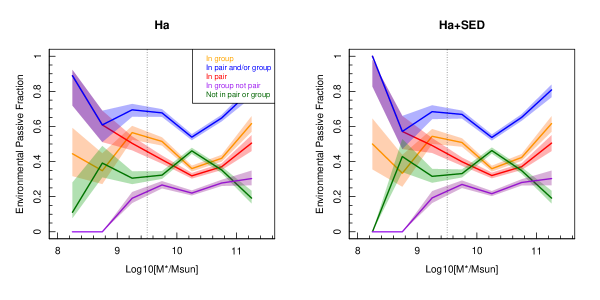
Taking this analysis further, it is interesting to consider the relative fraction of passive galaxies in different environments as a function of stellar mass ( of all passive galaxies, what fraction live in a pair, in a group, in a group and/or pair, in a group but not in a pair, or is isolated). We define this as the ‘environmental passive fraction’. In this manner we can compare and contrast the relative contributions of different environments in producing passive galaxies. For example, are there particular stellar masses where pair classification appears more dominant than group classification in producing passive galaxies? And/or are there stellar masses where local environment appears to have little effect on forming passive galaxies?
Figure 5 displays the fraction of all passive (top) and star-forming (bottom) galaxies as a function of environment and stellar mass. Note that the bottom panel is not the converse of the upper panel, as in our selections not all galaxies are defined as either passive or star-forming. As such, comparing the top and bottom panels directly is problematic. In essence one should consider the top panel as a measure of how environment turns galaxies passive and the bottom panel how environment boosts star formation. These two scenarios are subtly, but importantly distinct.
Considering the passive fraction, at low stellar masses pair/group galaxies dominate the distribution. At log10[M∗/M⊙], of all passive galaxies are in a pair or group (blue), with pair classification being the dominant factor at log10[M∗/M⊙]. The fraction of passive galaxies in pairs drops with increasing stellar mass until it reaches a minimum at log10[M∗/M⊙] and then rises (red). This is mirrored in the isolated passive galaxy fraction, which is small at low stellar masses, rises to log10[M∗/M⊙] and then drops at higher stellar masses (green). Non-pair group galaxies (purple) also have a low passive fraction at low stellar masses and rises progressively to higher stellar masses. The full group distribution (which we remind the reader also contains pairs which are in groups) is relatively flat at until log10[M∗/M⊙] and then progressively rises to higher stellar masses. From this figure we identify four key observables, and inferences from them:
Pair galaxies dominate the environmental passive fraction at the lowest stellar masses, and the passive fraction increases with decreasing stellar mass. As such, local galaxy-galaxy interactions are likely to play a significant role in turning low-mass galaxies passive. There are very few passive non-pair galaxies at low-masses (either in the field or non-pair group galaxies), which is in agreement with predictions that low-mass galaxies do not become passive via isolated evolution alone, and is consistent with previous results.
At log10[M∗/M⊙] the environmental passive fraction in pairs is lowest. This point is close to the peak in the major merger rate from Robotham et
al. (2014). As shown in Davies et al (2015), in major mergers at this mass range both galaxies have their star-formation strongly enhanced by the interaction. As such, the passive fraction in pairs drops significantly, which is echoed in an increase in the passive fraction in isolated galaxies (it is likely that this peak is not driven by an increase in passive galaxies in the field, but a decrease in passive galaxies in pairs). In fact, at these masses passive galaxies are more likely to be found in the field rather than in a pair and are almost equally likely to be in a group as the field. It appears that log10[M∗/M⊙] is an important transition point where the dominant factor in producing passive galaxies changes from environmental to mass quenching (see discussion), and where we see the strongest enhancement of star-formation in interactions (close to the peak in the major merger rate, where SF is most strongly enhanced, see Davies et al., 2015).
At higher stellar masses, passive galaxies are increasingly found in group environments. This is displayed by the rise of environmental passive fractions in non-pair group galaxies (purple). Such systems are in a group environment but are not currently undergoing a local galaxy-galaxy interaction. This rise highlights that high-mass passive galaxies are more likely to be in groups, in pairs ( it is the group environment/assignment that drives the passive classification, the local galaxy interactions). This suggests that as we move to higher stellar masses, mass quenching becomes more important at making galaxies passive. A high fraction of passive galaxies are still found in pairs, but there is also a high fraction in isolated galaxies. As such, the interaction is not likely to be the dominant factor in modifying SF at these masses.
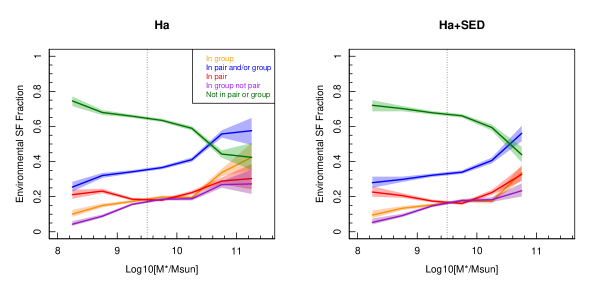
Looking at this from the other side, the bottom panels of Figure 5, show the fraction of star-forming galaxies in each environment as a function of stellar mass. At low stellar masses we consistently see that star-forming galaxies are more likely to be found in the field than in group/pairs. At log10[M∗/M⊙]10.25 we see a large increase in the fraction of star-forming galaxies that reside in groups and pairs. This suggest that environmental effects do not have a significant impact on boosting the star-forming fraction in low-mass galaxies but the effect becomes increasingly important at higher stellar masses - which is consistent with the top panels. Once again it is interesting to note that these transitions occur around the log10[M∗/M⊙]10.25 point.
4.2 Comparison to Pair Classifications
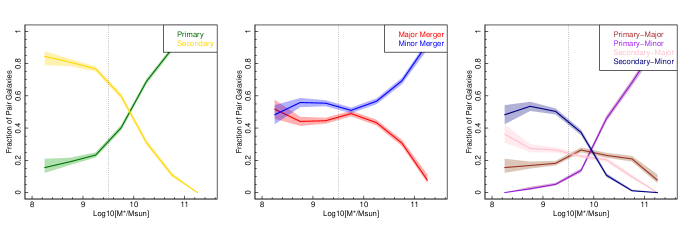
As alluded to above and discussed at length in Davies et al (2015), the galaxy assignment within pairs as either primary or secondary (central/satellite) and the pair mass ratio (major/minor merger) plays a significant role on the effects of the interaction on the SF properties of the galaxies. Note that the Davies et al work only considers galaxies in the 9.5log10[M∗/M⊙]11 range but finds that star-formation is enhanced in major mergers and the primary galaxies of minor mergers, but suppressed in the secondary galaxies in minor mergers (satellites). As such, can we relate the dominant pair galaxy assignments discussed in Davies et al, as a function of stellar mass, to the fraction of passive/star-forming galaxies in pairs as a function of stellar mass, discussed above? For example, if low-mass galaxies are made passive by an interaction, the bulk of these galaxies should be secondary galaxies in minor mergers.
Figure 6 displays the pair class assignments of Davies et al. as a function of stellar mass. At low stellar masses galaxies are predominantly the secondary galaxy in an interaction (lower mass - left panel) and in equally in major/minor mergers (middle panel). Combining these classifications in the right-most panel, we find that at low stellar masses the pair galaxy population is dominated by the secondary galaxies of minor mergers - those which Davies et al. find to have their star-formation suppressed. At around log10[M∗/M⊙] the population transitions to being major-merger dominated and we see equal contributions from primary/secondary and major/minor classes. At log10[M∗/M⊙]10 the distribution is strongly dominated by primary galaxies in minor mergers. These sources are likely to be large central galaxies, undergoing interactions with small satellites.
There are a number of key observations in these figures that we can relate to the distributions in Figure 5:
At the lowest masses, secondary-minor galaxies dominate. In Davies et al. this is the only class of galaxy where star-formation is suppressed in the interaction. This is consistent with the high passive fraction/low star-forming fraction in pairs at these masses.
The mass at which the majority of galaxies are primaries of minor mergers (log10[M∗/M⊙]), and where secondary-minor galaxies are no longer the dominant class, is similar to the mass where the pair passive fraction is lowest. We know from Davies et al these pair classes are where star-formation is primarily enhanced in galaxy interactions, as such these results are consistent.
At the highest stellar masses the primary galaxies in minor mergers dominate. These are likely to be central galaxies undergoing mergers with smaller satellites. The interaction is unlikely to strongly modify their star-formation processes. These systems may have also already become passive via mass quenching processes, and as such can not be affected by the interaction. This is consistent with the passive fractions at these masses not being strongly dependent on local galaxy interactions (as discussed previously).
While the distributions in Figure 6 are not surprising (essentially showing that low-mass galaxies are likely to merge with larger galaxies, and high mass galaxies are likely to merge with smaller galaxies - as you would expect simply from number statistics and hierarchical formation) they do highlight the interesting transition points in stellar mass where different merger classes dominate. It is intriguing that the transition point in stellar mass where primary/secondary galaxies dominate, and where all merger classes are equally represented, is almost identical to the point where the passive fraction in pairs/groups and non-pairs/groups is the same, log10[M∗/M⊙] - potentially the transition point where environmental effects no longer have a strong impact in forming passive galaxies. This also suggests that the environmental quenching is only significant in secondary (satellite) galaxies and does not strongly affect primary (central) systems, potentially contradictory to the Phillips et al. (2014) results of satellite/central joint quiescence.
4.3 Summary of passive galaxies as a function of stellar mass and environment
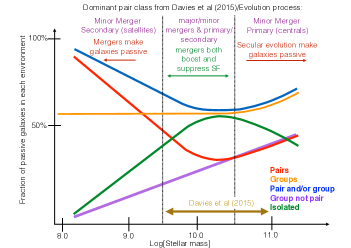
Clearly there is a complex interplay of galaxy interactions of different types and environment affecting the star-formation evolution of galaxies - where it is likely that pair status (primary/secondary), pair mass ratio and absolute stellar mass all govern how an interaction modifies star formation. Here we aim to piece together the observables discussed above to produce a self-consistent model of how interactions affect star formation in galaxies as a function of stellar mass. We use the key points outlined in the previous section to produce a cartoon representation of the local environmental effects on star formation as a function of stellar mass (Figure 7). In this proposed scenario low-mass galaxies (log10[M∗/M⊙]) are strongly affected by an interaction and are primarily made passive - with this effect increasing with decreasing stellar mass. In this regime the pair galaxy population is dominated by the secondary galaxies in minor mergers, which is consistent with the Davies et al. (2015) analysis at higher stellar masses, which finds that this class of galaxies shows the strongest suppression during an interaction.
At 9.5log10[M∗/M⊙] we see a mix of different interaction processes, pair galaxies are both suppressed and enhanced in star-formation depending on their pair mass ratio, as such galaxy interactions produce a broad range of effects. This range covers the peak major merger rate, where star-formation is most enhanced and therefore, pair passive fractions are lowest. We also note that this mass range is similar to the characteristic turnover mass in the metallicity-specific SFR (Z-sSFR) relation for all GAMA galaxies found in Lara-López et al. (2013). In this work, they also find high dispersion in their relation at this point and propose that varying gas mass and metallicity produce a mixing of processes. They predict that in high mass galaxies sSFR correlates with metallicity and in low mass galaxies an anti-correlation is observed. This is being explored further in upcoming work (Lara-López in prep).
At log10[M∗/M⊙] the passive fraction is increasingly dominated by non-pair group galaxies. We see roughly equal fractions of passive galaxies in pairs, non-pair group galaxies and non group/pair galaxies, suggesting galaxy interactions have little effect in turning galaxies passive - mass quenching is likely to be the dominant process driving star formation evolution. We do see an increase an the group passive fraction at these masses (as has been found for many previous studies). However, the rise of passive fractions in non-pair group galaxies suggests that this is due to factors other than local galaxy-galaxy interactions. Potentially group galaxies at these masses are significantly older than those in the field, and as such have had sufficient time to consume all of their star-forming gas. We also reminded the reader that the recent simulations of Hearin, Watson,
& van den Bosch (2015) highlight that passive fractions at log10[M∗/M⊙] can potentially be explained by assembly bias, and as such, may not need quenching processes to produce the observed passive fraction.
5 Discussion
In the following subsections we further investigate the affect of galaxy-galaxy interactions on causing quiescence, focusing just on the satellite pair systems (which we now define as the lower mass galaxy in each pair irrespective of pair mass ratio - previously called ‘secondary’). In Subsection 5.1 we investigate the satellite passive fraction as a function of stellar mass, to highlight the increasing effect of interactions at lower stellar masses, in Subsection 5.2 we relate these trends in this passive fraction to interaction timescale and highlight that our observed distribution can potentially be explained by varying interaction timescales as a function of stellar mass, and in Subsection 5.3 we produce a simplistic model to test this premise.
5.1 Satellite passive fraction
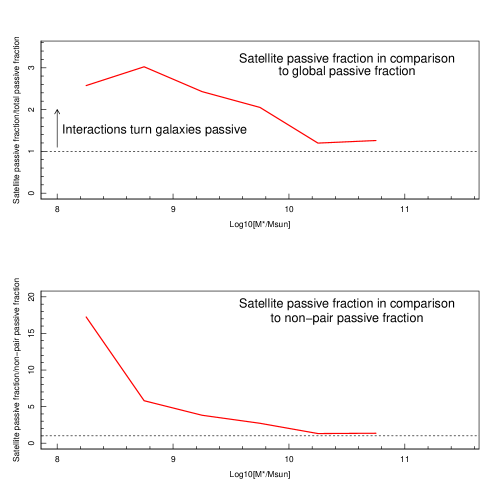
Figure 8 shows the satellite passive fraction (as defined by our H SFR) of all pair galaxies scaled by the global passive fraction of all galaxies in our sample (top) and the passive fraction of all non-pair galaxies (middle). This scaling removes any dependance of the global galaxy passive fraction as a function of stellar mass and directly measures the increased chance of being passive while in a galaxy-galaxy interaction. In Figure 8 a value of 1 indicates that the pair passive fraction at a given stellar mass is identical to the global/non-pair passive fraction, while values highlight that interactions have some affect in making galaxies passive. At log10[M∗/M⊙] (the transition mass discussed previously), galaxy interactions appear to have little affect on turning galaxies passive, as the satellite passive fraction is similar to the global/non-pair value. This is consistent with the recent work of Behroozi et al. (2015), who find only modest changes to passive fractions due to major mergers at log10[M∗/M⊙]. However, at lower stellar masses we see an increasingly strong trend of interacting systems having a larger passive fraction than the global/non-pair samples. This suggests that at low stellar masses interactions significantly suppress the star formation in galaxies.
This is consistent with previous results at this mass regime (Phillips et al., 2014, 2015; Wheeler et al., 2014; Fillingham et al., 2015), but also shows the direct trend of the increasing effect of interactions in quenching galaxies as a function of decreasing stellar mass from log10[M∗/M⊙] to log10[M∗/M⊙]. Clearly lower mass galaxies are more strongly affected by their very local environment than those at higher masses.
5.2 Interaction Timescales
Previous studies comparing passive galaxies to numerical simulations ( Wheeler et al., 2014; Fillingham et al., 2015) suggest that at log10[M∗/M⊙] significantly long quenching timescales are required to form passive galaxies via starvation. As such, it is interesting to consider whether the correlation between stellar mass and the effect of quenching in interactions is directly related to the interaction timescale. For example, if environment quenching occurs on long timescales, then galaxies that have been undergoing an interaction for sufficiently long time should show a high passive fraction. Conversely, short duration interactions may not be long enough for the galaxies to become passive. We remind the reader that H SFRs probe timescales of Gyr and therefore are essentially a measure of the instantaneous SFR during the interaction.
From numerous simulations ( Boylan-Kolchin & Ma, 2007; Wetzel, Tollerud, & Weisz, 2015) we find that galaxy merger timescales are dependant on both the pair mass ratio and the host halo mass, where high pair mass ratio and low-halo mass leads to long duration mergers (also see Kitzbichler & White, 2008, - where interaction timescale goes as M for galaxies at log10M). To investigate the correlation between interaction timescale and the effect on pair passive fractions, we assume the most simplistic model, where:
and and are the masses of the primary and secondary galaxies respectively and take as a proxy for the primary galaxy’s dynamical timescale at the viral radius, . This correlation essentially assumes a fixed orbital energy, angular momentum, host galaxy viral radius (which is potentially appropriate at low stellar masses, where the size-mass relation flattens, see Lange et al., 2015) and mass to light ratio. We highlight that this analysis is speculative, but is only intended to show that to first order the distributions of dynamical timescales of interactions is similar in shape to the effect of interactions in turning galaxies passive. Given the limitation of the data available to us, we believe this approximation to be adequate.
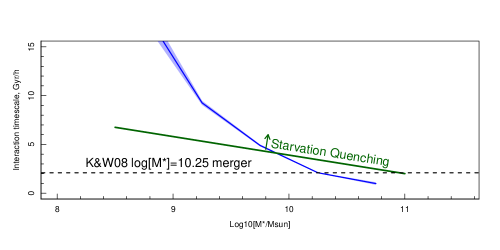
We calculate for all satellite pair galaxies in our sample and take the median in the same stellar mass bins as all other figures in this work. The bottom panel of Figure 8 shows median as a function of stellar mass normalised to the Kitzbichler & White (2008) mean interaction timescale at log10[M∗/M⊙]=10.25 (2.09 Gyr). The coloured polygon displays the standard error on the median in each bin. The distribution of dynamical timescales and passive fraction in pairs are somewhat similar, with low-mass systems primarily having large merger timescales, the shortest timescales occurring at log10[M∗/M⊙] and rising at higher stellar masses. Once again this point occurs close to the transition mass discussed previously. As such, we find that the point where passive fractions are almost identical between the field and groups/pairs (Figure 5), where centrals and satellites in mergers have equal number density (Figure 6), where the effect of interactions in forming quiescent galaxies and the merger timescale is shortest (Figure 8), and where major merger rates are highest (Robotham et al., 2014) all occur at roughly log10[M∗/M⊙]. Clearly this stellar mass is an important transition point between different galaxy-galaxy interaction driven/suppressed star-formation processes.
Assuming this correlation between merger timescale and environmental quenching to be correct, we can begin to speculate about the processes which are causing these galaxies to become passive. It appears that interaction timescale is likely to be a driving factor in passive low-mass satellite galaxies. Potentially galaxies going through interactions fail to replenish their gas reservoirs in the locally over-dense environment. As such, they have a fixed star-formation lifetime during the interaction. Interactions at around log10[M∗/M⊙] happen quickly, and therefore the galaxies merge before we see them in their passive state. At lower stellar masses interaction timescales increase, thus, an increasingly larger fraction of galaxies have interaction timescales which are longer then their quenching times scales - and the passive fraction increases.
Recent work by Peng et al (2015), found that the dominant process in turning galaxies passive is strangulation (galaxies can no longer draw from a reservoir of gas, use up all of their internal gas and become passive), and that this process occurs on timescales of Gyrs, while Wheeler et al. (2014); Fillingham et al. (2015) find that quenching timescales of Gyr are required for intermediate mass satellites. Simulations, such as those of Boylan-Kolchin et al (2007), find that merger timescales can be as long as Gyr for low-mass minor mergers, and as short as 1 Gyr for major mergers close to log10[M∗/M⊙]. Therefore, only low-mass satellites have the necessary interaction timescales to consume their gas, starve and reach their passive state. In the bottom panel of Figure 8 we also over-plot the lower limit of the predicted starvation quenching timescale as a function of stellar mass, taken from Figure 6 of Fillingham et al. (2015). Using this simple comparison, we find that only galaxies at low (log10[M∗/M⊙]10) stellar masses have interaction timescales sufficient for galaxies to become passive via starvation. At higher masses, timescales are short enough for galaxies to continue star-forming for the duration of the interaction, and not run out of star-forming gas. This is consistent with the comparative lack of significant gas consumption in mergers at these masses found by Ellison et al. (2015) - post merger products primarily at log10[M∗/M⊙]11 are found to have comparable HI gas fractions to non-merger control galaxies.
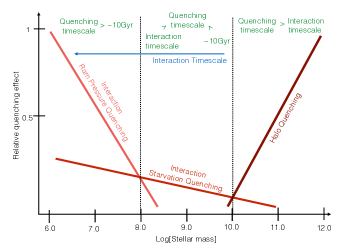
This simplistic picture, where interaction timescale governs the formation of passive low-mass galaxies, may be sufficient to explain the observed trends of passive fractions as a function of stellar mass in the log10[M∗/M⊙]10 regime. Combining this with the previous work at both higher and lower stellar masses ( see Figure 5 and 6 of Weisz et al., 2015), we can build a picture of the relative contributions of different quenching effects as a function of stellar mass. A representation of this is shown in Figure 9. In Local Group satellites at log10[M∗/M⊙]8 Weisz et al. (2015) see a sharp increase in the passive fraction with decreasing stellar mass. At these masses both starvation quenching timescales and interaction timescales are sufficiently long, that satellite galaxies have not merged but have also not had time to become passive via starvation. As such, the high passive fractions are attributed to efficient ram pressure stripping in low-mass galaxies, with the quenching efficiency increasing with decreasing stellar mass ( Wheeler et al., 2014; Wetzel, Tollerud, & Weisz, 2015). At 8log10[M∗/M⊙]10 (the masses of interest in this work) we see a low passive fraction, but a steadily increasing trend of the effect of interactions in turning galaxies passive with decreasing stellar mass. At these masses starvation quenching timescales are shorter than interaction timescales and satellites stay within an interaction long enough to become passive. At log10[M∗/M⊙]10 interactions are too short for galaxies to become passive via starvation quenching, however, passive fractions rise once again and increase to higher stellar masses. It is therefore likely that this quenching is not due to galaxy-galaxy interactions but driven by mass quenching processes.
5.3 Simplistic model of star-formation in satellite galaxies at log10[M∗/M⊙]8
To test this hypothesis further, we develop a simplistic model for the evolution of sSFRs in log10[M∗/M⊙]8 satellites during interactions with various pair mass ratios. From Davies et al. (2015) we know that interactions can cause both suppression and enhancement of star-formation in satellites, and in the previous section we discuss that this dichotomy may simply be a consequence of interaction timescale. As we wish to develop a model which fits all satellites, we require such a model to both enhance and suppress star-formation.
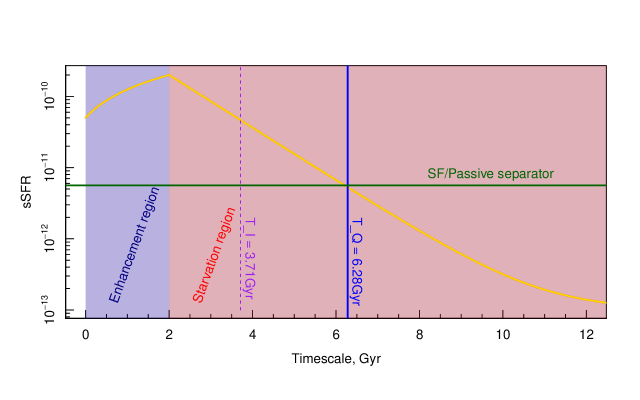
We initially start with the premise that the sSFR is enhanced at the early stages of the interaction, and then exponentially declines after some time (simulating the slow strangulation scenario). We set the sSFR of a galaxy upon entering an interaction as the median sSFR of all non-pair galaxies in our data at dex in stellar mass from our model galaxy. In Davies et al. (2015) we find that on average major mergers at log10[M∗/M⊙]=10-10.5 show 4 times increase in their sSFR. Using the merger timescale estimates of Kitzbichler & White (2008), we predict these interactions to last Gyr. We treat these mergers as us witnessing the initial stages of all mergers, and linearly increase the sSFR of our model galaxy by 4-5 times (randomly selected) over the first 2 Gyr of the interaction. We then assume that at Gyr the sSFR exponentially declines as the galaxy become starved. In order to predict the rate of decline we use the minimum quenching timescales from Fillingham et al. (2015) and set our exponential decay so that the galaxy becomes passive using our SF/passive selection (log10[sSFR]-11.25) at the quenching timescale corresponding to its stellar mass ( for a given stellar mass satellite, our model is defined as passive at the quenching time defined by Fillingham et al). This naturally produces different exponential decay slopes as a function of stellar mass. We derive an analytic form for sSFR in an interaction which meets the above criteria as follows:
| (2) |
| (3) |
where, = initial sSFR enchantment factor (4-5 from Davies et al., 2015), = timescale within the interaction, sSFR0 = starting sSFR defined from all non-pair galaxies at dex in stellar mass, sSFRFloor = sSFR at = infinity which we set to log[sSFRFloor]=-13.0, = characteristic decay rate (), = quenching timescale from Fillingham et al. (2015), which has the form = -1.9log10[M∗/M⊙]+22.9, and = characteristic sSFR (), which is used to match the starvation quenching point from Fillingham et al. (2015) to our SF/passive separation point. Figure 10 shows sSFR against interaction timescale from our model for a log10[M∗/M⊙] galaxy interacting with a log10[M∗/M⊙] galaxy with log10[sSFR0]=-10.3. We highlight the initial star-formation enhancement region and subsequent starvation region. We also over-plot the quenching point (TQ) defined by the minimum quenching timescale from Fillingham et al. (2015) after the 2 Gyr point and the SF/passive separator line used in this work.
Following this, we wish to define a timescale over which this system could be observed as an interacting pair galaxy. To do this we use the merger timescale () predictions used in the previous section, and set an upper limit of 13 Gyr (systems can not have been in an interaction for longer than this, given the age of the Universe). The vertical purple dashed line in Figure 10 displays for this model, and as such, this system could only be observed as an interacting pair at times shorter than this point. Clearly, if this model system is observed as an interacting pair it will be classed as star-forming, as the quenching timescale is much longer than .
In order to test the validity of this model we use it to make a prediction for the sSFR in interacting systems, calculate the predicted passive fraction, and relate these to the observed passive fraction in GAMA. To do this we take a random point on our model at and treat this as the interacting galaxy’s sSFR. We take all true satellite pair galaxies in our sample, calculate sSFR0 from the median sSFR of all non-pair galaxies at dex in stellar mass, and use their stellar mass and pair mass ratio to calculate a model sSFR vs interaction timescale. We then randomly select a sSFR at . This provides a predicted sSFR for all satellite galaxies in our data assuming our model to be correct. From this we calculate a passive fraction as a function of stellar mass, as in the previous section. We repeat this process 500 times to quantify any biases in the random selection at times below .
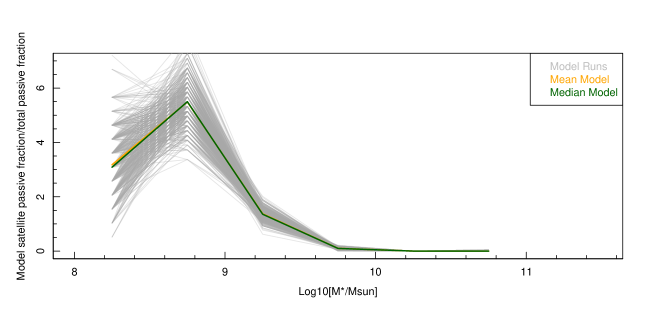
Figure 11 displays the model passive fraction as a function of stellar mass for all runs, and the mean/median of the runs. Comparing this to the top panel of Figure 8 (the true distribution in the data), we find that our model predictions show similar characteristics, they are both low at log10[M∗/M⊙]=10.5 and rise with deceasing stellar mass to log10[M∗/M⊙]8.75, and then slightly drop to log10[M∗/M⊙]8.25. Our model passive fractions are higher at log10[M∗/M⊙]9.0 and lower at log10[M∗/M⊙]9.0, but are largely similar in shape to the observed distribution. The drop in passive fractions at the lowest stellar masses is interesting, and is seen in both the data and models. This drop is potentially due to quenching timescales approaching a considerable fraction of the age of the Universe. At low stellar masses only satellites which began an interaction in the very early Universe will have sufficient time to become quenched via starvation. This is in fact one of the reasons for proposing the ram pressure quenching scenario at the lowest stellar masses - low-mass Local Group galaxies do not have sufficient time to become passive by any other method.
While this model is simplistic and contains speculative assumptions, it is largely consistent with the observed passive fractions. It provides a model where interaction timescale is the governing factor in the observed passive fractions as a function of stellar mass, and roughly produces the necessary distribution of passive fractions in satellite galaxies - being low at log10[M∗/M⊙]10 and consistently rising to lower stellar masses, and then plateauing/dropping at log10[M∗/M⊙]8.5.
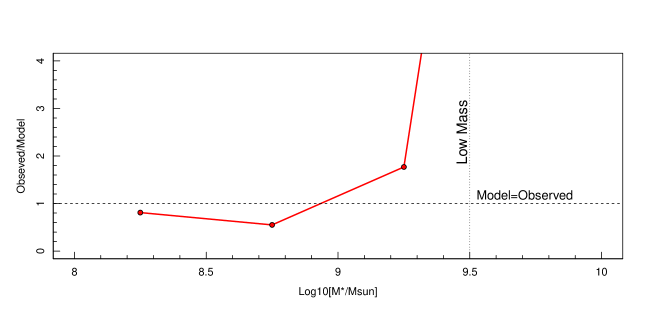
To compare our model passive fractions with the observed passive fractions, Figure 12 shows the ratio of the two distributions, in the low stellar mass regime. The solid line and points display the observed passive fraction divided by the mean model passive fraction (gold line in Figure 11). At 8.0log10[M∗/M⊙]9.5 the model is roughly consistent with the observed distribution (within a factor of two in the region of interest in this work). At higher stellar masses the model passive fraction is essentially zero, and can not be directly compared to the observed distribution - our model only probes starvation quenching scenarios, which are likely to only be appropriate in the 8.0log10[M∗/M⊙]10 regime.
6 Conclusions & Future Prospects
We have investigated the environmental distribution of passive and star-forming galaxies in the GAMA sample. We find that passive fractions are higher in group/pair environments than isolated environments for all stellar masses, suggesting that group/pair interactions have a significant role in producing quiescent systems. We find that the global passive fractions drop with decreasing stellar mass in all environments until log10[M∗/M⊙]. For pair galaxies we see an increase in the passive fraction in our lowest stellar mass bin, potentially indicating that we are witnessing the increase in passive fraction predicted from ram pressure quenching in low-mass galaxies (Fillingham et al., 2015). We highlight that log10[M∗/M⊙] is an important transition mass, below which interactions have a significant role in suppressing star-formation in galaxies.
We investigate the passive fraction of pair galaxies in comparison to the global passive fraction, and show that the pair passive fraction increases with decreasing stellar mass, suggesting the effect of interactions in producing passive galaxies becomes more significant at lower stellar masses. However, we highlight that this trend is similar to the changes in interaction timescale with stellar mass. We propose, consistently with other authors, that the formation of passive galaxies at log10[M∗/M⊙] primarily occurs via starvation due to an interaction. The interaction initially boosts star formation in the satellite galaxy, but inhibits the system from replenishing its gas (or potentially such gas in the local environment has already been accreted by its larger companion). As such, the galaxy consumes all of its gas, starves and become passive over an extended time period.
We suggest that the increased passive fraction at low stellar masses are simply due to extended interaction timescales. Essentially, all galaxies would eventually become passive in an interaction, however this process will occur over long timescales ( Gyr). Interactions of galaxies around log10[M∗/M⊙] are exceptionally short (1 Gyr) and therefore, the galaxies merge prior to their passive phase. For less massive galaxies, interaction timescales are dramatically increased, and a large fraction of galaxies reach their passive phase prior to merging. This causes us to observe an increased passive fraction with decreasing stellar mass.
We produce a simplistic model, where satellites have an initial, short duration, burst of star-formation and then a exponential decline in star-formation (used to mimic the starvation processes). This model largely reproduces the shape of the observed satellite passive fraction.
The prospects for future studies to probe this scenario are tantalising. Combinations of the COSMOS field data (Scoville et al., 2007) and the upcoming COSMOS HI Large Extragalactic Survey (CHILES see, Fernández et al., 2013), the Looking At the Distant Universe with the MeerKat Array (LADUMA, Holwerda in prep) with deep spectroscopic surveys in the Chandra Deep Filed South (CDFS) region, and GAMA combined with the Australia Square Kilometre Array Pathfinder (ASKAP) Deep Investigation of Neutral Gas Origins Survey (DINGOS, Meyer, 2009), will give us key insights into the HI content of low-mass mergers - potentially allowing us to directly probe gas depletion in these galaxies. It will also be interesting to consider the varying gas-to-stellar mass ratio at low stellar masses ( Kannappan, Guie, & Baker, 2009), and how this ratio changes with local environment.
Looking further ahead the Wide Area VISTA Extragalactic Survey (WAVES, Driver et al., 2015) will obtain spectra for Million galaxies at probing stellar mass limits down to log10[M∗/M⊙], and fully bridging the transition between previous samples of local low-mass galaxies and Local Group systems - fully mapping the potential transition between starvation quenched and ram-pressure quenched systems.
Acknowledgements
GAMA is a joint European-Australasian project based around a spectroscopic campaign using the Anglo-Australian Telescope. The GAMA input catalogue is based on data taken from the Sloan Digital Sky Survey and the UKIRT Infrared Deep Sky Survey. Complementary imaging of the GAMA regions is being obtained by a number of independent survey programs including GALEX MIS, VST KiDS, VISTA VIKING, WISE, Herschel-ATLAS, GMRT and ASKAP providing UV to radio coverage. GAMA is funded by the STFC (UK), the ARC (Australia), the AAO, and the participating institutions. The GAMA website is http://www.gama-survey.org/. SB acknowledges the funding support from the Australian Research Council through a Future Fellowship (FT140101166). M.S.O acknowledges the funding support of the Australian Research Council through a Future Fellowship (FT140100255). Mahajan is a Fast track fellow at IISER, Mohali funded by the Department of Science (DST) Science Education and Research Board (SERB) grant number SB/FTP/PS-054/2013. We thank the anonymous referee for their extremely helpful comments and suggestions in improving the overall quality and clarity of this paper.
References
- Ahn et al. (2014) Ahn, C. P., Alexandroff, R., Allende Prieto, C., et al. 2014, ApJS, 211, 17
- Alpaslan et al. (2015) Alpaslan M., et al., 2015, MNRAS, 451, 3249
- Baldry et al. (2006) Baldry I. K., Balogh M. L., Bower R. G., Glazebrook K., Nichol R. C., Bamford S. P., Budavari T., 2006, MNRAS, 373, 469
- Baldry et al. (2010) Baldry, I. K., Robotham, A. S. G., Hill, D. T., et al. 2010, MNRAS, 404, 86
- Balogh et al. (2004) Balogh M. L., Baldry I. K., Nichol R., Miller C., Bower R., Glazebrook K., 2004, ApJ, 615, L101
- Behroozi et al. (2015) Behroozi P. S., et al., 2015, MNRAS, 450, 1546
- Baldwin et al. (1981) Baldwin, J. A., Phillips, M. M., & Terlevich, R. 1981, PASA, 93, 5
- Boylan-Kolchin & Ma (2007) Boylan-Kolchin M., Ma C.-P., 2007, MNRAS, 374, 1227
- Brough et al. (2013) Brough S., et al., 2013, MNRAS, 435, 2903
- Cameron (2011) Cameron E., 2011, PASA, 28, 128
- Chabrier (2003) Chabrier G., 2003, PASP, 115, 763
- Cowie et al. (1996) Cowie L. L., Songaila A., Hu E. M., Cohen J. G., 1996, AJ, 112, 839
- da Cunha et al. (2008) da Cunha, E., Charlot, S., & Elbaz, D. 2008, MNRAS, 388, 1595
- Davé (2008) Davé, R. 2008, MNRAS, 385, 147
- Davies & Phillips (1989) Davies J. I., Phillips S., 1989, Ap&SS, 157, 291
- Davies et al. (2015) Davies, L. J. M, et al. 2015, MNRAS, X, X
- Drinkwater et al. (2001) Drinkwater M. J., Gregg M. D., Holman B. A., Brown M. J. I., 2001, MNRAS, 326, 1076
- Driver et al. (2011) Driver, S. P., Hill, D. T., Kelvin, L. S., et al. 2011, MNRAS, 413, 971
- Driver et al. (2013) Driver, S. P., Robotham, A. S. G., Bland-Hawthorn, J., et al. 2013, MNRAS, 430, 2622
- Driver et al. (2015) , Driver S. et al., In ?The Universe of Digital Sky Surveys?, Naples, Italy, Nov. 2014
- Driver et al. (2015) Driver S. P., et al., 2015, arXiv, arXiv:1508.02076
- Ellison et al. (2008) Ellison S. L., Patton D. R., Simard L., McConnachie A. W., 2008, AJ, 135, 1877
- Ellison et al. (2010) Ellison S. L., Patton D. R., Simard L., McConnachie A. W., Baldry I. K., Mendel J. T., 2010, MNRAS, 407, 1514
- Ellison et al. (2015) Ellison S. L., Fertig D., Rosenberg J. L., Nair P., Simard L., Torrey P., Patton D. R., 2015, MNRAS, 448, 221
- Fernández et al. (2013) Fernández, X., van Gorkom, J. H., Hess, K. M., et al. 2013, arXiv:1303.2659
- Fillingham et al. (2015) Fillingham S. P., Cooper M. C., Wheeler C., Garrison-Kimmel S., Boylan-Kolchin M., Bullock J. S., 2015, arXiv, arXiv:1503.06803
- Gao & White (2007) Gao L., White S. D. M., 2007, MNRAS, 377, L5
- Geha et al. (2012) Geha M., Blanton M. R., Yan R., Tinker J. L., 2012, ApJ, 757, 85
- Grebel, Gallagher, & Harbeck (2003) Grebel E. K., Gallagher J. S., III, Harbeck D., 2003, AJ, 125, 1926
- Gunawardhana et al. (2011) Gunawardhana, M. L. P., Hopkins, A. M., Sharp, R. G., et al. 2011, MNRAS, 415, 1647
- Haines et al. (2007) Haines C. P., Gargiulo A., La Barbera F., Mercurio A., Merluzzi P., Busarello G., 2007, MNRAS, 381, 7
- Haines, Gargiulo, & Merluzzi (2008) Haines C. P., Gargiulo A., Merluzzi P., 2008, MNRAS, 385, 1201
- Hearin, Watson, & van den Bosch (2015) Hearin A. P., Watson D. F., van den Bosch F. C., 2015, MNRAS, 452, 1958
- Hearin & Watson (2013) Hearin A. P., Watson D. F., 2013, MNRAS, 435, 1313
- Hopkins et al. (2013) Hopkins A. M., et al., 2013, MNRAS, 430, 2047
- Hopkins et al. (2013) Hopkins, A. M., Driver, S. P., Brough, S., et al. 2013, MNRAS, 430, 2047
- Kannappan, Guie, & Baker (2009) Kannappan S. J., Guie J. M., Baker A. J., 2009, AJ, 138, 579
- Kauffmann et al. (2013) Kauffmann G., Li C., Zhang W., Weinmann S., 2013, MNRAS, 430, 1447
- Kennicutt (1998) Kennicutt, R. C., Jr. 1998, ApJ, 498, 541
- Kimm et al. (2009) Kimm T., et al., 2009, MNRAS, 394, 1131
- Kitzbichler & White (2008) Kitzbichler M. G., White S. D. M., 2008, MNRAS, 391, 1489
- Kroupa (2001) Kroupa P., 2001, MNRAS, 322, 231
- Lange et al. (2015) Lange R., et al., 2015, MNRAS, 447, 2603
- Lara-López et al. (2013) Lara-López M. A., et al., 2013, MNRAS, 434, 451
- Lewis et al. (2002) Lewis, I. J., Cannon, R. D., Taylor, K., et al. 2002, MNRAS, 333, 279
- Liske et al. (2015) Liske J., et al., 2015, arXiv, arXiv:1506.08222
- Mahajan, Haines, & Raychaudhury (2010) Mahajan S., Haines C. P., Raychaudhury S., 2010, MNRAS, 404, 1745
- Mahajan et al. (2015) Mahajan S., et al., 2015, MNRAS, 446, 2967
- Martig et al. (2009) Martig M., Bournaud F., Teyssier R., Dekel A., 2009, ApJ, 707, 250
- Martin et al. (2007) Martin D. C., et al., 2007, ApJS, 173, 342
- Meyer (2009) Meyer M., 2009, pra..conf, 15
- Patton et al. (2011) Patton D. R., Ellison S. L., Simard L., McConnachie A. W., Mendel J. T., 2011, MNRAS, 412, 591
- Peng et al. (2010) Peng Y.-j., et al., 2010, ApJ, 721, 193
- Peng et al. (2012) Peng Y.-j., Lilly S. J., Renzini A., Carollo M., 2012, ApJ, 757, 4
- Peng, Maiolino, & Cochrane (2015) Peng Y., Maiolino R., Cochrane R., 2015, Natur, 521, 192
- Phillips et al. (2014) Phillips J. I., Wheeler C., Boylan-Kolchin M., Bullock J. S., Cooper M. C., Tollerud E. J., 2014, MNRAS, 437, 1930
- Phillips et al. (2015) Phillips J. I., Wheeler C., Cooper M. C., Boylan-Kolchin M., Bullock J. S., Tollerud E., 2015, MNRAS, 447, 698
- Robotham et al. (2010) Robotham, A., Driver, S. P., Norberg, P., et al. 2010, PASA, 27, 76
- Robotham et al. (2011) Robotham, A. S. G., Norberg, P., Driver, S. P., et al. 2011, MNRAS, 416, 2640
- Robotham et al. (2012) Robotham, A. S. G., Baldry, I. K., Bland-Hawthorn, J., et al. 2012, MNRAS, 424, 1448
- Robotham et al. (2013) Robotham, A. S. G., Liske, J., Driver, S. P., et al. 2013, MNRAS, 431, 167
- Robotham et al. (2014) Robotham A. S. G., et al., 2014, MNRAS, 444, 3986
- Saunders et al. (2004) Saunders, W., Bridges, T., Gillingham, P., et al. 2004, Proc. SPIE, 5492, 389
- Scoville et al. (2007) Scoville, N., Aussel, H., Brusa, M., et al. 2007, ApJS, 172, 1
- Scudder et al. (2012) Scudder J. M., Ellison S. L., Torrey P., Patton D. R., Mendel J. T., 2012, MNRAS, 426, 549
- Sharp et al. (2006) Sharp, R., Saunders, W., Smith, G., et al. 2006, Proc. SPIE, 6269, 62690G
- Taylor et al. (2011) Taylor, E. N., Hopkins, A. M., Baldry, I. K., et al. 2011, MNRAS, 418, 1587
- Taylor et al. (2015) Taylor E. N., et al., 2015, MNRAS, 446, 2144
- Tinker et al. (2013) Tinker J. L., Leauthaud A., Bundy K., George M. R., Behroozi P., Massey R., Rhodes J., Wechsler R. H., 2013, ApJ, 778, 93
- Tinsley (1968) Tinsley B. M., 1968, ApJ, 151, 547
- Weisz et al. (2015) Weisz D. R., Dolphin A. E., Skillman E. D., Holtzman J., Gilbert K. M., Dalcanton J. J., Williams B. F., 2015, ApJ, 804, 136
- Wetzel, Tollerud, & Weisz (2015) Wetzel A. R., Tollerud E. J., Weisz D. R., 2015, ApJ, 808, L27
- Wetzel et al. (2013) Wetzel A. R., Tinker J. L., Conroy C., van den Bosch F. C., 2013, MNRAS, 432, 336
- Wheeler et al. (2014) Wheeler C., Phillips J. I., Cooper M. C., Boylan-Kolchin M., Bullock J. S., 2014, MNRAS, 442, 1396
- Wijesinghe et al. (2012) Wijesinghe D. B., et al., 2012, MNRAS, 423, 3679