11email: lutz@mpe.mpg.de 22institutetext: School of Physics and Astronomy, Tel Aviv University, Tel Aviv 69978, Israel 33institutetext: Department of Astronomy, University of Maryland, College Park, MD 20742, USA
The far-infrared emitting region in local galaxies and QSOs: Size and scaling relations
We use Herschel 70 to 160 m images to study the size of the far-infrared emitting region in about 400 local galaxies and quasar (QSO) hosts. The sample includes normal ‘main-sequence’ star-forming galaxies, as well as infrared luminous galaxies and Palomar-Green QSOs, with different levels and structures of star formation. Assuming Gaussian spatial distribution of the far-infrared (FIR) emission, the excellent stability of the Herschel point spread function (PSF) enables us to measure sizes well below the PSF width, by subtracting widths in quadrature. We derive scalings of FIR size and surface brightness of local galaxies with FIR luminosity, with distance from the star-forming main-sequence, and with FIR color. Luminosities 1011 L⊙ can be reached with a variety of structures spanning 2 dex in size. Ultraluminous 1012 L⊙ galaxies far above the main-sequence inevitably have small 0.5 kpc FIR emitting regions with large surface brightness, and can be close to optically thick in the FIR on average over these regions. Compared to these local relations, first ALMA sizes for the dust emission regions in high redshift galaxies, measured at somewhat longer rest wavelengths, suggest larger sizes at the same IR luminosity. We report a remarkably tight relation with 0.15 dex scatter between FIR surface brightness and the ratio of [Cii] 158 m emission and FIR emission – the so-called [Cii]-deficit is more tightly linked to surface brightness than to FIR luminosity or FIR color. Among 33 z0.1 PG QSOs with typical /0.1, 19 have a measured 70 m half light radius, with median =1.1 kpc. This is consistent with the FIR size for galaxies with similar but lacking a QSO, in accordance with a scenario where the rest FIR emission of these types of QSOs is, in most cases, due to host star formation.
Key Words.:
Galaxies: structure – Galaxies: starburst – Galaxies: active1 Introduction
The rate of star formation (SFR) is a primary characterizing quantity of any galaxy, and its spatial distribution holds important clues about its driving mechanisms. Over recent years, it has been established that most stars form in galaxies on a star-forming main-sequence (MS) in the M∗-SFR plane (see, e.g., Brinchmann et al. (2004) and Schiminovich et al. (2007) for the local universe and many works for redshifts up to 2 and more). These main-sequence galaxies are typically disk dominated objects (e.g., Wuyts et al., 2011; Wisnioski et al., 2015), and existence and tightness of the star-forming main-sequence imply a rather steady star formation history in these objects. On the other hand, the most intense star formation in the local universe occurs in (ultra)luminous infrared galaxies ((U)LIRGs) that are closely related to galaxy interaction or mergers (Sanders & Mirabel, 1996, and references therein). These objects are well above the main-sequence, and their extreme star formation is certainly episodic. Understanding the role of steady processes, dramatic mergers, and the impact of active galactic nuclei on the level and distribution of star formation, and on its ultimate quenching, is a centerpiece of galaxy evolution studies.
Star formation in most local galaxy disks can be traced well by a variety of UV to near-IR indicators. This gets difficult if not impossible in the heavily dust-obscured IR luminous systems, where the short wavelength tracers reach only a surface layer. Longer wavelength tracers have been used instead to map star formation at sufficient spatial resolution. Resolution should be a few arcsec, or better reach down to sub-arcsec levels for optimal study of local IR-luminous systems. These tracers include mostly radio continuum (e.g., Condon et al., 1990), mid-infrared continuum and emission features (e.g., Soifer et al., 2000, 2001; Díaz-Santos et al., 2010, 2011), but also mm interferometry to the extent one can constrain the distribution of star formation from the distribution of dust or gas mass (e.g., Sakamoto et al., 1999). Each of these approaches has its particular strengths and weaknesses, related to the tightness of the link between the particular tracer and SFR, to the possible contamination by other sources such as AGN or dust heated by old stars, as well as to technicalities of available beam sizes, coverage of all relevant spatial frequencies in interferometry, and size of samples that can be realistically observed. But a clear finding is that some IR-luminous systems are characterized by very compact star formation (e.g., Condon et al., 1991).
A powerful approach uses high spatial resolution measurements of the far-infrared emission near the 100 m SED peak where the energy of obscured star formation is re-radiated by the dust ‘calorimeter’. Because of the favourable contrast of this peak to the emission that may be heated by an AGN proper, this also is arguably the best chance to map star formation in the presence of fairly powerful AGN. But sensitive far-infrared interferometry will not be available soon, and the first cryogenic space telescopes such as IRAS, ISO, Spitzer, and Akari lacked the necessary spatial resolution in the far-infrared. The best tool for the foreseeable future is the Herschel111Herschel is an ESA space observatory with science instruments provided by European-led Principal Investigator consortia and with important participation from NASA. (Pilbratt et al., 2010) database. While the full width at half maximum (FWHM) of the point spread function (PSF) at the shorter of the 70, 100 and 160 m wavelengths covered by Herschel-PACS (Poglitsch et al., 2010) is of order 5″, characteristic source sizes below that scale are still derivable from their broadening effect, given the intrinsic stability of the PSF. The present paper attempts this for a sample of 400 galaxies, including normal near main-sequence as well as IR-luminous galaxies, and QSO hosts. This approach uses a tracer that is closely linked to SFR and can be applied homogeneously to hundreds of sources, but only delivers a characteristic size rather than detailed structure that would typically need sub-arcsecond interferometry. We adopt an , , and km s-1 Mpc-1 cosmology, redshift-independent distances for some very local galaxies, a Chabrier (2003) IMF, a conversion as appropriate for the Kennicutt (1998) conversion corrected to Chabrier IMF, and a ratio 1.9 of 8–1000 m and 40–120 m luminosity that is typical for the non-QSO galaxies in our sample.
2 Data and analysis methods
We use 70, 100, and 160 m images from scan maps obtained with PACS (Poglitsch et al., 2010) on board Herschel (Pilbratt et al., 2010), collecting archival data from various projects. In order to cover a wide range of galaxy properties, we first obtain an IR-selected local sample ranging from normal galaxies up to (ultra)luminous infrared galaxies. For that purpose, we searched the Herschel archive for all cz2000 km/s objects from the IRAS Revised Bright Galaxy Sample (RBGS, Sanders et al., 2003). Various proposals included some RBGS galaxies, overall covering a wide range of IR luminosities from normal to ULIRG. Coverage of the RBGS sample by Herschel is excellent at LIRG and ULIRG luminosities, because project OT1_dsanders_1 systematically addressed these. Objects below the LIRG threshold enter our sample via the lower luminosity ones among the RBGS galaxies observed by other proposals, and because some IRAS-defined RBGS (U)LIRGs at the better Herschel resolution are found to be sub-LIRG pairs or have companions. Also, other galaxies are serendipitously found within the mapped area. For a better sampling of normal near-main-sequence galaxies, we also include KINGFISH (Kennicutt et al., 2011) galaxies. Since this work focusses on normal star-forming galaxies and starbursts, we excluded the few dwarfs and low mass systems below log(M∗)=8.5 as well as the elliptical NGC 1404 that are part of the KINGFISH sample. Below, we refer to the combination of RBGS galaxies, KINGFISH galaxies, and the serendipitous galaxies included in our analysis as ‘galaxies’, with a total of 306 galaxies. Our study in addition includes Palomar-Green (PG, Boroson & Green, 1992) QSOs from Herschel proposals OT1_lho_1, OT1_rmushotz_1, and OT1_hnetzer_1, (see Petric et al., 2015) to which we refer as ‘QSOs’. We have 93 sources labelled QSO in our sample, because 2 of the 87 Boroson & Green (1992) objects (PG1226+023 and PG1444+407) were not observed by PACS, but 8 QSOs of equivalent properties were additionally observed in OT1_lho_1 or OT1_hnetzer_1. To assess the stability of the point spread function, we use observations of reference stars that were obtained as part of the PACS calibration program.
Several mappers have been successfully used to derive images from the PACS
data, which are characterized by significant 1/f noise in the individual
detector
timelines. Since our goal is to derive intrinsic FIR sizes by comparing
the (slightly broadened) observed source FWHM to that of a PSF reference,
we use the simplemost ‘masked highpass filtering’ strategy which can
produce a very stable
PSF (see below). In that specific respect it is still superior to mappers
such as, e.g., UNIMAP (Piazzo et al., 2015) or Scanamorphos (Roussel, 2013).
While having clear advantages in other respects, these mappers
may sometimes produce residuals near very
bright sources and/or slightly less stable PSF wings
222See ‘PACS map-making tools: analysis and benchmarking, 30 March 2014’ http://herschel.esac.esa.int/twiki/pub/Public/
PacsCalibrationWeb/pacs_mapmaking_report14_v2.pdf.
The reduction follows the standard masked high pass filtering script provided with the Herschel HIPE software. To obtain the most stable PSF, we always use a 20″ radius circular patch mask to exclude the source from the running median high pass filter. We always centered this patch mask on the actual source position. We start from the Herschel science archive pipeline version 13.0 ‘Level 1’ data. This is important since version 13.0 for the first time implemented an improved reconstruction of the actual Herschel pointing, reducing effects on the PSF by uncorrected pointing jitter. From the maps we measure circularized Gaussian FWHMs, and aperture photometry centered on the source that is corrected to total fluxes using standard PACS encircled energy fraction curves. By default, we use apertures of diameter 14″ at 70 and 100 m and 24″ at 160 m. Larger apertures are used where required by a clearly extended morphology. We derive rest frame 40–120 m luminosities by fitting SED templates from Berta et al. (2013) to the PACS fluxes and integrating the best fit template over that range. We use 40–120 m rather than 8–1000 m because it is less AGN contaminated, better sampled by PACS, and one of the common conventions in the FIR literature going back to IRAS. Most sources have been observed with two different scan angles each in the 70 m ‘blue’ and 100 m ‘green’ band, each time simultaneously with the 160 m ‘red’ band. The two angles for one of the blue or green bands are almost always observed in immediate succession, while the other band may be obtained at a much later date. To mitigate any slight pointing shifts that can arise due to a different star tracker orientation or different Herschel thermal state between these two dates, we average images from the two scan angles before fitting and deriving fluxes, but average the ‘red’ results from the two epochs only at the level of the derived FWHM and fluxes. With the exception of the source position that is used to center the map and the mask, all other reduction parameters are applied identically to all sources.
2.1 PSF stability

To assess the stability of the PSF in our maps, we used the primary and secondary flux calibrators And, Ari, Boo, Cap, Cet, CMa, Dra, Dra, Gem, Lep, Peg, Tau, HD41047, HD138265, HD139669, HD159330, HD170693. These were observed repeatedly (total 185 pairs of observations) as part of the PACS calibration program and cover a wide range of fluxes. Data were processed and Gaussian fitted exactly as for the science targets. Fig. 1 shows the resulting PSF FWHM for the blue and green bands. Results are remarkably stable for bright 0.2 Jy stars, and do not show a trend with flux. The resulting mean FWHM and dispersion are 5.299″ (dispersion 0.018″) and 6.546″ (dispersion 0.029″) for the blue and green bands after clipping 2 (4) outliers, respectively. These few outliers do not represent problematic non-point sources, such as dust shell stars or multiple stars, since FWHM values consistent with the mean were obtained for the same objects at different epochs. They rather indicate that in a small 3% of observations even the improved pipeline v13.0 pointing reconstruction has imperfections leading to slightly enhanced FWHM. A basic limit to the PSF stability in PACS scan observations is set by a random 0-25 msec synchronization jitter between instrument and pointing data, set at the start of an onboard control procedure. The effect of this jitter for the observing mode that we used is below the observed dispersion. An equivalent analysis of reference star observations for the red band provides circularized FWHM 10.632″ (dispersion 0.118″). We adopt these values as the FWHM and uncertainty of the PSF for a point source with Rayleigh-Jeans spectral slope, as reduced with our specific procedure.
2.2 Effects of source color
The considerable spectral width of the PACS filters leads to a dependence of
PSF width on spectral
shape. This is confirmed on sky
333http://herschel.esac.esa.int/twiki/pub/Public/
PacsCalibrationWeb/bolopsf_22.pdf,
but not accurately
characterized empirically, due to the lack of bright celestial point sources
with a variety of non-Rayleigh-Jeans slopes. We rather use ‘as built’
Herschel modelled PSFs
444http://herschel.esac.esa.int/twiki/pub/Public/
PacsCalibrationWeb/PACSPSF_PICC-ME-TN-029_v2.0.pdf
for a range of spectral slopes , . To account for optical
imperfections of PACS which are not included in the model PSFs, calibration
uncertainties, and residual
uncorrected pointing jitter these model PSFs were Gaussian convolved to
match the observed stellar PSF FWHM for the case of a Rayleigh-Jeans
spectral slope. Results imply that between
and , the PSF FWHM increases by about 2.0%, 3.4%,
5.5% for the blue, green, red band, respectively.
2.3 Determination of size of the far-infrared source
We attempt to measure sizes only for sources with integrated S/N10 in the given photometric band. To the PACS maps we fit elongated 2d Gaussians using IDL mpfit2dpeak.pro and a consistent fit area for all sources, and derive the circularized . We derive the intrinsic source FWHM by subtraction in quadrature based on the PSF FWHM derived above and corrected to the spectral slope that is matching the source’s PACS photometry. The subtraction in quadrature is strictly correct only for Gaussian structure of both source and PSF. We have verified that the non-gaussianity of the PSF leads to a systematic overestimate of the intrinsic FWHM of a Gaussian source by 10%. We do not attempt to correct for any specific value given it would only apply to a strictly Gaussian source structure. The error estimate for includes the uncertainty of due to the source’s S/N, the dispersion of bright reference stars around , and the effect of the uncertainty in spectral slope. We consider a source as resolved if the difference of and is larger than three times this error estimate. For brevity, we denote below with the intrinsic half light radius at 70 m ( for a Gaussian source), after conversion to a physical scale in kpc based on distances from redshift and our adopted cosmology, with the exception of redshift-independent distances for the KINGFISH sources which were taken from Kennicutt et al. (2011). and analogously denote the physical half light radii at the longer PACS wavelengths.
2.4 Resolved sources
The reduction described previously is optimized for sources with intrinsic width similar to or below the width of the PSF. This includes all the QSO hosts. For galaxies that are resolved over several beam widths, as frequently found among the nearby galaxies and less luminous IR selected objects, the specific masking/filtering strategy reduces the outermost emission. For objects that were found to be clearly extended on inspection of PACS maps and/or with an initial measured 70 m FWHM above 12″, we hence reverted to the V13.0 pipeline reduced ‘Level 2.5’ JScanam (Graciá-Carpio et al., 2015) maps, or to the publicly released KINGFISH DR3 Scanamorphos maps. Intrinsic sizes were again derived by Gaussian fits and subtraction in quadrature of the circularized width. Both reductions give consistent results at intermediate source sizes.
2.5 Double or complex sources
Discussing physics of galaxies on the basis of sizes derived in this way is only meaningful if the size refers to a single galaxy, and not galaxy pairs or interacting systems. This is of course acknowledging that even in this case the size represents an overall scale of the galaxy’s FIR emission, that may encompass significant substructure. The measured size is not meaningful for interacting systems that have a separation of the components of order the PSF width, and down to the scales accessible to the method. The measurement then mostly reflects distance and relative strength of FIR emission of the two galaxies rather than the structure of a galaxy. We address this issue the following way:
-
•
Wide 1′ double systems with well separated galaxies and redshifts available for both were processed separately for both components, and both galaxies are used in the analysis.
-
•
Wide and 0.5′ intermediate doubles where galaxies overlap and/or high pass filtering affects the structure of the respective other component were discarded. These would need mapping and fitting strategies beyond the scope of this work, in order to measure high accuracy FIR sizes. A few intermediate scale doubles were kept if the secondary component was clearly below 1/10 of the primary component’s flux and not affecting the width measurement.
-
•
Sizes were measured for single and close 10″ double sources. However, where inspection of multiwavelength data accessible via NED and the literature (e.g., Bahcall et al., 1997; Scoville et al., 2000; Guyon et al., 2006; Haan et al., 2011; Kim et al., 2013; Petty et al., 2014; Surace et al., 2001; Veilleux et al., 2006, 2009a) indicated that the source is in fact a close double/interacting system, the source was flagged even if a double nature is not evident in the Herschel images. These flagged sources are not used in the analysis below, unless explicitly mentioned.
In summary, size measurements are obtained for single galaxies (including advanced mergers) and for widely separated interacting systems, but disfavour close interacting systems with separation of order the galaxy size, and where both components emit in the FIR. Our size measurements are summarized in Table 5.
3 Results


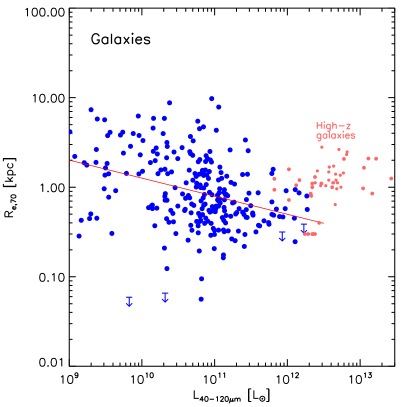
Fig. 2 shows the derived intrinsic half light radii (effective radii) in the 70 m blue band as a function of redshift. The 355 of 399 sources that have a photometric S/N in that band are plotted. The blue line indicates the physical size corresponding to the half width at half maximum of the PSF. In comparison to the data, this suggests that in cases with favourably high S/N the broadening by a source with intrinsic Gaussian FWHM about one fifth of the PSF FWHM is still detectable and leads to a size measurement, i.e. the difference of source and PSF size is at least three times the error. For this sample, almost all z0.1 results are actual measurements and upper limits only become common for the sources at z0.1, all from the QSO sample. Limits in the plot are placed at twice the error plus the larger of the nominal measurement and zero. There is a two order of magnitude spread in the measured intrinsic FIR sizes of the non-QSO targets. Sect. 4.1 discusses scalings with basic quantities that are contributing to this spread.
Signal-to-noise and PSF width lead to the largest fraction of significant size measurements being obtained in the 70 m blue band. It is 81% compared to 80% at 100 m and 71% at 160 m, where the remaining objects include systems with both upper limits and photometric S/N10 in a band, which were not probed for size. We focus our analysis on 70 m because of that, and because in star-forming galaxies 70 m emission is more tightly linked to SFR than longer far-infrared wavelengths. (e.g., Calzetti et al., 2010).

Still, a comparison between sizes for different wavelengths in the same sources is in place. Fig. 3 shows size ratios for the green/blue and red/blue bands, for sources with a significant size measurement in both bands. Many sources show slightly larger sizes at the longer wavelength, but still close to the 70 m size. This is plausible given the typically negative outward dust temperature gradients in galaxies (e.g., Hunt et al., 2015). Sources with a 70 m size measurement but unresolved at the longer wavelengths with their larger PSF will also be consistent with such size ratios near 1. There is however a significant tail to the distribution, up to size ratio /5 in green vs. blue and /10 in red vs. blue. Since many of these objects with large size ratios are well resolved nearby targets, visual inspection of the maps helps to identify the cause. They typically show a warm central source, e.g., a circumnuclear starburst, superposed on a larger disk with star-forming regions and with diffuse emission that is more prominent at 160 m. A single component Gaussian fit may then emphasize the central component at 70 m, and the disk at 160 m. A similar argument as for a circumnuclear starburst applies if there is AGN-heated near-nuclear dust. A clear example for the effect of a central starburst is NGC 1097, where the 70 m fit gives FWHM20″, driven by the well-known prominent r900 pc circumnuclear starburst ring (e.g., Sandstrom et al., 2010), while the 160 m fit returns FWHM 2′ because of the relatively stronger emission from the diffuse disk (see also inset to Fig. 3). This is obviously a consequence of fitting a one component Gaussian in a situation where a two component fit with a wavelength dependent weight would be more appropriate. For consistency with the analysis of the majority of targets that are somewhat broadened compared to the PSF, but not well resolved, and to typical high-z observations, we adopt single component fits in the following discussion. We use 70 m because of the smallest PSF and the closer link of emission at this wavelength to SFR for star-forming galaxies.
Size differences in the PACS bands up to a factor of few warrant a word of caution towards the interpretation of interferometric (sub)mm continuum images of high redshift galaxies. With few exceptions, they are taken at rest wavelengths clearly longer than 160 m, and may often not have the quality for well resolved maps or complex models. The measured sizes may hence overestimate the size of the star-forming region that is of interest for, e.g., studies of the Kennicutt-Schmidt relation. Continuum fluxes on the Rayleigh-Jeans tail of the SED are proportional to dust mass and (linearly) to dust temperature. Such long wavelength interferometric maps hence more directly trace the dust surface density rather than the SFR surface density. If the dust properties and dust-to-gas ratio are well constrained, these long wavelength continuum fluxes are a better probe of the gas surface density than the SF surface density in the Kennicutt-Schmidt relation. Of course, gas-rich high-z systems may have different structure and quantitative size ratios between different rest wavelengths than local galaxies of similar SFR. For example, high-z galaxies with intense star formation throughout the disks (e.g., Förster Schreiber et al., 2009; Nelson et al., 2015) will almost certainly show lower ratios between size at longer wavelengths and size at rest 70 m than the extreme values in a few local LIRGs with a quite passive disk and a bright circumnuclear starburst – these may in fact be a poor analog to high redshift galaxies of similar SFR. Even if sizes likely differ by smaller factors, the caveat is relevant at high redshift as it is locally.
4 Discussion
4.1 Scalings of FIR source size and surface brightness with FIR luminosity, main-sequence offset, and FIR color

The very large 2 dex spread in size of the FIR emitting regions motivates an investigation of possible links with basic galaxy parameters. We start with the 40-120 m luminosity . Fig. 4 left indicates a decrease of size with increasing FIR luminosity. Using mpfitexy.pro (Williams et al., 2010) to fit a log-linear relation (power law) we obtain:
| (1) |
We may also investigate the far-infrared surface brightness , noting that for a Gaussian source the half light radius equals to FWHM/2. Fig. 4 right shows the strong increase of surface brightness with , which is fit by
| (2) |
and
| (3) |
where the second equation for the surface density of SFR (M⊙ yr-1 kpc-2) uses our adopted linear conversion . Uncertainties are hence the same as for . Both and refer to the plane of the sky. We did not attempt to correct for inclination, given that interacting systems can have complex morphologies and/or the inclination is not constrained for the FIR emitting regions. The increase of far-infrared surface brightness and SFR surface density with is clearly super-linear, due to a combination of the trivial increase with luminosity and the decreasing size.
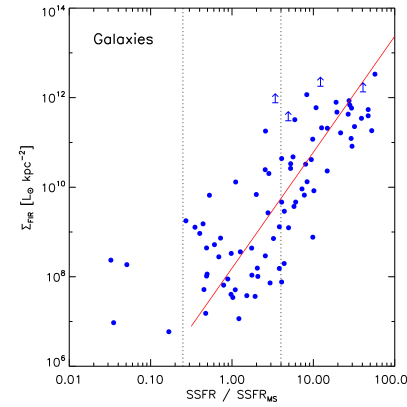
We also investigate the relation of size and surface brightness to the distance of a galaxy from the star-forming main-sequence. Here we adopt as location of the main-sequence in the local universe (Renzini & Peng, 2015) and its equivalent main-sequence specific star formation rate . Stellar masses for part of our sample are available from Kennicutt et al. (2011) and from U et al. (2012). Concerning the U et al. stellar masses we adopt from their Table 10 and exclude objects where their stellar mass combines two galaxies that we separate with Herschel. For our sample selected to contain many (U)LIRGs, 50% of the sources with a stellar mass assigned have , a commonly adopted division between main-sequence galaxies and starbursting outliers above the main-sequence (Rodighiero et al., 2011). Fig. 5 shows the trends for and with distance from the main-sequence. Excluding a few semi-passive KINGFISH objects at we obtain:
| (4) |
| (5) |
| (6) |
Correlations also exist between or and sSFR. This is expected from the trends shown with sSFR/sSFRMS, given that the adopted main-sequence slope is not too far from one in SFR vs , i.e. quite flat in sSFR. The IR selected (U)LIRGs reach up to sSFRyr-1 and 100 M⊙yr-1kpc-2, well above the range of the local universe normal and passive galaxies for which Wuyts et al. (2011) used optical diagnostics to study the relation of sSFR and surface density of star formation. A trend between (total) infrared surface brightness and sSFR for local galaxies was also noted by Elbaz et al. (2011) (their Fig. 16), with some outliers possibly due to the use of mid-IR based sizes. When relating and to stellar mass, the scatter is large and no strong trends are discernible.


Finally, relations exist between far-infrared color and size or surface brightness of the FIR emission. Fig. 6 shows very clear trends of both quantities with the PACS color . In particular the relation with is remarkable, and takes the form:
| (7) |
| (8) |
while the relation of size and color is
| (9) |
A relation between and FIR color, which traces dust temperature, is certainly plausible and expected, but it is quite tight with a scatter of 0.6 dex in around a relation that covers more than five orders of magnitude in that quantity. This is notable because the relation compares a local quantity (the local radiation field intensity determining the dust temperature) with a surface brightness that is determined solely from global quantities of the galaxy ( and FIR size). In contrast, the radiation field intensity to which the FIR emitting grains are exposed is influenced by the small scale distribution of stars and dust in star forming complexes as well as to the density with which sources of radiation are distributed over the total volume of the galaxy. In an extreme toy model, where one simply places more and more independent star-forming regions with identical FIR properties in the same area to drive up and , no such relation would exist.
It is also instructive to express the as function of dust temperature, where we have converted color to temperature by fitting Dale & Helou (2002) SED templates at the source redshift to the color, and using the conversion of Magnelli et al. (2014) to assign dust temperatures to these templates. A similar result is obtained for a simple modified blackbody. The result is shown in the inset to Fig. 6 right and can be fit as
| (10) |
This scaling can be compared to expectations from scalings of other quantities, as found above and as used in the current literature. If we assume (1) a relation of far-infrared surface brightness and main-sequence offset with =2.59 and c1=8.19 (Eq. 5 above), (2) that gas depletion time in yr-1 scales with main-sequence offset as with =-0.49 and c2=9.1 (Genzel et al., 2015, for z=0 and log()=10.5), (3) assume a dust-to-gas ratio 100 (Leroy et al., 2011, for solar metallicity), and (4) that the dust is an optically thin calorimeter with with a dust emissivity index and c3=-15.08 (e.g., Magnelli et al., 2014; Genzel et al., 2015), then we expect
| (11) |
which for the relevant temperature range is in reasonable agreement with what was found in Eq. 10, given the uncertainties of the various parameters, and the simplifications in the assumptions made. That means, the above set of scalings and assumptions remains consistent when bringing in size information.
Given the data and scatter, we did not attempt to fit more complex functional forms than the simple power law (log-linear) relations quoted above and summarized in Table 6. One result from comparing and (Fig. 4 left) is however worth mentioning. All ULIRGs are found at similar and relatively small 0.5 kpc half light radii, but for less luminous objects the variation is a substantial 2 dex, ranging from the typical 1 kpc up to 10 kpc and down to a few extremely compact 100 pc circumnuclear sources. Very small sizes for a ULIRG far-infrared emitting region are excluded by optical depth arguments (Sect. 4.2), but the absence of large 5 kpc FIR sources in ULIRGs reflects a true absence of such extended ULIRGs. Similar findings are made in the mid-IR continuum (Soifer et al., 2000; Díaz-Santos et al., 2011) and radio (Condon et al., 1991). The far-infrared data reinforce this with a closer link to the SFR and much reduced risk of a result that is biased by a compact AGN-heated source. A L⊙ LIRG can correspond to a 10 kpc scale large disk, a smaller few kpc region in a (perhaps interacting) galaxy, or even a compact 100 pc circumnuclear burst. In contrast, the 0.5 kpc radii consistently found for ULIRGs are in line with the notion that for the modest gas content of galaxies in the local universe, the corresponding huge SFRs can only be reached by compressing gas and triggering a burst of star formation, in an interaction or merging event.
The structural properties of local galaxies are an important comparison to the structure of evolving galaxies at high redshift. ALMA starts observing samples of high-z galaxies at longer submm wavelengths, for which the Herschel data are the key comparison despite their somewhat shorter rest wavelengths. Fig. 4 left includes some first ALMA sizes of submm galaxies, as measured by Ikarashi et al. (2015) and Simpson et al. (2015) at rest wavelengths about 150 to 400 m. This comparison is preliminary since their sources lack individual spectroscopic redshifts and determinations of the SED peak, which makes the adopted individual values uncertain for the quite diverse SMG population (Magnelli et al., 2012). We adopted the infrared luminosities of Ikarashi et al. (2015) and estimated them for the Simpson et al. (2015) sources using the average scaling of Magnelli et al. (2012) at the typical Simpson et al. submm flux. Specifically, we adopt which also includes as recommended by Magnelli et al. (2012) for such SMG luminosities. We also include a number of individual SMG continuum size measurements from the literature (Younger et al., 2008, 2010; Riechers et al., 2013, 2014; Neri et al., 2014), in some cases updating the original luminosity estimates with Herschel results (Magnelli et al., 2012; Smolčić et al., 2015). We have also included the sample of Harrison et al. (2016) which consists of five modest luminosity X-ray AGN and another galaxy. We group them with galaxies since at /10, their AGN are energetically much less prominent than in the local QSOs studied in Sect. 4.4. This first comparison suggests that on average these SMGs, likely at z2 and in some cases reaching up to z6, have roughly twice the size of local galaxies of similar infrared luminosity. This is consistent with the notion that massive gas rich high redshift galaxies can reach SFRs in excess of 100 M⊙ yr-1 in large disks (e.g., Förster Schreiber et al., 2009; Nelson et al., 2015). Because of their increased gas fractions (e.g., Daddi et al., 2010; Tacconi et al., 2010, 2013; Saintonge et al., 2013; Carilli & Walter, 2013), they can reach high SFRs without the strong gas compression that is needed to create a local ULIRG. To fully understand the role of true structural differences, and the possible dependence of size on wavelength, it will be necessary to compare the local results to (sub)mm studies of high-z samples with individual redshifts and reliable derivations of and/or SFR, and to rest frame optical structure (e.g., van der Wel et al., 2014). Submm selection with its biases on, e.g., dust temperature will have to be supplemented by SFR selected and stellar mass selected samples covering a wider range of properties than the high-z systems in Fig. 4.
4.2 Optical depth of FIR emission
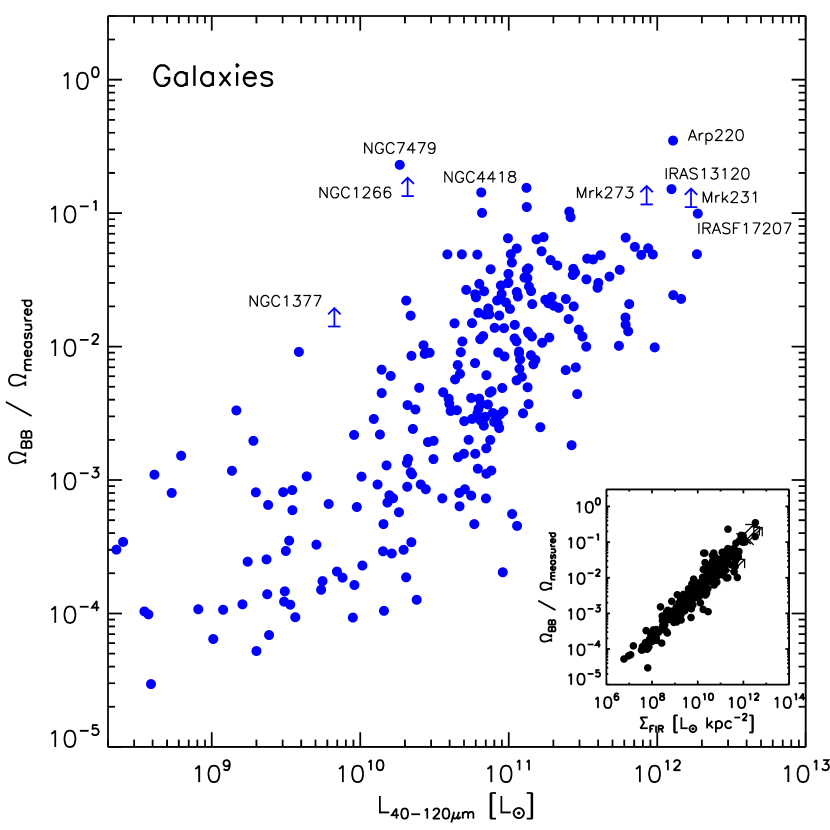
Total gas columns derived from interferometric CO or dust continuum observations (e.g., Sakamoto et al., 1999), fits to the IR to submm SED (e.g., Klaas et al., 2001), and modelling of OH absorptions (e.g., González-Alfonso et al., 2015) have been used to argue that the dust emission in ULIRGs may be optically thick out to far-infrared wavelengths. Sizes and fluxes from Herschel-PACS can provide an independent approach to this question. Fig. 7 shows the ratio of the solid angle of a blackbody emitting half of the PACS flux at the temperature determined by the PACS photometry, and the measured half light solid angle at 70 m . is derived from the Planck function for an optically thick blackbody reproducing both the 70 and 160 m (half) flux, and the measured solid angle is given by . This ratio will be low for optically thin emission or if small regions of higher optical depth are scattered over a larger area, but will approach unity for optically thick emission. In a strict sense this is a lower limit, since emitting regions distributed in a way that is significantly different from the adopted Gaussian enlarge the measured solid angle for the same physical optical depth to the emission. It also compares the measured size to a case that is optically thick over the full PACS wavelength range, and is hence a lower limit if the emission transits from optically thick to thin between 70 and 160 m.
Several well known ULIRGs (Arp 220 which shows the largest value in Fig. 7, Mrk 231, Mrk 273, IRAS F17207-0014, IRAS 13120-5453, see also Table 5) show lower limits or measurements of 0.1, consistent with being optically thick in their central regions. The same applies to some of the extremely compact circumnuclear regions in galaxies with more modest (e.g., NGC 4418, IC 860, NGC 1266, among others). In contrast, the majority of LIRGs and galaxies with lower is optically thin on average.
The case of Arp 220 may however also illustrate the complexities of declaring a galaxy ‘optically thick in the far-infrared’. At 0.35, Arp 220 is the most optically thick system with a size measurement (rather than limit) in our sample, with a measured circularized of 246 pc (physical) or 0.67″ (on sky). This is larger than the best evidence for the size of the central star formation around the two nuclei: flickering supernovae have been mapped in a series of VLBI papers (Parra et al., 2007, and references therein), and a similar area is suggested from free-free radio continuum by Barcos-Muñoz et al. (2015), who give half light radii of 51 and 35 pc around the two nuclei. A putative AGN would inject energy again at very small scale. Both , which may still be inflated by the presence of two semi-separated nuclei but a single Gaussian fit, and are larger than what is suggested from the free-free continuum, indicating the need for radiative transfer in the FIR from the energy sources to the emitting surface. On the other hand, even shorter near-infrared wavelengths that would be absorbed already by much lower dust columns provide a view of part of the stars around the two nuclei (e.g., Scoville et al., 2000), indicating a complex and patchy dust distribution. A yet more extreme example is Mrk 231 with optical visibility towards its central type-1 AGN despite 0.11. These indicate a much more complex geometry with some rather transparent lines of sight, that are not expected in a spherically symmetric dust distribution around a heating source.
4.2.1 A sample of compact far-infrared sources
| Name | Morph | RA | DEC | z | log() | log() | ||
|---|---|---|---|---|---|---|---|---|
| J2000 | J2000 | L⊙ | kpc | L⊙kpc-2 | ||||
| (1) | (2) | (3) | (4) | (5) | (6) | (7) | (8) | (9) |
| III Zw 035 | D | 26.1280 | 17.1021 | 0.0274 | 11.47 | 0.272 | 11.81 | 0.05 |
| NGC 1266 | 49.0036 | -2.4273 | 0.0072 | 10.32 | 0.066 | 11.89 | 0.13 | |
| IRAS F05189-2524 | 80.2558 | -25.3622 | 0.0426 | 11.75 | 0.386 | 11.78 | 0.04 | |
| NGC 2623 | 129.6000 | 25.7550 | 0.0185 | 11.41 | 0.218 | 11.93 | 0.10 | |
| IRAS F09111-1007W | D | 138.4016 | -10.3245 | 0.0550 | 11.75 | 0.456 | 11.64 | 0.10 |
| IRAS F10173+0828 | 155.0011 | 8.2260 | 0.0491 | 11.57 | 0.317 | 11.77 | 0.04 | |
| IRAS F12224-0624 | 186.2663 | -6.6811 | 0.0264 | 11.12 | 0.175 | 11.83 | 0.11 | |
| NGC 4418 | 186.7277 | -0.8776 | 0.0073 | 10.81 | 0.056 | 12.52 | 0.14 | |
| Mkn 231 | 194.0590 | 56.8738 | 0.0422 | 12.23 | 0.386 | 12.26 | 0.11 | |
| IC 0860 | 198.7647 | 24.6188 | 0.0112 | 10.82 | 0.095 | 12.07 | 0.10 | |
| IRAS 13120-5453 | 198.7765 | -55.1568 | 0.0308 | 12.10 | 0.451 | 11.99 | 0.15 | |
| ESO 173-G015 | 201.8483 | -57.4898 | 0.0097 | 11.42 | 0.297 | 11.67 | 0.09 | |
| Mkn 273 | 206.1758 | 55.8875 | 0.0378 | 11.93 | 0.317 | 12.13 | 0.12 | |
| IRAS F14378-3651 | 220.2455 | -37.0754 | 0.0676 | 11.94 | 0.465 | 11.81 | 0.05 | |
| CGCG 049-057 | 228.3046 | 7.2257 | 0.0130 | 11.12 | 0.163 | 11.90 | 0.15 | |
| Arp 220 | 233.7381 | 23.5038 | 0.0181 | 12.11 | 0.246 | 12.53 | 0.35 | |
| IRAS F17207-0014 | 260.8416 | -0.2838 | 0.0428 | 12.27 | 0.564 | 11.97 | 0.10 | |
| NGC 7479 | 346.2359 | 12.3229 | 0.0079 | 10.27 | 0.118 | 11.32 | 0.23 |
Our data provide an opportunity to pick from a large sample of galaxies an objective selection of the most compact far-infrared sources. We do so by requiring either a large FIR surface brightness L⊙kpc-2 or a large value of the optical depth indicator . The two criteria are linked (inset to Fig. 7) and create overlapping samples, because dust temperatures only span a limited range. Table 5 summarizes the resulting sample. Unlike most of our analysis, we include here close galaxy pairs (marked ‘D’ in the second column of Table 5). If any, the emission from the offset second component in such a double would lower the measured and optical depth. Presence of such a double in our sample of compact sources hence implies that in the FIR they are dominated by one compact component.
While selected homogeneously and solely on the basis of FIR images, this sample includes objects known to be peculiar and interesting in several ways. Arp 220, IC 860, NGC 4418, for example have long been known to be ‘[Cii]-deficient’ in comparison to their far-infrared luminosity (e.g., Malhotra et al., 2001; Luhman et al., 2003). Massive outflows of molecular gas have been detected in Mrk 231, Mrk 273, NGC 1266, IRAS F05189-2524, IRAS 13120-5453, IRAS F14378-3651, IRAS F17207-0014 (Fischer et al., 2010; Sturm et al., 2011; Veilleux et al., 2013; González-Alfonso et al., 2014; Cicone et al., 2014, and references therein). of the sources in Table 5 corresponds to 100 M⊙yr-1kpc-2 if due to star formation. This is well above suggestions for the threshold for launching powerful winds from local or high-z galaxy disks (Heckman, 2002; Newman et al., 2012). On the other hand, AGN may play an important role in launching the most massive winds (Sturm et al., 2011; Veilleux et al., 2013) and are present in several sources in Table 5. To which extent the conditions in and the phenomena related to these compact regions relate to extreme density star-forming regions or embedded AGN is difficult to discern at many wavelengths, given the large average optical depth even in the FIR. Unless there are favourable unobscured lines of sight, the optical and near infrared emission will be limited to a surface layer.
Another well known galaxy with a compact FIR source is NGC 1377, which has been argued to host a nascent starburst (Roussel et al., 2006). We find a very small 60 pc far-infrared emitting region (Fig. 2), but its modest log()=9.7 and warm dust keep the lower limits to and optical depth below the thresholds used to select Table 5, despite the small size.
4.3 The [Cii] deficit is closely linked to FIR surface brightness
The [Cii]158 m line typically is the major coolant of neutral interstellar gas. It is detectable with current instrumentation to redshifts above 6 and has been proposed as an SFR tracer (e.g., Stacey et al., 1991; De Looze et al., 2011; Herrera-Camus et al., 2015). Several known effects add uncertainty to the use of [Cii] for that purpose. First, low metallicity galaxies can show enhanced [Cii] from regions where [Cii] coexists with self-shielded H2 while the smaller amount of dust implies that carbon is in the form of CO only in a smaller region (e.g., Madden et al., 1997). We do not address this effect further in this work. [Cii] can also be bright in the atomic and ionized interstellar media of the outer parts of galaxies (Madden et al., 1993), with a less tight link to ongoing star formation than for PDRs around regions of active star formation. Finally, progressing from normal galaxies to LIRGs and ULIRGs a reduced ratio [Cii]/FIR for luminous objects has been reported – the ‘[Cii] deficit’ (e.g., Malhotra et al., 1997, 2001; Luhman et al., 1998, 2003; Fischer et al., 2014). The deficit can also be linked to offset from the main-sequence (Graciá-Carpio et al., 2011; Díaz-Santos et al., 2013), a view that reconciles the [Cii] properties of high and low redshift galaxies that differ if compared at same IR luminosities. Physical explanations for the deficit discussed in these references include (i) a reduced photoelectric heating efficiency at high ratios of UV radiation field and gas density, (ii) related to this, dust competing for photons in high ionization parameter ‘dust-bounded’ Hii regions, (iii) AGN contributions to the FIR continuum, and (iv) self-absorbed [Cii] emission.
We have supplemented our galaxy sample with [Cii] fluxes from the literature. Most are based on the measurements of Díaz-Santos et al. (2013). We have scaled their [Cii] fluxes which are based on the central spaxel of the PACS integral field spectrometer by the ratio of our total 160 m flux density and their 157 m continuum flux density, dropping objects with correction factor above 10 or 160 m size above 40″, where this correction is too uncertain. We also use [Cii] fluxes from Brauher et al. (2008), excluding galaxies that were flagged as extended in that paper, and those with a measured 160 m size above the ISO-LWS beam size of 80″. Finally, a few objects are added from Sargsyan et al. (2012) and Farrah et al. (2013).
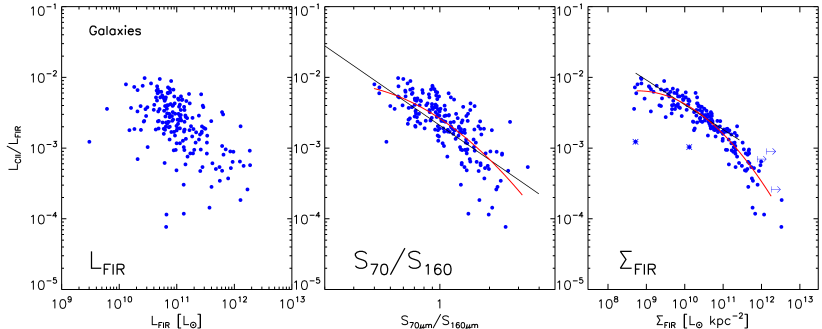
Fig. 8 shows the ratio of [Cii] and FIR emission as a function of three different quantities. The left panel shows for our sample the classical ‘deficit’ at high FIR luminosities. The scatter is large, however, and some of the most extreme deficits arise at intermediate FIR luminosities, as found previously (e.g., Malhotra et al., 1997, 2001). The middle panel shows a somewhat improved trend as a function of far-infrared color, again confirming the earlier work referenced above. Our data can be fitted by
| (12) |
with the fit applicable to the range . The dispersion around this fit is 0.27 dex, virtually identical to the 0.275 dex that we obtain for our sample around the relation (for a color ) in Eq. 1 of Díaz-Santos et al. (2013), or the 0.28 dex that these authors quote for their sample which has significant overlap with ours, but studies lines and continuum from the central spaxel of the PACS integral field spectrometer.
An extremely tight relation is observed between the ratio of [Cii] and FIR emission and FIR surface brightness (right panel). The red line shows a simple quadratic fit to the measurements and limits, where we have not used for the fit the two slightly outlying sources NGC 5866 and MCG-03-34-064 (marked with asterisk extensions to the symbols in the right panel of Fig 8). We cannot determine with the data used here whether these are true outliers, or whether they are affected by technical issues, e.g., an unusually extended [Cii] flux distribution. The relation shown in the right panel of Fig. 8 is
| (13) |
The dispersion around this relation, covering 3.5 dex in surface brightness and 2 dex in the ratio of [Cii] and FIR, is 0.16 dex for the full sample and 0.15 dex if excluding the two outliers. Díaz-Santos et al. (2013, 2014) used sizes measured in the mid-infrared to derive a log-linear relation of deficit and IR surface brightness (Eq. 4 of Díaz-Santos et al., 2013) which we also overplot to Fig 8 right, corrected for an adopted 1.9. This relation was derived for a clearly star formation dominated (U)LIRG subsample, thus minimizing a potential distortion of mid-IR based sizes by AGN emission. Because of the more uncertain size measures and more size limits, this relation covers a smaller range L⊙kpc-2. Over this restricted range, the two relations agree well, and have small dispersions: 0.15 dex quoted by Díaz-Santos et al. (2013), 0.14 dex for our data (minus the two outliers) around their relation, and 0.12 dex for our data and our relation. Over the wider range in surface brightness that is accessible via the Herschel size measurements, Fig 8 shows the 2nd order fit to be more appropriate than the log-linear relation. This is also reflected in the dispersions which are 0.19 dex around the log-linear relation vs 0.15 dex around the fit of Eq. 13.
Existence of such a relation is clearly expected from earlier work on the [Cii] deficit in combination with the scalings presented in this paper. From resolved observations of nearby galaxies, Herrera-Camus et al. (2015) report a scaling for a regime of low star formation surface density M⊙yr-1. This suggests a relatively flat continuation towards lower surface FIR brightness of the relation shown in the right panel of Fig. 8, for a range that is not covered by the combination of our sample with the specific [Cii] literature data.
The noteworthy aspect of this relation is its remarkable tightness. Given that our far-infrared surface brightness is a galaxy average, one might have expected a tighter correlation of the deficit with FIR color, which is representing the local physical conditions in and around star-forming complexes, but this is not the case (Fig. 8). A large number of studies have argued that even in the ULIRGs of our sample, the total infrared (and even more the far-infrared) luminosity is typically not dominated by an AGN, even where present (e.g., Genzel et al., 1998; Lutz et al., 1998; Veilleux et al., 2009b). can then be directly linked to , and is not strongly affected by the AGN. The tightness of the link between [Cii] deficit and then makes a dominant role of scenario (iii) above – simple dilution by AGN-heated FIR emission – unlikely. This is in line with the conclusion from comparisons to various AGN indicators (Díaz-Santos et al., 2013).
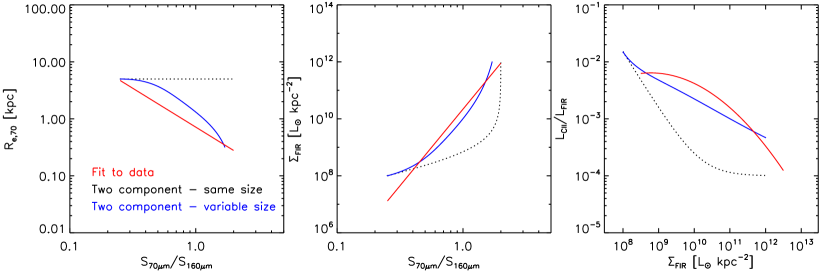
We are thus directed at explanations that are related to the physical conditions in star-forming regions as well as the diffuse ISM. A simple test that could represent the varying conditions is to construct a two component mixed model with (1) strong [Cii] and cold dust, representative of a more diffuse galaxy disk, and (2) dense star formation with weak [Cii] and warm dust, to fit the observed trends. Such simple scenarios have often been invoked, starting from the ‘cirrus plus star formation’ interpretation of IRAS color-color diagrams. For a toy model, we assign to the cold component S70/S160=0.25, [Cii]/FIR=0.015, =108 L⊙kpc-2 and a Gaussian with size =5 kpc. For the dense SF component, we adopt S70/S160=2 and [Cii]/FIR=0.0001. These values are picked on the basis of Fig. 6 and Fig. 8 as well as the [Cii] literature. We then vary the surface brightness of the dense SF component from zero to a maximum of =1012 L⊙kpc-2. A first toy model is to simply add the dense SF component over the entire disk, as if more and more additional small but intense star-forming regions were spread over the disk. This is a very poor representation of the data (black dotted lines in Fig. 9). Not only are size trends not captured by definition, but the fits to the trend of color and [Cii]/FIR with surface brightness are very poor, because the dense SF component quickly dominates as its surface brightness increases. In a second model we assume that the ‘few dense SF regions scattered over the entire disk’ scenario only applies for low surface brightness of that component, but that high surface brightness of the dense SF can only be reached if the limited gas content of local galaxies is compressed into a small region. We implement this by keeping the disk component fixed as a Gaussian with =5 kpc, and add to it a second Gaussian for the dense SF component with size scaling as with in kpc and in L⊙kpc-2. This parametrization gives the dense SF the same size as the cold disk as long as its surface brightness is low, but shrinks it at high surface brightness, as motivated above. The value -0.3 for the power law slope is based on a manual adjustment, aiming at a reasonable fit to the Fig. 9 trends. Size and surface brightness are then derived by single Gaussian fitting this mix, as for the real data. This second toy model gives a more reasonable approximation of the observed trends (blue lines in Fig 9). Given its simplicity, we refrain from further modifying the assumptions towards a better fit.
The relative success of the toy model that scales the size of the dense SF component should not be overinterpreted. It uses simplified observational facts and no ISM physics. But it provides some confidence that a coherent interpretation of the trends discussed in this paper should be possible via models implementing more realistic distributions of ISM and star formation, as well as the physics of the dusty and gaseous phases of the Hii regions, PDRs, and diffuse ISM. Likely, such models will invoke more smooth trends of properties than derived from coadding two extremes in the toy model, and a [Cii]/FIR that only decreases at somewhat higher surface brightness. The goal would be to use physical models to quantitatively relate the trends of color and [Cii]/FIR to the increase in typical radiation field intensity at higher FIR surface brightness and smaller size, while using plausible assumptions on ISM structure.

| Scaling | Section |
| Scalings with : | |
| 4.1 | |
| 4.1 | |
| 4.1 | |
| Scalings with main-sequence offset: | |
| 4.1 | |
| 4.1 | |
| 4.1 | |
| Scalings with far-infrared color and dust temperature: | |
| 4.1 | |
| 4.1 | |
| 4.1 | |
| 4.1 | |
| Scalings of [Cii]/ with far-infrared color and far-infrared | |
| surface brightness: | |
| 4.3 | |
| 4.3 | |
4.4 A similar size of the FIR emission in QSO hosts and galaxies
Because of the favourable contrast between the SED of an AGN and the SED of a star-forming galaxy (e.g., Netzer et al., 2007), rest frame far-infrared emission has been widely used as a star formation tracer in AGN hosts, in particular in the context of Herschel surveys (Lutz, 2014) up to z2 (e.g., Rosario et al., 2012). While it is often safe to simply ascribe this FIR emission to star formation, this is no longer the case for powerful AGN in hosts with low SFR. Both Herschel color arguments (Hatziminaoglou et al., 2010; Rosario et al., 2012) and attempts to construct local ‘intrinsic’ AGN SEDs reaching out to the FIR (Netzer et al., 2007; Mullaney et al., 2011; Mor & Netzer, 2012) have been used to delineate the border between these two regimes. Comparing the size of the FIR emission in QSO hosts with that in other galaxies can provide another constraint to this problem, in addition to information on the host and/or AGN proper.
Fig. 10 left shows results for 59 QSOs (32 size measurements and 27 size limits). The QSOs are on average much more distant than the galaxies discussed before, leading to a less favourable ratio of detections to limits. Also, our approach of attempting size measurements only for photometric S/N10 has already shrunk the sample from 93 QSOs observed by Herschel to these 59, which will miss some of the FIR-weak and distant objects. Most measurements span a range kpc with a median of 1.7 kpc (1.1 kpc for the z0.1 subset discussed below). Limits are consistent with this range. Exceptionally, we plot here also (marked in pink) five QSOs where NED and literature give a warning of a close double nature that could inflate the size if both components emit in the FIR. Only in PG1543+489 does the Herschel image provide direct evidence for that, but we discard all five from further analysis.
In Fig. 10 left, there appears to be a lack of distant but small QSOs and of local but large QSOs. The first category, to the extent it may be present in the sample, would simply be assigned upper size limits that increase with redshift. The absence of large kpc local hosts is more noteworthy and related to the known heterogeneity of the QSO host population, on which optical/near-infrared studies provide some insights. The hosts of z0.06 low luminosity QSOs show a mix of disks, ellipticals, and merger remnants, with typical near-infrared kpc and none with kpc (Busch et al., 2014). In contrast, the hosts of the luminous z0.2 QSOs studied by Dunlop et al. (2003) are typically kpc giant ellipticals. The PG sample, approximately UV/optical flux limited and covering a range of redshifts, bridges these two regimes – it includes a few large hosts, but only in the large volume accessible at z0.1 (Veilleux et al., 2009a; Dunlop et al., 2003). On the other hand, many PG QSOs may be on an evolutionary path from IR luminous mergers to moderate size ‘disky’ ellipticals (e.g., Dasyra et al., 2007). Already in the optical/NIR tracers of the stellar population, the z0.1 region lacks the rare kpc QSOs, in plausible agreement with the lack of large FIR sizes in our sample, and the ratios of FIR to NIR size 1 that we report below.
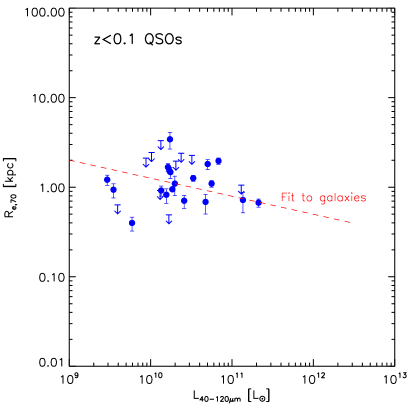
To better compare with other galaxies, we restrict the QSO sample to the 33 z0.1 objects. Of those, only 4 were not fit because of S/N¡10, and the number of size measurements among the remaining 29 is high: 19 vs. 10 upper limits. Compared to the full PG sample, this redshift limit and the photometric S/N cut prefer moderate AGN luminosities and exclude the IR faintest objects, specifically the median log() is 44.8 and the median log() is 10.2. Fig. 10 right shows their vs. , and overplotted the fit relation derived above for galaxies (Eq. 1). Clearly, the sizes for the QSOs are fully consistent with those of other local galaxies of the same infrared luminosity. This is consistent with their FIR emission being due to star formation in the host, giving support to the use of FIR emission as a SFR indicator in this regime of /0.1. For QSOs with a lower ratio of far-infrared and bolometric luminosity that are not sampled by our size measurements, AGN heated and/or ‘cirrus’ dust may be relatively more important, and a similar size consistency should not be taken for granted.
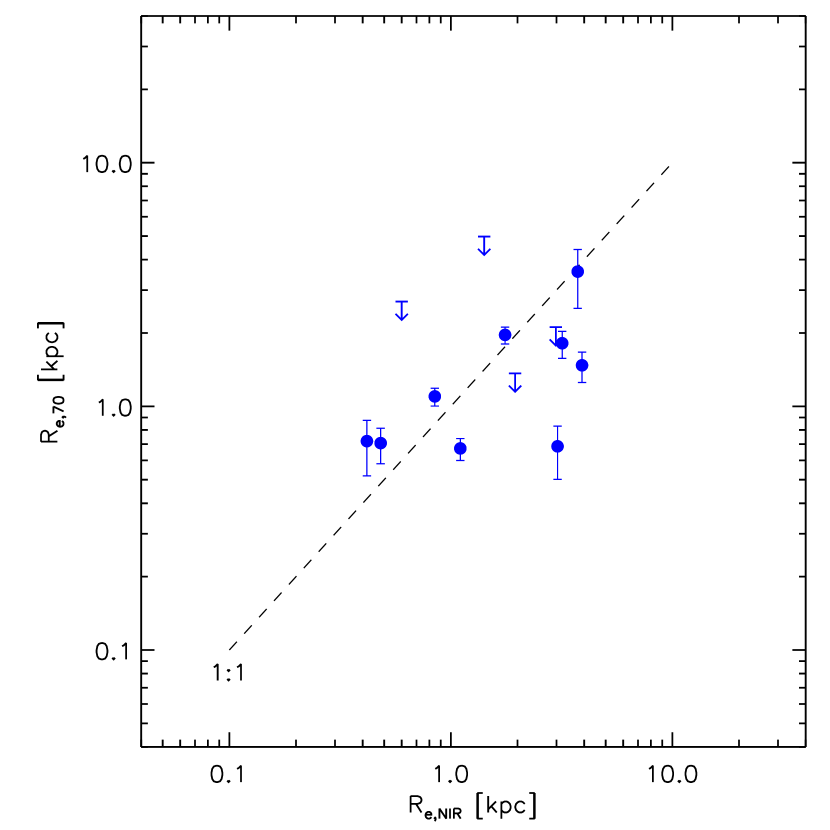

We may also compare the size of the far-infrared emission with the size of the stellar host as seen in the near-infrared. Veilleux et al. (2009a) present half light radii of the near-infrared emission for a sample of PG QSOs, as observed with HST-NICMOS, and after subtracting the AGN point source. Fig. 11 compares NIR and FIR half light radii for 13 QSOs in that sample with Herschel size measurement (9/4 measurements/limits). The comparison suggests FIR size similar to or in some cases smaller than the stellar component, again consistent with FIR emission originating in the host, and star formation taking place on a spatial scale similar to the pre-existing stellar population.
Finally, we can compare the measured to the radius at which the AGN can heat dust to the measured temperature. At the smaller kpc scales of the circumnuclear obscuring structure discussed in the context of AGN unification, dust will be warm and the emission mostly in the mid-infrared. This is what is empirically found to dominate AGN-heated dust SEDs (e.g., Netzer et al., 2007). But strong far-infrared emission could emerge if a substantial amount of dust is exposed to the AGN radiation only at large distances, without the dominant UV component being intercepted by a modest amount of dust further in. This could occur for example in a strongly warped disk (Sanders et al., 1989). Fig. 12 compares the measured sizes to the radius at which the AGN heats optically thin dust to the measured dust temperature. Here we have adopted AGN bolometric luminosities based on the 5100 Å continuum of the PG QSOs and the bolometric correction of Eq. 7.3 in Netzer (2013). For the dust properties in Eq. 5.85 of Netzer (2013) the expected radius in kpc is . Here, is the bolometric luminosity of the AGN in units of 1046erg s-1 and is derived by fitting a modified blackbody to the PACS photometry, adopting an emissivity index for consistency with the dust properties adopted by Netzer (2013). Fig. 12 shows that the radii estimated this way are typically a factor 5 larger than the measured , and also uncomfortably large compared to typical NIR host sizes as seen in Fig. 11. Dust at large radii that is directly heated by AGN light that has not been absorbed further in seems hence an unsatisfactory explanation for the measured FIR sizes. It is beyond the scope of this work to study to which extent detailed radiative transfer of the incident direct AGN UV and/or infrared reemission can avoid this problem with FIR sizes, without violating SED constraints. At this point, the analogy of QSO hosts to galaxies (Fig. 10) seems the more natural explanation. The FIR emitting dust will here be heated mostly host star formation on scales similar to other galaxies, and in regions where the radiation field is not dominated by the AGN, for example outside the ionisation cone. In this scenario, the direct AGN radiation would be intercepted already at smaller radii by the obscuring material invoked by unified AGN models, and re-emitted mostly in the mid-IR.
Among the PG QSOs with largest in Fig. 10 left, several are marked as double. This implies that the size measurement might be inflated by a companion. For PG1543+489 we see direct evidence in the form of a weak southern extension in the 70 m image, consistent with a companion that is present in archival NICMOS images. No literature evidence for a strong companion exists for the largest QSO source, PG2251+1113 with 9.4kpc, similar to the largest non-QSO galaxies in our sample. This is a quite powerful QSO (erg s-1) which has made studies of the stellar component in the near-infrared difficult. The fits of Guyon et al. (2006) and Veilleux et al. (2009a) suggest kpc. Due to the difficulty of subtracting the point source they are considered unreliable, but provide some support to the very large FIR size.
Mushotzky et al. (2014) present initial results from a Herschel study, including PACS far-infrared size information, for the BAT AGN sample that is selected in ultra-hard X-rays. The BAT sample covers AGN luminosities and redshifts typically lower than the PG QSOs, but reaches up to the level of the PG QSOs. Measured far-infrared sizes span a wide range, with about a third of size limits 1 kpc but also some fairly extended objects with IR surface brightness lower than KINGFISH galaxies. For resolved sources, 160 m sizes tend to exceed the 70 m sizes. This is in broad agreement with our findings for galaxies and QSOs. A systematic comparison of this sample covering a wide range of AGN luminosities to -matched non-AGN galaxies will be worthwhile to extend the limited range covered by PG QSOs (Fig. 10).
In summary, the FIR size of the PG QSOs for which we could attempt measurements seems to resemble that of galaxies of same FIR luminosity, consistent with being dominated by star formation in the host. It is important to recall that this statement refers to a subset of modest luminosity PG QSOs: log()44.8 and /0.1. It should not be blindly transferred to systems with smaller /.
5 Conclusions
We have used Herschel 70, 100, and 160 m images to study the size of the far-infrared emission in a sample of 399 local galaxies and QSOs. We rely on the stable point spread function and subtraction in quadrature to infer half light radii of the sources, reaching well below the PSF half width for sources with good S/N. We find that:
-
•
Galaxies with 1011L⊙ can be found with very different distributions of infrared emission (hence star formation). These range from large R10 kpc disks down to compact 100 pc circumnuclear bursts. In contrast, L⊙ ULIRGs are only found with compact R kpc morphologies, likely due to the need to compress the limited gas content to temporarily achieve the large IR luminosities. On average, but with large scatter, far infrared half light radius scales with -0.2 and far-infrared surface brightness (SF surface density) with 1.4. First ALMA measurements suggest a larger size of high-z sources at equivalent , albeit at slightly longer rest wavelengths.
-
•
Half light radius and FIR surface density also show clear trends when moving from the main-sequence of star formation to higher sSFR, with logarithmic slopes of -0.4 and 2.6, respectively.
-
•
There is a fairly tight relation of both half light radius and FIR surface brightness with FIR color (dust temperature). There is consistency when comparing the scalings of FIR surface brightness with dust temperature with expectations from the scaling of with main-sequence offset, combined with the Genzel et al. (2015) scaling of gas depletion time with main-sequence offset and the assumption that dust is an optically thin calorimeter.
-
•
The average optical depth over the size of the far-infrared emitting region is large in some LIRGs and ULIRGs.
-
•
The ratio of [Cii] 158 m and FIR emission and the ‘[Cii] deficit’ is more tightly linked to FIR surface brightness than to FIR luminosity or FIR color. For our sample, the dispersion is about 0.15 dex for a relation covering 3.5 dex in surface brightness.
-
•
The size of the far-infrared emission in z¡0.1 PG QSOs with /0.1 is consistent with that of galaxies with same FIR luminosity. This is consistent with host star formation creating their far-infrared emission.
Acknowledgements.
We thank the anonymous referee for a careful review and helpful comments. This work would not have been possible without the efforts at the PACS ICC and Herschel science center that pushed the accuracy of Herschel pointing reconstruction beyond its limits. In particular, we would like to thank Hervé Aussel, Helmut Feuchtgruber, Craig Stephenson, and Bart Vandenbussche. HN acknowledges support by ISF grant no. 284/13. PACS has been developed by a consortium of institutes led by MPE (Germany) and including UVIE (Austria); KUL, CSL, IMEC (Belgium); CEA, OAMP (France); MPIA (Germany); IFSI, OAP/OAT, OAA/CAISMI, LENS, SISSA (Italy); IAC (Spain). This development has been supported by the funding agencies BMVIT (Austria), ESA-PRODEX (Belgium), CEA/CNES (France), DLR (Germany), ASI (Italy), and CICYT/MCYT (Spain).longtablelrrccrrrrrrrrr Far-infrared size and surface brightness of galaxies and QSOs NameRADECClMoScale log() J2000J2000kpc/″ kpc kpc kpc L⊙kpc-2 (1)(2)(3)(4)(5)(6) (7) (8) (9) (10) \endfirstheadNameRADECClMoScale log() J2000J2000kpc/″ kpc kpc kpc L⊙kpc-2 (1)(2)(3)(4)(5)(6) (7) (8) (9) (10) \endhead\endfoot
UGC 12914 0.4110 23.4825 G 0.297 5.8760.032 5.9890.018 6.3480.020 7.820.00 UGC 12915 0.4256 23.4956 G 0.295 2.0860.003 2.2000.003 2.2780.014 9.060.00 PG 0003+158 1.4968 16.1634 Q 5.766 PG 0003+199 1.5805 20.2027 Q 0.519 0.3990.075 0.6930.105 1.5560.314 9.770.12 NGC 23 2.4716 25.9237 G 0.310 1.0040.003 1.1250.006 1.5670.023 9.940.00 PG 0007+106 2.6286 10.9747 Q 1.668 1.8150.242 2.1950.356 4.2350.808 9.390.09 NGC 34 2.7780 -12.1076 G 0.398 0.2530.017 0.3640.024 0.5050.122 11.680.05 Arp 256N 4.7081 -10.3604 G 0.549 3.1590.016 3.6860.016 5.0830.037 8.550.00 Arp 256S 4.7122 -10.3771 G 0.544 0.8760.010 1.1360.016 1.5170.074 10.440.01 PG 0026+129 7.3058 13.2676 Q 2.497 Haro 11 9.2189 -33.5547 G 0.417 0.6280.010 0.7150.022 0.8860.106 10.460.01 NGC 232 10.6913 -23.5616 G 0.457 0.6680.009 0.7640.016 0.8800.087 10.800.01 PG 0043+039 11.4462 4.1718 Q D 5.249 PG 0049+171 12.9780 17.4326 Q 1.231 UGC 545 13.3945 12.6929 Q 1.139 0.6720.073 1.2150.079 2.7210.213 10.870.08 MCG +12-02-001 13.5173 73.0848 G D 0.320 0.6900.004 0.7990.007 1.2130.030 10.760.01 PG 0052+251 13.7176 25.4275 Q 2.679 ¡ 4.843 4.7310.880 6.7592.041 ¿ 8.69 NGC 317B 14.4188 43.7923 G 0.368 0.3300.012 0.4410.017 0.6100.083 11.160.03 NGC 337 14.9598 -7.5787 G 0.094 2.4050.005 2.5600.004 2.7510.004 8.190.00 Arp 236 16.9477 -17.5070 G D 0.407 1.0570.005 1.6860.007 2.2010.029 10.610.00 MCG -03-04-014 17.5362 -16.8528 G 0.699 1.3970.011 1.4590.020 1.5510.117 10.360.01 ESO 244-G012 19.5334 -44.4616 G D 0.462 0.4500.014 0.5810.022 0.9860.082 11.030.02 CGCG 436-030 20.0116 14.3617 G 0.624 0.6220.018 0.8150.028 1.1020.136 11.110.02 Arp 157 21.1449 3.7915 G 0.157 0.3090.002 0.3480.004 0.4220.020 10.990.01 ESO 353-G020 23.7124 -36.1370 G 0.324 0.6480.005 0.6770.009 0.7080.054 10.450.01 ESO 297-G011 24.0978 -37.3218 G 0.352 0.7610.006 1.0720.008 1.7470.028 10.100.01 ESO 297 G012 24.1009 -37.3407 G 0.352 0.3040.014 0.4090.020 ¡ 0.537 10.700.04 NGC 628 24.1751 15.7847 G 0.035 3.7690.009 3.6010.004 3.8530.002 7.580.00 IRAS F01364-1042 24.7209 -10.4534 G 0.945 0.4210.067 0.4880.124 ¡ 1.635 11.630.10 III Zw 035 26.1280 17.1021 G D 0.551 0.2720.032 0.3550.051 ¡ 0.796 11.810.08 NGC 695 27.8102 22.5821 G 0.648 3.3710.006 3.5740.009 3.8900.041 9.570.00 UGC 1385 28.7238 36.9181 G 0.381 0.4270.011 0.5170.018 0.6110.097 10.750.02 KUG 0152+366 28.7578 36.9202 G 0.381 2.6380.153 2.5760.083 2.4720.107 7.730.05 SDSS J0157-0053 29.3217 -0.8845 Q 5.701 PG 0157+001 29.9599 0.3948 Q 2.802 ¡ 1.366 ¡ 1.950 ¡ 5.251 ¿11.18 NGC 835 32.3528 -10.1361 G 0.278 1.1200.003 1.1730.004 1.3770.020 9.710.00 NGC 838 32.4109 -10.1466 G 0.262 0.9900.003 1.1200.004 1.3080.020 10.020.00 NGC 839 32.4285 -10.1841 G 0.264 0.3710.006 0.4410.010 0.6320.043 10.840.01 NGC 828 32.5402 39.1901 G 0.364 1.6770.003 1.7390.005 1.9060.025 9.820.00 NGC 855 33.5158 27.8773 G 0.047 0.2870.002 0.3290.002 0.4060.004 8.640.01 IC 214 33.5225 5.1739 G D 0.605 2.8010.008 2.9060.012 3.1740.049 9.490.00 NGC 877 34.4990 14.5439 G 0.267 5.4650.008 5.8530.005 6.4210.007 8.490.00 Mrk 1034W 35.8283 32.1884 G 0.670 1.5230.016 1.5120.024 1.4990.128 9.670.01 Mrk 1034E 35.8411 32.1968 G 0.672 1.0850.013 1.2920.021 1.4650.115 10.400.01 UGC 1845 36.0334 47.9701 G 0.318 0.5280.006 0.5390.011 0.5500.068 10.690.01 NGC 925 36.8192 33.5795 G 0.044 1.7660.007 2.2340.005 3.9720.005 7.950.00 NGC 958 37.6786 -2.9388 G 0.388 7.8630.012 7.7460.006 7.7740.010 8.470.00 NGC 992 39.3562 21.1011 G 0.282 1.4210.003 1.6110.004 1.8810.016 9.630.00 UGC 2238 41.5729 13.0957 G 0.442 1.3270.005 1.4570.008 1.7270.041 10.120.00 NGC 1097 41.5804 -30.2754 G 0.069 0.7150.001 3.8380.004 4.7210.004 9.840.00 IRAS F02437+2122 41.6632 21.5862 G 0.470 0.2060.035 0.2810.051 ¡ 0.805 11.570.11 UGC 2369S 43.5068 14.9707 G D 0.624 0.9520.012 0.9810.023 0.9120.166 10.640.01 Mrk 1066 44.9939 36.8204 G 0.246 0.2560.007 0.3210.011 0.4750.047 11.020.02 UGC 2608 48.7559 42.0360 G 0.471 0.7050.010 1.0110.013 2.0650.041 10.560.01 UGC 2608S 48.8112 41.9810 G 0.636 5.8700.053 6.0950.032 6.5980.048 7.970.01 NGC 1266 49.0036 -2.4273 G 0.148 ¡ 0.066 0.1030.013 ¡ 0.214 ¿11.89 NGC 1291 49.3291 -41.1070 G 0.050 0.6490.004 0.9260.003 1.6820.007 8.370.00 NGC 1275 49.9504 41.5118 G 0.357 0.3310.013 0.5990.015 1.0750.052 10.850.03 NGC 1316 50.6739 -37.2088 G 0.102 1.6420.005 2.2660.005 3.0980.006 8.270.00 NGC 1317 50.6843 -37.1035 G 0.133 1.4270.003 1.5200.002 1.7250.005 8.680.00 IRAS F03217+4022 51.2721 40.5585 G 0.472 0.4840.014 0.6190.021 0.6830.128 10.990.02 NGC 1377 54.1632 -20.9020 G 0.119 ¡ 0.059 0.1010.010 0.1780.037 ¿11.49 IRAS F03359+1523 54.6962 15.5482 G D 0.704 0.6100.025 0.6960.044 ¡ 1.055 11.000.03 IC 342 56.6913 68.0989 G 0.016 3.7810.006 4.3000.003 4.7260.002 8.010.00 UGC 2894 58.5320 15.9901 G 0.447 2.4720.008 2.7770.008 3.3030.027 8.860.00 CGCG 465-012 58.5666 15.9288 G 0.449 1.4990.006 1.6660.008 1.9040.040 9.780.00 NGC 1482 58.6622 -20.5019 G 0.110 0.9890.002 1.1140.002 1.3880.005 9.670.00 IRAS 03582+6012 60.6355 60.3444 G D 0.601 3.1400.008 3.1820.012 3.1120.052 9.360.00 NGC 1512 60.9758 -43.3491 G 0.056 0.4270.001 0.4370.001 0.4750.003 9.110.00 UGC 2982 63.0941 5.5473 G 0.360 2.0910.003 2.3480.004 2.8220.017 9.460.00 ESO 420-G013 63.4573 -32.0069 G 0.244 0.4150.004 0.4350.008 0.4730.045 10.760.01 ESO 550-IG025 65.3334 -18.8158 G D 0.643 0.5120.032 6.0640.013 6.1410.035 11.060.05 NGC 1572 65.6787 -40.6006 G 0.413 0.6160.008 0.6830.014 0.8250.073 10.640.01 IRAS 04271+3849 67.6384 38.9299 G 0.382 0.5750.008 0.7250.012 1.1780.046 10.510.01 NGC 1614 68.4999 -8.5790 G 0.325 0.4960.006 0.6000.010 0.8210.045 11.210.01 UGC 3094 68.8908 19.1713 G 0.498 2.6100.004 3.1870.006 4.0930.023 9.580.00 ESO 203-IG001 71.7069 -48.5585 G 1.031 0.3760.097 0.5560.134 ¡ 1.824 11.660.15 MCG -05-12-006 73.0207 -32.9904 G 0.381 0.2910.015 0.3440.025 ¡ 0.597 11.220.04 NGC 1799 76.9359 -7.9692 G 0.302 1.3650.029 1.2090.034 2.5540.061 8.420.02 NGC 1797 76.9369 -8.0190 G 0.303 0.4150.006 0.4970.011 0.7310.046 10.720.01 CGCG 468-002W 77.0819 17.3634 G 0.369 CGCG 468-002E 77.0882 17.3690 G 0.369 IRAS 05083+2441 77.8576 24.7549 G 0.466 0.8240.009 0.8670.016 1.0370.083 10.330.01 VII Zw 031 79.1928 79.6700 G 1.045 1.5840.022 1.6030.041 1.3760.320 10.610.01 IRAS 05129+5128 79.2330 51.5322 G 0.551 0.9390.010 1.0580.018 1.2830.093 10.390.01 IRAS F05189-2524 80.2558 -25.3622 G 0.839 0.3860.053 0.4320.104 ¡ 1.418 11.780.09 IRAS F05187-1017 80.2772 -10.2461 G 0.567 0.3260.031 0.4070.049 ¡ 0.962 11.360.07 IRAS 05223+1908 81.3193 19.1802 G 0.593 MCG +08-11-002 85.1822 49.6948 G 0.389 0.4740.009 0.5100.016 0.6050.092 11.070.02 NGC 1961 85.5111 69.3779 G 0.268 4.5020.009 4.5650.004 5.2110.007 8.690.00 UGC 3351 86.4498 58.7010 G 0.303 0.5720.004 0.7300.007 1.1490.027 10.700.01 UGC 3356 86.7738 17.5535 G 0.378 3.3220.022 4.0870.016 4.5040.026 8.170.01 IRAS 05442+1732 86.7964 17.5628 G 0.378 0.5430.008 0.6030.014 0.7180.076 10.700.01 IRAS F06076-2139 92.4406 -21.6732 G 0.743 0.4590.037 0.5770.059 ¡ 1.216 11.320.06 UGC 3405 93.4934 80.4763 G 0.255 1.8840.007 2.5260.006 3.1580.012 8.770.00 UGC 3410 93.6231 80.4501 G 0.267 2.4960.003 2.6110.002 2.8680.009 9.070.00 NGC 2146 94.6554 78.3567 G 0.083 1.2530.001 1.4890.001 2.1790.002 9.920.00 ESO 255-IG007 96.8405 -47.1769 G D 0.769 0.9020.020 0.9920.036 1.9840.115 10.770.02 ESO 557-G001 97.9402 -17.6465 G 0.428 1.5590.012 1.6560.015 1.5070.063 9.080.01 ESO 557-G002 97.9465 -17.6216 G 0.431 0.4170.014 0.6510.018 1.3080.056 10.870.03 UGC 3608 104.3934 46.4029 G 0.432 0.7380.008 1.2030.010 2.0490.035 10.540.01 IRAS F06592-6313 104.9178 -63.2975 G 0.464 0.3470.019 0.4180.032 ¡ 0.758 11.100.04 AM 0702-601N 105.8509 -60.2556 G 0.626 0.7030.024 1.0260.032 1.4120.139 10.320.03 AM 0702-601S 105.8693 -60.2784 G 0.622 0.8230.016 0.8620.029 0.8750.188 10.520.02 NGC 2342 107.3254 20.6362 G 0.358 0.7610.006 4.0610.004 4.9940.012 10.280.01 NGC 2369 109.1573 -62.3430 G 0.222 0.5840.002 0.6520.004 0.9330.018 10.660.00 UGC 3829 110.9314 33.4418 G 0.275 0.5660.004 0.6960.007 0.9840.029 10.290.01 IRAS 07251-0248 111.9063 -2.9150 G 1.638 0.8650.096 1.1040.157 ¡ 2.843 11.490.08 NGC 2388 112.2232 33.8186 G 0.282 0.5330.004 0.6570.007 0.8370.033 10.760.01 NGC 2416 113.9234 11.6124 G 0.346 2.8650.020 3.1020.014 3.6420.024 8.130.01 CGCG 058-009 113.9309 11.7098 G 0.331 0.3950.008 0.4840.013 0.7200.056 10.870.02 PG 0804+761 122.7435 76.0456 Q 1.844 ¡ 2.270 ¡ 3.439 ¿ 9.00 IRAS 08355-4944 129.2573 -49.9083 G D 0.324 0.5170.006 0.5800.011 0.7150.057 10.620.01 IRAS F08339+6517 129.5954 65.1210 G 0.388 1.3220.005 1.4510.008 1.5970.040 9.710.00 NGC 2623 129.6000 25.7550 G 0.376 0.2180.018 0.2970.027 ¡ 0.545 11.930.06 ESO 432-IG006 131.1126 -31.6971 G 0.329 ESO 432-IG006E 131.1198 -31.6913 G 0.329 PG 0838+770 131.1874 76.8862 Q 2.332 ¡ 2.692 4.2800.480 6.6901.182 ¿ 9.23 PG 0844+349 131.9270 34.7515 Q 1.231 3.7810.394 8.1060.605 ESO 060-IG016 133.1336 -69.0317 G D 0.910 0.8740.031 2.1740.027 3.9260.091 10.860.03 IRAS F08572+3915 135.1059 39.0650 G 1.130 0.4030.108 0.6970.128 ¡ 1.834 11.730.15 IRAS 09022-3615 136.0524 -36.4502 G 1.153 0.9400.040 1.1050.070 ¡ 1.742 11.360.03 IRAS F09111-1007W 138.4016 -10.3245 G D 1.069 0.4560.081 ¡ 0.717 11.640.11 IRAS F09111-1007E 138.4115 -10.3217 G D 1.053 UGC 4881 138.9818 44.3330 G D 0.778 0.7780.025 1.5030.025 3.7860.063 10.810.03 NGC 2798 139.3461 41.9998 G 0.125 0.8480.002 0.8740.002 1.0570.007 9.670.00 NGC 2799 139.3806 41.9936 G 0.115 0.5170.008 0.7790.008 1.3590.016 8.510.01 PG 0921+525 141.3029 52.2868 Q 0.702 0.9380.179 1.4260.217 3.6950.416 8.800.12 PG 0923+201 141.4780 19.9014 Q 3.197 NGC 2841 140.5120 50.9769 G 0.068 5.6650.032 5.8100.010 6.1430.006 7.180.00 UGC 5025 141.5136 12.7343 Q 0.584 0.9490.026 1.3510.033 2.6640.084 9.510.02 UGC 5101 143.9648 61.3532 G 0.779 0.6850.026 ¡ 1.170 11.320.03 CGCG 239-011 144.1544 48.4748 G 0.522 0.5940.014 0.7510.022 1.0280.101 10.780.02 PG 0934+013 144.2542 1.0957 Q 0.984 1.5350.111 2.0470.143 3.4140.351 9.060.06 NGC 2992 146.4244 -14.3262 G 0.159 0.5910.001 0.6810.002 0.8180.011 9.750.00 NGC 2993 146.4509 -14.3680 G 0.167 0.7900.001 0.8610.002 0.9590.010 9.720.00 IC 0563 146.5850 3.0456 G 0.406 2.7670.005 2.8750.005 2.9500.021 8.870.00 IC 0564 146.5882 3.0710 G 0.405 3.6850.008 4.1120.006 4.4320.016 8.740.00 NGC 2976 146.8146 67.9181 G 0.017 1.0400.003 1.0340.001 1.0450.001 7.710.00 PG 0947+396 147.6999 39.4462 Q D 3.375 NGC 3049 148.7065 9.2718 G 0.093 0.5030.003 0.5240.003 1.1160.007 9.090.01 PG 0953+414 149.2183 41.2562 Q 3.724 NGC 3077 150.8281 68.7340 G 0.019 0.1920.000 0.2290.000 0.3250.001 9.250.00 NGC 3110 151.0089 -6.4752 G 0.343 1.4590.003 1.7300.004 2.4590.017 9.960.00 PG 1001+054 151.0840 5.2168 Q 2.773 IRAS F10038-3338 151.5194 -33.8850 G 0.679 0.5030.027 0.6260.045 0.9860.193 11.320.04 PG 1004+130 151.8588 12.8157 Q 3.801 4.5211.005 ¡ 7.459 9.160.14 PG 1011-040 153.5861 -4.3115 Q 1.129 1.6760.169 2.6690.177 3.6670.453 8.970.07 PG 1012+008 153.7293 0.5604 Q D 3.126 5.9060.842 ¡ 6.034 ¡11.567 8.660.10 NGC 3187 154.4496 21.8730 G 0.109 2.2060.028 2.3060.016 2.3850.012 7.590.01 NGC 3190 154.5218 21.8325 G 0.094 1.4110.007 1.7980.004 2.4690.005 8.440.00 NGC 3184 154.5695 41.4266 G 0.057 5.7780.028 5.4800.010 5.6540.006 7.060.00 NGC 3198 154.9774 45.5498 G 0.068 4.1060.015 4.2020.007 4.4200.004 7.540.00 IRAS F10173+0828 155.0011 8.2260 G 0.961 0.3170.104 0.5560.113 ¡ 1.689 11.770.17 NGC 3221 155.5836 21.5712 G 0.280 4.7190.004 5.0010.003 5.3310.007 8.700.00 PG 1022+519 156.3803 51.6767 Q 0.884 0.9190.125 1.1640.152 1.7620.478 9.410.09 NGC 3256 156.9633 -43.9039 G 0.192 0.8580.001 0.9680.002 1.1840.010 10.810.00 NGC 3265 157.7784 28.7964 G 0.095 0.2850.003 0.3330.003 0.5050.010 9.430.01 NGC 3281 157.9668 -34.8539 G 0.219 0.2090.006 0.2970.009 0.5530.031 10.870.02 ESO 264-G036 160.7818 -46.2124 G 0.426 2.5060.003 2.6610.005 3.1000.021 9.340.00 NGC 3351 160.9900 11.7044 G 0.045 0.3050.001 2.5950.005 3.2760.004 9.820.00 PG 1048-090 162.8748 -9.3030 Q 4.896 PG 1048+342 162.9326 33.9909 Q D 2.857 PG 1049-005 162.9646 -0.8551 Q 5.030 ¡ 4.771 ¡ 6.651 ¡13.622 ¿ 9.80 ESO 264-G057 164.7572 -43.4404 G 0.350 0.4730.009 0.7700.010 2.2850.022 10.650.02 IRAS F10565+2448 164.8251 24.5432 G 0.850 0.5700.036 0.6420.065 ¡ 1.219 11.540.05 Arp 148 165.9745 40.8504 G 0.687 0.7280.020 0.8380.033 1.0560.175 10.920.02 PG 1100+772 166.0567 76.9824 Q 4.571 ¡ 9.526 NGC 3521 166.4527 -0.0360 G 0.054 2.7460.002 2.8720.001 3.1620.001 8.520.00 PG 1103-006 166.6324 -0.8815 Q 5.559 PG 1114+445 169.2766 44.2261 Q 2.525 ¡ 4.079 ¿ 8.51 NGC 3621 169.5704 -32.8130 G 0.032 1.8420.002 1.9150.001 2.0780.001 8.190.00 PG 1115+407 169.6270 40.4315 Q 2.677 3.1290.485 6.3710.363 7.1191.055 9.420.10 PG 1116+215 169.7860 21.3217 Q 2.987 ¡ 4.089 ¡ 6.471 ¿ 8.84 NGC 3627 170.0640 12.9900 G 0.045 2.5170.002 2.7540.001 2.9560.001 8.560.00 CGCG 011-076 170.3010 -2.9842 G 0.502 0.7230.011 0.8900.017 1.1440.083 10.520.01 PG 1119+120 170.4465 11.7385 Q 0.981 0.7060.125 0.9720.185 2.6710.379 9.920.11 PG 1121+422 171.1641 42.0291 Q 3.614 IC 2810 171.4376 14.6764 G 0.681 0.6810.022 0.9330.031 1.3230.138 10.800.03 IC 2810E 171.4563 14.6683 G 0.674 0.6070.030 0.7890.042 10.600.04 ESO 319-G022 171.9753 -41.6145 G 0.333 0.1940.017 0.3220.021 0.7400.057 11.410.07 PG 1126-041 172.3199 -4.4022 Q 1.194 1.0980.096 1.5220.133 2.1980.505 9.870.06 SDSS J1142+1027 175.7433 10.4632 Q 3.585 PG 1149-110 178.0145 -11.3732 Q 0.959 0.8240.163 1.4470.168 4.4570.282 9.560.12 NGC 3938 178.2050 44.1212 G 0.087 3.9780.009 3.9720.005 4.3300.004 7.880.00 ESO 320-G030 178.2987 -39.1302 G 0.221 0.3330.004 0.3690.007 0.4370.039 11.280.01 PG 1151+117 178.4549 11.4750 Q 2.982 NGC 3991 179.3795 32.3375 G D 0.218 3.6070.008 3.5730.007 3.5410.010 8.160.00 NGC 3994 179.4039 32.2773 G 0.211 1.4160.002 1.4930.002 1.6060.011 9.120.00 NGC 3995 179.4335 32.2941 G 0.222 2.3500.005 2.5670.005 3.1390.010 8.670.00 PG 1202+281 181.1758 27.9031 Q D 2.833 ¡ 3.753 ¡ 5.788 ¿ 8.99 ESO 440-IG058 181.7160 -31.9500 G 0.468 1.2050.006 1.2410.011 1.4320.056 10.090.00 IRAS F12112+0305 183.4424 2.8111 G D 1.395 1.7280.033 1.7020.068 ¡ 2.266 10.880.02 ESO 267-G029 183.4680 -47.2738 G 0.369 0.5180.009 0.8120.011 1.7820.031 10.450.01 NGC 4194 183.5393 54.5269 G 0.171 0.3760.002 0.4120.004 0.5210.020 10.720.00 ESO 267-G030 183.5536 -47.2286 G 0.375 1.4390.004 1.5740.006 1.7600.030 9.730.00 PG 1211+143 183.5739 14.0533 Q 1.525 ¡ 1.956 ¡ 2.783 ¿ 8.93 IRAS 12116-5615 183.5917 -56.5424 G 0.544 0.5260.016 0.5650.030 ¡ 0.857 11.150.02 NGC 4254 184.7072 14.4166 G 0.070 2.1320.001 2.4010.001 2.8080.001 8.880.00 PG 1216+069 184.8375 6.6434 Q 4.765 NGC 4321 185.7275 15.8232 G 0.069 4.5710.008 4.9500.004 5.3790.003 8.040.00 IRAS F12224-0624 186.2663 -6.6811 G 0.530 0.1750.056 ¡ 0.357 ¡ 0.905 11.830.17 NGC 4388 186.4446 12.6624 G 0.173 0.4450.002 3.9080.007 10.240.00 NGC 4418 186.7277 -0.8776 G 0.150 0.0560.011 0.0740.018 ¡ 0.246 12.520.13 VV 655 186.7706 -0.9069 G D 0.153 0.7490.044 0.8370.043 0.9660.072 7.960.05 NGC 4501 187.9967 14.4195 G 0.157 7.7550.005 8.3270.005 PG 1229+204 188.0154 20.1582 Q 1.213 1.4740.221 3.9620.219 5.4380.462 9.110.10 NGC 4532 188.5800 6.4687 G 0.138 2.1480.003 2.7260.007 NGC 4536 188.6140 2.1876 G 0.070 0.5770.001 0.9300.001 3.7450.004 9.820.00 NGC 4559 188.9906 27.9599 G 0.034 1.8770.004 1.8720.002 2.0440.002 7.860.00 IC 3583 189.1840 13.2578 G 0.077 0.9910.013 1.1920.008 1.3100.007 7.780.01 NGC 4569 189.2086 13.1654 G 0.048 1.8940.004 1.8670.002 1.8740.001 8.020.00 NGC 4579 189.4308 11.8195 G 0.080 4.1190.018 4.6480.008 4.9860.005 7.710.00 NGC 4594 189.9971 -11.6228 G 0.044 4.1580.014 4.7580.006 4.6330.004 6.970.00 IC 3639 190.2201 -36.7558 G 0.224 0.5510.003 2.4820.009 10.120.00 ESO 381-G009 190.2429 -36.7314 G 0.222 0.9150.009 3.9220.027 8.920.01 NGC 4625 190.4689 41.2722 G 0.045 0.5920.004 0.7370.003 0.9240.003 8.060.01 NGC 4631 190.5247 32.5399 G 0.037 1.5070.001 1.6880.001 4.4050.002 8.850.00 PG 1244+026 191.6469 2.3692 Q 0.944 ¡ 0.920 ¡ 1.348 ¡ 2.828 ¿ 9.39 NGC 4725 192.6084 25.5008 G 0.058 7.3350.042 7.0030.015 7.7760.008 6.770.00 NGC 4736 192.7223 41.1191 G 0.023 0.7740.000 0.8220.000 0.9040.000 8.970.00 SDSS J1253-0341 193.3933 -3.6993 Q 3.797 ¡ 3.002 ¡ 3.984 ¡ 8.953 ¿10.08 Mrk 231 194.0590 56.8738 G 0.832 ¡ 0.386 ¡ 0.500 ¡ 1.396 ¿12.26 NGC 4826 194.1821 21.6830 G 0.026 0.4470.000 0.4890.000 0.5390.001 9.180.00 PG 1259+593 195.3033 59.0350 Q 5.956 NGC 4922 195.3546 29.3144 G 0.476 0.2970.024 0.3770.038 ¡ 0.815 11.250.06 CGCG 043-099 195.4598 4.3332 G 0.744 0.5620.031 0.6960.049 0.9440.243 11.140.04 MCG -02-33-098 195.5822 -15.7677 G D 0.324 0.4000.009 1.9770.006 2.2690.022 10.630.02 ESO 507-G070 195.7182 -23.9216 G 0.439 0.3240.017 0.3820.029 ¡ 0.675 11.510.04 PG 1302-102 196.3878 -10.5554 Q 4.227 ¡ 5.114 ¡ 7.000 ¡13.747 ¿ 9.30 IRAS 13052-5711 197.0778 -57.4585 G 0.430 0.4260.013 0.4860.022 ¡ 0.704 11.070.02 PG 1307+085 197.4459 8.3303 Q 2.687 ¡ 4.975 ¡ 6.982 ¿ 8.38 PG 1309+355 198.0741 35.2560 Q 3.074 3.5731.048 ¡ 7.179 15.7002.199 9.060.17 NGC 5010 198.1102 -15.7977 G 0.203 0.8410.002 0.9140.003 0.9930.015 9.910.00 PG 1310-108 198.2742 -11.1286 Q 0.683 1.2130.162 1.5600.187 1.9530.519 8.500.09 IC 860 198.7647 24.6188 G 0.229 0.0950.016 0.1300.024 ¡ 0.380 12.070.11 IRAS 13120-5453 198.7765 -55.1568 G 0.615 0.4510.022 0.5100.041 ¡ 1.005 11.990.04 Arp 238 198.8957 62.1252 G D 0.621 0.3600.031 0.4320.054 ¡ 1.049 11.480.06 NGC 5055 198.9553 42.0290 G 0.038 1.4070.001 2.1360.001 3.0380.001 8.860.00 UGC 8387 200.1471 34.1398 G 0.470 0.4870.012 0.5610.022 0.5450.162 11.350.02 NGC 5104 200.3465 0.3424 G 0.378 0.5520.008 0.6950.012 0.9190.057 10.640.01 MCG -03-34-064 200.6013 -16.7281 G 0.337 0.6160.007 ¡ 0.238 1.1760.042 10.120.01 PG 1322+659 200.9557 65.6964 Q 2.870 NGC 5135 201.4333 -29.8333 G 0.280 0.6150.003 0.6540.006 0.8430.032 10.680.00 ESO 173-G015 201.8483 -57.4898 G 0.200 0.2970.003 0.4480.005 0.7810.017 11.670.01 IC 4280 203.2218 -24.2069 G 0.332 2.2730.003 2.4310.003 2.6990.015 9.190.00 NGC 5256 204.5719 48.2756 G D 0.559 0.9310.011 1.2380.016 1.8890.063 10.390.01 NGC 5257 204.9706 0.8393 G 0.458 4.3250.004 4.2650.005 4.2860.019 8.950.00 NGC 5258 204.9886 0.8293 G 0.455 2.0130.004 3.5180.005 4.4380.018 9.540.00 PG 1341+258 205.9865 25.6465 Q 1.621 ¡ 3.317 4.6180.780 7.9011.434 ¿ 8.29 Mrk 273 206.1758 55.8875 G 0.749 ¡ 0.317 ¡ 0.488 ¡ 1.256 ¿12.13 UGC 8739 207.3083 35.2573 G 0.342 2.0370.003 2.0960.004 2.4950.017 9.380.00 ESO 221-IG010 207.7370 -49.0553 G 0.212 0.8080.002 1.4750.002 2.3370.007 10.030.00 NGC 5331 208.0678 2.1015 G D 0.659 1.3390.011 1.5490.017 2.2170.072 10.330.01 PG 1351+640 208.3156 63.7638 Q 1.649 ¡ 1.056 1.1910.350 ¡ 4.044 ¿10.27 PG 1351+236 208.5267 23.4304 Q 1.069 1.2620.097 1.3060.135 1.6650.545 9.520.06 PG 1352+183 208.6487 18.0884 Q 2.643 PG 1354+213 209.1365 21.0646 Q 4.454 SDSS J1356+1026 209.1919 10.4357 Q 2.209 2.6640.112 3.1320.202 ¡ 4.972 9.860.03 NGC 5394 209.6399 37.4541 G 0.235 0.4110.004 0.5000.006 0.6770.029 10.410.01 NGC 5395 209.6562 37.4280 G 0.240 8.7590.027 8.6600.012 8.8540.010 7.700.00 NGC 5457 210.8046 54.3433 G 0.032 6.2380.007 5.9490.003 6.0550.002 7.560.00 NGC 5426 210.8531 -6.0692 G 0.176 2.2990.006 2.5090.004 3.1480.006 8.460.00 NGC 5427 210.8579 -6.0305 G 0.179 1.4170.003 4.1540.004 4.7490.005 9.250.00 NGC 5474 211.2521 53.6562 G 0.033 0.9770.016 0.8770.006 1.7900.009 7.810.01 PG 1402+261 211.3176 25.9262 Q 2.814 1.9820.544 ¡ 3.641 ¡ 8.731 9.900.16 PG 1404+226 211.5914 22.3961 Q 1.812 3.4310.762 ¡ 7.312 8.370.14 PG 1411+442 213.4516 44.0038 Q 1.672 ¡ 2.395 2.5930.577 ¡ 5.639 ¿ 8.82 PG 1415+451 214.2537 44.9350 Q 2.062 2.0010.550 ¡ 3.007 ¡ 6.059 9.300.16 PG 1416-129 214.7662 -13.1792 Q 2.301 ¡ 5.610 CGCG 247-020 214.9301 49.2368 G 0.518 0.3190.026 0.4110.040 ¡ 0.763 11.330.06 PG 1425+267 216.8982 26.5376 Q 5.064 ¡ 8.149 ¡10.283 ¿ 8.79 PG 1426+015 217.2770 1.2851 Q 1.622 1.9640.162 2.3030.240 4.2350.608 9.450.06 PG 1427+480 217.4296 47.7904 Q 3.558 ¡ 5.224 ¡ 8.192 ¿ 8.78 NGC 5653 217.5421 31.2157 G 0.243 1.9260.002 2.0440.002 2.1750.010 9.410.00 IRAS F14348-1447 219.4096 -15.0064 G D 1.561 2.8800.026 2.8300.053 2.7160.354 10.480.01 PG 1435-067 219.5673 -6.9727 Q 2.256 NGC 5713 220.0476 -0.2902 G 0.104 1.5880.002 1.7430.001 2.0960.003 9.120.00 IRAS F14378-3651 220.2455 -37.0754 G 1.295 0.4650.122 ¡ 0.853 ¡ 2.244 11.810.15 PG 1440+356 220.5310 35.4398 Q 1.494 0.7200.201 0.9110.294 ¡ 3.148 10.620.16 NGC 5728 220.5994 -17.2532 G 0.192 0.5100.002 0.6250.003 0.7760.016 10.210.00 NGC 5734 221.2874 -20.8703 G 0.281 1.5500.002 1.6950.003 1.9180.015 9.470.00 PG 1448+273 222.7866 27.1573 Q 1.248 1.0980.290 1.4300.398 3.5550.791 9.420.15 UGC 9618N 224.2528 24.6180 G 0.671 2.5560.008 2.7410.011 2.9900.056 9.850.00 PG 1501+106 226.0046 10.4382 Q 0.724 ¡ 0.492 ¡ 0.771 ¡ 1.918 ¿10.04 NGC 5866 226.6243 55.7629 G 0.074 0.9610.003 0.9890.002 1.0170.003 8.720.00 SDSS J1507+0029 226.8332 0.4848 Q 3.071 3.1430.896 ¡ 5.205 9.220.16 CGCG 049-057 228.3046 7.2257 G 0.266 0.1630.012 0.1970.020 ¡ 0.394 11.900.06 PG 1512+370 228.6794 36.8474 Q 5.125 VV 705 229.5254 42.7458 G D 0.797 0.9280.020 1.4990.026 2.2530.107 10.880.02 PG 1519+226 230.3093 22.4623 Q 2.423 ¡ 3.655 ¡ 4.651 ¿ 8.77 ESO 099-G004 231.2405 -63.1252 G D 0.587 1.2230.008 1.7060.012 2.0430.061 10.510.01 IRAS F15250+3608 231.7475 35.9771 G 1.072 0.4970.073 0.6170.126 ¡ 1.633 11.600.10 NGC 5936 232.5033 12.9895 G 0.273 0.5100.004 0.8580.005 1.9030.014 10.570.01 Arp 220 233.7381 23.5038 G 0.368 0.2460.014 ¡ 0.601 12.530.05 PG 1543+580 233.9687 57.9025 Q 0.593 ¡ 0.636 0.8670.150 ¿ 9.19 PG 1535+547 234.1600 54.5586 Q 0.771 3.5050.637 PG 1543+489 236.3761 48.7688 Q D 5.384 6.4610.571 9.0820.827 11.6023.575 9.660.07 NGC 5990 236.5687 2.4151 G 0.262 1.1980.002 1.3990.004 1.6770.015 9.750.00 PG 1545+210 236.9309 20.8716 Q 4.072 PG 1552+085 238.6861 8.3728 Q 2.146 NGC 6052 241.3049 20.5424 G 0.322 2.3740.003 2.5260.004 2.7400.015 9.120.00 NGC 6090 242.9201 52.4583 G D 0.587 1.5370.008 1.6250.014 1.7850.073 10.080.00 PG 1613+658 243.4892 65.7198 Q 2.302 1.0990.326 ¡ 1.972 ¡ 4.684 10.700.16 PG 1612+261 243.5557 26.0704 Q 2.332 2.1390.396 2.8670.541 5.8591.283 9.570.12 IRAS F16164-0746 244.7992 -7.9008 G 0.545 0.4620.018 0.5790.029 ¡ 0.909 11.300.03 PG 1617+175 245.0471 17.4070 Q 2.044 ¡ 4.381 ¿ 8.06 PG 1626+554 246.9841 55.3752 Q 2.363 CGCG 052-037 247.7357 4.0828 G 0.494 0.8350.009 1.0480.014 1.3410.067 10.510.01 NGC 6156 248.7180 -60.6188 G 0.223 1.9360.002 2.7140.002 3.3810.006 9.500.00 ESO 069-IG006N 249.5490 -68.4357 G 0.912 1.4240.018 1.3930.035 1.3580.235 10.680.01 IRAS F16399-0937 250.6673 -9.7206 G D 0.543 1.3950.007 1.7950.011 2.1600.052 10.190.00 ESO 453-G005 251.8795 -29.3560 G 0.423 0.3990.013 0.5040.020 0.7800.086 11.150.03 NGC 6240 253.2450 2.4009 G D 0.493 0.5720.012 0.7440.019 1.1470.079 11.280.02 IRAS F16516-0948 253.5997 -9.8892 G 0.459 2.2480.006 2.4830.008 2.8310.031 9.380.00 NGC 6285 254.6003 58.9560 G 0.385 0.7160.010 0.9670.013 0.8480.076 9.810.01 NGC 6286 254.6325 58.9373 G 0.373 1.9090.003 1.9660.005 2.1190.023 9.600.00 PG 1700+518 255.3534 51.8223 Q D 4.371 ¡ 3.384 ¡ 4.591 ¡11.190 ¿10.15 PG 1704+608 256.1728 60.7419 Q 5.136 ¡ 5.424 ¡ 7.525 ¡19.535 ¿ 9.54 IRAS F17132+5313 258.5840 53.1749 G D 0.995 3.8480.012 3.6120.020 3.0580.126 9.730.00 IRAS F17138-1017 259.1494 -10.3447 G 0.353 0.8040.004 0.8490.008 0.9800.045 10.570.00 IRAS F17207-0014 260.8416 -0.2838 G 0.844 0.5640.034 0.6840.058 ¡ 1.213 11.970.05 ESO 138-G027 261.6806 -59.9320 G 0.421 0.6660.008 1.0210.011 1.7460.038 10.630.01 UGC 11041 268.7160 34.7761 G 0.331 1.3980.004 1.4760.005 1.6440.025 9.700.00 CGCG 141-034 269.2361 24.0174 G 0.402 0.3950.012 0.4970.019 0.6190.102 10.960.03 IRAS 17578-0400 270.1328 -4.0148 G 0.287 0.2650.008 0.3260.014 0.4660.064 11.590.03 IRAS 18090+0130W 272.8892 1.5283 G 0.586 0.6500.024 0.9370.030 0.8580.201 10.260.03 IRAS 18090+0130E 272.9101 1.5276 G 0.580 1.1310.010 1.4140.015 1.8380.068 10.320.01 NGC 6621 273.2307 68.3633 G 0.418 0.8780.006 0.9590.011 1.2200.052 10.240.01 IC 4687 273.4150 -57.7254 G 0.353 1.2570.003 1.3110.006 1.4130.031 10.100.00 IC 4689 273.4179 -57.7485 G 0.336 0.7510.005 0.8610.008 0.8460.051 10.050.01 CGCG 142-033 274.1411 22.1109 G 0.363 0.5840.013 0.7300.016 0.7650.079 9.870.02 CGCG 142-034 274.1696 22.1132 G 0.379 1.5410.005 1.5480.007 1.5990.035 9.660.00 IRAS F18293-3413 278.1715 -34.1909 G 0.369 0.8660.004 0.9220.008 1.0570.044 10.920.00 NGC 6670B 278.3929 59.8885 G 0.564 NGC 6670A 278.4075 59.8899 G 0.583 IC 4734 279.6071 -57.4903 G 0.318 0.3320.008 0.4520.012 0.8370.043 11.210.02 NGC 6701 280.8027 60.6536 G 0.270 0.4940.004 0.6110.007 1.4000.018 10.650.01 NGC 6786 287.7232 73.4103 G 0.504 1.3690.008 1.8180.010 2.5240.041 9.820.00 UGC 11415 287.7666 73.4261 G 0.507 0.8290.011 1.1790.015 1.5420.068 10.220.01 ESO 593-IG008 288.6302 -21.3183 G D 0.954 2.4040.013 2.7080.022 3.1040.109 10.170.00 IRAS 19254-7245 292.8395 -72.6558 G D 1.190 0.5870.077 1.1030.080 1.5000.403 11.430.09 IRAS F19297-0406 293.0930 -4.0001 G 1.607 0.7980.099 1.0850.147 ¡ 2.732 11.670.09 IRAS 19542+1110 299.1490 11.3183 G 1.248 0.4700.111 0.6340.170 ¡ 2.164 11.750.14 ESO 339-G011 299.4069 -37.9354 G 0.389 0.9810.006 1.6650.007 2.3060.026 10.070.01 NGC 6907 306.2774 -24.8093 G 0.217 0.6270.002 0.7880.004 2.7380.007 10.320.00 NGC 6921 307.1201 25.7236 G 0.295 0.6220.007 0.7240.010 0.5430.076 9.750.01 MCG +04-48-002 307.1459 25.7336 G 0.284 1.1080.003 1.1820.005 1.2690.024 9.870.00 NGC 6926 308.2749 -2.0257 G 0.398 9.7630.014 9.9820.009 9.7890.012 8.180.00 NGC 6946 308.7213 60.1544 G 0.033 3.9730.003 4.0960.001 4.2630.001 8.300.00 IRAS 20351+2521 309.3231 25.5274 G 0.672 1.3860.011 2.2760.014 3.3760.053 10.300.01 IC 5063 313.0098 -57.0686 G 0.232 0.3710.005 0.5860.007 0.9800.025 10.240.01 CGCG 448-020 314.3512 17.1276 G D 0.718 1.1390.013 1.5720.020 2.8470.070 10.690.01 ESO 286-IG019 314.6116 -42.6498 G 0.848 0.4870.042 0.7040.060 ¡ 1.429 11.640.06 ESO 286-G035 316.0460 -43.5929 G 0.353 1.0590.004 1.0480.007 1.0910.042 9.950.00 IRAS 21101+5810 317.8720 58.3857 G 0.773 0.5160.035 0.7430.049 ¡ 1.206 11.300.05 PG 2112+059 318.7189 6.1287 Q 5.874 ¡ 8.235 ¡12.053 ¡29.162 ¿ 9.14 UGC 11763 323.1162 10.1391 Q 1.213 0.6850.184 1.1480.208 3.4140.382 10.210.15 ESO 343-IG013 324.0449 -38.5434 G D 0.387 2.3800.005 2.5390.007 2.3470.027 9.270.00 NGC 7130 327.0809 -34.9514 G 0.329 0.4580.007 1.3860.030 10.990.01 NGC 7172 330.5082 -31.8695 G 0.178 0.6320.002 0.9270.013 9.740.00 B2 2201+31A 330.8126 31.7608 Q 4.400 ¡ 7.369 ¡15.677 II Zw 171 332.9751 18.6973 Q 1.337 ¡ 2.440 3.0600.366 3.6830.798 ¿ 8.44 SDSS J2217-0944 333.0749 -9.7352 Q D 3.042 4.6260.706 9.5040.750 11.7471.444 9.010.10 ESO 467-G027 333.6657 -27.4641 G 0.354 3.2970.004 3.3770.004 3.7420.014 8.870.00 IC 5179 334.0381 -36.8437 G 0.234 1.5570.001 1.9020.002 2.6690.007 9.690.00 PG 2214+139 334.3014 14.2391 Q 1.262 ¡ 2.114 3.1010.483 6.5490.867 ¿ 8.50 ESO 602-G025 337.8561 -19.0345 G 0.504 0.8140.010 1.0870.015 1.7080.056 10.420.01 PG 2233+134 339.0320 13.7320 Q 4.718 NGC 7331 339.2670 34.4158 G 0.070 2.8530.002 3.1000.001 3.6360.001 8.640.00 UGC 12150 340.3003 34.2490 G 0.433 0.5460.010 0.6690.016 0.8650.080 10.860.02 ESO 239-IG002 342.4167 -48.8494 G 0.848 0.3700.061 0.5040.092 ¡ 1.453 11.680.11 IRAS F22491-1808 342.9555 -17.8733 G 1.471 0.9130.075 1.3110.109 ¡ 2.374 11.260.06 PG 2251+113 343.5433 11.6106 Q 4.709 9.4212.843 8.360.18 NGC 7469 345.8147 8.8735 G 0.332 0.5760.005 0.6110.010 0.7130.054 11.020.01 IC 5283 345.8241 8.8936 G 0.326 1.9810.005 2.0780.006 2.1390.021 8.790.00 CGCG 453-062 346.2357 19.5522 G 0.506 0.7240.011 1.0770.014 1.6740.057 10.620.01 NGC 7479 346.2359 12.3229 G 0.163 0.1180.006 0.2080.007 0.6470.015 11.320.04 PG 2304+042 346.7621 4.5490 Q 0.829 PG 2308+098 347.8242 10.1379 Q 5.635 IRAS 23128-5919 348.9448 -59.0539 G D 0.878 2.3380.013 2.4000.025 2.3990.141 10.220.00 IC 5298 349.0029 25.5564 G 0.551 0.5200.017 0.6870.026 0.8610.137 11.070.03 NGC 7591 349.5679 6.5858 G 0.336 0.4520.007 0.6960.009 1.4870.027 10.770.01 NGC 7592 349.5932 -4.4160 G D 0.493 3.4740.006 3.4240.008 3.4630.030 9.290.00 ESO 077-IG014 350.2718 -69.2134 G D 0.821 0.5460.040 0.6420.066 1.9610.132 11.170.06 NGC 7674 351.9863 8.7789 G 0.580 0.9600.013 2.3940.013 4.2530.038 10.310.01 NGC 7679 352.1944 3.5116 G 0.349 1.3540.004 1.5100.006 1.7820.027 9.790.00 NGC 7682 352.2663 3.5333 G 0.349 0.4500.040 0.7190.044 1.4170.109 9.270.07 NGC 7714 354.0590 2.1550 G 0.192 0.4060.003 0.5400.004 0.9050.016 10.360.01 IRAS F23365+3604 354.7555 36.3524 G 1.239 0.5760.083 0.6480.157 ¡ 2.115 11.650.10 MCG -01-60-021 355.4461 -3.6683 G 0.445 3.8250.053 3.9710.024 4.3840.033 7.740.01 MCG -01-60-022 355.5038 -3.6149 G 0.469 1.0720.007 1.5290.010 2.1730.040 10.030.01 IRAS 23436+5257 356.5237 53.2337 G D 0.680 1.4390.011 1.4420.021 1.4120.129 10.210.01 NGC 7752 356.7428 29.4587 G 0.344 1.4830.006 1.6380.008 1.7700.030 9.270.00 NGC 7753 356.7689 29.4833 G 0.351 0.5490.011 1.3710.009 8.1530.017 10.310.02 NGC 7771 357.8534 20.1117 G 0.291 0.8630.003 0.8710.005 1.1420.025 10.390.00 MRK 0331 357.8612 20.5861 G 0.375 0.5020.008 0.5700.014 0.6270.082 11.090.01 PG 2349-014 357.9840 -1.1537 Q 2.950 3.3540.948 7.9602.592 NGC 7793 359.4577 -32.5915 G 0.019 1.7870.004 1.8280.002 1.9770.001 7.610.00
(1) Target name.
(2),(3) Far-infrared source position, as measured from the Gaussian fits.
(4) Class – Galaxy (G) or QSO (Q).
(5) Morphology – D denotes a double source with potentially inflated fitted size.
(6) Scale for the adopted distance and cosmology.
(7),(8),(9) Far-infrared half light radii at 70, 100, and 160m. Missing entries for a given band indicate photometric S/N10 or band not observed. Half light radii are based on subtracting in quadrature observed width and PSF width. The errors are statistical and do not include systematics due to the non-gaussianity of the real source structure and PSF.
(10) Surface brightness of the 40-120m far-infrared emission.
References
- Bahcall et al. (1997) Bahcall, J. N., Kirhakos, S., Saxe, D. H., & Schneider, D. P. 1997, ApJ, 479, 642
- Barcos-Muñoz et al. (2015) Barcos-Muñoz, L., Leroy, A. K., Evans, A. S., et al. 2015, ApJ, 799, 10
- Berta et al. (2013) Berta, S., Lutz, D., Santini, P., et al. 2013, A&A, 551, A100
- Boroson & Green (1992) Boroson, T. A. & Green, R. F. 1992, ApJS, 80, 109
- Brauher et al. (2008) Brauher, J. R., Dale, D. A., & Helou, G. 2008, ApJS, 178, 280
- Brinchmann et al. (2004) Brinchmann, J., Charlot, S., White, S. D. M., et al. 2004, MNRAS, 351, 1151
- Busch et al. (2014) Busch, G., Zuther, J., Valencia-S., M., et al. 2014, A&A, 561, A140
- Calzetti et al. (2010) Calzetti, D., Wu, S.-Y., Hong, S., et al. 2010, ApJ, 714, 1256
- Carilli & Walter (2013) Carilli, C. L. & Walter, F. 2013, ARA&A, 51, 105
- Chabrier (2003) Chabrier, G. 2003, PASP, 115, 763
- Cicone et al. (2014) Cicone, C., Maiolino, R., Sturm, E., et al. 2014, A&A, 562, A21
- Condon et al. (1990) Condon, J. J., Helou, G., Sanders, D. B., & Soifer, B. T. 1990, ApJS, 73, 359
- Condon et al. (1991) Condon, J. J., Huang, Z.-P., Yin, Q. F., & Thuan, T. X. 1991, ApJ, 378, 65
- Daddi et al. (2010) Daddi, E., Bournaud, F., Walter, F., et al. 2010, ApJ, 713, 686
- Dale & Helou (2002) Dale, D. A. & Helou, G. 2002, ApJ, 576, 159
- Dasyra et al. (2007) Dasyra, K. M., Tacconi, L. J., Davies, R. I., et al. 2007, ApJ, 657, 102
- De Looze et al. (2011) De Looze, I., Baes, M., Bendo, G. J., Cortese, L., & Fritz, J. 2011, MNRAS, 416, 2712
- Díaz-Santos et al. (2014) Díaz-Santos, T., Armus, L., Charmandaris, V., et al. 2014, ApJ, 788, L17
- Díaz-Santos et al. (2013) Díaz-Santos, T., Armus, L., Charmandaris, V., et al. 2013, ApJ, 774, 68
- Díaz-Santos et al. (2010) Díaz-Santos, T., Charmandaris, V., Armus, L., et al. 2010, ApJ, 723, 993
- Díaz-Santos et al. (2011) Díaz-Santos, T., Charmandaris, V., Armus, L., et al. 2011, ApJ, 741, 32
- Dunlop et al. (2003) Dunlop, J. S., McLure, R. J., Kukula, M. J., et al. 2003, MNRAS, 340, 1095
- Elbaz et al. (2011) Elbaz, D., Dickinson, M., Hwang, H. S., et al. 2011, A&A, 533, A119
- Farrah et al. (2013) Farrah, D., Lebouteiller, V., Spoon, H. W. W., et al. 2013, ApJ, 776, 38
- Fischer et al. (2014) Fischer, J., Abel, N. P., González-Alfonso, E., et al. 2014, ApJ, 795, 117
- Fischer et al. (2010) Fischer, J., Sturm, E., González-Alfonso, E., et al. 2010, A&A, 518, L41
- Förster Schreiber et al. (2009) Förster Schreiber, N. M., Genzel, R., Bouché, N., et al. 2009, ApJ, 706, 1364
- Genzel et al. (1998) Genzel, R., Lutz, D., Sturm, E., et al. 1998, ApJ, 498, 579
- Genzel et al. (2015) Genzel, R., Tacconi, L. J., Lutz, D., et al. 2015, ApJ, 800, 20
- González-Alfonso et al. (2014) González-Alfonso, E., Fischer, J., Graciá-Carpio, J., et al. 2014, A&A, 561, A27
- González-Alfonso et al. (2015) González-Alfonso, E., Fischer, J., Sturm, E., et al. 2015, ApJ, 800, 69
- Graciá-Carpio et al. (2011) Graciá-Carpio, J., Sturm, E., Hailey-Dunsheath, S., et al. 2011, ApJ, 728, L7
- Graciá-Carpio et al. (2015) Graciá-Carpio, J., Wetzstein, M., & Roussel, H. 2015, ArXiv e-prints [arXiv:1512.03252]
- Guyon et al. (2006) Guyon, O., Sanders, D. B., & Stockton, A. 2006, ApJS, 166, 89
- Haan et al. (2011) Haan, S., Surace, J. A., Armus, L., et al. 2011, AJ, 141, 100
- Harrison et al. (2016) Harrison, C. M., Simpson, J. M., Stanley, F., et al. 2016, MNRAS, 457, L122
- Hatziminaoglou et al. (2010) Hatziminaoglou, E., Omont, A., Stevens, J. A., et al. 2010, A&A, 518, L33
- Heckman (2002) Heckman, T. M. 2002, in Astronomical Society of the Pacific Conference Series, Vol. 254, Extragalactic Gas at Low Redshift, ed. J. S. Mulchaey & J. T. Stocke, 292
- Herrera-Camus et al. (2015) Herrera-Camus, R., Bolatto, A. D., Wolfire, M. G., et al. 2015, ApJ, 800, 1
- Hunt et al. (2015) Hunt, L. K., Draine, B. T., Bianchi, S., et al. 2015, A&A, 576, A33
- Ikarashi et al. (2015) Ikarashi, S., Ivison, R. J., Caputi, K. I., et al. 2015, ApJ, 810, 133
- Kennicutt et al. (2011) Kennicutt, R. C., Calzetti, D., Aniano, G., et al. 2011, PASP, 123, 1347
- Kennicutt (1998) Kennicutt, Jr., R. C. 1998, ARA&A, 36, 189
- Kim et al. (2013) Kim, D.-C., Evans, A. S., Vavilkin, T., et al. 2013, ApJ, 768, 102
- Klaas et al. (2001) Klaas, U., Haas, M., Müller, S. A. H., et al. 2001, A&A, 379, 823
- Leroy et al. (2011) Leroy, A. K., Bolatto, A., Gordon, K., et al. 2011, ApJ, 737, 12
- Luhman et al. (1998) Luhman, M. L., Satyapal, S., Fischer, J., et al. 1998, ApJ, 504, L11
- Luhman et al. (2003) Luhman, M. L., Satyapal, S., Fischer, J., et al. 2003, ApJ, 594, 758
- Lutz (2014) Lutz, D. 2014, ARA&A, 52, 373
- Lutz et al. (1998) Lutz, D., Spoon, H. W. W., Rigopoulou, D., Moorwood, A. F. M., & Genzel, R. 1998, ApJ, 505, L103
- Madden et al. (1993) Madden, S. C., Geis, N., Genzel, R., et al. 1993, ApJ, 407, 579
- Madden et al. (1997) Madden, S. C., Poglitsch, A., Geis, N., Stacey, G. J., & Townes, C. H. 1997, ApJ, 483, 200
- Magnelli et al. (2014) Magnelli, B., Lutz, D., Saintonge, A., et al. 2014, A&A, 561, A86
- Magnelli et al. (2012) Magnelli, B., Lutz, D., Santini, P., et al. 2012, A&A, 539, A155
- Malhotra et al. (1997) Malhotra, S., Helou, G., Stacey, G., et al. 1997, ApJ, 491, L27
- Malhotra et al. (2001) Malhotra, S., Kaufman, M. J., Hollenbach, D., et al. 2001, ApJ, 561, 766
- Mor & Netzer (2012) Mor, R. & Netzer, H. 2012, MNRAS, 420, 526
- Mullaney et al. (2011) Mullaney, J. R., Alexander, D. M., Goulding, A. D., & Hickox, R. C. 2011, MNRAS, 414, 1082
- Mushotzky et al. (2014) Mushotzky, R. F., Shimizu, T. T., Meléndez, M., & Koss, M. 2014, ApJ, 781, L34
- Nelson et al. (2015) Nelson, E. J., van Dokkum, P. G., Förster Schreiber, N. M., et al. 2015, ArXiv e-prints [arXiv:1507.03999]
- Neri et al. (2014) Neri, R., Downes, D., Cox, P., & Walter, F. 2014, A&A, 562, A35
- Netzer (2013) Netzer, H. 2013, The Physics and Evolution of Active Galactic Nuclei (Cambridge: Cambridge University Press)
- Netzer et al. (2007) Netzer, H., Lutz, D., Schweitzer, M., et al. 2007, ApJ, 666, 806
- Newman et al. (2012) Newman, S. F., Genzel, R., Förster-Schreiber, N. M., et al. 2012, ApJ, 761, 43
- Parra et al. (2007) Parra, R., Conway, J. E., Diamond, P. J., et al. 2007, ApJ, 659, 314
- Petric et al. (2015) Petric, A. O., Ho, L. C., Flagey, N. J. M., & Scoville, N. Z. 2015, ApJS, 219, 22
- Petty et al. (2014) Petty, S. M., Armus, L., Charmandaris, V., et al. 2014, AJ, 148, 111
- Piazzo et al. (2015) Piazzo, L., Calzoletti, L., Faustini, F., et al. 2015, MNRAS, 447, 1471
- Pilbratt et al. (2010) Pilbratt, G. L., Riedinger, J. R., Passvogel, T., et al. 2010, A&A, 518, L1
- Poglitsch et al. (2010) Poglitsch, A., Waelkens, C., Geis, N., et al. 2010, A&A, 518, L2
- Renzini & Peng (2015) Renzini, A. & Peng, Y.-j. 2015, ApJ, 801, L29
- Riechers et al. (2013) Riechers, D. A., Bradford, C. M., Clements, D. L., et al. 2013, Nature, 496, 329
- Riechers et al. (2014) Riechers, D. A., Carilli, C. L., Capak, P. L., et al. 2014, ApJ, 796, 84
- Rodighiero et al. (2011) Rodighiero, G., Daddi, E., Baronchelli, I., et al. 2011, ApJ, 739, L40
- Rosario et al. (2012) Rosario, D. J., Santini, P., Lutz, D., et al. 2012, A&A, 545, A45
- Roussel (2013) Roussel, H. 2013, PASP, 125, 1126
- Roussel et al. (2006) Roussel, H., Helou, G., Smith, J. D., et al. 2006, ApJ, 646, 841
- Saintonge et al. (2013) Saintonge, A., Lutz, D., Genzel, R., et al. 2013, ApJ, 778, 2
- Sakamoto et al. (1999) Sakamoto, K., Scoville, N. Z., Yun, M. S., et al. 1999, ApJ, 514, 68
- Sanders et al. (2003) Sanders, D. B., Mazzarella, J. M., Kim, D.-C., Surace, J. A., & Soifer, B. T. 2003, AJ, 126, 1607
- Sanders & Mirabel (1996) Sanders, D. B. & Mirabel, I. F. 1996, ARA&A, 34, 749
- Sanders et al. (1989) Sanders, D. B., Phinney, E. S., Neugebauer, G., Soifer, B. T., & Matthews, K. 1989, ApJ, 347, 29
- Sandstrom et al. (2010) Sandstrom, K., Krause, O., Linz, H., et al. 2010, A&A, 518, L59
- Sargsyan et al. (2012) Sargsyan, L., Lebouteiller, V., Weedman, D., et al. 2012, ApJ, 755, 171
- Schiminovich et al. (2007) Schiminovich, D., Wyder, T. K., Martin, D. C., et al. 2007, ApJS, 173, 315
- Scoville et al. (2000) Scoville, N. Z., Evans, A. S., Thompson, R., et al. 2000, AJ, 119, 991
- Simpson et al. (2015) Simpson, J. M., Smail, I., Swinbank, A. M., et al. 2015, ApJ, 807, 128
- Smolčić et al. (2015) Smolčić, V., Karim, A., Miettinen, O., et al. 2015, A&A, 576, A127
- Soifer et al. (2000) Soifer, B. T., Neugebauer, G., Matthews, K., et al. 2000, AJ, 119, 509
- Soifer et al. (2001) Soifer, B. T., Neugebauer, G., Matthews, K., et al. 2001, AJ, 122, 1213
- Stacey et al. (1991) Stacey, G. J., Geis, N., Genzel, R., et al. 1991, ApJ, 373, 423
- Sturm et al. (2011) Sturm, E., González-Alfonso, E., Veilleux, S., et al. 2011, ApJ, 733, L16
- Surace et al. (2001) Surace, J. A., Sanders, D. B., & Evans, A. S. 2001, AJ, 122, 2791
- Tacconi et al. (2010) Tacconi, L. J., Genzel, R., Neri, R., et al. 2010, Nature, 463, 781
- Tacconi et al. (2013) Tacconi, L. J., Neri, R., Genzel, R., et al. 2013, ApJ, 768, 74
- U et al. (2012) U, V., Sanders, D. B., Mazzarella, J. M., et al. 2012, ApJS, 203, 9
- van der Wel et al. (2014) van der Wel, A., Franx, M., van Dokkum, P. G., et al. 2014, ApJ, 788, 28
- Veilleux et al. (2006) Veilleux, S., Kim, D.-C., Peng, C. Y., et al. 2006, ApJ, 643, 707
- Veilleux et al. (2009a) Veilleux, S., Kim, D.-C., Rupke, D. S. N., et al. 2009a, ApJ, 701, 587
- Veilleux et al. (2013) Veilleux, S., Meléndez, M., Sturm, E., et al. 2013, ApJ, 776, 27
- Veilleux et al. (2009b) Veilleux, S., Rupke, D. S. N., Kim, D.-C., et al. 2009b, ApJS, 182, 628
- Williams et al. (2010) Williams, M. J., Bureau, M., & Cappellari, M. 2010, MNRAS, 409, 1330
- Wisnioski et al. (2015) Wisnioski, E., Förster Schreiber, N. M., Wuyts, S., et al. 2015, ApJ, 799, 209
- Wuyts et al. (2011) Wuyts, S., Förster Schreiber, N. M., van der Wel, A., et al. 2011, ApJ, 742, 96
- Younger et al. (2010) Younger, J. D., Fazio, G. G., Ashby, M. L. N., et al. 2010, MNRAS, 407, 1268
- Younger et al. (2008) Younger, J. D., Fazio, G. G., Wilner, D. J., et al. 2008, ApJ, 688, 59