Volcanoes muon imaging using Cherenkov telescopes
Abstract
A detailed understanding of a volcano inner structure is one of the key-points for the volcanic hazards evaluation. To this aim, in the last decade, geophysical radiography techniques using cosmic muon particles have been proposed. By measuring the differential attenuation of the muon flux as a function of the amount of rock crossed along different directions, it is possible to determine the density distribution of the interior of a volcano. Up to now, a number of experiments have been based on the detection of the muon tracks crossing hodoscopes, made up of scintillators or nuclear emulsion planes.
Using telescopes based on the atmospheric Cherenkov imaging technique, we propose a new approach to study the interior of volcanoes detecting of the Cherenkov light produced by relativistic cosmic-ray muons that survive after crossing the volcano. The Cherenkov light produced along the muon path is imaged as a typical annular pattern containing all the essential information to reconstruct particle direction and energy. Our new approach offers the advantage of a negligible background and an improved spatial resolution.
To test the feasibility of our new method, we have carried out simulations with a toy-model based on the geometrical parameters of ASTRI SST-2M, i.e. the imaging atmospheric Cherenkov telescope currently under installation onto the Etna volcano. Comparing the results of our simulations with previous experiments based on particle detectors, we gain at least a factor of 10 in sensitivity. The result of this study shows that we resolve an empty cylinder with a radius of about 100 m located inside a volcano in less than 4 days, which implies a limit on the magma velocity of 5 m/h.
keywords:
muon radiography , volcano structure , Imaging Atmospheric Cherenkov Telescope , Silicon Photomultiplier1 Introduction
Cosmic ray muons are created when high energy primary cosmic rays interact with the Earth’ s atmosphere (see [1] for a recent review). Muon imaging for non-destructive studies of gigantic objects arose soon after their discovery. Muon radiography was first proposed to determine the thickness of a snow horizontal tunnel on a mountain in Australia [2]. Then, in archeology, it was adopted to investigate the interior of the Egyptian pyramid of Chephren at Giza in order to find a hidden chamber [3]. Very recently the muon tomography technique has been used to inspect the content of traveling cargo containers [4]. In 2007, H. Tanaka and collaborators from the University of Tokyo were the first to apply this technique to volcanoes [10].
Volcanic eruptions occur when magma from the inner of the Earth comes out on the surface through the main conduit or conduits connecting the underground magma reservoir with the erupting crater. The eruptions comes out from the volcano’s mouth or from a number of mouths that open at different points. The duration of volcanic eruptions is variable: they may last a few hours or even decades. Although the interpretation of geophysical signals emitted from volcanic conduits such as micro-seismicity, surface deformation and gas and thermal emissions are used for eruption forecasts, only little direct information is available on the conditions inside and near the conduit of an active volcano. Improvements in measuring the size of the conduits could help in the interpretation of premonitory marks and in the risk reduction.
The density distribution of the interior of a volcano has been determined by measuring the differential attenuation of the muon flux
as a function of the amount of rock crossed along different directions.
So far, measurements in this context have been based on the detection of the muon tracks crossing hodoscopes,
made up of scintillators or nuclear emulsion planes.
However, this technique requires several detection layers and a sufficiently high timing resolution to reduce the level of fake coincidences due to the unavoidable charged particles background.
We present for the first time the feasibility study of using an imaging Cherenkov telescope to carry out the muon radiography of a volcano. We aim to apply this technique to the Etna volcano using the ASTRI SST-2M telescope currently under installation. The advantage of using Cherenkov telescopes for muon radiography is due to their imaging capability which results in negligible background and improved spatial resolution compared the traditional particle detectors.
2 Muon radiography: observational approach
Muon imaging allows us to determine the density variations in the inner structure of a volcano by measuring the differential attenuation of the muon flux.
2.1 Principles of muon imaging
The flux of atmospheric muons incoming the volcano at a given arrival direction can be determined using Monte Carlo simulation codes [5] or fitting data of experimental results obtained looking at the open sky at the same angle [6].
Any muon flux variation translates in a difference in the opacity () which is defined as:
| (1) |
where is the rock density and is the spatial coordinate measured along the trajectory of the muon crossing the rock.
The integrated cosmic muon flux after the volcano has been crossed (as a function of the opacity and of the zenith angle ) is defined as:
| (2) |
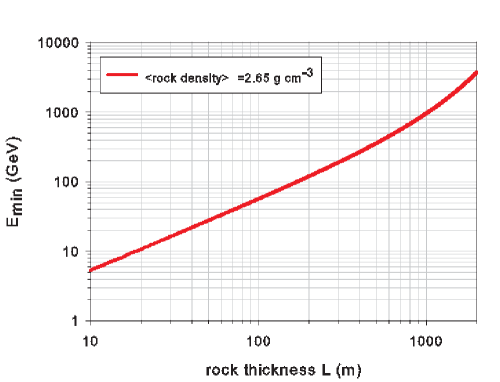
where (cm-2 sr-1 day-1 GeV-1) is the differential flux of incident muons at a given angle. The minimum muon energy () required to cross a depth of opacity is calculated using the classical definition of the average muon energy loss:
| (3) |
with MeV g-1 cm2 and g-1 cm2 [7] for a rock with standard density (2.65 g cm-3).
Using Eq. 3, the muon energy after propagation is:
| (4) |
with and the energy of the incident muon. Resolving Eq. 4 for , we obtain the minimum muon energy required to cross a depth with opacity :
| (5) |
Figure 1 shows the minimum muon energy corresponding to the propagation path in a standard density rock.
The feasibility of the muon imaging to investigate the density distribution inside a target structure can be inferred through the relation suggested and exhaustively treated in [8] :
| (6) |
with the acquisition time, , the fixed total opacity of the medium, the required resolution level, and the detector acceptance defined as:
| (7) |
where is the detector geometrical area and is the angular resolution. Density and size of the volcano inner structure can be estimated with an angular resolution driven by the detector performance.
Eq. 6 establishes a useful relationship between the acquisition time necessary to collect a statistically significant number of muons, , and the integrated flux differences of muons crossing different directions inside the target, . It is worth noting that Eq. 6 is applicable only in case of negligible background.
2.2 Experiments
The instrumental approach is currently based on the detection of muons crossing hodoscopes made up of scintillator planes. First results have been obtained by Tanaka and collaborators who carried out muon radiography of the top part of the Asama volcano in Japan and revealed a region with rock of low density on the bottom of the crater [10, 11]. They definitely demonstrated the feasibility of the method to detect both spatial and temporal changes of density inside a volcano [12, 13, 14]. Very recently, the first muographic visualisation of the dynamics of a magma column in an erupting volcano has been presented [15]. These authors performed a muon radiography of the Satsuma–Iwojima volcano showing that while the eruption column was observed, the top of the magma column reached a location of 60 m beneath the crater floor. Moreover, they proposed that the monitoring of the temporal variations in the gas volume of the magma as well as its position in a conduit could be used to support eruption prediction. Recently, a new telescope prototype has been proposed to study Mt. Vesuvius [16]. It is based on the use of bars of plastic scintillator with a triangular section whose scintillation light is collected by Wave-Length Shifting (WLS) optical fibers and transported to Silicon photomultipliers [17].
In the summer 2010, the first experiment of muon radiography at Mt Etna by using a detector employing two scintillator planes was carried out [18]. A marked difference between theoretical and observed attenuation of muons through the crater was found. This discrepancy was likely due to the bias on the observed flux, arising from false muon tracks. These are caused by muons arriving from isotropic directions and by low-energy particles of ordinary air showers that, by chance, hit simultaneously the two detector planes, leading to the detection of a false positive.
3 Muons with Cherenkov telescopes
Cherenkov light is emitted when charged particles, such as muons, travel through a dielectric medium with velocity () higher than the speed of light in that medium, i.e. where is the speed of light in vacuum and the refraction index. This implies an energy threshold for Cherekov production of GeV in the atmosphere at sea level. The light is emitted in a narrow cone with an angle cos = 1/n (v/c) around the direction of motion of the particle, in air. The Cherenkov radiation relevant for detector application occurs in the visible and ultraviolet regions of the electromagnetic spectrum.
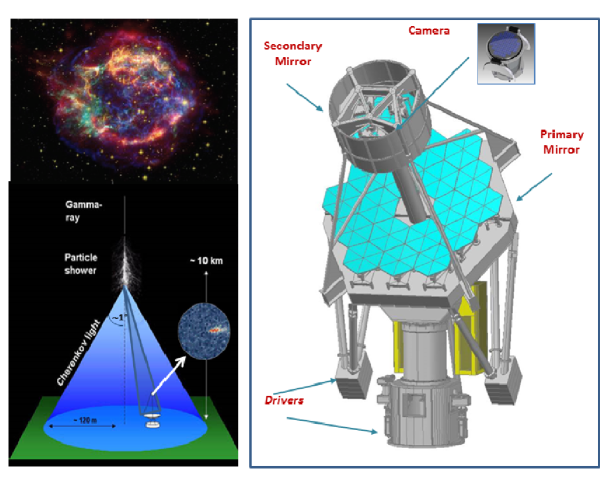
Cherenkov light produced by relativistic charged particles in a shower induced by TeV photons interacting with the Earth atmosphere allows us to study very high-energy emission (VHE; 0.1 TeV) coming from sky-sources, i.e. supernova remnants, pulsars, Active Galactic Nuclei, by using on-ground telescopes. Imaging Atmospheric Cherenkov Telescopes (IACT) have opened a window to the ground-based gamma-ray astronomy in the VHE range and continuously improves in what concerns detection performance and sensitivity, using multiple telescopes in stereoscopy (VERITAS [19], MAGIC [20], H.E.S.S. [21], currently in operation). The next generation of ground-based VHE gamma-ray instrument is the Cherenkov Telescope Array (CTA; [22]) which will provide a deep insight into the non-thermal high-energy Universe. Basically, a IACT consists of an optical system formed by highly reflectivity mirror(s), that focuses the impinging Cherenkov radiation onto a multi-pixel camera equipped with a fast read-out electronics (Fig. 2).

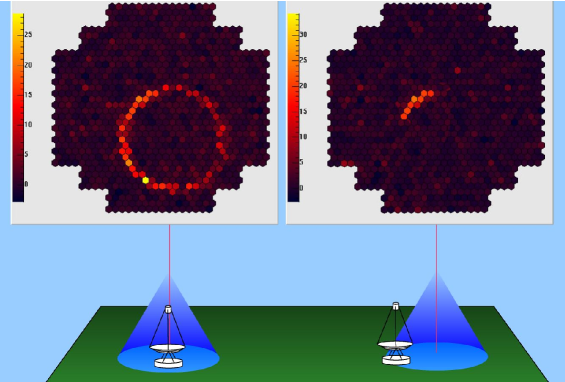
The unique characteristics of images produced by muons in IACTs make their detection an useful tool to calibrate their optical throughput [23, 24, 25, 26]. When a muon hits the mirror of an IACT, the light emitted along the final part of its path is imaged as a ring in the camera at the focal plane of the telescope ([23]; see Fig. 3). The amount of collected light mainly depends on the impact point of the muon on the telescope mirror, on the geometrical area of the entrance pupil of the telescope and on the camera efficiency.
A relatively simple geometrical analysis of the ring allows us to reconstruct the muon physical parameters, i.e. its energy and arrival direction. The position of the centre gives the muon arrival direction respect to the telescope optics axis. The radius of the ring corresponds to the Cherenkov angle () that depends on the energy of the muon () according to the formula:
| (8) |
It results that the Cherenkov angle saturates with the increasing particle energy. At an observation altitude of 1800 m, the Cherenkov angle saturation occurs at an energy higher than 50 GeV.
3.1 ASTRI SST-2M
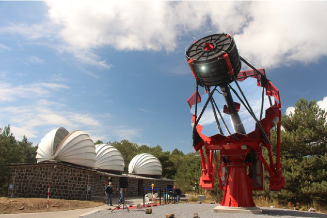
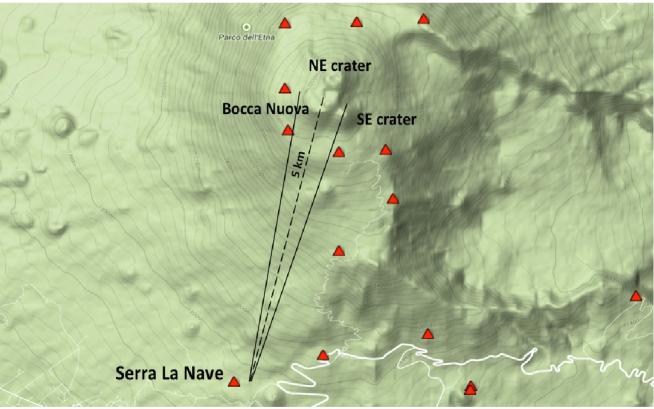
ASTRI (Astrofisica con Specchi a Tecnologia Replicante Italiana) is a flagship project of the Italian Ministry of Education, University and Research, led by the Italian National Institute of Astrophysics (INAF) and developed in the framework of the ambitious CTA project. The first task of the ASTRI project is the realisation of an end-to-end telescope prototype that has been proposed for the small-size class telescopes of the CTA. These will be devoted to the investigation of the sky in the energy range from a few TeV up to more than 100 TeV. The prototype, namely ASTRI SST-2M, is characterised by a dual-mirror Schwarzschild-Couder optical design [27], adopted for the first time on a Cherenkov telescope and by an innovative modular camera at the focal plane managed by a very fast read-out electronics [28]. The primary mirror of the telescope has a 4.2 m diameter and is composed by an array of hexagonal tiles, while the secondary optics is a monolithic 1.8 m diameter mirror [29]. The camera consists of a matrix of Silicon Photomultiplier (SiPM) sensors covering a 9.6∘ full field of view (FOV) [30], with a pixel solid angle of deg2, and a Point Spread Function (PSF), defined as the 80% of the light collected from a point like source, contained in one pixel. In Fig. 2 (right), we show a sketch of the working principle of ASTRI SST-2M. During Autumn 2014, ASTRI SST-2M has been inaugurated at the INAF ”M.C. Fracastoro” observing station [31, 32] located in Serra La Nave (Mount Etna, Sicily; Fig. 4). At the time of this paper writing, the telescope structure, mirrors and control software are installed; as soon as the camera is mounted, the telescope will be operative. The main aim of this prototype is to characterise the performance of such a telescope by observing the Crab nebula and two Markarian galaxies (Mrk421, Mrk501).
The location on Mt. Etna will offer us the opportunity to test through real data the use of a Cherenkov telescope for the volcano muon radiography. ASTRI SST-2M will be able to detect muons by collecting in a single ring the light emitted along the last 100 m of its path towards the primary mirror. According to our simulations, ASTRI SST-2M will be able to reconstruct muons with a precision on the direction of about 0.14∘, if the muon energy is higher than 20 GeV and the muon hits the primary mirror up to an off-axis angle of 3.6∘ [33].
4 Muon radiography of Mt Etna with Cherenkov light: simulations
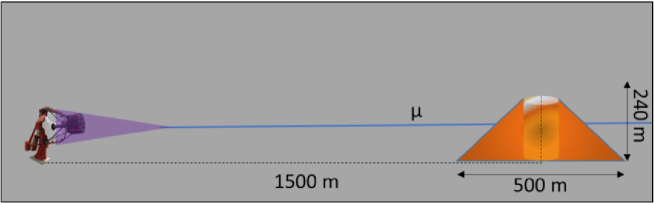
To study the feasibility of detecting muons crossing the Mt Etna by Cherenkov light, we carried out simulations with a toy model based on the ASTRI SST-2M geometrical parameters and simplified shapes for both the volcano and its conduit. In order to have the whole Mt Etna within the FOV of the telescope, the distance between telescope and volcano has been set at 1500 m (Fig. 5).
With our set-up the background is due to muons hitting the primary mirror with an incidence angle within the FOV and not coming from the mountain. These events, mainly back-scattered from the ground, would produce a ring and cannot be discriminated by the useful signal. Assuming the ground level measurement of upward directed atmospheric muons of 3 cm-2 sr-1 day-1 (see Fig. 3.79 in [34]), a rough estimation of the level of this muon background results in a rate of about 3 ”fake” events per observation night within the field of view of ASTRI SST-2M.
4.1 Experimental set-up
The volcano geometry is represented by a simple cone of base 500 m and height of 240 m roughly corresponding to the dimensions of the South-Est (SE) mouth of the Etna volcano. Conduits of various dimensions are simulated as hollow cylinders embedded into the cone with axis coincident with that of the cone. The cone is extended with an elevation angle between 90∘ (cone base) and 80.4∘ (cone summit) with the telescope optical axis pointing towards the half height of the cone axis (Fig. 5). The cone has been segmented with bins of 0.17, corresponding to the camera pixel angular size, although the actual ASTRI SST-2M resolution for muon reconstruction direction is about 0.14∘ [33]. According to this geometry, the projected spatial resolution referred to the axis cone is about 4.5 m.
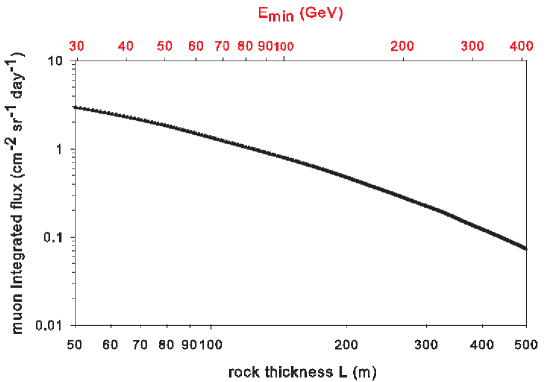
We assume the integrated flux () computed by [8], for =85∘ and for a density typical of the standard density rock, expressed as a function of the crossed thickness (Fig. 6). The integrated flux is calculated starting from the Reyna-Bugaev model which allows to compute the differential flux of incident muon, , for all zenith angles and a wide energy range [8]. The feasibility condition is established by Eq. 6 which sets the minimum time to resolve the average density distribution inside the target. In the ASTRI SST-2M case the bin acceptance () is 1 cm2 sr.
4.2 Results
The integrated flux of simulated muons crossing each bin has been recorded both for the full cone and for the hollow cylinder and Eq. 6 has been applied. We have then performed a grouping as 33 bins, corresponding to a new positioning resolution of 13.5 m and an acceptance of 9 cm2 sr. This allowed us to obtain a better statistics, to reach a telescope acceptance similar to that of a previous experiment [18], and to have pixel size comparable with the muon angular deviation expected from multiple scattering in crossing the mountain [1]. Note that the scattering inside the volcano depends on the energy of the muon. Therefore, muon angular reconstruction can be improved by selecting events in energy. From our simulations it results that the scattering effect is negligible for reconstructed energies higher than 30 GeV at the base of the volcano and higher than 5 GeV on the top.
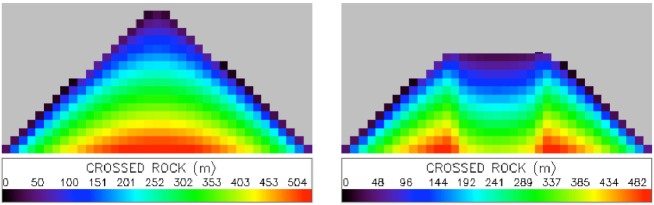
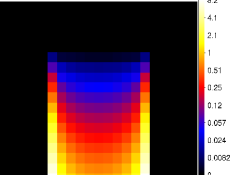
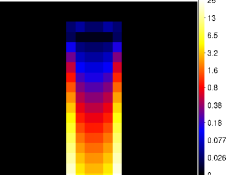
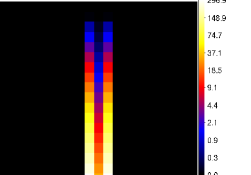
Figure 7 shows the length distribution of the crossed rock for the full cone and for the cone with an empty cylinder inside (diameter D = 144 m). The reduction in the crossed rock paths along the cone axis where the hollow cylinder is positioned is well evident (right panel).
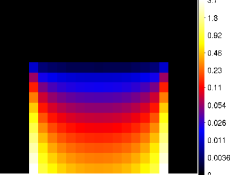
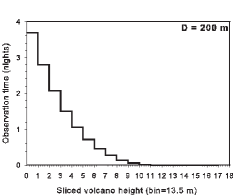
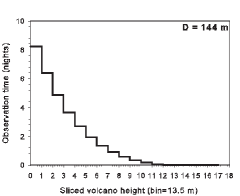
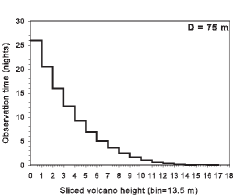
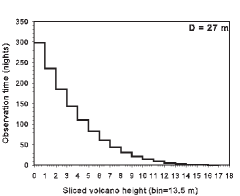
Assuming as mean duration of 1 night 8 hr, the minimum number of observation nights necessary to resolve the difference in opacity (at a confidence level of 68%) for cylinders of various dimensions (200, 144, 75, and 27 m diameter) is shown in Figures 8. Figure 9 shows the minimum number of observation nights (Nn) as a function of the conduit diameter. The best fit model of the data is a power-law Nn=k D-γ where k and . It is clear that increasing the number of observation nights will allow us to evaluate the difference in opacity with a higher confidence level and to map the interior of the volcano within the limit of the telescope resolution.
Similarly, an additional telescope installed in the same site will split in half the observing time necessary to reach the results presented above and will increase the sensitivity by a factor of .
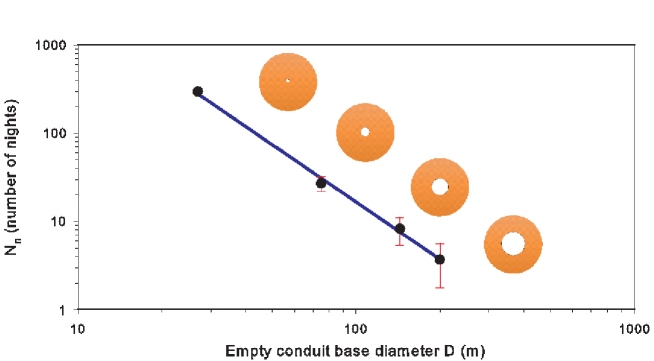
The capability to detect the magma filling the conduit is limited by the minimum number of observation nights. As an example, for a 200 m diameter conduit having a height of H=135 m, we obtain from our simulations that a minimum of 3.7 nights (Fig. 8) is necessary to resolve the entire conduit. This value corresponds to a limit average velocity of the magma as v = H/ =135 m /3.7 nights 5 m/h. For comparison, the rising magma velocity measured by [15] for the Satsuma-Iwojima volcano is about 10-30 m/day.
Finally, we have compared the sensitivity of our instrument with the Tanaka experiment. The sensitivity is given by:
| (9) |
where and are the source and background flux, respectively, and is the observing time. Assuming the background an acceptance reported in [15] ( cm-2 sr-1 day-1 and 3650 cm2 sr, respectively) and the ASTRI SST-2M values reported in this paper ( cm-2 sr-1 day-1 and 2860 cm2 sr), we roughly estimate that we gain a factor of ten in sensitivity compared with the experiment performed by [15]. It is worth noting that the sensitivity comparison between the two experiments takes also into account that the Tanaka particle detector can observe even during the day.
5 Validation of the method using ASTRI SST-2M
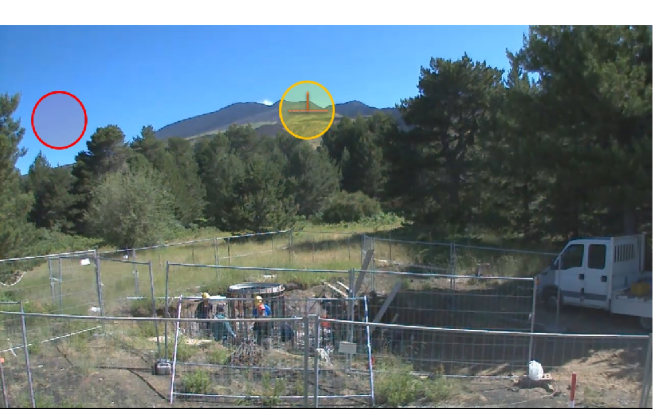
When operative, ASTRI SST-2M will be able to test the new method we have proposed for volcano muon radiography. The ASTRI SST-2M telescope can be pointed towards the volcano peak located at distance of about 5 km, catching into a single view the entire main crater area as shown in Figure 10 (top). The Etna volcano has a base diameter of about 40 km and a height of about 3350 m. One of the active craters (SE Crater; see Fig. 10, bottom) in the summit area of the volcano will be the target of our experiment of muon radiography. Muon particles crossing the Etna’s SE crater and reaching ASTRI SST-2M would have a zenith angle of about 76∘ and would cross up to 500 m of rock.
The ASTRI SST-2M location allows us to perform the radiography of the volcano with a spatial resolution of about 15 m. Considering the total ASTRI SST-2M acceptance cm2 sr, where the collecting area of the telescope is 13 m2 and the half FOV is 4.8∘, a total of 5000 muons/night, including those arriving from open sky, are expected to hit the telescope mirror.
A preliminary measurement of muon flux will be carried out pointing the telescope to the open sky at equal elevation angle as the volcano (Fig. 10), bottom) and compared with the flux measured pointing to the volcano. The ratio between the two fluxes gives the estimate of muon attenuation inside the volcanic structure.
6 From muon radiography to muon tomography
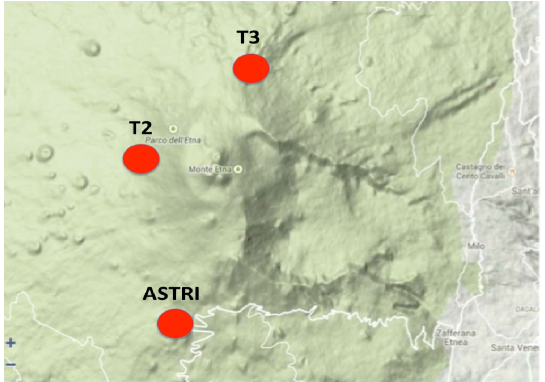
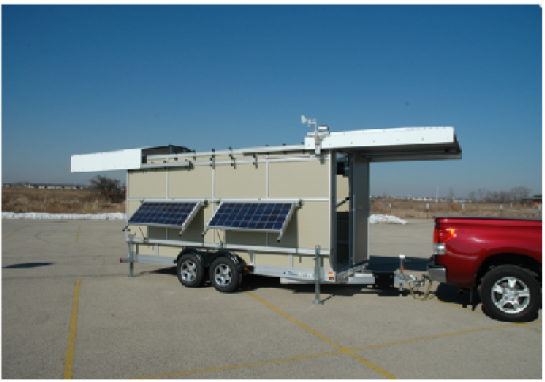
Our simulations have shown that muon radiography using Cherenkov technique will allow us to measure, with higher resolving power and negligible background, the internal density structure of volcanoes. Measuring the muon flux absorption as a function of the muon direction resolves only the average density distribution along individual muon paths. Obviously, several telescopes at different position around the volcano would be required to distinguish between an empty cavity or a relatively low density region. Multidirectional radiography (tomography) can resolve the exact position of the density anomaly, its shape and its alignment by superimposing images obtained by each telescope and producing three dimensional images of the region of interest. For muon tomography, the ASTRI SST-2M telescope should be complemented with at least two other Cherenkov telescopes. Such telescopes do not need to be ASTRI-like and do not need either a pointing system or a double mirror. They will be dedicated only to the detection of muon rings and designed for this purpose. The additional two telescopes may be installed on mobile vehicles and solar powered, so that they can be positioned in desired areas and operated remotely (Fig. 11, bottom). The three telescopes have to be located around the Etna volcano on the vertex of a triangle containing the volcano (Fig. 11, top). Such an array of telescopes exploiting the -Cherenkov technique could make the difference in the field of volcano tomography and open a new frontier in volcanology.
7 Conclusions
Mapping the interior of active volcanoes could help to interpret warning signs and improve prevention for volcanic events. Far to be exhaustive in all its part, this paper covers the main feasibility aspects of the new proposed method for Cherenkov muon imaging applied to volcanology. Our toy-model simulations show that we gain at least a factor of ten in sensitivity when comparing with previous experiments.
We will be able to test this method with ASTRI SST-2M thanks to its favoured position on the Mt Etna. However, we hope that a configuration with more than one telescope, allowing also for muon tomography, can be achieved and supported by the field experts at large.
Acknowledgements
This work was partially supported by the ASTRI Flagship Project financed by the Italian Ministry of Education, University, and Research (MIUR) and led by the Italian National Institute of Astrophysics (INAF). We also acknowledge partial support by the MIUR Bando PRIN 2009 and TeChe.it 2014 Special Grants. We area grateful to the entire ASTRI collaboration and to the INAF HQ for encouraging the present work. We thanks the colleagues of the Catania Astrophysical Observatory-INAF and of the Etna Regional Park for many useful discussions.
References
References
- [1] K. Nagamine, 2003, Introductory Muon Science, Cambridge University Press, Cambridge, 208pp
- [2] E. P. George, 1955, Commonwealth Engineer, 455, 457.
- [3] L.W. Alvarez, et al., Science, 167 (1970) 832
- [4] P. La Rocca et al., Nucl. Instrum. and Meth. A, 787, 236
- [5] D. Heck, et al., 1998, Forschungszentrum Karlsruhe Report FZKA, 6019
- [6] E. V. Bugaev, et al., 1998, Phys. Rev., 58, 05400
- [7] R. Darijani, et al. , 2014, Ind. Journ. of Pure & Applied Physics, 52, 7
- [8] N. Lesparre, et al., 2010, Geophys. J. Int., 183, 1348
- [9] H. J. Voelk & K. Bernloehr, 2009, Exper. Astron., 25, 173
- [10] H.K.M. Tanaka, et al., 2007, Earth planet. Sci. Lett., 263,104
- [11] H.K.M. Tanaka, et al., 2009, Geophys. Res. Lett., 36, L01304
- [12] Nagamine, K., et al., 1995, Nucl. Instrum. Methods, 356, 585
- [13] H.K.M. Tanaka, et al., 2001, Hyperfine Interact., 138, 521
- [14] H.K.M. Tanaka, et al., 2003, Nucl. Instr. and Meth. A, 507, 657
- [15] H.K.M. Tanaka, et al., Nature Comm. 5 (2014) 3381
- [16] G. Ambrosi, et al., 2011, Nucl. Instr. and Meth. A, 628, 120
- [17] A. Anastasio, et al., 2013, Nucl. Instr. and Meth. A, 718, 134
- [18] D. Carbone, et al., 2013, Geophys. Jou. Int, 58, 054001
- [19] T.C. Weekes, et al., 2002, Astroparticle Physics, 17, 221
- [20] Tridon, D. B., et al., 2010, NIMPA, 623, 437
- [21] W. Benbow, AIP Conference Proceedings, 745, 2005, 611
- [22] M. Actis, et al., 2011, Exp. Astronomy 32, 193
- [23] G. Vacanti, et al.,1994, APh, 2, 1
- [24] Rovero, A. C., et al., 1996, Astrop. Phys., 5, 27
- [25] Meyer, M., et al., 2005, American Institute of Physics Conference Series, 745, 774
- [26] Bolz, O., 2004, Ph.D. thesis, Karl-Ruprecht University, Heidelberg, Germany
- [27] S. Vercellone, et al., 2013, Fermi Symposium proceedings, arXiv:1303.2024
- [28] O. Catalano, et al., 2014, Proc. of the SPIE, 9147, 91470
- [29] R. Canestrari, et al., 2014, Proc. of the SPIE, 9145, 91450
- [30] O. Catalano, et al., 2013, Proc. 33rd ICRC2013, arXiv:1307.5142
- [31] M. C. Maccarone, et al., 2013, Proc. 33rd ICRC, arXiv:1307.5139
- [32] G. Leto, et al., 2014, Proc. AtmoHEAD Workshop 2013, arXiv:1402.3515v1
- [33] E. Strazzeri, et al., 2013, Proc. of the 33rd ICRC, arXiv:1307.5204
- [34] P. K. F. Grieder, 2001, Cosmic Rays at Earth: Researcher’s Reference Manual and Data Book, Eds. Elsevier