Molecular Gas and Star Formation Properties in the Central and Bar Regions of NGC 6946
Abstract
In this work, we investigate the molecular gas and star formation properties in the barred spiral galaxy NGC 6946 using multiple molecular lines and star formation tracers. High-resolution image (100 pc) of 13CO (1-0) is created by single dish NRO45 and interferometer CARMA for the inner 2 kpc disk, which includes the central region (nuclear ring and bar) and the offset ridges of the primary bar. Single dish HCN (1-0) observations were also made to constrain the amount of dense gas. Physical properties of molecular gas are inferred by (1) the Large Velocity Gradient (LVG) calculations using our observations and archival 12CO (1-0), 12CO(2-1) data, (2) dense gas fraction suggested by HCN to 12CO (1-0) luminosity ratio, and (3) infrared color. The results show that the molecular gas in the central region is warmer and denser than that of the offset ridges. Dense gas fraction of the central region is similar with that of LIRGs/ULIRGs, while the offset ridges are close to the global average of normal galaxies. The coolest and least dense region is found in a spiral-like structure, which was misunderstood to be part of the southern primary bar in previous low-resolution observations. Star formation efficiency (SFE) changes by 5 times in the inner disk. The variation of SFE agrees with the prediction in terms of star formation regulated by galactic bar. We find a consistency between star-forming region and the temperature inferred by the infrared color, suggesting that the distribution of sub-kpc scale temperature is driven by star formation.
Subject headings:
galaxies: individual: NGC 6946. – galaxies: ISM. – ISM: molecules – galaxies: star formation1. Introduction
Star formation process is intimately related to the physical properties of molecular gas. Physical conditions of molecular gas determine whether stars can form. For example, observations of Galactic molecular gas show that star formation are often associated with dense gas (Lada, 1992). This is true even for the galactic-scale observations as reported by Gao & Solomon (2004). After the stars form, they heat and recycle materials back into the surrounding molecular gas, reform the gas by which star formation cycle can start again (e.g., Oey & Massey, 1995; Deharveng et al., 2005; Schneider et al., 2012).
In addition to the local gas conditions, extragalactic observations have shown increasing signs that molecular gas and star formation are aware of their galactic-scale environments. Dynamical properties of galaxies (e.g., bar and spiral arms) are responsible for redistributing molecular gas, controlling their formation, evolution and ability of star formation (Leroy et al., 2008; Koda et al., 2009; Momose et al., 2010; Watanabe et al., 2011; Hughes et al., 2013; Huang & Kauffmann, 2015). This is in contrast to previous studies, which generally find that star formation process are remarkably similar across galactic regions and galaxies (e.g., Blitz et al., 2007; Bolatto et al., 2008; Lada et al., 2012; Donovan Meyer et al., 2013).
To date, studies of extragalactic molecular gas have mostly used single molecular line of 12CO because the excitation conditions of this strong line are easily met. However, the low-density tracer alone is not sufficient to estimate properties that are more intimately related to star formation, e.g., temperature and dense gas fraction. Multi-molecular lines diagnosis is therefore indespensible to explore the relation of molecular gas, star formation, and galactic structures to a greater extent.
In this work, we investigate the physical properties of molecular gas and star formation activity in NGC 6946. These are done by analysing the newly observed isotopic molecule 13CO (1–0) (100 pc resolution) and dense gas tracer HCN (1–0), along with other archival molecular data in 12CO (1–0), (2–1) and star formation tracers in optical and infrared wavelengths. This is the first time that this galaxy has been observed in 13CO with high resolution, and one of the very few galaxies that we can perform isotopic line mapping down to this scale.
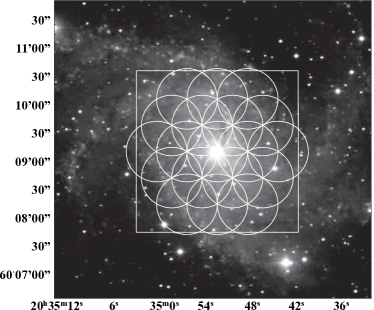
NGC 6946 is chosen for this work for a number of reasons. The galaxy is close by at 5.5 Mpc (Tully, 1988), allowing us to observe in high resolution. The face-on galaxy provides excellent viewing perspectives on the galactic structures (Figure 1). The adopted position angle (P.A.) and inclination are 243∘ and 33∘, respectively (Walter et al., 2008). The galactic disk is characterized by four flocculent spiral arms, three bars and a circumnuclear ring (Schinnerer et al., 2006; Fathi et al., 2007). The outermost oval has radius of 7.3 kpc. The dim dust lane (or “offset ridge” towards the downstream of the galactic rotation) of the northern primary bar ( 1 kpc) is seen in Figure 1, while the southern dust lane is not clear. Inner region of the primary bar is connected to the nuclear bar with length of 400 pc. The nuclear bar wraps around the starburst nucleus, forming a circumnuclear ring with diameter of 20 pc. The disk instability and the formation of these structures have been studied through Toomre-Q parameter (Ferguson et al., 1998; Meier & Turner, 2004; Leroy et al., 2008; Romeo & Falstad, 2013; Romeo & Fathi, 2015). Data in optical and infrared available makes the galaxy an prime target to retrieve insight in the gas and star formation properties.
This paper is organized as follows. The new observations (molecular lines) and archival data (molecular lines and star formation tracers) are introduced in Section 2. Results of the new observations and line ratios are presented in Section 3. Galactic regions of interest are defined in Section 4. Section 5 presents the derivation of physical properties of molecular gas. Radial star formation efficiency is discussed in Section 6. Finally, the main points of this work is summarized in Section 7.
2. Data
We analyze multiple molecular line transitions for investigations of physical properties of molecular gas and optical and infrared emissions for tracing star formation activities. We discuss our observations of 13CO (1–0) and HCN (1–0) line emission in Section 2.1 and 2.2, respectively. For 13CO (1–0), we combine single-dish observations (Section 2.1.1) and interferometric observations (Section 2.1.2). Their combination scheme is discussed briefly in Section 2.1.3. The HCN (1–0) data are from single-dish observations alone.
Archival multi-wavelength data are also used in our analyses and are presented in Section 2.3. Table 1 presents a summary of the data used in this study. In Section 2.4, we will discuss physical properties that each of these emissions trace to guide readers.
[b] Transitions/Wavelengths Telescopes (Year/Project) Observing modes Resolutions References 12CO (1–0) NRO45 (2008–2010) mapping 20 Donovan Meyer et al. (2012) 12CO (1–0) CARMA (CANON) mapping 3.2 Donovan Meyer et al. (2012) 12CO (2–1) IRAM30 (HERACLES) mapping 13.6 Leroy et al. (2009) 13CO (1–0) NRO45 (2013) mapping 20 This work 13CO (1–0) CARMA (CANON) mapping 3.8 This work HCN (1–0) NRO45 (2013) single point 19 This work 24 m Spitzer (SINGS) mapping 5.7 Kennicutt et al. (2003) 70 and 160 m Herschel (KINGFISH) mapping 5 and 12 Kennicutt et al. (2011) H KPNO (SINGS) mapping 3 Kennicutt et al. (2003)
-
OTF observations.
-
After combing with single dish data.
-
Position-switch observations.
2.1. 13CO (1–0) Observations and Data Reduction
Among the three data of 13CO from the NRO45, CARMA observations, we refer the combined data cube as the cube (or data or map) in this study. The other two will be referenced explicitly as CARMA data and NRO45 data.
2.1.1 Single Dish Observations
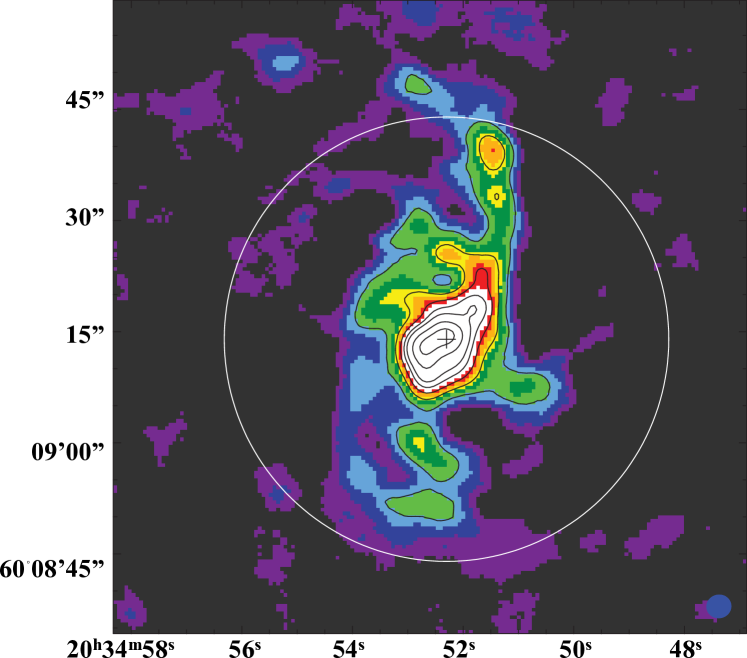
The single dish observations of 13CO (1–0) (hereafter 13CO) were made with the Nobeyama Radio Observatory 45m telescope (NRO45)111Nobeyama Radio Observatory is a branch of the National Astronomical Observatory of Japan, National Institutes of Natural Sciences. in January – February 2013. The observations cover a 160 160 area with P.A. 0∘, centering at the galactic center (see the box in Figure 1). The observed area includes important galactic structures, such as the galactic center, galactic bar, and the inner parts of spiral arms. The effective beam size of NRO45 is 20 at 110.2 GHz for the On-the-Fly mapping mode (Sawada et al., 2008), which ensures an accurate relative flux calibration over the map.
The dual-polarization receiver TZ (Asayama & Nakajima, 2013; Nakajima et al., 2013) was connected to the digital spectrometer SAM45 (Spectral Analysis Machine for the 45m telescope). We observed with a frequency resolution of 488.28 kHz (1.3 km s-1 at 110 GHz) and an effective bandwidth of 1600 MHz (4356 km s-1). Typical system noise temperature () was 160 – 180 K.
Each OTF map contains 33 scans in x- or y-directions and took the total of about 31 minutes. Each scan was 20-second long with an interval of adjacent scans of 5. An OFF point 8 away from the map center was observed every two scans for the standard ON-OFF calibration. Each ON-OFF cycle (ON-ON-OFF) took 1.5 minute. Before the observation of each map, we corrected telescope pointing by observing a point source, the SiO maser T-Cep. The pointing observations were performed at 43 GHz with receiver S40. In addition, the Galactic object S140X was observed at the frequency of 13CO (1–0) for intensity calibration once per day. By adding up all OTF maps, the total observing time is 60 hours, including the overheads.
Data reduction was carried out with the package NOSTAR, which was developed for OTF data of NRO45 (Sawada et al., 2008). We subtracted the spectral baseline with a one-order polynomial fit and flagged bad scans identified by eye. OTF maps with the same scan direction (either x- or y-scan) are combined with a grid size of 6, creating two data cubes in the FITS format (x and y maps). Finally, PLAIT algorithm was applied to the two cubes to combine them to produce a final NRO45 cube. This algorithm reduces scanning effect significantly. The final NRO45 cube has the pixel scales of 6 and 2.6 km s-1 with the RMS noise of 12.1 mK in . We adopt the main beam efficiency of 40% for the conversion from the antenna temperature to the main beam temperatures , i.e., .
2.1.2 Interferometric Observations
Observations with the Combined Array for Research in Millimeter-wave Astronomy (CARMA) were made in February – May 2009 as a part of the CARMA-Nobeyama Nearby-galaxies (CANON) CO(1-0) survey (Koda et al. in prep.). Some results from the 12CO (1–0) emission were published in Donovan Meyer et al. (2012). The CANON observations included the 13CO (1–0) line emission in the lower-side band of receiver, and hence 13CO (1–0) and 12CO (1–0) were observed simultaneously.
CARMA consists of six 10 m and nine 6 m antennas. We employed the nineteen-point hexagonal mosaic displayed in Figure 1, which covers the central part of NGC 6946. The resultant size of the map is about 160 in diameter ( 4.3 kpc), with the sensitivity uniform up to about 120 in diameter (the central seven pointings) and then declining to 1/2 at the 160 in diameter.
Three narrow bands were used in the observations of 13CO (1–0), resulting in the total bandwidth of 108 MHz. The velocity channel width is 2.6 km s-1. The total on-source integration time was about 21 hours including calibrators (Donovan Meyer et al., 2012). Bandpass, gain, and flux calibrators are 1715+096, 2015+372, and MWC349, respectively.
The CLEAN procedure is employed for deconvolution using the MIRIAD package (Sault et al., 1995). 13CO emission is often faint, and applying a spatial mask at prospective emission regions usually helps the deconvolution process. Since 12CO is much stronger than 13CO, we expect 12CO emission always associated with 13CO emission. We therefore made a map of 12CO first, made a mask in channel maps, and used the mask in CLEANing the 13CO map. The final cubes of 13CO has a velocity width of 10 km s-1 and the RMS noise of 11 mJy beam-1. The beam size is 329 308 (89 pc 83 pc) with P.A = -71.81∘.
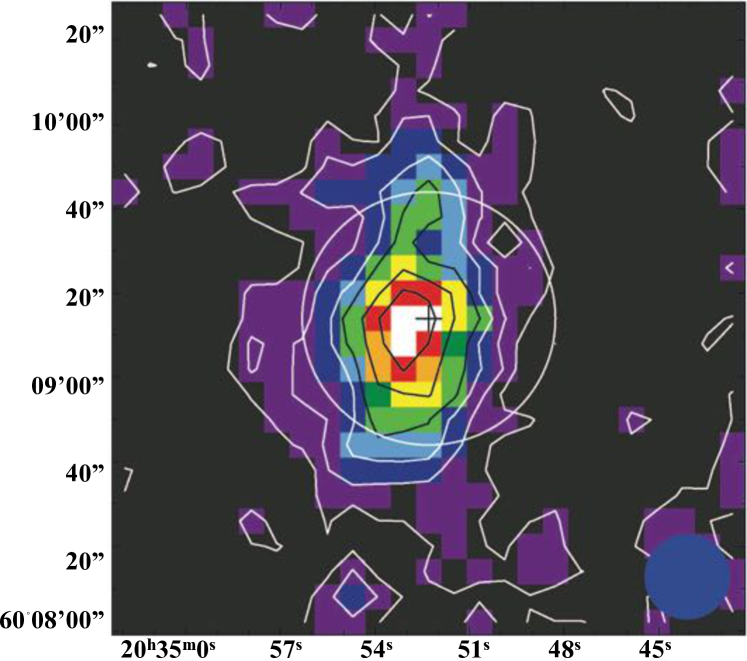
We first compare the maps from NRO45-alone and CARMA-alone. The integrated intensity maps of 13CO created from NRO45-alone and CARMA-alone data are presented in the upper-left, upper-right panel of Figure 2, respectively. Note that the NRO45 map covers a larger area to show a larger extent of 13CO emission. Overall, NRO45 and CARMA capture similar structures with some differences due to the different spatial resolution ( vs ) and the sensitivity to extended components. The 13CO emission appears to extend over about 60 (RA DEC directions) in the low resolution NRO45 map, which is resolved into more detailed structures in the CARMA-alone map.
2.1.3 Combination Procedure of 13CO data
We followed Koda et al. (2011) to combine the single-dish and interferometer 13CO data. We converted the NRO45 map into visibility data points, and then inverted the CARMA plus NRO45 visibilities together to make dirty channel maps. We flagged the baselines 4k ( 10 m) from the NRO45 visibilities because the NRO45 data become noisier at the longer baselines and CARMA covers the long baselines sufficiently. The dirty maps were CLEANed with MIRIAD. The final combined cube has the velocity resolution of 10 km s-1 with the noise level of 14 mJy beam-1. The synthesized beam is 384 361 (103 pc 97 pc) with P.A = -71.85∘.
2.1.4 Flux Recovered in the Combined Map
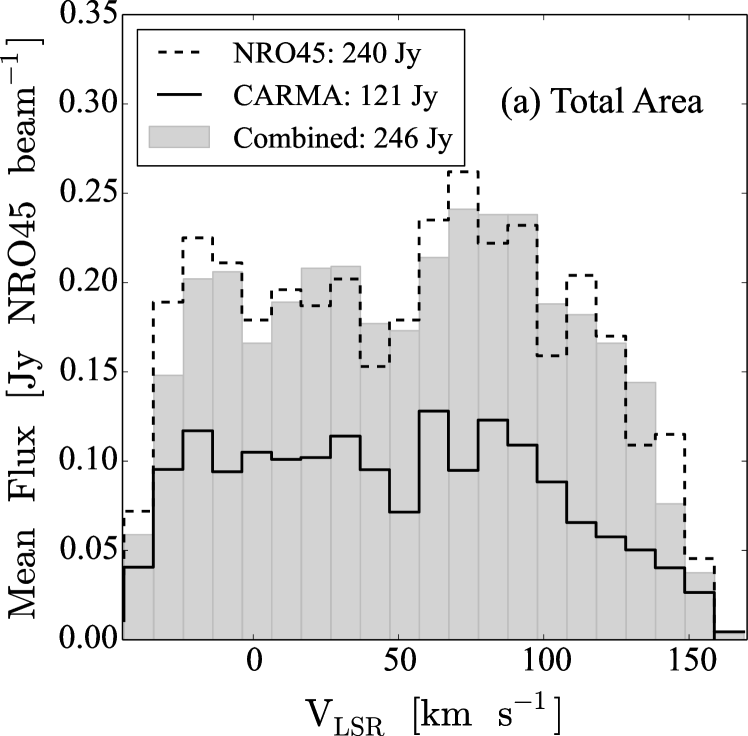
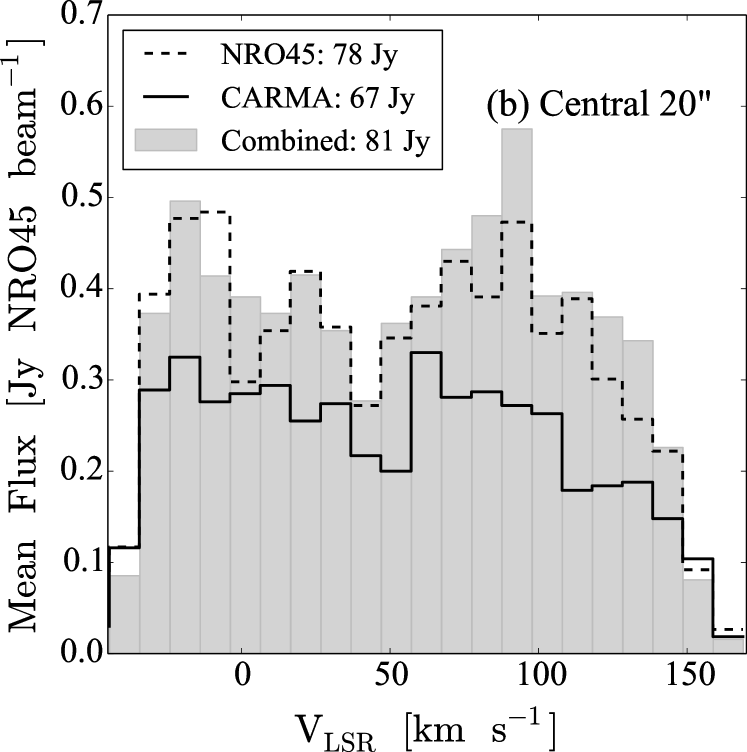
The fluxes are very consistent between the NRO45 and CAMRA+NRO45 cubes. To compare the two, we smoothed the combined cube to the 20 resolution, the same as that of the NRO45 cube. Figure 3(a) compares the average spectra over the central rectangle area (30 70) stretched along the bar (north-south direction). Thick-line, thin-line, and shadowed histograms show the spectra of the CARMA, NRO45, and CARMA+NRO45 cubes, respectively. The NRO45 and CARMA+NRO45 spectra are very similar overall, while the CARMA spectrum has the flux only about 50% of the NRO45 one. The total integrated flux of the NRO45 and CARMA+NRO45 cubes are about 240 Jy, while the CARMA data has the total flux of 120 Jy, again only 50%; therefore, the combination of interferometer and single-dish data is very important. Figure 3(b) also shows a similar comparison, but within a 20 aperture at the center. The recovered flux by CARMA-alone is 80% in total flux with respect to NRO45.
2.2. HCN (1–0) Observations and Data Reduction
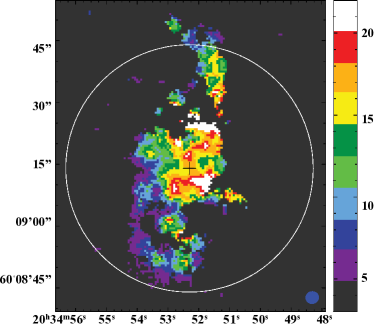
Observations in HCN(1-0) were carried out in January 2013 using NRO45. We observed only three selected positions in the HCN(1-0) line emission, because this emission is weak (e.g., 0.3 in galactic disks; Matsushita et al., 2010). These pointed observations reveal the amount of dense gas in the regions of interest. The three positions are the galactic center at (, +60914), and two off-center regions at (, +60938) and (, +60855) (circles in the lower-left panel of Figure 2).
We used the receiver TZ and spectrometer SAM45 and employed the position-switch mode of observations. The frequency resolution is 488.28 kHz (1.6 km s-1 at 88.6 GHz), and the effective bandwidth of 1600 MHz ( 5416 km s-1). An OFF point 8 away from the target was observed every 15 seconds for the ON-OFF calibration. We checked telescope pointings every 45 minutes with the SiO maser T-cep. was about 140 K during the observations. A standard flux calibrator S140 was observed once per day. The total on-source integrated time is about one hour at each position. The NRO45 beamsize at the HCN (1–0) frequency is about 19, roughly comparable to the beamsize at CO of 20 after regridding (smoothing) the OTF data onto the grid of the final data cube.
Data reduction was carried out with the NEWSTAR package developed at the Nobeyama observatory. We subtracted spectral baselines from each spectrum using a linear fit and flagged some bad spectra (with non-flat baselines). We binned the spectra, and the final spectra have a velocity resolution of 13 km s-1. We detected the emission from the galactic center at an 18 significance, and 5 – 6 significance at the off-center regions.
2.3. Archival Data
We analyze 12CO (1–0), 12CO (2–1), 13CO (1–0), HCN (1–0), 70m, and 160m to probe physical conditions of molecular gas in NGC 6946. The 13CO (1–0) and HCN (1–0) emission data are from our own observations as discussed above, and 12CO (1–0) and 12CO (2–1) are obtained from the CARMA-Nobeyama Nearby-galaxy Survey (CANON; Koda et al. in prep.; Donovan Meyer et al., 2012) and The HERA CO-Line Extragalactic Survey (HERACLES; Leroy et al., 2009), respectively.
To investigate star formation activities, we use the archival data of Spitzer 24 and H recombination line emissions. The 24m and H images are taken from the Spitzer Infrared Nearby Galaxies Survey (SINGS; Kennicutt et al., 2003). We also use the 70 m and 160 m images from the Key Insights on Nearby Galaxies: a Far-Infrared Survey with Herschel (KINGFISH; Kennicutt et al., 2011) to infer the trend of temperature of dust and gas.
2.4. Physical Properties Traced by Each Emission
This study compares multi-wavelength data to investigate the physical conditions of gas and star formation activities in NGC 6946. It is perhaps useful to summarize what each of these multi-wavelength data traces physically.
2.4.1 Molecular Line Emissions
The 12CO(1-0) line is often used to trace the amount of bulk molecular gas. 12CO is the second most abundant molecule after H2. The temperature equivalent to the first energy level of rotational transition is 5.5 K, therefore the level is always populated very well for the the typical temperature of molecular gas ( 10 K). Its typically high opacity prevents photons escaping efficiently from the emitting area, which drops the effective critical density for excitation low (; Scoville & Solomon, 1974). The average density within molecular clouds is comparable to this density (Solomon et al., 1987) and therefore, the bulk of molecular gas within molecular clouds emits 12CO(1-0) emission efficiently.
The temperature equivalent to the energy level is K, slightly above the typical gas temperature, and hence 12CO (2–1) is sensitive to slight enhancements in gas temperature or density of the bulk molecular gas (Koda et al., 2012). 12CO(1-0) is often used as a tracer of molecular gas mass (Bolatto et al., 2013, and references therein), even though 12CO is generally optically thick. The velocity dispersion of molecular clouds is almost always larger than the thermal line width, and in fact, this optically-think line can trace the entire volume within the clouds, and thus their mass. We use the 12CO(1-0) emission for calculation of molecular gas mass.
The 13CO (1–0) emission (hereafter 13CO) is also used to trace bulk molecular gas. It is typically optically-thin, compared to 12CO(1-0), and therefore, its effective critical density () is an order of magnitude greater than that of 12CO, tracing slightly denser gas. Abundance ratio of 12CO to 13CO is about 40 – 60, therefore 13CO emission is significantly weaker than 12CO.
The HCN (1–0) emission (hereafter HCN) is often used as a tracer of star-forming dense cores within molecular clouds. It has a high critical density ( 105-6 cm-3), and the HCN emission, even unresolved, should be coming selectively from the very dense regions within molecular clouds. The connection between these dense regions and star formation activities are seen in the linear correlation between HCN and tracers of star formation rate. We use HCN to constrain the amount of dense gas. Enhanced HCN emission around AGNs (e.g., Imanishi et al., 2007; Izumi et al., 2013) may be a source of confusion when the galactic center is the focus of study, but the mechanism of the enhancement is irrelevant here, since NGC 6946 has no appreciable supermassive black hole (Kormendy et al., 2007, 2010).
2.4.2 H and Infrared Emissions
H and infrared emissions are often used to trace the intensity of star formation. Both types of emissions are the second product of recently-formed young stars, with H emission from the gas ionized by UV photons from young, massive stars and infrared, such as 24m emission tracing the thermal radiation from dusts heated predominantly by young stars at the age up to 10 Myr (Calzetti et al., 2005).
Each emission has its own advantages and disadvantages in estimating star formation rate (SFR). H typically provides a high spatial resolution, but suffers from dust extinction. The bottleneck of current infrared data is its relatively low spatial resolution, though the extinction is not so much a problem at the infrared wavelengths.
The combination of the two may complement each other and provide a more accurate estimate of SFR (e.g., Calzetti et al., 2005; Kennicutt et al., 2007; Calzetti, 2012), although the spatial resolution may be an issue here since it needs to be adjusted to the lowest infrared resolution. Here, we use 24 m and H emissions to gauge star formation activities.
Infrared color is used to infer dust temperature. Young massive stars contribute to the SED at shorter wavelengths, producing a peak around 60 m, while low-mass stars contribute to the SED at longer wavelengths, generating another peak around 160 m (Calzetti, 2012). Therefore, ratio of the fluxes around the two peaks provides a probe of dust and gas temperature. In this work, we use 70 m to 160 m flux ratio or color to trace the temperature variation.
3. Observational Results
3.1. 13CO Observations
3.1.1 Channel Map
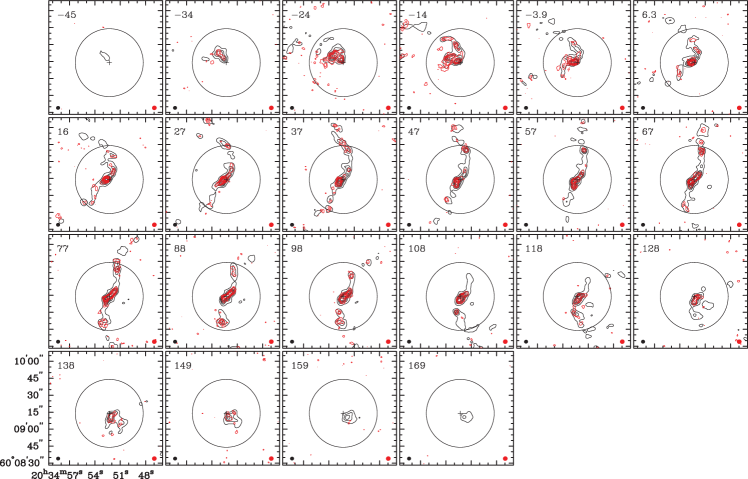
The channel maps of 13CO are displayed in Figure 4 with red contours, while the 12CO contours (black) are also plotted for reference (The 12CO data also include CARMA and NRO45 data). The galactic center is marked with a cross in each channel. There is a central peak around the galactic center. The central peak has a velocity width of 180 km s-1, ranging from –34 km s-1 to 149 km s-1. Apart from the central component, two elongated structures emerging from the galactic center are seen, extending toward the north and the south, respectively. Both sides show sharp velocity gradients across the elongated structures. Such pattern is commonly seen in galactic bars (e.g., Koda & Sofue, 2006). Emission in the northern region emerges from –14 km s-1, spreading over 112 km s-1. Emission in the southern region emerges from –39 km s-1, spreading over 110 km s-1.
The spatial and velocity distributions of 13CO and 12CO emission are similar in all channels. All 13CO peaks have counterparts in 12CO. This is a natural result as mentioned in §2.4. On the contrary, 13CO is absent at some 12CO peak (e.g., 67 km s-1). It is due to either the detection limit or an insufficient density for 13CO excitation.
3.1.2 Integrated Intensity Maps
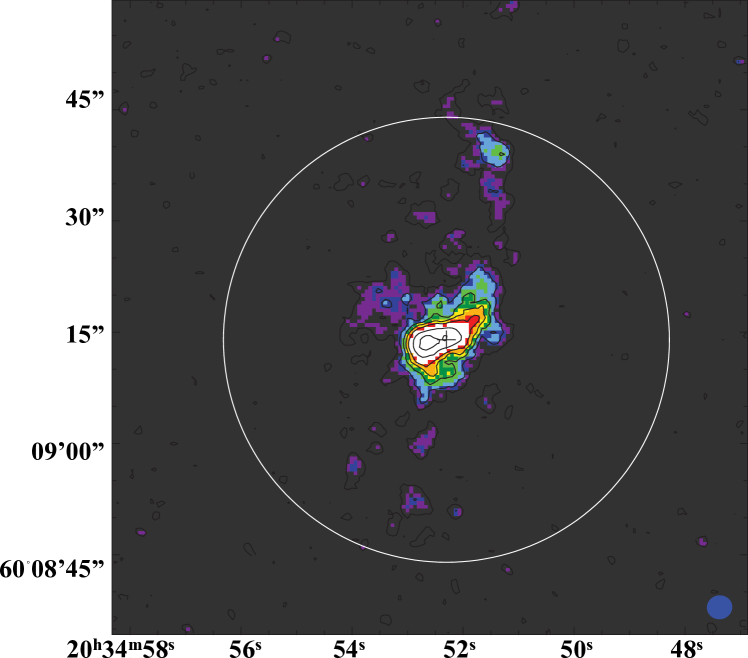
The CARMA+NRO45 map clearly shows the central component in details, resolving the central concentration elongated toward north-west to south-east directions. The semi-major axis of the elongation is about 8 ( 220 pc), corresponding to the secondary (nuclear) bar formed via local gravitational instability in the disk (Elmegreen et al., 1998; Schinnerer et al., 2006; Fathi et al., 2007; Romeo & Fathi, 2015). Structure inside the secondary bar is not resolved in our map. Emission appears to extend toward north from the edge of this elongation reaching the radius of 40 toward north. We call this extension “Northern Ridge”, which has a bright peak near the CARMA field of view.
The 12CO map from CARMA+NRO45 is displayed in the lower-right panel of Figure 2 for comparison. The 13CO and 12CO maps are generally similar, though 12CO shows more continuous extension overall. For example, the emission extends smoothly along the northern ridge in 12CO, but shows a gap in 13CO at around the radius of 16 – 18 which is between the central concentration and the northern ridge. The lack of 13CO emission could be due to an insufficient sensitivity for detection of this weak line, but we also point out that the level of 13CO emission must be lower than what is expected in assumption of the 12CO/13CO line ratio of 15, i.e., the average over the area of significant 13CO detection within the northern ridge. Assuming this ratio, the expected 13CO flux is 1.8 Jy beam-1 km s-1 in this gap, which should be detected at the 4 significance. Therefore, the 12CO/13CO ratio is enhanced at the connection between the central concentration and northern ridge, suggesting a change of molecular gas properties along the bar. Such enhancement has also been reported in the strong bar galaxy NGC 7479 by Hüttemeister et al. (2000).
The main difference between the CARMA+NRO45, NRO45-alone and CARMA-alone maps appears at the south side of the galaxy. The CARMA+NRO45 maps show a curved spiral-like pattern at the southeast of the center, which appears as extended emission in the NRO45 map, but appear only as distributed/not-connected emission peaks in the CARMA map. Some of the extended emission is not detectable in the CARMA-alone map, which is recovered by the combination.
3.2. HCN Observations
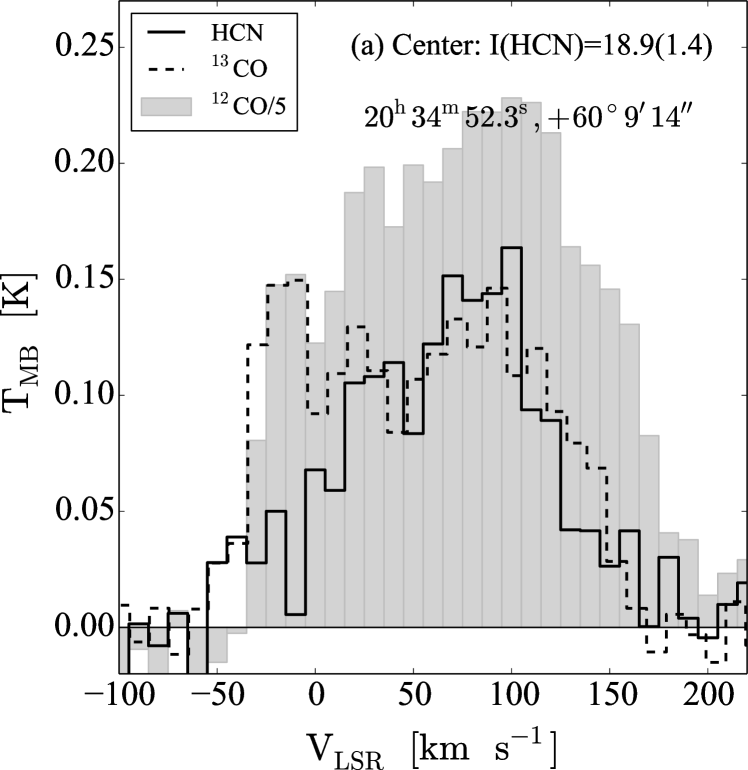
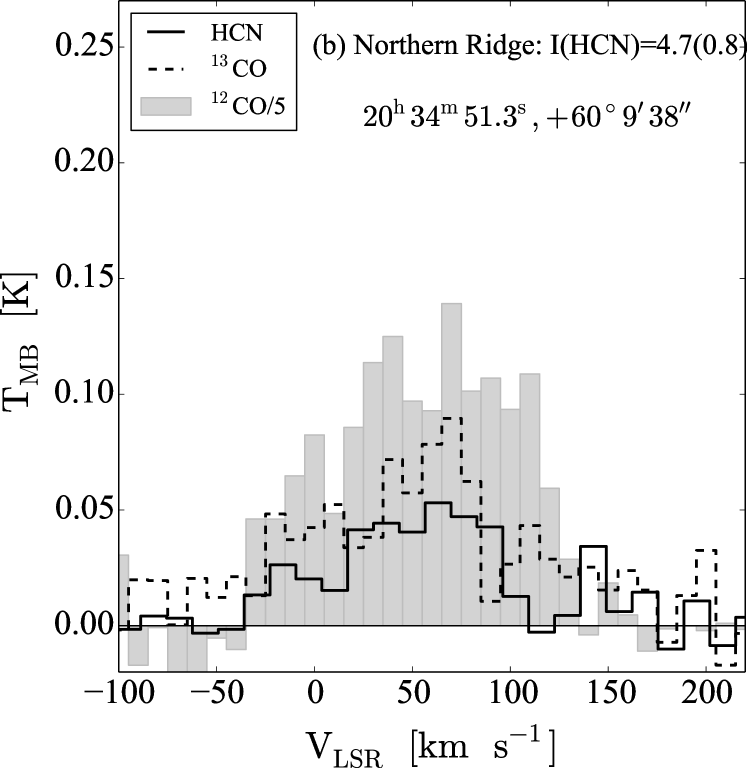
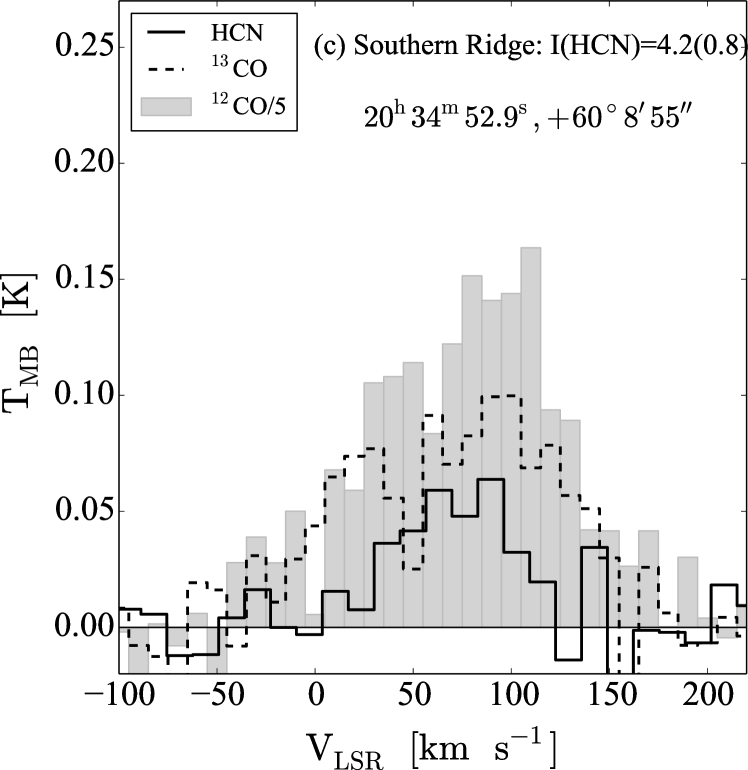
Figure 5(a), (b), and (c) compares HCN spectra against 12CO and 13CO spectra (NRO45 alone) at the center, north off-center, and the south off-center regions, respectively. Their overall shapes are similar to each other, except that the spectra at the south off-center position show a slight difference. At this position the HCN spectrum shows a single peak, while the two CO lines show two peaks at 40 and 80 km s-1, suggesting that CO and HCN trace different gas components.
The HCN integrated intensity is 18.9 1.4, 4.7 0.8, and 4.2 0.8 K km s-1 at the center, north, and the south off-center regions, respectively.
Luminosity ratio of / of the galactic center, north , and the south off-center regions are 0.111 0.011, 0.065 0.013, and 0.051 0.012, respectively. Luminosity ratio of the off-center positions are close to the global average values of normal galaxies while / of the central region lies between the mean value of LIRGs and ULIRGs (Gao & Solomon, 2004), where the definition of LIRG and ULIRG are and , respectively.
3.3. Line Ratio of CO lines
Emission line ratio often provides an idea of physical properties of molecular gas. The 12CO to 13CO intensity ratio () is presented in Figure 6. This ratio varies by a factor of three – the maximum ( 17) around the galactic center to the minimum ( 6) in the spiral-like ridge, which covers the large range observed in typical Galactic molecular clouds () to starburst galaxies and galaxy mergers (10 – 20, though sometimes 10 – 20; Solomon et al., 1979; Aalto et al., 1995; Taniguchi & Ohyama, 1998; Paglione et al., 2001; Tan et al., 2011).
Variable 12CO (2–1)/(1–0) ratio () is also observed in NGC 6946. Left panel of Figure 7 presents the map of entire galaxy. Since there is only single dish 12CO (2–1) image, we calculate with single dish 12CO (1–0). map has a resolution of 20, which is the resolution of NRO45 data of 12CO (1–0). The ratio map shows a central oval with 1. The orientation of this oval is consistent with the unresolved nuclear bar. is about 0.5 – 0.8 at the spiral arms, and 0.3 – 0.5 at the inter-arm regions. These ratios are comparable to that in the Milky Way and nearby galaxies (e.g., Sakamoto et al., 1997; Oka et al., 1998; Sawada et al., 2001; Koda et al., 2012).
Right panel of Figure 7 compares the spatial distribution of and star forming regions traced by Spitzer 24m. The high is spatially correlated with the location of stars.
4. Gas Structures from CO Observations
The morphology of molecular gas in NGC 6946 resembles the typical barred spiral galaxies (e.g., Sheth et al., 2002; Koda & Sofue, 2006). Barred spiral galaxies often show a central concentration of gas and offset ridges that extend from the central concentration along the leading side of the bar. Such structures are often reproduced in numerical simulations (e.g., Athanassoula & Bureau, 1999), and analytical gas orbit models (Wada, 1994; Sakamoto et al., 1999; Koda et al., 2002; Koda & Sofue, 2006). The bar of this galaxy runs in the north-south direction in an optical image. The CO map shows the central concentration with a major axis of 20 ( 540 pc), and two ridges with length 20 – 30, running from the central concentration toward the north and south directions with the southern ridge appear fragmented.
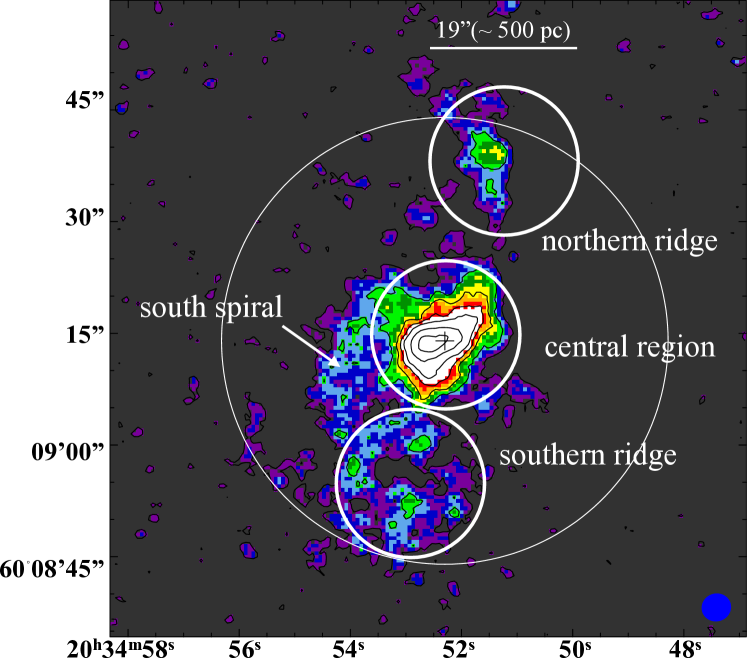
For clarity of the rest of discussions, we define molecular gas structures based on the morphology in the CO map. We call the central concentration (oval structure with the long extension of 20 elongated toward southeast-northwest direction) as central region. This definition of the central region includes the secondary bar as well as the galactic center (lower-left panel of Figure 2). The two ridges extending from the central region toward north and south are called the northern ridge and southern ridge, respectively. From a closer look at the distribution and kinematics we notice that there is an additional component superposed on the southern ridge. This component resembles a spiral arm, originating from the north-east side of the central region, and curving toward the south (around -14 – 16 km s-1 in the channel map of Figure 4). We call this structure the south spiral.
The molecular gas of the south spiral may be spatially distributed because the emission is not prominent in the CARMA-alone map, while it does appear very clearly in the CARMA+NRO45 map. The south spiral has lower (Figure 6) than other defined structures. The southern ridge appears fragmented, and there are multiple emission peaks in the region. Figure 6 shows that these peaks have high of which are comparable to those in the northern ridge. Therefore, we consider the southern ridge as a counterpart of the northern ridge, even though the southern ridge is more fragmented.
In what follows, we will separate our analyses as spatial resolved analyses and unresolved analyses. For the former, we separate the galactic structures as defined above, while for the latter we average them out with a radial bin and discuss only radial variations.
5. Physical Properties of Molecular Gas
| (, ) | / | ||||
|---|---|---|---|---|---|
| central region | 17 | 1.0 | ( 40 K, 103.5 cm-3) | 18.9 1.4 | 0.111 |
| ( 20–35 K, 104.0-4.5 cm-3) | |||||
| northern ridge | 12–20 | 0.8 | ( 15–20 K, 102-3 cm-3) | 4.7 0.8 | 0.065 |
| southern ridge | 10–13 | 0.8 | ( 10 K, 102-3 cm-3) | 4.2 0.8 | 0.051 |
| south spiral | 6–10 | 0.8 | ( 20 K, 103.0 cm-3) |
In order to constrain the spatial resolved temperature and density of molecular gas, we adopt the one-zone Large Velocity Gradient (LVG) model (Scoville & Solomon, 1974; Goldreich & Kwan, 1974). We briefly explain the LVG model (Section 5.1) and apply it to individual regions (Section 5.2). We then compare the derived gas physical properties with a color in infrared.
5.1. The Large Velocity Gradient (LVG) Model
Molecular emissions depend primarily on three parameters: kinetic temperature () and volume density () determine the excitation condition, and the optical depth (or alternatively the column density per unit velocity width , i.e., ) is important for the radiative transfer. In addition, photon trapping is usually included, with which large effectively reduces the spontaneous emission rate and affects the excitation condition as well. The LVG model calculates emission line strengths when (, , ) are given. In reverse, we constrain (, ) using the observed emission line ratios, and in our case, 12CO(1-0), 12CO(2-1), and 13CO(1-0). We employ the LVG code used in Koda et al. (2012) with CO-H2 collisional cross-sections from Yang et al. (2010).
For simplicity we fix a possible range of ()=16.6 – 17.3 cm-2 (km s-1)-1 as found in the Galaxy and M51 (Solomon et al., 1987; Rodriguez-Fernandez et al., 2006; Schinnerer et al., 2010; Koda et al., 2012). NGC 6946 has a similar range based on the resolved giant molecular clouds analysis (Donovan Meyer et al., 2012). The abundance ratios, [12CO/H2] and [12CO]/[13CO], are fixed to the Galactic values and are 8.0 10-5, and 60, respectively (Frerking et al., 1982; Schinnerer et al., 2010; Koda et al., 2012).
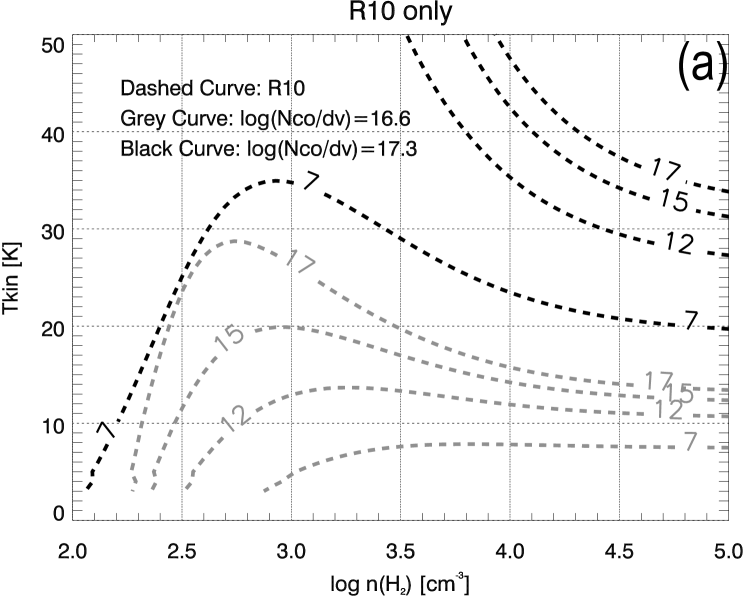
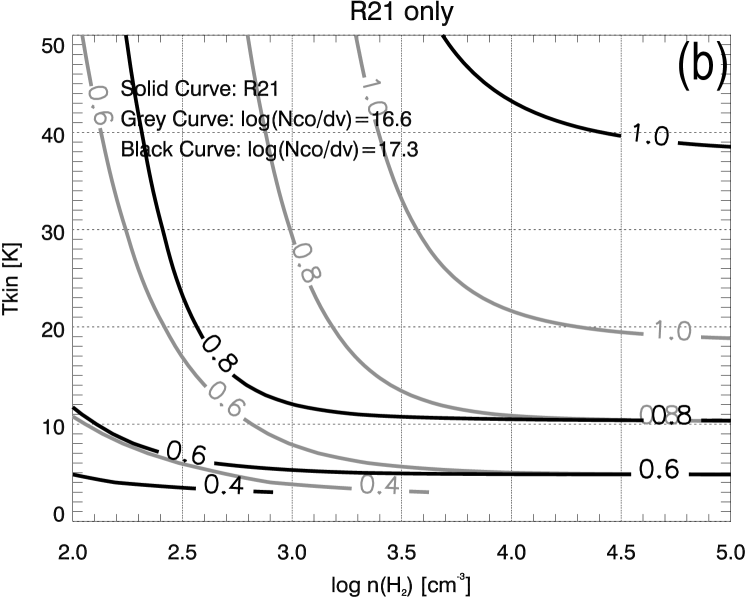
Figure 8 demonstrates the solutions from LVG for (a) and (b) . The gray and black lines are for () 16.6 and 17.3 cm-2 (km s-1)-1, respectively.
The LVG results appear non-linear in Figure 8 due to a mixture of different physical factors. For example, the higher abundance of 12CO over 13CO results in a significant difference in optical depth (). Hence, photons from 12CO are absorbed (trapped) more dominantly in the region where they are emitted, resulting in a lower effective spontaneous emission rate, and thus in a lower critical density (300 cm-3 over 2000 cm-3. The difference in the critical densities changes their line ratio dramatically up to 2000 cm-3. Beyond this density both 12CO and 13CO excitations are saturated and optically thick, and does not depend on the density (Figure 8a). An additional complexity is that the optical depth depends on velocity line width, as well as the column density at each level (which depends on temperature and density). The Doppler broadening of molecular gas is typically wider than the thermal line width, and thus photons from behind may not be absorbed by the gas in front at a different velocity. The LVG models take these into account and show the non-linear lines in Figure 8. Observations of and enclose an area in the parameter space and give constraints on the physical parameters.
5.2. Applications to Individual Regions
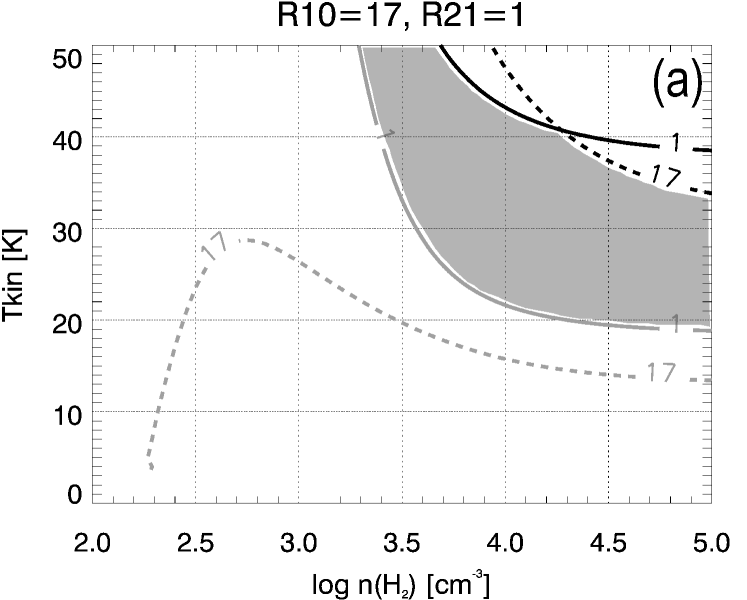
Figure 9 shows constraints from the observed and in the central region, ridges, and south spiral, and the enclosed areas (gray) indicate the possible ranges of gas temperature and density. We adopted () 16.6 to 17.3 as its possible range.
5.2.1 The Central Region
At the central region, either temperature or density needs to be high: ( 40 K, 103.5 cm-3) or ( 20 – 35 K, 104.0-4.5 cm-3) to satisfy 17 and 1.0 (Figure 9a). These solutions can co-exist, and indeed, a presence of a range of gas temperature and density was suggested by Mangum et al. (2013) from their ammonia (NH3) observations (i.e., molecular cloud thermometer). Their reported temperatures, 25 3 K and 50 10 K, are consistent with ours.
The derived densities ( cm-3) are an order of magnitude higher than the critical density of CO(1-0) excitation, indicating an overall high density in the central region. Although the structures are not resolved with our large beam (hundreds of parsecs), the average high density likely indicates that dense cores and associated star formation exist in this environment. In fact, the observed / ratio of the central region is consistent with that of LIRGs and ULIRGs (§3.2), implying that the fraction of dense gas in this region is likely similar to that in starburst galaxies.
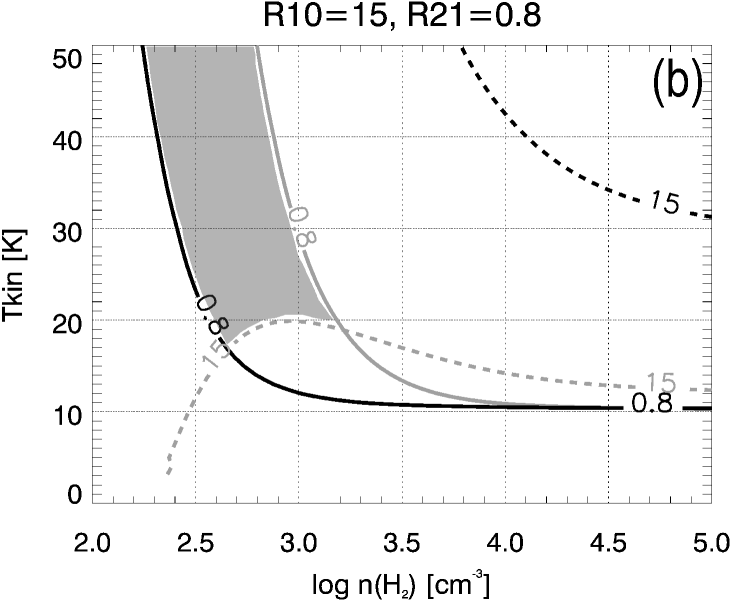
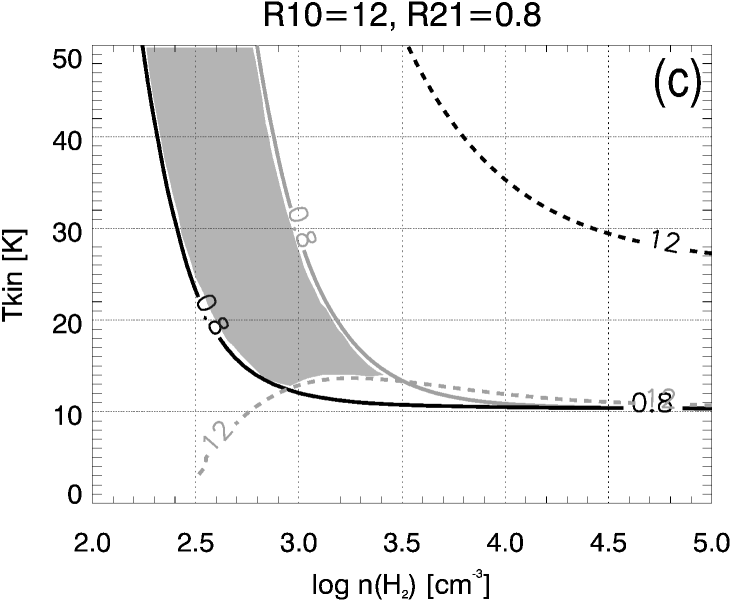
5.2.2 The Ridges and the South Spiral
Molecular gas at the ridges are likely cooler and less dense than the galactic center. The line ratios of 15 and ) indicate an average temperature and density of 15 – 20 K and 102-3 cm-3, respectively (Figure 9b). The southern ridge can not be clearly identified in the single dish map but its gas composition may resemble the northern ridge due to the compatible / and . Assuming that of the southern ridge is 0.8 as the northern ridge, and its is about 12, LVG calculations suggest 10 K and 102-3 cm-3 (Figure 9c).
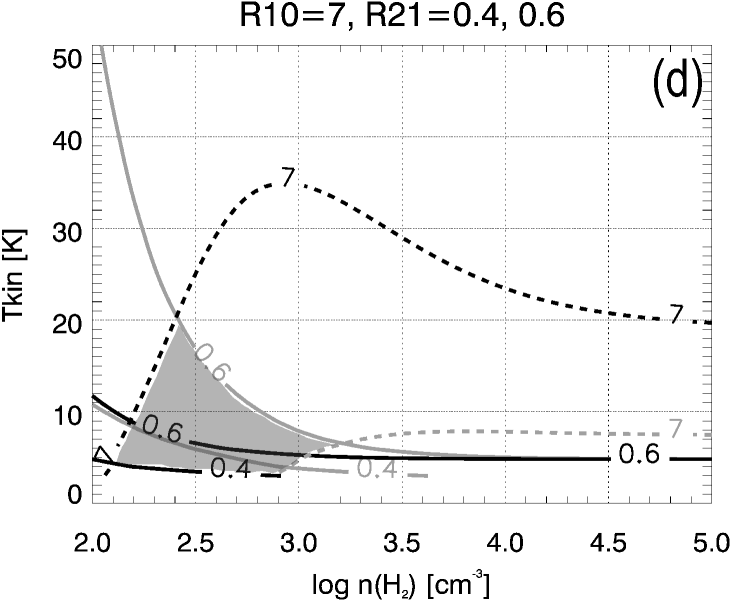
South spiral likely has the lowest temperature and density among the regions of interest. It is reported by previous HCN mapping observations that its / is considerably lower than the ridges and the center (Levine et al., 2008), indicating that the overall density and the fraction of dense gas is unlikely larger than those areas, i.e., 103 cm-3. With 7, Figure 9d therefore suggests that the is likely less then 0.6. These ratios give the solution of temperature of 20 K.
5.3. Relative Temperature from Infrared Color
Dust temperature provides an indirect measure of gas temperature. Since the LVG calculations only suggest lower or upper limits of gas temperatures due to the non-closed contours, we use an independent methods to constrain the relative temperatures among the region of interests. Gas temperature () and dust temperature () are not coupled except in very high density regions, but they are positively correlated (e.g., Forbrich et al., 2014). We therefore assume that can be used to infer the variation of .
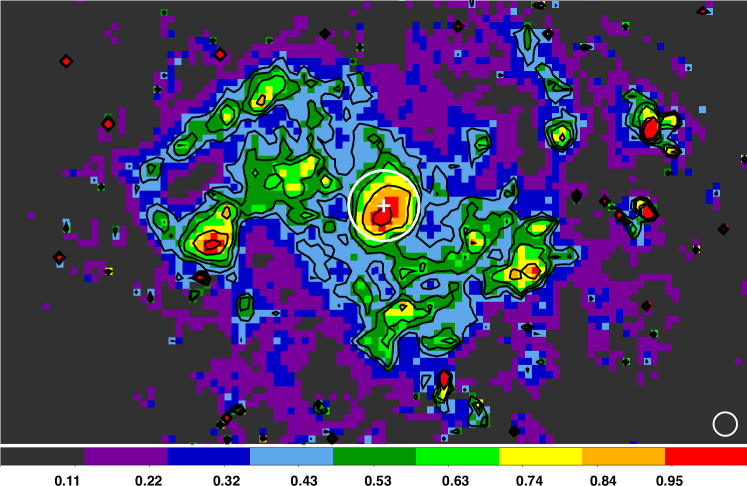
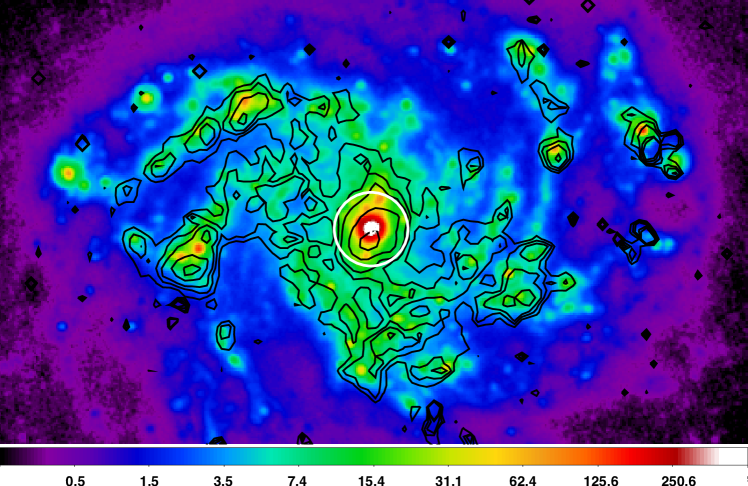
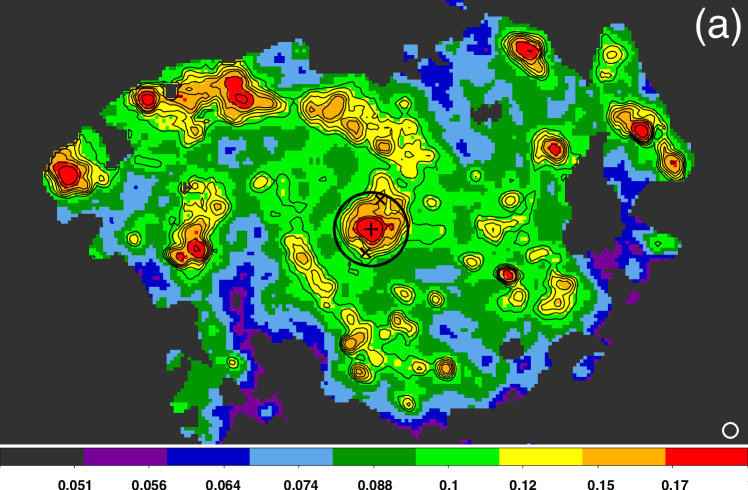
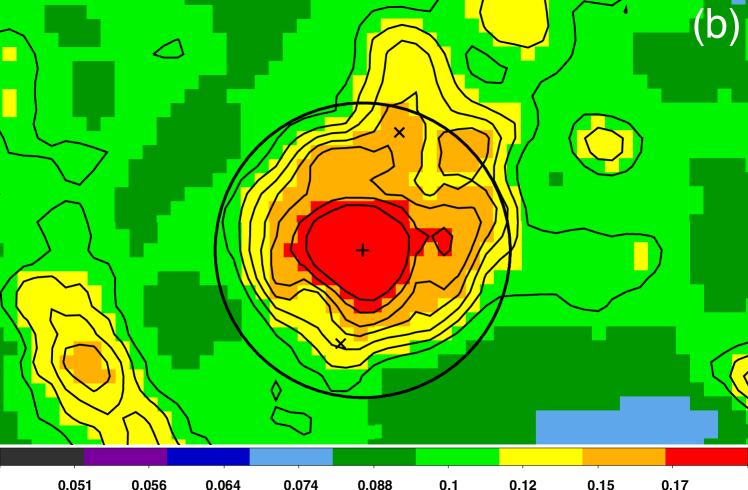
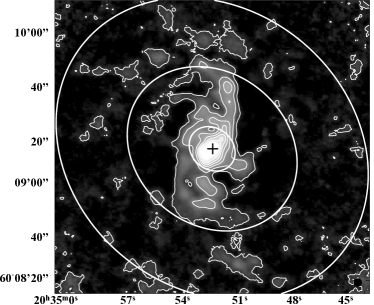
Infrared color of 70 m to 160 m flux ratio () is used to inferred relative among the regions of interest through the SED implied , i.e., increases with (and therefore based on the assumption above). map of the entire galaxy is shown in Figure 10a, while Figure 10b displays the color map of the central 1. The flux ratio is shown with both color scale and contours. Galactic center is marked with a plus symbol. The black circle denotes the central 1. Two crosses () indicate the positions of HCN observations at the ridges.
The relative temperatures among the regions of interest are consistent with the results of LVG calculations. peaks at the galactic center ( 0.31), indicating the warmest gas in the galaxy. The northern ridge ( 0.16) is slightly warmer than the southern ridge and the south spiral ( 0.13).
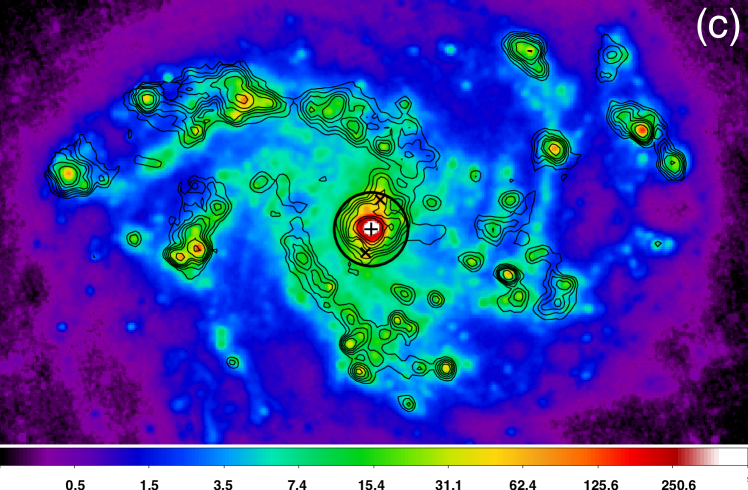
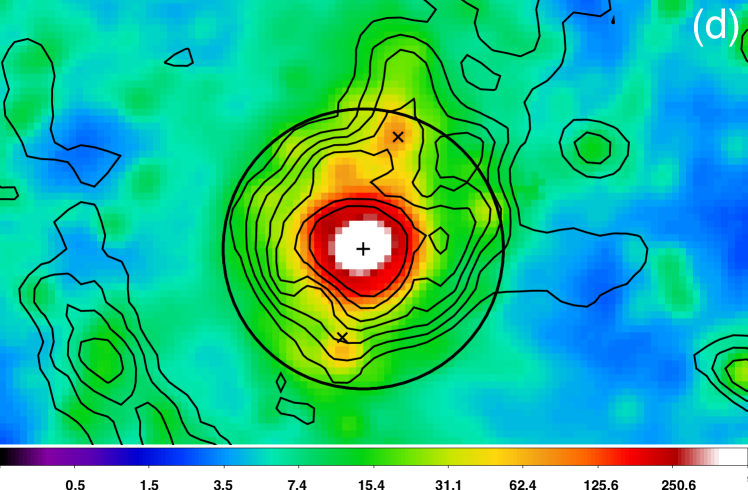
The temperature distribution of NGC 6946 is likely driven by star formation. Spatial correlation between and star forming regions traced by 24 m is observed (Figure 10c and 10d). The highest and the strongest 24m emission are observed at the central region. The northern and the southern ridges characteristic of two stronger 24m emission (around the positions of HCN observations) have higher temperature than their surroundings, while the south spiral is lack of 24m emission.
6. Radial Star Formation Efficiency
We discuss the star formation activity in terms of the radial profile of SFE. Radial variation of SFE is adopted since the star formation regions do not coexist with molecular gas but shift azimuthally towards the leading sides of the offset ridges (dust lanes), as have been reported in many galaxies (e.g., Reynaud & Downes, 1998; Sheth et al., 2000, 2002; Asif et al., 2005). We therefore assume that the star formation regions travel simply azimuthally, and these two postulations can be correlated by azimuthally averaging the properties at the same radius.
Definition of SFE is number of stars formed per year, it could be formulated as SFR/. SFR is calculated with the luminosity-SFR relation suggested by Calzetti et al. (2007):
| (1) |
where and are the observed luminosity of H and 24 m, respectively, and is inclinations of the galaxy. Molecular gas mass is derived with 12CO (1–0) because it traces entire volume of molecular gas and requires less assumptions in the derivation. The conversion between 12CO (1–0) flux and is:
| (2) |
where is flux of 12CO emission, is distance of the galaxy, is the CO-to-H2 conversion (the only assumption in the calculation). Conversion factor of 1.2 1020 cm-2 (K km s-1)-1 is adopted in this work. The value is derived from the virial mass of molecular clouds by Donovan Meyer et al. (2012). SFR and are sampled with a step of 5 (135 pc) to calculate the radial SFE.
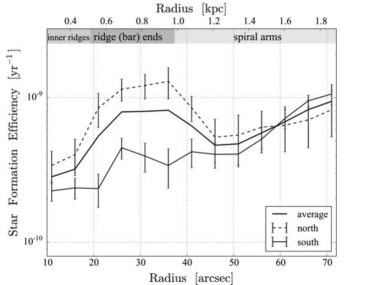
We calculate radial SFE in the inner 70 ( 2 kpc) of NGC 6946. Figure 11 visualizes the representative annuli corrected for the inclination and position angle, and shows the radial extent of galactic structures. The central unresolved region ( 10) are enclosed within the inner ellipse. This region is discarded in the radial profile of SFE since it is greatly unsolved, but we still calculate the average SFE in this region to be 109 yr-1 for comparison. The middle annulus (10 37) corresponds to the offset ridges. Spiral arms emerge from the offset ridge ends in the outer annulus of 37 70.
Figure 12 illustrates the radial SFE. Dashed, thin-solid and thick-solid curves represent SFE of the northern, southern sides and their average, respectively. Corresponding galactic features of each radii are indicated at the upper side of the figure. SFE varies by 5 times within the range of 10-10 – 10-9 yr-1. The range is comparable to that of nearby disk galaxies seen in pixel-based analysis (e.g. Bigiel et al., 2008; Leroy et al., 2008; Huang & Kauffmann, 2015).
At the ridges, SFE of the north side is higher than the south side by 2 times, but the radial variations of the two sides are similar. The lowest SFE ( 3 10-10 yr-1) occurs at the inner ridges, then increases to the local maximum at the ridge ends. The peak SFE is as high as 1.5 10-9 yr-1 at the northern ridge end, about two times higher than that of the south side. The variation is consistent to the prediction in terms of the dust lane shocks. Dust lane shocks increase towards the galactic center along the bar and inhibit star formation at the inner offset ridges by destroying their parent molecular clouds (e.g., Reynaud & Downes, 1998; Zurita et al., 2004). Additionally, Watanabe et al. (2011) propose that the high SFE at the ridge ends can be attributed to the increase in the probability of cloud-cloud collisions at this crowded region that induce star formation.
SFE shows a slight drop beyond the ridge ends but rapidly increases to 10-9 yr-1 at 2 kpc, where spiral arms emerge in the both sides. Rebolledo et al. (2012) observed giant molecular cloud associations (GMAs) in the eastern spiral arms of NGC 6946 at 8 kpc away from the galactic center. They found a SFE of 10-9 yr-1 in these spiral GMAs, suggesting that such high SFE is likely galactic-wide. Indeed, optical and infrared observations show that NGC 6946 are filled with massive star-forming regions, super-star cluster, and supernovae throughout the spiral arms (e.g, Matonick & Fesen, 1997; Larsen & Richtler, 1999; Cedrés et al., 2013). In spite of that, we note that the analysis of Rebolledo et al. (2012) is on the basis of spatially resolved GMA properties. SFE of the inner disk certainly requires high-resolution observations to further confirm.
Finally, as a caution, we should mention that our analysis of star formation activity has been limited to the radial analysis. The derived values of SFE may not be driven by the intrinsic influence of the galactic structures alone because the radial ranges include significant area at the inter-structure regions. Significant caution is warranted in interpreting the radial SFE.
7. Summary
In this work, we investigated the physical properties of molecular gas and star formation activity in the central 2 kpc of NGC 6946. These are done by analyzing the newly observed high-resolution isotopic line 13CO (1–0) image created by single dish telescope NRO45 and interferometer CARMA, and other molecular gas tracers in 12CO (1-0), 12CO (2-1) and HCN (1-0) (new data from this work), star formation tracers in H and 24 m, and dust tracers in 60 m and 170 m from archive (§2). Main observational results of the newly observed molecular gas are as follows (§3):
-
1.
The NRO45 and NRO45 CARMA spectra are very similar overall, while the CARMA spectrum has the flux only about 50% of the NRO45 one.
-
2.
The 13CO combined map (our default) shows the central component in details, resolving the central concentration elongated toward north-west to south-east directions, corresponding to the unresolved nuclear (secondary) bar with major axis of 400 – 500 pc and the circumnuclear starburst ring. Emission appears to extend toward north from the nuclear bar reaching the radius of 1 kpc toward north. We call this extension northern ridge (offset ridge of molecular gas of the northern primary bar) (§4). Emission at the south side is more complex than the north. We define two structures as southern ridge (offset ridge of the southern primary bar) and south spiral, which was misunderstood to be part of the southern bar in previous low-resolution images (§4).
-
3.
Comparison to the archival 12CO map (also a combined map of NRO45 and CARMA) shows that the morphology of two CO lines are generally similar, but 12CO emission shows more continuous extension overall than 13CO. 12CO-to-13CO () ratio varies by a factor of three from the maximum of 17 around the galactic center to the minimum of at the south spiral, covering the large range observed in typical Galactic molecular clouds to starburst galaxies and galaxy mergers.
-
4.
HCN single dish observation were made towards three selected positions: the central region, northern ridge and the southern ridge to constrain the amount of dense gas. The HCN integrated intensities are 18.9 1.4, 4.7 0.8, and 4.2 0.8 K km s-1 at the three regions, respectively. Comparison between HCN and CO shows that their overall spectral profiles are similar to each other, except that the spectra at the southern ridge show a slight difference, where CO observations show multiple peaks while HCN has only one.
Physical properties of molecular gas are inferred with several methods. The analysis are carried out mainly towards the regions of interest, including the central region, northern ridge, southern ridge, and the south spiral (§5).
-
1.
The one-zone Large Velocity Gradient (LVG) model and the observed line ratios of and 12CO (2–1)-to-12CO (1–0) () are used to constrain the spatial resolved temperature and density of molecular gas. LVG calculations show that the bulk molecular gas traced by CO lines in the galactic center is warmer and denser ( 20 – 40 K, 103.5 cm-3) than that in the offset ridges ( 10 – 20 K, 102-3 cm-3). Moreover, the south spiral likely has a temperature and density lower than the ridges.
-
2.
Luminosity ratio of dense gas tracer to low density gas tracer / is calculated for the central region and the ridges. The ratio is often referred to the dense gas fraction. / suggests that the fraction of dense gas in the central region is similar to that in starburst galaxies such as LIRGs and ULIRGs, while values of the ridges are close to the global average values of normal galaxies.
-
3.
Large-scale temperature distribution is calculated by the infrared color of /. Temperature is spatially correlated with star forming regions seen in 24m, suggesting that the large scale temperature distribution of NGC 6946 is driven by star formation. Moreover, the relative temperatures among the regions of interest inferred by the infrared color are consistent with the results of LVG calculations.
We discuss the variation of radial star formation efficiency (SFE). Radial SFE in the inner 2 kpc ( 70) of NGC 6946 is calculated using the gas traced by 12CO (1–0) (because it can trace the entire volume within the bulk molecular gas) and star formation activity traced by 24m and H (§6). The key results are as follows.
-
1.
SFE of the north side of the galaxy is higher than that of the south side by 2 times. For each side of the galaxy, radial SFE changes by about five times in the inner 2 kpc disk.
-
2.
In spite of the different SFE, radial SFE share similar trend of variation at the two sides. Low SFE is seen in the radial range of the inner (midway) offset ridges, whereas, the ridge ends show high SFE. The variations of SFE agree with the prediction based on the effect of the dust-lane shocks and the increase in the probability of cloud-cloud collisions in high-interaction environment.
We thank referee Alessandro Romeo for providing constructive comments which have helped to improve the paper. This work is supported by the Associate Support System of the National Astronomical Observatory of Japan (NAOJ). JK acknowledges support from the NSF through grant AST-1211680 for the work presented in this paper, as well as NASA through grant NNX09AF40G & NNX14AF74G, a Herschel Space Observatory grant, and an Hubble Space Telescope grant (No. 12490). This research has made use of the NASA/IPAC Extragalactic Database (NED) which is operated by the Jet Propulsion Laboratory, California Institute of Technology, under contract with the National Aeronautics and Space Administration.
References
- Asayama & Nakajima (2013) Asayama, S., & Nakajima, T. 2013, PASP, 125, 213
- Aalto et al. (1995) Aalto, S., Booth, R. S., Black, J. H., & Johansson, L. E. B. 1995, A & A, 300, 369
- Asif et al. (2005) Asif, M. W., Mundell, C. G., & Pedlar, A. 2005, MNRAS, 359, 408
- Athanassoula & Bureau (1999) Athanassoula, E., & Bureau, M. 1999, ApJ, 522, 699
- Bigiel et al. (2008) Bigiel, F., Leroy, A., Walter, F., et al. 2008, AJ, 136, 2846
- Blitz et al. (2007) Blitz, L., Fukui, Y., Kawamura, A., et al. 2007, Protostars and Planets V, 81
- Bolatto et al. (2008) Bolatto, A. D., Leroy, A. K., Rosolowsky, E., Walter, F., & Blitz, L. 2008, ApJ, 686, 948
- Bolatto et al. (2013) Bolatto, A. D., Wolfire, M., & Leroy, A. K. 2013, ARA&A, 51, 207
- Calzetti et al. (2005) Calzetti, D., Kennicutt, R. C., Jr., Bianchi, L., et al. 2005, ApJ, 633, 871
- Calzetti et al. (2007) Calzetti, D., Kennicutt, R. C., Engelbracht, C. W., et al. 2007, ApJ, 666, 870
- Calzetti (2012) Calzetti, D. 2012, ArXiv e-prints, arXiv:1208.2997
- Cedrés et al. (2013) Cedrés, B., Beckman, J. E., Bongiovanni, Á., et al. 2013, ApJ, 765, L24
- Deharveng et al. (2005) Deharveng, L., Zavagno, A., & Caplan, J. 2005, A&A, 433, 565
- Donovan Meyer et al. (2012) Donovan Meyer, J., Koda, J., Momose, R., et al. 2012, ApJ, 744, 42
- Donovan Meyer et al. (2013) Donovan Meyer, J., Koda, J., Momose, R., et al. 2013, ApJ, 772, 107
- Elmegreen et al. (1998) Elmegreen, D. M., Chromey, F. R., & Santos, M. 1998, AJ, 116, 1221
- Fathi et al. (2007) Fathi, K., Toonen, S., Falcón-Barroso, J., et al. 2007, ApJ, 667, L137
- Ferguson et al. (1998) Ferguson, A. M. N., Wyse, R. F. G., Gallagher, J. S., & Hunter, D. A. 1998, ApJ, 506, L19
- Forbrich et al. (2014) Forbrich, J., Öberg, K., Lada, C. J., et al. 2014, A&A, 568, AA27
- Frerking et al. (1982) Frerking, M. A., Langer, W. D., & Wilson, R. W. 1982, ApJ, 262, 590
- Gao & Solomon (2004) Gao, Y., & Solomon, P. M. 2004, ApJ, 606, 271
- Goldreich & Kwan (1974) Goldreich, P., & Kwan, J. 1974, ApJ, 189, 441
- Huang & Kauffmann (2015) Huang, M.-L., & Kauffmann, G. 2015, MNRAS, 450, 1375
- Hughes et al. (2013) Hughes, A., Meidt, S. E., Colombo, D., et al. 2013, ApJ, 779, 46
- Hüttemeister et al. (2000) Hüttemeister, S., Aalto, S., Das, M., & Wall, W. F. 2000, A & A, 363, 93
- Imanishi et al. (2007) Imanishi, M., Nakanishi, K., Tamura, Y., Oi, N., & Kohno, K. 2007, AJ, 134, 2366
- Izumi et al. (2013) Izumi, T., Kohno, K., Martín, S., et al. 2013, PASJ, 65, 100
- Kennicutt et al. (2003) Kennicutt, R. C., Jr., Armus, L., Bendo, G., et al. 2003, PASP, 115, 928
- Kennicutt et al. (2007) Kennicutt, R. C., Jr., Calzetti, D., Walter, F., et al. 2007, ApJ, 671, 333
- Kennicutt et al. (2011) Kennicutt, R. C., Calzetti, D., Aniano, G., et al. 2011, PASP, 123, 1347
- Koda et al. (2002) Koda, J., Sofue, Y., Kohno, K., et al. 2002, ApJ, 573, 105
- Koda et al. (2005) Koda, J., Okuda, T., Nakanishi, K., et al. 2005, A&A, 431, 887
- Koda & Sofue (2006) Koda, J., & Sofue, Y. 2006, PASJ, 58, 299
- Koda et al. (2009) Koda, J., Scoville, N., Sawada, T., et al. 2009, ApJl, 700, L132
- Koda et al. (2011) Koda, J., Sawada, T., Wright, M. C. H., et al. 2011, ApJs, 193, 19
- Koda et al. (2012) Koda, J., Scoville, N., Hasegawa, T., et al. 2012, ApJ, 761, 41
- Kormendy et al. (2007) Kormendy, J., Drory, N., Cornell, M. E., & Bender, R. 2007, Bulletin of the American Astronomical Society, 39, 860
- Kormendy et al. (2010) Kormendy, J., Drory, N., Bender, R., & Cornell, M. E. 2010, ApJ, 723, 54
- Lada (1992) Lada, E. A. 1992, ApJ, 393, L25
- Lada et al. (2012) Lada, C. J., Forbrich, J., Lombardi, M., & Alves, J. F. 2012, ApJ, 745, 190
- Larsen & Richtler (1999) Larsen, S. S., & Richtler, T. 1999, A&A, 345, 59
- Leroy et al. (2008) Leroy, A. K., Walter, F., Brinks, E., et al. 2008, AJ, 136, 2782
- Leroy et al. (2009) Leroy, A. K., Walter, F., Bigiel, F., et al. 2009, AJ, 137, 4670
- Levine et al. (2008) Levine, E. S., Helfer, T. T., Meijerink, R., & Blitz, L. 2008, ApJ, 673, 183
- Mangum et al. (2013) Mangum, J. G., Darling, J., Henkel, C., et al. 2013, ApJ, 779, 33
- Matonick & Fesen (1997) Matonick, D. M., & Fesen, R. A. 1997, ApJS, 112, 49
- Matsushita et al. (2010) Matsushita, S., Kawabe, R., Kohno, K., Tosaki, T., & Vila-Vilaró, B. 2010, PASJ, 62, 409
- Meier & Turner (2004) Meier, D. S., & Turner, J. L. 2004, AJ, 127, 2069
- Momose et al. (2010) Momose, R., Okumura, S. K., Koda, J., & Sawada, T. 2010, ApJ, 721, 383
- Nakajima et al. (2013) Nakajima, T., Kimura, K., Nishimura, A., et al. 2013, PASP, 125, 252
- Oey & Massey (1995) Oey, M. S., & Massey, P. 1995, ApJ, 452, 210
- Oka et al. (1998) Oka, T., Hasegawa, T., Hayashi, M., Handa, T., & Sakamoto, S. 1998, ApJ, 493, 730
- Paglione et al. (2001) Paglione, T. A. D., Wall, W. F., Young, J. S., et al. 2001, ApJS, 135, 183
- Rebolledo et al. (2012) Rebolledo, D., Wong, T., Leroy, A., Koda, J., & Donovan Meyer, J. 2012, ApJ, 757, 155
- Reynaud & Downes (1998) Reynaud, D., & Downes, D. 1998, A & A, 337, 671
- Rodriguez-Fernandez et al. (2006) Rodriguez-Fernandez, N. J., Combes, F., Martin-Pintado, J., Wilson, T. L., & Apponi, A. 2006, A&A, 455, 963
- Romeo & Fathi (2015) Romeo, A. B., & Fathi, K. 2015, MNRAS, 451, 3107
- Romeo & Falstad (2013) Romeo, A. B., & Falstad, N. 2013, MNRAS, 433, 1389
- Sakamoto et al. (1997) Sakamoto, S., Handa, T., Sofue, Y., Honma, M., & Sorai, K. 1997, ApJ, 475, 134
- Sakamoto et al. (1999) Sakamoto, K., Okumura, S. K., Ishizuki, S., & Scoville, N. Z. 1999, ApJ, 525, 691
- Sault et al. (1995) Sault, R. J., Teuben, P. J., & Wright, M. C. H. 1995, Astronomical Data Analysis Software and Systems IV, 77, 433
- Sawada et al. (2001) Sawada, T., Hasegawa, T., Handa, T., et al. 2001, ApJs, 136, 189
- Sawada et al. (2008) Sawada, T., Ikeda, N., Sunada, K., et al. 2008, PASJ, 60, 445
- Schinnerer et al. (2006) Schinnerer, E., Böker, T., Emsellem, E., & Lisenfeld, U. 2006, ApJ, 649, 181
- Schinnerer et al. (2010) Schinnerer, E., Weiß, A., Aalto, S., & Scoville, N. Z. 2010, ApJ, 719, 1588
- Schneider et al. (2012) Schneider, N., Csengeri, T., Hennemann, M., et al. 2012, A&A, 540, L11
- Scoville & Solomon (1974) Scoville, N. Z., & Solomon, P. M. 1974, ApJl, 187, L67
- Sheth et al. (2000) Sheth, K., Regan, M. W., Vogel, S. N., & Teuben, P. J. 2000, ApJ, 532, 221
- Sheth et al. (2002) Sheth, K., Vogel, S. N., Regan, M. W., et al. 2002, AJ, 124, 2581
- Solomon et al. (1979) Solomon, P. M., Sanders, D. B., & Scoville, N. Z. 1979, in IAU Symposium, Vol. 84, The Large-Scale Characteristics of the Galaxy, ed. W. B. Burton, 35–52
- Solomon et al. (1987) Solomon, P. M., Rivolo, A. R., Barrett, J., & Yahil, A. 1987, ApJ, 319, 730
- Tan et al. (2011) Tan, Q.-H., Gao, Y., Zhang, Z.-Y., & Xia, X.-Y. 2011, Research in Astronomy and Astrophysics, 11, 787
- Taniguchi & Ohyama (1998) Taniguchi, Y., & Ohyama, Y. 1998, ApJl, 507, L121
- Tully (1988) Tully, R. B. 1988, Nearby galaxies catalog
- Wada (1994) Wada, K. 1994, PASJ, 46, 165
- Walter et al. (2008) Walter, F., Brinks, E., de Blok, W. J. G., et al. 2008, AJ, 136, 2563
- Watanabe et al. (2011) Watanabe, Y., Sorai, K., Kuno, N., & Habe, A. 2011, MNRAS, 411, 1409
- Yang et al. (2010) Yang, B., Stancil, P. C., Balakrishnan, N., & Forrey, R. C. 2010, ApJ, 718, 1062
- Zurita et al. (2004) Zurita, A., Relaño, M., Beckman, J. E., & Knapen, J. H. 2004, A&A, 413, 73