Discovery of A Faint Quasar at and Implications for Cosmic Reionization
Abstract
Recent studies suggest that faint active galactic nuclei may be responsible for the reionization of the universe. Confirmation of this scenario requires spectroscopic identification of faint quasars ( mag) at , but only a very small number of such quasars have been spectroscopically identified so far. Here, we report the discovery of a faint quasar IMS J220417.92+011144.8 at in a 12.5 deg2 region of the SA22 field of the Infrared Medium-deep Survey (IMS). The spectrum of the quasar shows a sharp break at , with emission lines redshifted to and rest-frame ultraviolet continuum magnitude AB mag. The discovery of IMS J220417.92+011144.8 is consistent with the expected number of quasars at estimated from quasar luminosity functions based on previous observations of spectroscopically identified low-luminosity quasars . This suggests that the number of mag quasars at may not be high enough to fully account for the reionization of the universe. In addition, our study demonstrates that faint quasars in the early universe can be identified effectively with a moderately wide and deep near-infrared survey such as the IMS.
Subject headings:
Cosmology: observations — quasars: emission lines — quasars: general1. Introduction
Several dozens of quasars are now identified at (Fan et al., 2006; Goto, 2006; Willott et al., 2010b; Mortlock et al., 2011; Venemans et al., 2013; Bañados et al., 2014; Kashikawa et al., 2015; Venemans et al., 2015; Wu et al., 2015). They are found to be powered by supermassive black holes (SMBHs) with masses of (Jiang et al., 2007; Willott et al., 2010a; Mortlock et al., 2011; Jun et al., 2015), shining at the Eddington limit, meaning that they are accreting mass at their maximal rates (Willott et al., 2010a; Jun et al., 2015), and some of them show paucity of hot dust emission (Jiang et al., 2010; Jun & Im, 2013) in contrast to quasars at low redshift (Kim et al., 2015). These results suggest that high-redshift quasars already harbor SMBHs at their centers just Gyr after the Big Bang, and these SMBHs are growing more vigorously than their counterparts at low redshift. Furthermore, strong Gunn-Peterson troughs (Gunn & Peterson, 1965) in their spectra suggest that a significant fraction of the intergalactic medium (IGM) is reionized at (Fan et al., 2006). However, two interesting questions still remain due to the lack of known faint quasars at ( mag).
First, while the bright end of the quasar luminosity function, which is not sufficient to reionize the IGM, is well constrained, the faint end of the function is still debated. Recently, Giallongo et al. (2015) found 22 faint active galactic nuclei (AGNs) candidates with X-ray detections at , indicating that there are more faint AGNs than previously expected, and the faint AGNs could be main contributors to the reionization of the universe (Glikman et al., 2011; Madau & Haardt, 2015). Unfortunately, the number of spectroscopically confirmed faint quasars is very small (only a few; Willott et al. 2009; Kashikawa et al. 2015). Consequently, the faint end of the quasar luminosity function is still very uncertain, and the potential role of this population in the reionization of the early universe is yet unclear.
Second, most of the quasars discovered so far are luminous, mag ( mag), implying that the currently discovered sample of high-redshift quasars is biased to objects with high accretion rates. Such a bias hinders our understanding of the range of accretion rates of quasars in the early universe.
Recently, we have been performing the Infrared Medium-deep Survey (IMS), a moderately wide (120 deg2), and moderately deep ( mag) near-infrared (NIR) imaging survey with the Wide Field Camera (WFCAM; Casali et al. 2007) on the United Kingdom InfraRed Telescope (UKIRT). One of the main scientific aims of the IMS is to discover faint quasars at and beyond. We combined the - and -band imaging data from the IMS with optical data from the Canada-France-Hawaii Telescope Legacy Survey (CFHTLS; Hudelot et al. 2012) and other Canada-France-Hawaii Telescope (CFHT) PI programs, and we employed multiple color selection criteria to identify quasar candidates. Here, we present the discovery of the first IMS faint quasar at , and we discuss how this can constrain the sources responsible for the reionization of the universe.
In this Letter, we assumed the cosmological parameters of , (e.g., Im et al. 1997), and km s-1 Mpc-1. All magnitudes are given in the AB system.
2. IMS and CFHTLS Data
The IMS includes seven extragalactic fields (XMM-LSS, CFHTLS-W2, Lockman Hole, EGS, ELAIS-N1, ELAIS-N2, and SA22; Im, M. et al. 2015, in preparation). In this Letter ,we focus on one of the IMS fields, SA22, which covers deg2 on the CFHTLS Wide 4 field, centered at , (J2000). The SA22 field images have 5 detection limits for a point source with 2FWHM aperture magnitudes of 23.5 and 23.3 mag in the - and -bands, respectively (the median seeing values are and , respectively; for details, see Karouzos et al. 2014). The -band depth corresponds to mag for a quasar at , which is 2 mag fainter than most luminous quasars discovered to date. The magnitude limits in the optical bands from CFHTLS are , , , , and mag at the 80% completeness limit for point sources (Hudelot et al., 2012).
Source detection was performed in -band images of CFHTLS using SExtractor (Bertin & Arnouts, 1996). DETECTTHRESH and DETECTMINAREA parameters were set as 1.1 and 7, respectively. Using the identified -band sources, we measured fluxes at bluer bands using the dual mode of the SExtractor software. Aperture magnitudes with FWHM diameters (FWHM) were used to measure fluxes111The signal-to-noise ratio (S/N; FLUX/FLUXERR from SExtractor) of point source peaks for apertures with diameters of FWHM. ,222 The errors are based on pixel-to-pixel noise of our stacked images made of sub-pixel dithered frames. We find that this can underestimate the actual photometric error by 20 – 30 % (e.g., Jeon et al. 2010). . The aperture fluxes were converted to total fluxes by applying aperture corrections derived using bright stars in each filter image.
For the IMS NIR images, we detected the sources using the association mode of the SExtractor software. We matched sources in the IMS - and -band catalogs with those in the -band catalog using a matching radius of . The fluxes in the - and -bands were obtained in a similar way to the CFHTLS data.
3. Quasar Candidate Selection
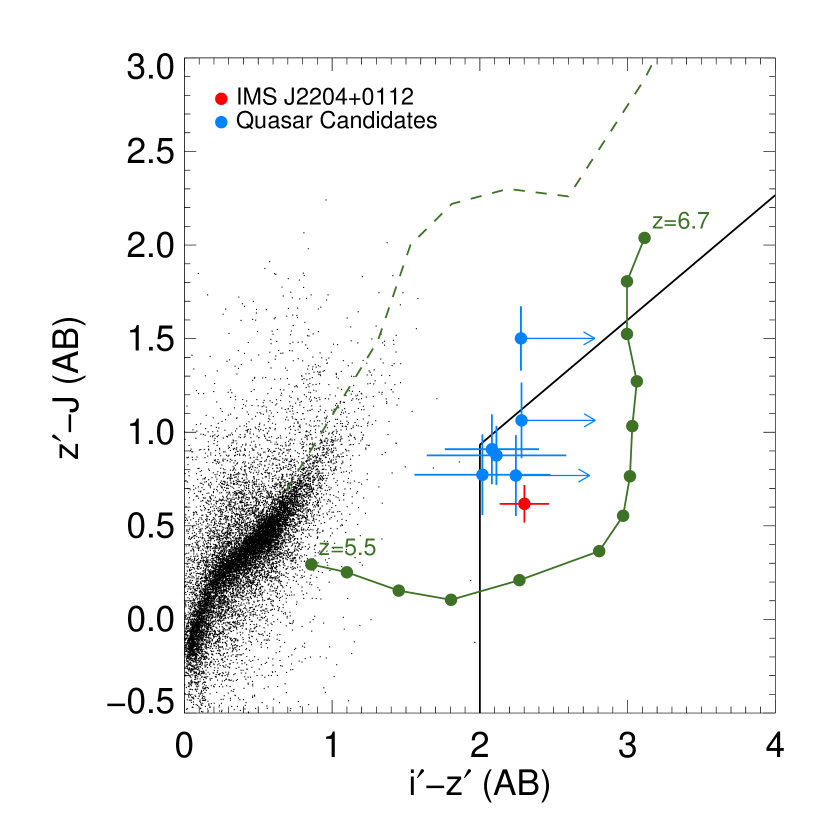
The spectral energy distributions (SEDs) of quasars at show a sudden break blueward of Ly (rest-frame 1216 ) due to the Gunn-Peterson effect (Gunn & Peterson, 1965). The break is located at for a quasar at , which creates a very red color, but blue colors at longer wavelengths. Figure 1 shows the color-color diagram for point sources in the IMS SA22 field. We used color cuts of and for sources at and required no detection (2 level) in -, -, and -band images. Here, is the 7 detection limit in the -band. The first color cut samples objects with a strong break at , and the second color cut removes red stars such as brown dwarfs. These color selection criteria are identical to those in Willott et al. (2009).
Spurious detections such as diffraction spikes could produce a number of false -dropout objects with very red colors that satisfy the color selection criteria. To remove spurious sources, we reject objects that (1) have FLAG in the SExtractor-produced catalogs to avoid blended objects and (2) are located at the edge of each image. The remaining objects were visually inspected in all filter images to finalize the quasar candidate selection (blue points in Figure 1). Most of the sources removed by visual inspection are diffraction spikes, crosstalks, or other image artifacts. Through this process, we identified seven quasar candidates at in the IMS SA22 field.
| R.A. Decl. (J2000.0) | Redshift | |||||
|---|---|---|---|---|---|---|
| 22:04:17.92 +01:11:44.8 |
4. Spectroscopic Observation
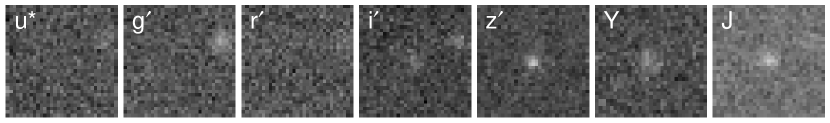
Among the seven quasar candidates at , IMS J220417.92+011144.8 (hereafter IMS J2204+0112) was given the highest priority for follow-up spectroscopy due to small magnitude errors (, ; see Table 1), the location of the object in the selection box, and its point-like shape in - and -band images (see Figure 2). We observed this target with the Gemini Multi-Object Spectrograph (GMOS; Hook et al. 2004) on the 8m Gemini South Telescope in Chile, on 2015 July 21 and 23 (Program ID: GS-2015A-Q-201).
The observation was carried out using the Nod & Shuffle (N&S) longslit mode with the R150_G5326 grating to facilitate skyline subtraction. We set the central wavelength to to avoid hot columns and spurious charges in one of the CCD chips that had a technical problem. Since we wanted to cover the gap between each CCD chip, the observation was made with two configurations of the grating with central wavelengths of and . We adopted the N&S slit with width and pixel binning for maximal S/N, which gives a spectral resolution of ( km s-1). In addition, the RG610_G0331 filter was used to avoid the order-overlap. Each N&S sequence contained eight cycles of s exposure and together with overheads, lasted 968 s. Although we observed 12 sequences for IMS J2204+0112, which gives a total exposure time of hr, we opted to use only five frames that were taken during good weather conditions (seeing , gray night).
We followed the standard data reduction procedure with the IRAF/Gemini package: (1) bias subtraction and flat-fielding, (2) sky subtraction with shuffled spectra, (3) wavelength calibration with the CuAr arc lines, and (4) flux calibration with a spectrophotometric star (LTT7987). After the flux calibration, we adjusted the overall flux scale using the photometric magnitude in the -band.
5. Discovery of A Faint Quasar at
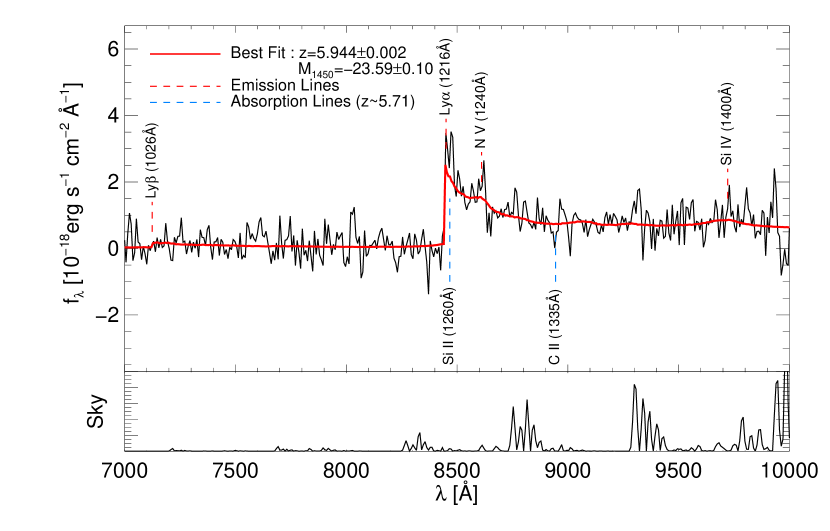
Figure 3 shows the spectrum of IMS J2204+0112. It shows a clear break at that can be identified as the redshifted Ly line. We fit the spectrum with a composite spectrum of SDSS quasars (Vanden Berk et al., 2001), including the IGM attenuation (Madau et al., 1996). The fit with the composite spectrum matches the observed spectrum of IMS J2204+0112 well and gives a redshift of . We estimate the absolute magnitude at the rest-frame wavelength of from the quasar spectrum to be mag. IMS J2204+0112 shows strong Ly and N V (rest-frame 1240 ) emission lines at , while a weak Si IV (1400 ) line can be seen at . Additionally, we identify possible absorption lines of Si II (1260 ) and C II (1335 ) at and , respectively, corresponding to an absorber at . The absolute magnitude of mag ranks IMS J2204+0112 as the third or the fourth faintest quasar at discovered to date (Willott et al., 2009; Kashikawa et al., 2015), depending on whether we treat the faintest quasar in Kashikawa et al. (2015) as a quasar or a Lyman break galaxy.
If we assume that the quasar is accreting at the Eddington limit (), then the black hole mass of the quasar is (Vestergaard & Osmer, 2009; Jun et al., 2015). We take this values as a lower limit of since this object could have lower than 1.
6. Discussion
We can ask how the discovery of a quasar with mag constrains the faint end of the quasar luminosity function, a question that is directly related to the reionization of the universe (Section 1). However, since we cannot robustly constrain the luminosity function using only one object, we instead estimate how many faint quasars are expected in a 12.5 deg2 area and see if the number matches with our discovery.
To measure the expected number of quasars, we estimate the completeness in the -band, as we detected the quasar candidates in -band. Using a simple minimum chi-square method, we fit the completeness data for -band of CFHTLS (Hudelot et al., 2012) with an analytic completeness function of the form (Fleming et al., 1995):
| (1) |
where is the turnover magnitude at which reaches 0.5 and is the slope at . We obtained mag and .
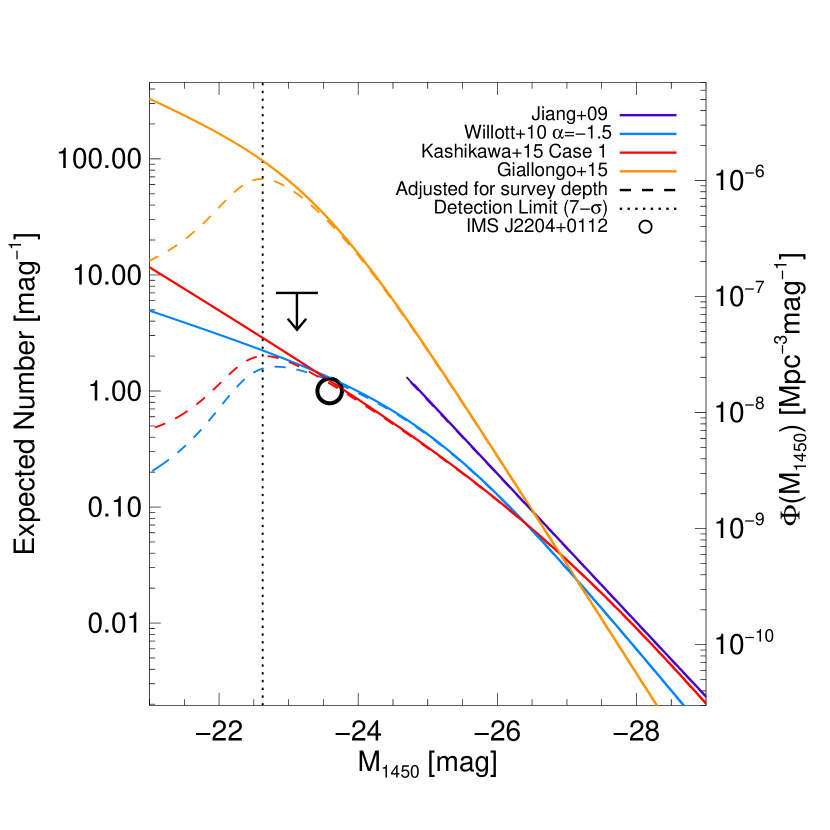
Figure 4 shows the expected number (or quasar luminosity function) of quasars over an area of 12.5 deg2. Note that Giallongo et al. (2015) presented their quasar luminosity function at . We scaled down this luminosity function by a factor of to take into account the number density evolution (Willott et al., 2010b) between and 6.0. Then we evaluated the number density by integrating the luminosity function over a redshift interval of that roughly corresponds to our selection window in redshift space. The solid lines represent the expected numbers from various quasar luminosity functions (Jiang et al., 2009; Willott et al., 2010b; Giallongo et al., 2015; Kashikawa et al., 2015), while the dashed lines show the cases adjusted for the survey depth with the completeness function. The purple line represents a single power-law luminosity function up to mag with a slope of (Jiang et al., 2009), while the blue and red lines represent double power-law luminosity functions from Willott et al. (2010b) and Kashikawa et al. (2015), respectively. The quasar luminosity function of Giallongo et al. (2015) is also shown as an orange line. The vertical dotted line represents the 7 detection limit in the -band. IMS J2204+0112 is plotted with an open circle. The error bar of the quasar is not shown because of the large uncertainty due to the small number statistics. The downward arrow represents the upper limit of the expected number that includes IMS J2204+0112 and the other six candidates for quasar at . The average absolute magnitude of the seven sources is mag.
For both luminosity functions of Willott et al. (2010b) and Kashikawa et al. (2015), the expected number of quasars is at mag, which is consistent with the number of faint quasars we discovered so far. If we include the other six candidates in the comparison (downward arrow in Figure 4), the number becomes times higher than the expected numbers from the luminosity functions (Willott et al., 2010b; Kashikawa et al., 2015). On the other hand, with the quasar luminosity function of Giallongo et al. (2015), the expected number of quasars at is at mag, which is significantly higher than our result even if we consider the spectroscopically unconfirmed candidates as real quasars. Giallongo et al. (2015) noted that AGN populations near contribute the most to the AGN hydrogen-ionizing emissivity. With their luminosity function, we find that AGN populations near the magnitude () would emit about 60 % of the required ultraviolet photons for the cosmic reionization. However, the emissivity estimated with luminosity functions of Willott et al. (2010b) and Kashikawa et al. (2015) at that magnitude interval is only % of the required emissivity. If faint quasars at are as abundant as the upper limit of our result, the fraction of the emissivity at () reaches up to of the required emissivity of the IGM reionization. The existence of IMS J2204+0112 is more in line with the quasar luminosity functions at of Willott et al. (2010b) and Kashikawa et al. (2015) rather than from Giallongo et al. (2015). Note that Giallongo et al. (2015) interpolated between bright quasars () and faint quasar candidates () with photometric redshifts to derive the quasar luminosity function at , while the luminosity functions of Willott et al. (2010b) and Kashikawa et al. (2015) are based on a small number of spectroscopically confirmed quasars. However, with the six quasar candidates, there is a possibility that the contribution of the quasars at to the cosmic reionization can be higher than previous predictions, but they might still not be the main contributors.
Our discovery of IMS J2204+0112 verifies that a moderately deep and wide NIR survey such as the IMS can efficiently discover low-luminosity quasars at . We expect that the analysis of the full IMS data set will net 10 times more faint quasars at than this study, supplying a sufficiently large sample of low-luminosity quasars to constrain the faint end of the quasar luminosity function and help understand the contribution of high-redshift quasars to the reionization of IGM in the early universe. Such a sample, combined with deep NIR spectroscopy, will also allow us to determine black hole masses and Eddington ratios of the faint quasar population. Ultimately, we can gain a more complete view of the quasar accretion activity at .
References
- Bañados et al. (2014) Bañados, E., Venemans, B. P., Morganson, E., et al. 2014, AJ, 148, 14
- Bertin & Arnouts (1996) Bertin, E., & Arnouts, S. 1996, A&AS, 117, 393
- Casali et al. (2007) Casali, M., Adamson, A., Alves de Oliveira, C., et al. 2007, A&A, 467, 777
- Fan et al. (2006) Fan, X., Strauss, M. A., Becker, R. H., et al. 2006, AJ, 132, 117
- Fleming et al. (1995) Fleming, D. E. B., Harris, W. E., Pritchet, C. J., & Hanes, D. A. 1995, AJ, 109, 1044
- Giallongo et al. (2015) Giallongo, E., Grazian, A., Fiore, F., et al. 2015, A&A, 578, A83
- Glikman et al. (2011) Glikman, E., Djorgovski, S. G., Stern, D., et al. 2011, ApJL, 728, L26
- Goto (2006) Goto, T. 2006, MNRAS, 371, 769
- Gunn & Peterson (1965) Gunn, J. E., & Peterson, B. A. 1965, ApJ, 142, 1633
- Hook et al. (2004) Hook, I. M., Jørgensen, I., Allington-Smith, J. R., et al. 2004, PASP, 116, 425
- Hudelot et al. (2012) Hudelot, P., Cuillandre, J.-C., Withington, K., et al. 2012, VizieR Online Data Catalog, 2317, 0
- Im et al. (1997) Im, M., Griffiths, R. E., & Ratnatunga, K. U. 1997, ApJ, 475, 457
- Jeon et al. (2010) Jeon, Y., Im, M., Ibrahimov, M., et al. 2010, ApJS, 190, 166
- Jiang et al. (2009) Jiang, L., Fan, X., Bian, F., et al. 2009, AJ, 138, 305
- Jiang et al. (2010) Jiang, L., Fan, X., Brandt, W. N., et al. 2010, Natur, 464, 380
- Jiang et al. (2007) Jiang, L., Fan, X., Vestergaard, M., et al. 2007, AJ, 134, 1150
- Jun & Im (2013) Jun, H. D., & Im, M. 2013, ApJ, 779, 104
- Jun et al. (2015) Jun, H. D., Im, M., Lee, H. M., et al. 2015, ApJ, 806, 109
- Karouzos et al. (2014) Karouzos, M., Im, M., Kim, J.-W., et al. 2014, ApJ, 797, 26
- Kashikawa et al. (2015) Kashikawa, N., Ishizaki, Y., Willott, C. J., et al. 2015, ApJ, 798, 28
- Kim et al. (2015) Kim, D., Im, M., Kim, J. H., et al. 2015, ApJS, 216, 17
- Madau et al. (1996) Madau, P., Ferguson, H. C., Dickinson, M. E., et al. 1996, MNRAS, 283, 1388
- Madau & Haardt (2015) Madau, P., & Haardt, F. 2015, arXiv:1507.07678
- Mortlock et al. (2011) Mortlock, D. J., Warren, S. J., Venemans, B. P., et al. 2011, Natur, 474, 616
- Vanden Berk et al. (2001) Vanden Berk, D. E., Richards, G. T., Bauer, A., et al. 2001, AJ, 122, 549
- Venemans et al. (2013) Venemans, B. P., Findlay, J. R., Sutherland, W. J., et al. 2013, ApJ, 779, 24
- Venemans et al. (2015) Venemans, B. P., Verdoes Kleijn, G. A., Mwebaze, J., et al. 2015, arXiv:1507.00726
- Vestergaard & Osmer (2009) Vestergaard, M., & Osmer, P. S. 2009, ApJ, 699, 800
- Willott et al. (2010a) Willott, C. J., Albert, L., Arzoumanian, D., et al. 2010a, AJ, 140, 546
- Willott et al. (2005) Willott, C. J., Delfosse, X., Forveille, T., Delorme, P., & Gwyn, S. D. J. 2005, ApJ, 633, 630
- Willott et al. (2010b) Willott, C. J., Delorme, P., Reylé, C., et al. 2010b, AJ, 139, 906
- Willott et al. (2009) Willott, C. J., Delorme, P., Reylé, C., et al. 2009, AJ, 137, 3541
- Wu et al. (2015) Wu, X.-B., Wang, F., Fan, X., et al. 2015, Natur, 518, 512