Infrared Time Lags for the Periodic Quasar PG 1302-102
Abstract
The optical light curve of the quasar PG 1302-102 at shows a strong, smooth 5.2 yr periodic signal, detectable over a period of yr. Although the interpretation of this phenomenon is still uncertain, the most plausible mechanisms involve a binary system of two supermassive black holes with a subparsec separation. At this close separation, the nuclear black holes in PG 1302-102 will likely merge within yr due to gravitational wave emission alone. Here we report the rest-frame near-infrared time lags for PG 1302-102. Compiling data from WISE and Akari, we confirm that the periodic behavior reported in the optical light curve from Graham et al. (2015a) is reproduced at infrared wavelengths, with best-fit observed-frame 3.4 and m time lags of days for a near face-on orientation of the torus, or days for an inclined system with relativistic Doppler boosting in effect. The periodicity in the infrared light curves and the light-travel time of the accretion disk photons to reach the dust glowing regions support that a source within the accretion disk is responsible for the optical variability of PG 1302-102, echoed at the further out dusty regions. The implied distance of this dusty, assumed toroidal region is 1.5 pc for a near face-on geometry, or 1.1 pc for the relativistic Doppler boosted case.
Subject headings:
galaxies: active — quasars: individual (PG 1302-102)1. Introduction
Optical reverberation mapping, measuring the time delay between variations in the accretion disk optical continuum luminosity of an active galactic nucleus (AGN) and the delayed response of the broad emission line luminosity, has become a standard technique to study the physics and structure of the inner regions of AGN (e.g., Blandford & Payne 1982; Peterson 1993; Bentz et al. 2006). Such studies enable measurement of the physical size of the broad line region, opening a way to estimate the virial black hole masses of distant AGNs (e.g., McLure & Jarvis 2002; Vestergaard & Peterson 2006; Jun et al. 2015) through the relation between broad line region size and optical luminosity (; e.g., Kaspi et al. 2000; Bentz et al. 2006).
Analogous to optical broad line reverberation analyses, light travel time lags between the ultraviolet/optical and near-infrared continuum provide a measurement of the physical size of the infrared-emitting dusty tori that are believed to surround most AGN (e.g., Penston et al. 1974; Clavel et al. 1989; Suganuma et al. 2006). The inferred time-lag-based sizes from this dust reverberation, supported by direct interferometric -band measurements for a few nearby AGN (e.g., Swain et al. 2003; Kishimoto et al. 2011a), shows that the dust emitting region scales with the ultraviolet/optical luminosity ( relation; e.g., Oknyanskij & Horne 2001; Koshida et al. 2014) with a similar square root power as the relation, but with a larger normalization. These radius-luminosity relations indicate that the geometric components of an AGN are spatially structured, such that illumination of the accretion disk propagates first through the broad line and later through the cooler, dusty regions.
Recently, Graham et al. (2015a) reported an unusual example of an optically variable quasar, PG 1302-102 at . The 9-yr optical light curve from the Catalina Real-time Transient Survey (CRTS; Drake et al. 2009), combined with historical data going back yrs, shows periodic variability with an observed period of days. Additional examples of similarly periodic quasars have recently been reported by Graham et al. (2015b) and Liu et al. (2015). This unusual phenomenology is distinct from the typical variability of most quasars which is akin to a damped random walk (e.g., MacLeod et al. 2012; Graham et al. 2014). The most likely interpretations of the periodic quasars involve close, subparsec binary supermassive black hole systems (e.g., D’Orazio et al., 2015a, b; Graham et al., 2015b).
Taking advantage of the distinct periodic signals in the optical, we investigate the infrared light curves of PG 1302-102 using data from the Wide-field Infrared Survey Explorer (WISE; Wright et al. 2010) and Akari (Murakami et al., 2007) missions. We also include more recent data from the Near-Earth Object WISE Reactivation mission (NEOWISE-R; Mainzer et al. 2014). We measure the time lags between the optical and infrared emission, thereby confirming that the optical periodicity is reproduced in the dust emission and provides a size measurement of the dust-emitting region. Furthermore, using multi-band m () and m () data, we investigate wavelength-dependent trends in the light curve time delays, which provide further information about the size and structure of the dusty torus. In a separate, related paper, D’Orazio et al. (2015b) report on the UV light curve of PG 1302-102, showing that it is consistent with relativistic boosting from a supermassive black hole binary being the cause of the observed UV and optical periodicity.
In this Letter, we describe the data collection and processing in §2, the measurement of time-lags and amplitudes in §3, and their implication for the binary supermassive black hole interpretation in §4. Throughout, photometry is reported in the Vega system and we adopt a flat CDM cosmology with , and .
2. Mid-Infrared Observations
PG 1302-102 is bright enough to have been detected in single exposures throughout the WISE mission. Collecting both cryogenic and post-cryogenic multi-epoch photometry from the AllWISE and NEOWISE-R data releases, as well as the most recent (pre-release) NEOWISE-R observations of PG 1302-102, we measure and light curves spanning 5.5 years (MJD 55208-57207). The data consist of seven groups spaced at intervals of roughly six months, albeit with a three year gap when WISE was in hibernation (MJD 55572-56668). Each group has 10-15 observations, with the latest data taken in July 2015. NEOWISE-R is expected to obtain additional groups of observations over the next yrs. We do not include longer wavelength data at m () or m () which are restricted to the cryogenic period of the WISE mission as the temporal coverage of those observations consist of only two groups. We further removed the data suffering from bad quality frames (qual_frame=0), charged particle hits (saa_sep0), or scattered moonlight (moon_masked=1).
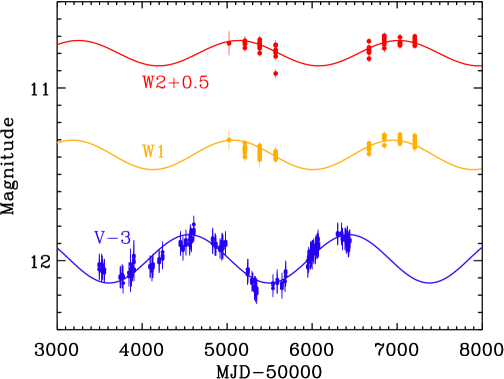
Supplementing the WISE observations of PG 1302-102, we also analyzed archival m grism spectra obtained by Akari six months prior to the WISE observations (Ohyama et al., 2007). Out of three post-cryogenic Akari spectra of PG 1302-102 taken on MJD 55022-55023, we removed the second spectrum as it is significantly affected by hot pixels. We convolved the processed and extracted spectra from the other two observations with the WISE filter responses (Wright et al., 2010) to obtain and equivalent magnitudes. Because the filter response extends longward of m, the wavelength cutoff of post-cryogenic Akari, we extrapolated the spectrum redward based on a power law fit, taking into account the uncertainties in the fitted parameters. Finally, we averaged the two Akari magnitudes, separated by one day, to improve the sensitivity. For ease of description, in the following we discuss the and light curves, though those light curves also include these earlier epoch Akari observations. Figure 1 presents the CRTS, WISE, and Akari light curves with the periodic functional fits (§3) overplotted.
3. Measurement of the Time Lags
Assuming that the optical variability of PG 1302-102 arises from the accretion disk(s) of the (binary) AGN, we expect the fluctuations in the optical luminosity to process through the inner dusty torus and produce a distribution of time lags in the hot dust emission corresponding to the light travel time to the inner portions of the torus. We aim to measure the cross-correlation signal between the optical and infrared magnitudes, and test if the infrared light curves trace the periodic variability appearing in the optical time series data.
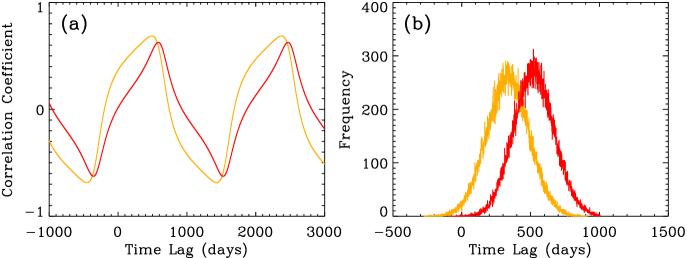
Because the optical light curves in Graham et al. (2015a) show a well defined periodic behavior, we first cross correlate their sinusoidal model fit with the and band data. In Figure 2(a) we plot the cross correlation amplitudes for a range of time lags. The cross correlation amplitudes peak at 0.69 for and 0.63 for , indicating that the WISE data are moderately correlated to the periodic optical light curve model.
To give proper treatment of the uncertainties into the cross correlation analysis (e.g., Peterson et al. 1998), we performed a set of Monte Carlo simulations including the observational uncertainty from the CRTS data (0.06 mag) and the uncertainty in the optical period (88 days). We performed 100,000 realizations adding random Gaussians to the model magnitudes with mag, and modifying the period by adding random Gaussians with days. We measured the centroid of each simulated cross correlation function where the amplitudes were above 0.8 times the peak value, while limiting the range of time lags to days to do away with the other periodic solutions. In Figure 2(b) we plot the resultant distribution of the time lags from the Monte Carlo simulations. Adopting the fiducial time lag as the mean of the distribution of simulated time lags, and the uncertainty as the 34.13% percentile in the time lag distribution deviated from the mean (Peterson et al., 1998), the and time lags to the optical model (, observed-frame days) become
| (1) |
with any integer () multiples of 1884 days providing equally probable solutions (at least mathematically, if not physically).
The sizable cross correlation amplitudes to the periodic model imply that the WISE light curves are also periodically variable. We checked this by fitting the infrared light curves of PG 1302-102 with periodic functions and calculating the signal-to-noise (S/N) of the periodic modulation above white noise. Adopting the sinusoidal period from Graham et al. (2015a), we fit the magnitude at the observed-frame time as , solving for amplitude and magnitude zero-point , and fixing the period days. Applying the best-fit values into the periodic S/N ratio indicator of Horne & Baliunas (1986), we get values of 5.7, 4.1, and 3.4 in the optical, , and , respectively. The false alarm probability that a periodicity in the data arises from pure noise, equations (13) and (23) from Horne & Baliunas (1986), yield from the CRTS data alone, and and for and , where these estimates of were calculated assuming evenly spaced data. The extremely small values imply with high likelihood that the source is periodic in all three wavebands.
We next attempt to estimate the most reasonable time lag between the optical and mid-infrared light curves, in equation (1), out of the infinite number of solutions allowed. First, we assume that the time lags are positive such that they represent the reverberation of the incident optical photons through dust re-processed emission, requiring in equation (1).
Further refinement of the value of requires a physical model of the system. In the general picture of a toroidally shaped dusty torus, most of the mid-infrared emission at these wavelengths will come from the inner edge of the torus, with longer wavelength emission coming from slightly larger radii, corresponding to cooler material (e.g., Nenkova et al. 2008). For an axisymmetric model of the torus simply responding to variations in the accretion disk luminosity, the time delay then depends on the light travel time to the inner edge of the torus and the orientation of the torus relative to our line of sight, , where is the radius of the inner edge of the torus, is the speed of light, and is the inclination angle ( corresponds to face-on; corresponds to edge-on). Alternatively, D’Orazio et al. (2015b) present a compelling and physically motivated model for PG 1302-102 where the modulated UV/optical emission is due to relativisic Doppler boosting of emission from a “minidisk” in a steadily accreting, unequal mass binary. In 2D and 3D hydrodynamical simulations of supermassive black hole binaries, circumprimary and circumsecondary minidisk accretion flows form around the two black holes, with a larger circumbinary accretion disk on larger scales (e.g., Shi et al. 2012; D’Orazio et al. 2013). For an unequal mass system, the secondary carves out an annular region in the circumbinary disk, limiting the amount of material that reaches the primary. Most of the emission at optical through X-ray energies will thus be associated with the rapidly accreting secondary, which D’Orazio et al. (2015b) show is likely moving at with an orbital inclination of for the PG 1302-102 system. Relativistic Doppler boosting then produces a system akin to a rotating lighthouse, producing a sinusoidal light curve with a period . Whereas the peaks of the UV and optical light occur when the “lighthouse” is pointed towards the observers line-of-sight, peaks in the thermal mid-infrared emission, which is predominantly coming from the inner wall of the far side of the torus, correspond to when the “lighthouse” is pointed away from the observer, giving an additional to the infrared time lag.
We can now use these models to place limits on the dust lags based on the sublimation radius of hot dust. The physically motivated lighthouse model is effective when the inclination is large so that the relativistic boosting is working, and the near side of the torus is blocked from our line of sight. Thus, our variable circumbinary accretion disk model predicts and is appropriate for small , while the relativistic Doppler boosting model predicts and requires large . The inner radius of the torus corresponds to the dust sublimation radius , i.e., the closest distance to the central engine that dust is not destroyed, and we solve for in the time lag from equation (1) where the two radii are closest to each other, or . Graphite dust grains are better able to survive in the hotter, inner region of the torus than silicate, and they are thought to be responsible for the rest-frame near-infrared emission from quasars (e.g., Mor & Netzer 2012; Jun & Im 2013). We use the graphite dust sublimation radius pc for a sublimation temperature K (Mor & Netzer, 2012). At and a median mag for PG 1302-102 (Marziani et al. 1996; Ojha et al. 2009; Prochaska et al. 2011; Graham et al. 2015a), adopting a 5100Å to bolometric correction of 10.33 (Richards et al., 2006). Thus, we have rest-frame light days (1.30 pc), or observed-frame light days. For a near face-on orientation of the torus (), and the solution from equation (1), ( days, best meets from the time lag, with =1.46 pc. Meanwhile, for a relativistic Doppler boosted torus with , the solution, ( days, gives the best match between and with pc. We note that the uncertainty in the approximation could be a few tens of percent (Mor & Netzer, 2012), and that even with the same adopted K, the value of varies across the literature by 20-60% due to slightly different model assumptions (e.g., Barvainis 1987; Nenkova et al. 2008). Also the uncertainty in the bolometric correction from the mean quasar template could be as large as 50% (Richards et al., 2006), translating into 25% uncertainty in .
We now consider the most probable WISE time lags in the context of the observed relation from Koshida et al. (2014). [Note that since Koshida et al. (2014) studied variable but non-periodic AGN, nor is the Doppler-boosted lighthouse model likely appropriate for their single black hole systems, their work does not suffer the same degeneracy with integer multiples of the variability period.] The WISE and filters correspond to rest-frame 2.6 and m at . Using the median optical magnitudes of , the rest-frame -band luminosity of PG 1302-102 is . Based on the -band relation (Koshida et al., 2014), the expected observed-frame time lag at is days. Our and lags are above the Koshida et al. (2014) relation by 0.15 and 0.18 dex for , and 0.41 and 0.43 dex for . The former offsets are comparable to the observed scatter of the relation (0.14 dex), but the latter are not, consistent with the delay effect and the large inclination angle required by the lighthouse model. We also note that the -band relation generally predicts smaller than by factors of a few, and Koshida et al. (2014) details how depends both on dust grain size and the details of the dust grain absorption efficiency. Also, Nenkova et al. (2008) note that the largest grains could survive to closer radii than , presumably detected by the -band time lags.
Previous near-infrared studies of local AGN have shown dust lags are typically longer at longer near-infrared wavelengths, since cooler material (e.g., further out material) will dominate the emission at progressively longer wavelengths (e.g., Kishimoto et al. 2011b; Vazquez et al. 2015). The time lag is consistent with, or only marginally larger than the lag with a ratio for the and for the solution in equation (1). Following Vazquez et al. (2015), we quote the radial distribution of dust grains in radiative equilibrium (e.g., Barvainis 1987; Nenkova et al. 2008) scaling with temperature as and find , much higher than the value from this study. Alternative explanations such as clumpy tori (Nenkova et al., 2008) are successful in emitting a broad infrared spectrum from a confined distribution of dust.
4. Discussion
Graham et al. (2015ab) list several possible physical mechanisms to produce the periodic optical light curves in PG 1302-102: non-thermal contribution from a precessing jet in a supermassive black hole binary, periodic mass accretion in a circumbinary accretion disk, or a precessing warped disk (which might also be related to a binary supermassive black hole). Our results suggest that the observed mid-infrared variability is being driven by variations in the accretions disk(s). For example, in the precessing jet scenario, one would expect very little temporal offsets, if any, between the optical and infrared variability. Indeed, the observed periodic signal in the WISE data and the cross correlation results support that dust is reverberating input luminosity from the accretion disk.
The elliptical host galaxy morphology of PG 1302-102 and the presence of close companion galaxies around it (Bahcall et al. 1995; Disney et al. 1995) are suggestive of a recent merger driving high-luminosity AGN activity (e.g., Treister et al. 2012; Hong et al. 2015). Indeed, the host galaxy of PG 1302-102 measured from - and -band imaging are classified as asymmetric and tidal tail morphologies, respectively (Guyon et al. 2006; Hong et al. 2015). The galaxy-scale morphology hints that this system may be in an ongoing merger.
The mid-infrared light curves of PG 1302-102 are indicative of periodic dust reverberation lagging behind the optically periodic light curve due to the light travel time to the mid-infrared emitting dusty torus, with a possible additional phase lag in the relativistic Doppler boosting lighthouse model. For both models, the time lags imply that the dust is echoing outside the accretion disk but from a small, possibly clumpy medium, and we predict that the narrow flourescent Fe K X-ray emission should vary on the same period and with the same phase lag as the mid-infrared emission. Time domain studies are starting to reveal events in AGNs occurring on physical scales that are not resolvable from the Earth, helping to constrain the source of variability and properties of the variable structure (e.g., Risaliti et al. 2013; LaMassa et al. 2015; Mehdipour et al. 2015; Stern et al. 2015). In particular, multiwavelength time domain surveys of AGN combining optical data with mid-infrared data from WISE, as done here, or from the Spitzer Space Telescope (e.g., Gorjian et al. 2014; Vazquez et al. 2015), probe the physical structure and accretion mechanisms of the AGN accretion disk and surrounding dusty material.
References
- Bahcall et al. (1995) Bahcall, J. N., Kirhakos, S., & Schneider, D. P. 1995, ApJ, 450, 486
- Barvainis (1987) Barvainis, R. 1987, ApJ, 320, 537
- Bentz et al. (2006) Bentz, M. C., Peterson, B. M., Pogge, R. W., Vestergaard, M., & Onken, C. A. 2006, ApJ, 644, 133
- Blandford & Payne (1982) Blandford, R. D., & Payne, D. G. 1982, MNRAS, 199, 883
- Clavel et al. (1989) Clavel, J., Wamsteker, W., & Glass, I. S. 1989, ApJ, 337, 236
- Disney et al. (1995) Disney, M. J., Boyce, P. J., Blades, J. C., et al. 1995, Nature, 376, 150
- D’Orazio et al. (2013) D’Orazio, D. J., Haiman, Z., & MacFadyen, A. 2013, MNRAS, 436, 2997
- D’Orazio et al. (2015a) D’Orazio, D. J., Haiman, Z., Duffell, P., Farris, B. D., & MacFadyen, A. I. 2015a, MNRAS, 452, 2540
- D’Orazio et al. (2015b) D’Orazio, D. J., Haiman, Z., & Schiminovich, D. 2015b, Nature, 525, 351
- Drake et al. (2009) Drake, A. J., Djorgovski, S. G., Mahabal, A., et al. 2009, ApJ, 696, 870
- Gorjian et al. (2014) Gorjian, V., Barth, A. J., Bloom, J. S., et al. 2014, American Astronomical Society Meeting Abstracts #223, 223, #251.08
- Graham et al. (2014) Graham, M. J., Djorgovski, S. G., Drake, A. J., et al. 2014, MNRAS, 439, 703
- Graham et al. (2015a) Graham, M. J., Djorgovski, S. G., Stern, D., et al. 2015a, Nature, 518, 74
- Graham et al. (2015b) Graham, M. J., Djorgovski, S. G., Stern, D., et al. 2015b, MNRAS, 453, 1562
- Guyon et al. (2006) Guyon, O., Sanders, D. B., & Stockton, A. 2006, ApJS, 166, 89
- Hong et al. (2015) Hong, J., Im, M., Kim, M., & Ho, L. C. 2015, ApJ, 804, 34
- Horne & Baliunas (1986) Horne, J. H., & Baliunas, S. L. 1986, ApJ, 302, 757
- Jun & Im (2013) Jun, H. D., & Im, M. 2013, ApJ, 779, 104
- Jun et al. (2015) Jun, H. D., Im, M., Lee, H. M., et al. 2015, ApJ, 806, 109
- Kaspi et al. (2000) Kaspi, S., Smith, P. S., Netzer, H., et al. 2000, ApJ, 533, 631
- Kishimoto et al. (2011a) Kishimoto, M., Hönig, S. F., Antonucci, R., et al. 2011a, A&A, 527, A121
- Kishimoto et al. (2011b) Kishimoto, M., Hönig, S. F., Antonucci, R., et al. 2011b, A&A, 536, A78
- Koshida et al. (2014) Koshida, S., Minezaki, T., Yoshii, Y., et al. 2014, ApJ, 788, 159
- LaMassa et al. (2015) LaMassa, S. M., Cales, S., Moran, E. C., et al. 2015, ApJ, 800, 144
- Liu et al. (2015) Liu, T., Gezari, S., Heinis, S., et al. 2015, ApJ, 803, L16
- MacLeod et al. (2012) MacLeod, C. L., Ivezić, Ž., Sesar, B., et al. 2012, ApJ, 753, 106
- Mainzer et al. (2014) Mainzer, A., Bauer, J., Cutri, R. M., et al. 2014, ApJ, 792, 30
- Marziani et al. (1996) Marziani, P., Sulentic, J. W., Dultzin-Hacyan, D., Calvani, M., & Moles, M. 1996, ApJS, 104, 37
- Mehdipour et al. (2015) Mehdipour, M., Kaastra, J. S., Kriss, G. A., et al. 2015, A&A, 575, 22
- Nenkova et al. (2008) Nenkova, M., Sirocky, M. M., Nikutta, R., Ivezić, Ž., & Elitzur, M. 2008, ApJ, 685, 160
- McLure & Jarvis (2002) McLure, R. J., & Jarvis, M. J. 2002, MNRAS, 337, 109
- Mor & Netzer (2012) Mor, R., & Netzer, H. 2012, MNRAS, 420, 526
- Murakami et al. (2007) Murakami, H., Baba, H., Barthel, P., et al. 2007, PASJ, 59, 369
- Ohyama et al. (2007) Ohyama, Y., Onaka, T., Matsuhara, H., et al. 2007, PASJ, 59, 411
- Ojha et al. (2009) Ojha, R., Zacharias, N., Hennessy, G. S., Gaume, R. A., & Johnston, K. J. 2009, AJ, 138, 845
- Oknyanskij & Horne (2001) Oknyanskij, V. L., & Horne, K. 2001, Probing the Physics of Active Galactic Nuclei, 224, 149
- Penston et al. (1974) Penston, M. V., Penston, M. J., Selmes, R. A., Becklin, E. E., & Neugebauer, G. 1974, MNRAS, 169, 357
- Peterson (1993) Peterson, B. M. 1993, PASP, 105, 247
- Peterson et al. (1998) Peterson, B. M., Wanders, I., Horne, K., et al. 1998, PASP, 110, 660
- Prochaska et al. (2011) Prochaska, J. X., Weiner, B., Chen, H.-W., Cooksey, K. L., & Mulchaey, J. S. 2011, ApJS, 193, 28
- Richards et al. (2006) Richards, G. T., Lacy, M., Storrie-Lombardi, L. J., et al. 2006, ApJS, 166, 470
- Risaliti et al. (2013) Risaliti, G., Harrison, F. A., Madsen, K. K., et al. 2013, Nature, 494, 449
- Shi et al. (2012) Shi, J.-M., Krolik, J.H., Lubow, S.H. & Hawley, J.F. 2012, ApJ, 749, 118
- Suganuma et al. (2006) Suganuma, M., Yoshii, Y., Kobayashi, Y., et al. 2006, ApJ, 639, 46
- Stern et al. (2015) Stern, D., Arav, N., Graham, M. J. et al. 2015, ApJ, submitted
- Swain et al. (2003) Swain, M., Vasisht, G., Akeson, R., et al. 2003, ApJ, 596, L163
- Treister et al. (2012) Treister, E., Schawinski, K., Urry, C. M., & Simmons, B. D. 2012, ApJ, 758, L39
- Vazquez et al. (2015) Vazquez, B., Galianni, P., Richmond, M., et al. 2015, ApJ, 801, 127
- Vestergaard & Peterson (2006) Vestergaard, M., & Peterson, B. M. 2006, ApJ, 641, 689
- Wright et al. (2010) Wright, E. L., Eisenhardt, P. R. M., Mainzer, A. K., et al. 2010, AJ, 140, 1868