Energy range of hadronic calorimeter towers and cells for high- jets at a 100 TeV collider
Abstract
This paper discusses a study of tower and cell energy ranges of a hadronic calorimeter for a TeV collider. The dynamic energy ranges were estimated using Standard Model jets with transverse momenta above TeV. The simulations were performed using the PYTHIA Monte Carlo model after a fast detector simulation tuned to the ATLAS hadronic calorimeter. We estimate the maximum energy range of towers and cells as a function of lateral cell sizes for several extreme cases of jet transverse energy.
keywords:
hadronic calorimeter, jets, dynamic range, Monte Carlo, FCC1 Introduction
The Future Circular Collider (FCC) is a proposed 80-100 km long ring that would collide protons at 100 TeV. A large experiment like this will require a detector that can measure high-energy particles and jets in the energy range of tens of TeV. For example, collisions at 100 TeV will produce hundreds111We assume the cross section of fb-1 for the jet production with TeV and with an integrated luminosity of 10 ab-1. of Standard Model jets with transverse momentum TeV, while many models beyond the Standard Model can lead to an even larger number of jets above TeV. This means that the calorimeter system of an FCC detector must be able to handle large energy depositions. The energy range of towers and cells of this future hadronic calorimeter must be well understood in order to set a stage for technology choices of future calorimeters.
The current calorimeters at the LHC are designed to measure jets with transverse momenta up to TeV. The dynamic range of cells of a typical calorimeter at the LHC is about , spanning the energy range of GeV for the ATLAS Tile calorimeter [1, 2]. The lowest energy of 0.2 GeV is typically needed for muon reconstruction, while the upper value of this range is set by high- jets. It is clear that the dynamic range of a calorimeter which is designed to measure jets above TeV should be substantially extended.
In order to explore the maximum dynamic range of such a calorimeter, we use the HepSim repository [3] with Pythia8 predictions [4], and the DELPHES fast simulation [5] after a proper tune of this simulation to describe energy sharing between different layers of hadronic calorimeters. We discuss the expected dynamic range for high-luminosity LHC (HL-LHC), and then we repeat this analysis for 100 TeV collision energies. We assume that the calorimeter consists of electromagnetic and hadronic sections. In our discussion, we also assume that a “typical” hadronic calorimeter has an interaction length () of 80% of the total interaction length of the entire calorimeter system.
2 Fast simulation
The fast detector simulation uses the DELPHES framework which incorporates a tracking system, magnetic field, calorimeters, and a muon system [5]. DELPHES simulates the calorimeter system by summing together cells to form towers222Towers are regions defined in pseudorapidity and azimuthal angle .. The towers are divided into electromagnetic and hadronic sections. For the central analysis in this paper, we used towers of the size in pseudorapidity () and the azimuth angle (). Such tower sizes correspond to the sizes of the ATLAS hadronic calorimeter, the so-called Tile calorimeter.
The study of cell dynamic range requires tuning DELPHES to a full simulation of a hadronic calorimeter in order to reproduce the longitudinal energy profile of hadronic showers. To tune DELPHES towers to the Tile calorimeter, we assume that all of the energies from photons, leptons and particles are deposited in the electromagnetic section. Other particles deposit 60% of their energy in the hadronic section [6], and 40% in the electromagnetic section. It should be pointed out that these fractions are set to be constant and do not depend on particle’s momentum, since DELPHES does not handle energy sharing between electromagnetic and hadronic parts of a calorimter.
To convert towers to the cells we must go a step further. In the case of the ATLAS calorimeter, about of a jet’s energy inside the hadronic calorimeter is deposited to the first layer as follows from the full detector simulation of the ATLAS calorimeter system [7]. In order to convert tower energies to the cell energies, a scaling factor of 0.5 was applied to the tower energies using a Gaussian random distribution with the standard deviation of [7].
3 Results
3.1 ATLAS-like calorimeter for HL-LHC

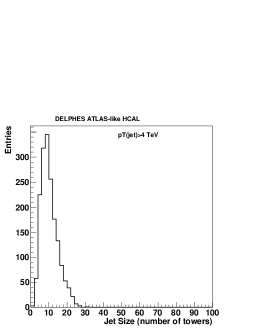
With DELPHES correctly tuned, Standard Model dijet events were generated by PYTHIA8 Monte Carlo model. The particle-level event samples were downloaded from the HepSim repository [3]. The jets are reconstructed using the anti- algorithm [8] with a distance parameter of 0.4 using the FastJet package [9]. We select jets with TeV and . In total, about 5,000 high- events were considered for this study. Figure 1 shows that approximately towers on average make up a jet in the DELPHES program. This number does not change significantly with the transverse momentum cut in the range 3-4 TeV.
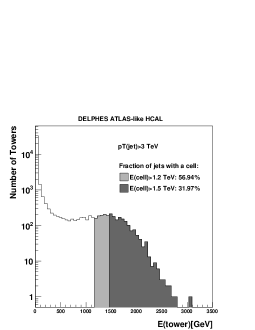
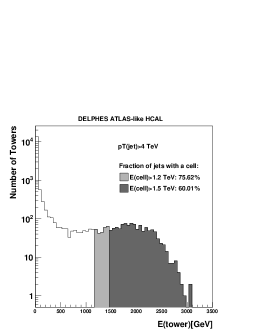
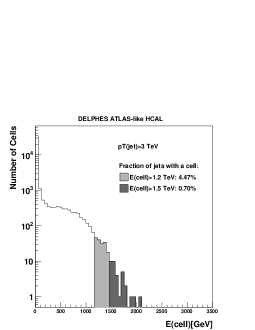
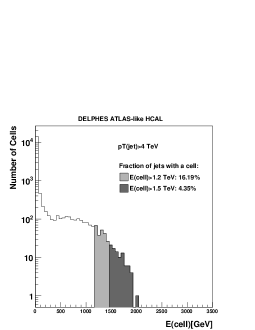
If we consider whole towers to have a limited dynamic range of 1.2 TeV (1.5 TeV), then we find 70% (32%) of jets with at least one tower past this limit. For jets with TeV, these percentages rise to about 75% and 60% respectively. However, these fractions decrease when individual cells are simulated. Figure 3 shows that the fraction of jets affected by cell limits of 1.2 and 1.5 TeV drop to about 5% and 1%, respectively. Since multiple cells make up one tower, a single cell will never measure as much energy as a tower does. Thus, a cell is much less likely to saturate. The obtained limits are similar to those anticipated for the hadronic-calorimeter cells for the ATLAS phase II upgrade [2].
It should be noted that this simulation presents an optimistic view of these jet fractions. This study makes the assumption that the energy of hadrons in the hadronic part of a calorimeter system is fixed to as discussed before. Note that DELPHES does not correct for energy-dependent effects of longitudinal propagation of particles. Hence, the actual jet fractions may be higher than the values presented here. Nevertheless, the simulated numbers are close to those found by running a full simulation of the ATLAS detector.
3.2 ATLAS-like calorimeter for 100 TeV collisions
After the HL-LHC studies, we turn to jets that will be produced at a 100 TeV collider. As before, we use the DELPHES simulation tuned to the ATLAS-like hadronic calorimeter as described in the previous sections. The dijets events [3] were generated with PYTHIA8 at a 100 TeV collision energy, and are reconstructed using the anti- algorithm discussed before. For our studies, we use jets with TeV and .
The lateral tower sizes of a calorimeter for a 100 TeV collider still need to be determined by looking at different physics cases. One possible option is to reduce the tower size from to . With this option, the energy in a single region of will be shared by 16 towers with independent redouts.
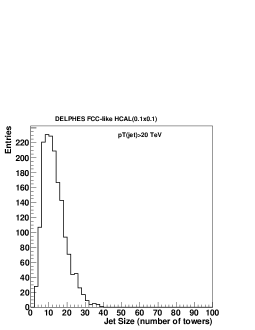
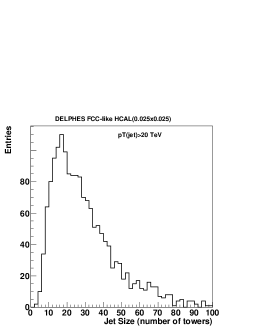
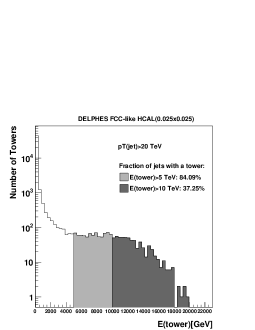
The distribution of towers for jets with TeV measured in the FCC detector is shown in Figure 4. For a tower division of , we find that the number of towers associated with jets increases by a factor two compared to a detector with a tower size of . If more towers make up a jet, we should expect that the energy range for the towers will decrease.
Figure 5 shows the distribution of energy seen by the towers of the size , while Fig. 5 shows the same but for the towers of the size . The latter case indicates a smaller energy range. However, even for towers with the size , there is a substantial amount of energy in the towers beyond TeV.
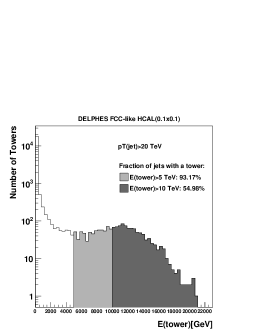
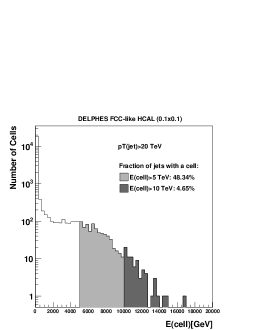
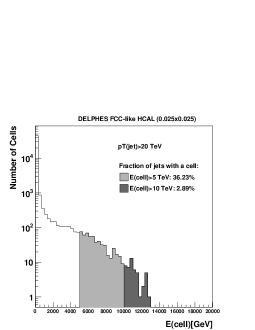
Figure 6 shows the energy distributions for calorimeter cells after applying the tunning procedure from the Geant4 simulations as described in the previous section. The fraction of jets with a cell above 5 TeV decreases from 48% to 36% when changing the cell size from to . Figure 6 shows that nearly half of all high- jets have at least one cell of size above 5 TeV. If cells are limited to the 10 TeV range, then only about 5% of jets have a saturated cell reading. These numbers, 5 and 10 TeV, are used as our initial guesses to illustrate the maximum energy range for calorimeter cells anticipated for a 100 TeV collider.
We have calculated 99% jet energy containment for anti- (R=0.4) jets with TeV and 30 TeV. It was defined as the maximum range needed for towers/cells to fully contain 99% of the jet energy from the Standard Model processes. Assuming a tower size of , the maximum energy containment in calorimeter towers is 18 (23) TeV for TeV. For cells of the same size, the energy containment values are 12 (16) TeV. For tower (cell) sizes, the maximum energy containment decreases by roughly 20% compared to the case with sizes. The size of this decrease was found to be smaller than naively expected, therefore, this observation needs to be verified with a full detector simulation.
4 Conclusion
This paper discusses the energy range of calorimeter towers and cells for HL-LHC and for a future hadronic calorimeter at a 100 TeV collider. We used a fast detector simulation in which energy sharing between electromagnetic and hadronic parts are tuned to the ATLAS detector.
It was shown that about 1% of jets with TeV will lose energy in reconstruction due to the present dynamic range of 0.2 GeV to 1.5 TeV of the ATLAS hadronic calorimeter. For 100 TeV collisions, the dynamic range should be extended up to 18 TeV (towers) and 12 TeV (cells) for jets with TeV, which will be rather common for 100 TeV collisions. This estimate assumes a similar lateral segmentation, energy sharing between electromagnetic and hadronic calorimeters, and similar fraction of energy contributing to the first layer of hadronic calorimeter as for ATLAS. These studies can be used to extrapolate the dynamic range values to smaller cell sizes. It should be noted that a provision for 30 TeV jets can be considered in the case of high- jet physics or exotic long-lived jets that deposit most of their energy in regions close to the surface of the calorimeter.
If the smallest energy to be reconstructed is 0.2 GeV as for the current designs of hadronic calorimeters, the maximum range of 18 TeV may represent technological challenges for the readouts that should be able to deal with dynamic energy range (versus for the current calorimeters).
Despite the fact that the fast simulation was tuned to reproduce the full simulation of the ATLAS calorimeter, it should be noted that the approximate nature of these calculations should fully be recognized when talking about 20-30 TeV jets. The quoted numbers are likely to be on the optimistic side, since the energy fraction of hadrons in a hadronic calorimeter should be energy dependent. At present, this effect cannot be simulated with a fast simulation. Nevertheless, we believe the obtained results can be used in early determination of the design options for a future hadronic calorimeter, but should later be checked when a full simulation becomes available.
Acknowledgements
We thank J. Proudfoot for the discussion. The submitted manuscript has been created by UChicago Argonne, LLC, Operator of Argonne National Laboratory (Argonne). Argonne, a U.S. Department of Energy Office of Science laboratory, is operated under Contract No. DE-AC02-06CH11357. Argonne National Laboratory’s work was supported by the U.S. Department of Energy under contract DE-AC02-06CH11357. The U.S. Government retains for itself, and others acting on its behalf, a paid-up nonexclusive, irrevocable worldwide license in said article to reproduce, prepare derivative works, distribute copies to the public, and perform publicly and display publicly, by or on behalf of the Government.
References
References
- [1] G. Aad, et al., Readiness of the ATLAS Tile Calorimeter for LHC collisions, Eur. Phys. J. C70 (2010) 1193–1236. arXiv:1007.5423, doi:10.1140/epjc/s10052-010-1508-y.
- [2] F. Tang, et al., Design of the Front-End Readout Electronics for ATLAS Tile Calorimeter at the sLHC, IEEE Transactions on nuclear science 60 (2013) 018.
- [3] S. Chekanov, HepSim: a repository with predictions for high-energy physics experiments, Advances in High Energy Physics 2015 (2015) 136093, available as http://atlaswww.hep.anl.gov/hepsim/.
- [4] T. Sjostrand, S. Mrenna, P. Z. Skands, A Brief Introduction to PYTHIA 8.1, Comput. Phys. Commun. 178 (2008) 852–867. arXiv:0710.3820, doi:10.1016/j.cpc.2008.01.036.
- [5] J. de Favereau, et al., DELPHES 3, A modular framework for fast simulation of a generic collider experiment, JHEP 1402 (2014) 057. arXiv:1307.6346, doi:10.1007/JHEP02(2014)057.
- [6] Y. Hernandez, The ATLAS Tile Calorimeter performance at LHC, Nucl. Instr. and Meth. in Phys. Res. 718 (2013) 83, proceedings of the 12th Pisa Meeting on Advanced DetectorsLa Biodola, Isola d’Elba, Italy, May 20 – 26, 2012.
- [7] ATLAS Tile Calorimeter System, Public Tile Calorimeter Plots for Collision Data (https://twiki.cern.ch/twiki/bin/view/AtlasPublic/TileCaloPublicResults%).
- [8] M. Cacciari, G. P. Salam, G. Soyez, The Anti-k(t) jet clustering algorithm, JHEP 0804 (2008) 063. arXiv:0802.1189, doi:10.1088/1126-6708/2008/04/063.
- [9] G. P. S. M. Cacciari, G. Soyez, FastJet user manual CERN-PH-TH/2011-297. arXiv:1111.6097.