Probing exoplanet clouds with optical phase curves111Published in PNAS (2015), vol. 112, no. 44, 13461–13466, doi: 10.1073/pnas.1509135112; www.pnas.org/cgi/doi/ 10.1073/pnas.1509135112.
Kepler-7b is to date the only exoplanet for which clouds have been inferred from the optical phase curve—from visible-wavelength whole-disk brightness measurements as a function of orbital phase. Added to this, the fact that the phase curve appears dominated by reflected starlight makes this close-in giant planet a unique study case. Here we investigate the information on coverage and optical properties of the planet clouds contained in the measured phase curve. We generate cloud maps of Kepler-7b and use a multiple-scattering approach to create synthetic phase curves, thus connecting postulated clouds with measurements. We show that optical phase curves can help constrain the composition and size of the cloud particles. Indeed, model fitting for Kepler-7b requires poorly absorbing particles that scatter with low-to-moderate anisotropic efficiency, conclusions consistent with condensates of silicates, perovskite, and silica of submicron radii. We also show that we are limited in our ability to pin down the extent and location of the clouds. These considerations are relevant to the interpretation of optical phase curves with general circulation models. Finally, we estimate that the spherical albedo of Kepler-7b over the Kepler passband is in the range 0.4–0.5.
Keywords: close-in giant | exoplanets | atmospheric characterization | clouds | optical phase curves
Significance: We investigate the potential of optical phase curves for the characterization of exoplanet clouds. In the case of the low-density, close-in giant planet Kepler-7b, its phase curve reveals that the planet clouds are optically thick and composed of poorly absorbing condensates. We also constrain the cloud particle size, which is an important parameter in the study of the photochemistry, wind dynamics, and cloud microphysics of the planet atmosphere. Our work establishes a valuable framework within which to investigate exoplanet atmospheres using upcoming flagship space missions such as the European Space Agency’s CHEOPS and PLATO and NASA’s TESS, which will all fly within the decade.
Phase curves provide unique insight into the atmosphere of a planet, a fact well-known and tested in solar system exploration [1, 2, 3]. Disentangling the information encoded in a phase curve is a complex process however, and interpretations can be faced with degeneracies. The potential of phase curves to characterise exoplanet atmospheres, particularly in combination with other techniques, is tantalising. Phase curves observed over all orbital phases (OPs) are available for a few close-in planets in the optical (passband central wavelengths 0.8 m) [4, 5, 6, 7, 8, 9, 10, 11, 12, 13, 14, 15] and the infrared (1 m24 m) [16, 17, 18, 19]. At infrared wavelengths the measured flux from hot planets is typically dominated by thermal emission. In the optical, both thermal emission and reflected starlight contribute, with the relative size of the contributions dependent on the measurement wavelength as well as on the temperature of the atmosphere and the occurrence of condensates [20, 21, 22, 23, 24, 25].
Kepler-7b [26] is one of the 1000 planets discovered by the Kepler mission. Its inferred mass (=0.44; J for Jupiter) and radius (=1.61) result in an unusually low bulk density (0.14 g cm-3) that is inconsistent with current models of giant planet interiors [27, 28]. Kepler-7b orbits a quiet G-type star of effective temperature =5933 K every 4.89 days (orbital distance =0.062 astronomical units) [6, 7], and tidal forces have likely synchronised its orbit and spin motions. Taken together these set a planet equilibrium temperature 1935 K.
Kepler photometry (0.4–0.9 m) of the star-planet system has enabled the optical study of Kepler-7b [4, 5, 6, 7, 10, 14]. The inferred geometric albedo, =0.25–0.38 [4, 6, 7, 10, 14], reveals a planet of reflectivity comparable to the solar system giants (=0.4–0.5), which is unexpectedly high for a close-in gas planet. Theory indeed predicts that the strong stellar irradiation that a planet in such an orbit experiences strips off reflective clouds, rendering the planet dark (0.1) [22, 25]. The prediction is largely consistent with empirical evidence, and dark planets dominate the sample of known close-in giant planets [8, 13, 21, 29, 30]. Exceptions exist, and other planets (51 Peg b, =0.5(1.9/(/))2 at 0.38–0.69 m [31]; HD 189733b, =0.400.12 at 0.29–0.45 m [32]; KOI-196b, =0.300.08 at 0.4–0.9 m [33]) with elevated albedos suggest that we are beginning to sample the diversity of exoplanet atmospheres. Potentially compensating for strong stellar irradiation, Kepler-7b’s low surface gravity (417 cm s-2) may help sustain reflective condensates lofted in the upper atmosphere that would increase the planet albedo [25].
Brightness temperatures for Kepler-7b inferred from occultations at 3.6 and 4.5 m with Spitzer (1700 and 1840 K, respectively [7]) are well below the equivalent brightness temperature deduced from Kepler data (2600 K). This key constraint, placed in the framework of heat recirculation in the atmospheres of close-in giants, is evidence that the Kepler optical phase curve is dominated by reflected starlight rather than by thermal emission [7, 21, 34]. Interestingly, the peak of the optical phase curve occurs after secondary eclipse (OP0.5), when the planet as viewed from Earth is not fully illuminated and longitudes westward of the substellar point are preferentially probed. This asymmetry hints at a spatial structure in Kepler-7b’s envelope caused by horizontally inhomogenous clouds [7, 21, 34]. Subsequent investigations have identified other planets that show similar offset between occultation and peak brightness [4, 10]. However the lack of infrared measurements for these means that it has not been possible to rule out contamination in the optical by a thermal component as the cause of the asymmetry.
Recent work has used the optical phase curve of Kepler-7b to build brightness maps [7, 34], investigate the prevalence of reflected starlight over thermal emission [34], and explore plausible cloud configurations [35]. No previous study has systematically connected the extent, location and optical thickness of the cloud, or the composition and size of the suspended particles, to the measured phase curve. That exercise is the objective of this paper.
Atmospheric model
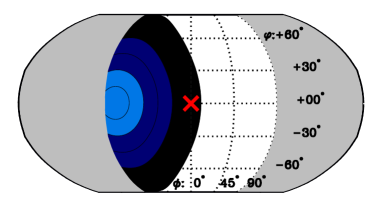
We set up an idealised atmospheric model of Kepler-7b that mimics a vertically uniform yet horizontally inhomogeneous cloud atop a gas sphere. In an initial exploratory investigation, six parameters (, , , , , ) specify the optical properties of the cloud-gas medium. An analytical expression captures the inhomogeneity of the optical thickness (, ; , , ) for the prescribed cloud in the longitude () and latitude () directions (SI Appendix). Here, denotes the maximum vertically integrated optical thickness within the cloud, yields a measure of its horizontal extent, and is the cloud offset eastward of the substellar point (Fig. 1). The fraction of photons that propagate further after collisions with cloud particles is set by the single scattering albedo , whereas the photon propagation directions are dictated by a double Henyey-Greenstein (DHG) phase function that has both forward and backward lobes [20, 36]. The shape of the DHG phase function is parameterised by the asymmetry parameter of the forward component (SI Appendix). A Lambert-like surface of reflectance at the bottom of the cloud accounts for the effect of scattering from the gas below. The values explored for the six parameters are given in Table 1, and include =0, 0.1, 0.2 and 0.3 and thus different degrees of absorption by the gas. A non-zero allows for partial back-scattering from the gas, and may be a more realistic representation of the atmosphere – alkalis and titanium/vanadium oxides can have broad spectral wings and are believed to be the main gas-phase absorbers over the Kepler passband [25, 37, 38]. The selected values are motivated by photochemical and cloud formation models over a range of temperatures bracketing the conditions on Kepler-7b [22, 25].
Model phase curves
We created a grid of possible atmospheric configurations that probes 1.5 million combinations of the six parameters. The radiative transfer calculations were performed using a Monte Carlo algorithm specifically designed for horizontally inhomogeneous planets [39, 40]. For each combination we solved the multiple scattering problem and generated a reflected starlight phase curve as a function of the star-planet-observer phase angle . Our treatment assumes that the contribution to the optical phase curve from thermal emission is minimal, which is appropriate for Kepler-7b [7, 34], and that can be neglected. To compare with the measurements, we expressed the model results as planet-to-star brightness ratios:
| (S1) |
with the planet phase function normalised such that (=0)1. and are the brightness of the planet and star, respectively. Kepler-7b follows a circular orbit of inclination angle =85.2∘ [6]. Changes in through the planet orbit were accounted for through =.
We evaluated the statistic, weighted by the measurement uncertainties, for the difference in between observations and models (SI Appendix). By construction, the calculated is a six-parameter function (, , , , , ). We excluded from the summation measurements within the transit and secondary eclipse, which makes the total number of usable measurements =1,244.
Phase curve interpretation
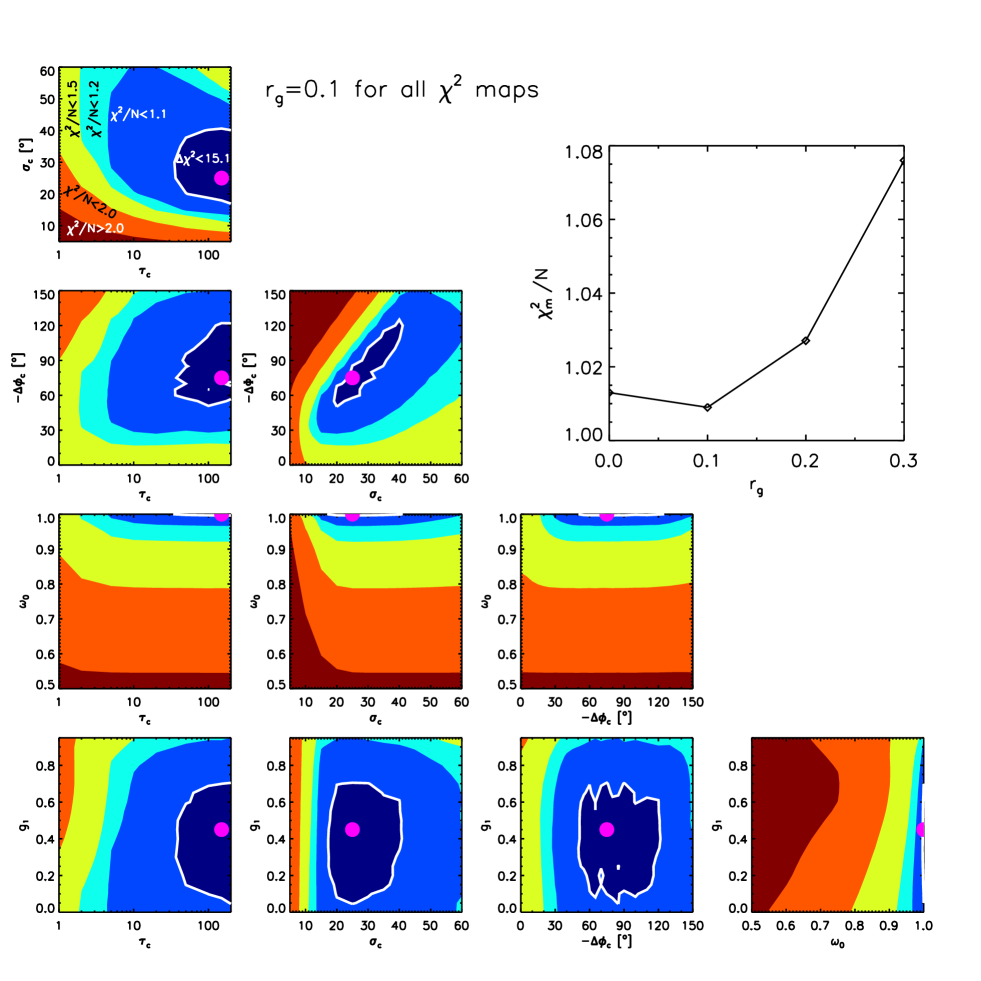
We found minimum =1.013, 1.009, 1.027 and 1.076 for =0, 0.1, 0.2 and 0.3, respectively, with values of the model input and output (albedo) parameters at the minima listed in Table 2. Individual confidence intervals for each input parameter were estimated from the inequality = 15.1 by optimising all parameters except and the one being considered (SI Appendix). Mathematically, the confidence intervals bracket the best-matching input parameters with a 99.99% probability (4 SDs) [41, 42]. For =0, 0.1, 0.2 and 0.3, the condition 15.1 resulted in a total of 289, 197, 160 and 131 model phase curves, respectively, which we refer to as the minimal- sets.
Projected 2D maps were obtained for each by optimisation of all input parameters except the two on the axes and (Fig. 2 for =0.1; SI Appendix, S8–S10 for =0, 0.2 and 0.3). The maps provide insight into how particular parameter combinations compensate for one another to produce degeneracies in the interpretation of the measured phase curve. They also help visualise the inferred confidence intervals.
Only prescribed clouds that are optically thick at their centre (20) reproduce the observations well. The constant-() contours show that the best-matching and values are correlated in continua of (, ) combinations that begin from narrow (15∘) clouds moderately displaced (45∘; westwards) from the substellar point and extend to much broader patterns centered near or beyond the western terminator. This is evidence that a variety of clouds provide comparable net scattering from the planet’s visible day side and reproduce the brightness peak after secondary eclipse.
We also find that cloud particles with near-zero absorption (1) must be invoked, and that low s are obtained within a broad interval of values. The asymmetry parameters for the forward component () and full scattering phase function () generally depend on the shape, size and composition of the scattering particles as well as on the wavelength of the incident radiation [43]. The fact that the minimal- sets contain model phase curves with values in the 0.05–0.7 range (0.05–0.57 for ; SI Appendix) suggests that both small particles (leading to isotropic scattering) and larger particles (leading to moderate anisotropic scattering efficiency) produce model phase curves consistent with the observations. Furthermore, the projected () reveals that variations are gradual in the direction, which makes it difficult to constrain this parameter. The latter difficulty is inherent to the interpretation of brightness phase curves and is well known from studies of Venus [1]. The modest signal-to-noise ratio of the Kepler-7b measurements does not create the difficulty, but does exacerbate it (SI Appendix). These conclusions are generally valid for all =0, 0.1, 0.2 and 0.3 minimal- sets.
Interestingly, (=0)(=0.1)(=0.2)(=0.3), and thus better fits are obtained when the prescribed cloud rests above a poorly reflecting gas atmosphere. Provided that alkalis dominate the gas-phase absorption, this might be consistent with a cloud that lies at pressures less than 10-4 bar for which the neutral-to-ion alkali transition likely occurs in the atmospheres of close-in giant planets [37].
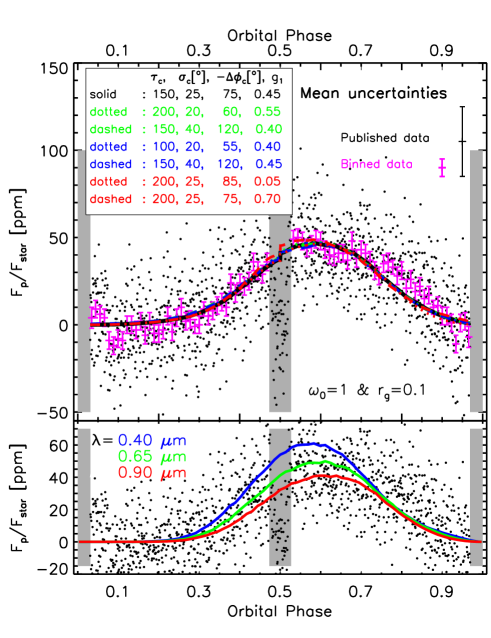
The degeneracy in the observation-model fitting is best appreciated in Fig. 3, Top. It confirms that many of the model phase curves in the minimal- sets are virtually indistinguishable to the naked eye, even though they correspond to very different cloud configurations. In the Venus case, a combination of whole-disk measurements of brightness and polarisation was required to reveal the composition and size of the upper cloud particles [1, 44, 45].
Cloud particle optical properties
We attempted to connect the constraints placed on the single scattering albedo and asymmetry parameter by the minimal- sets to the composition and particle size of plausible condensates. These are critical properties in the study of the photochemistry, wind dynamics and cloud microphysics of planetary atmospheres. We used Mie theory [46] to calculate values for and using particle parameters such as the effective radius () and real and imaginary parts of the refractive index ( and ) at a midband wavelength of 0.65 m (SI Appendix). A key outcome of the Mie calculations is that only condensates with 0.003 are consistent with the limits of ()0.99 and ()0.6 that we established based on the investigation of the minimal- sets.
We identified four candidate cloud components that have both condensation temperatures of 1,000-2,000 K, relevant to the equilibrium temperature of Kepler-7b [47, 48], and 0.003: two silicates (Mg2SiO4 and MgSiO3), perovskite (CaTiO3) and silica (SiO2). Without further information it is not possible to favour one candidate above another. Due to differences in their refractive indices, we were able to tentatively constrain the particle effective radius for each of them. For the silicates (1.6 and 10-4 in the optical, www.astro.uni-jena.de/Laboratory/OCDB/), we found that only Mie-scattering particles with =0.04–0.16 m complied with the inferred limits on and . In turn, for perovskite (=2.25 and 10-4 [48, 49]), the range of effective radii is =0.02–2 m. And for silica (=1.5 and 10-7 [50]), =0.004–0.16 m.
Significant optical thicknesses and moderately small particle sizes suggest that Kepler-7b’s cloud might be vertically extended and reach high in the atmosphere [35]. This idea appears consistent with the expectations for low-gravity planets [25] and with a plausible cloud base at the 10-4 bar level. Vigorous atmospheric winds, as predicted by 3D models [51], could well keep micron-sized and smaller particles aloft at such pressures [21].
It is appropriate to verify the above conclusions with a full Mie multiple-scattering treatment. The DHG approximation is a convenient but simplified approach to particle scattering. A more thorough treatment of the multiple scattering problem would have used particle phase functions derived from, e.g., Mie theory and would have explored separately the impact of , and on the model phase curves. At present, such a treatment is computationally prohibitive, which justifies our adoption of the DHG parameterisation for the exploration exercise.
To assess the conclusions on the inferred values of , we produced model phase curves specific to silicate, perovskite, and silica clouds. The new grid differs from the one summarised in Table 1 mainly in that we now omit the DHG parameterisation. Instead, we implement particle scattering phase functions and single scattering albedos obtained directly from Mie theory. For each particle composition (and corresponding , values), we sample from 0.001 to 100 m to produce the needed input to the multiple scattering problem. By forming (, , , , ) for each composition, and confidence intervals 15.1 for each model input parameter, we confirm that the above conclusions based on the DHG parameterisation are overall valid. Specifically, for we infer confidence intervals of 0.1–0.32 m (silicates), 0.08–0.2 m (perovskite) and 0.1–0.4 m (silica). Smaller particles result in excessive absorption, whilst particles that are too large lead to unobserved back scattering at small phase angles in the planet phase curves (SI Appendix, Fig. S3). These particle radii are to be preferred over those found from the DHG parameterisation.
Planet albedos
Both the geometric and spherical albedos quantify the overall reflecting properties of a planet (SI Appendix). For the minimal- sets, we infer 0.2–0.3 and 0.4–0.5 (Table 2). An 0.5 means that Kepler-7b reflects about half of the visible-wavelength radiation that it receives. Most of the stellar output for =5933 K is emitted over the Kepler passband, and thus the derived spherical albedos are also first-order approximations to the Bond albedos that impact directly on the energy budget and equilibrium temperature of the planet. Taking 0.5, we obtain an estimate for the planet equilibrium temperature (assuming no heat recirculation) of =1935/21/41630 K.
Multi-colour phase curves
Our investigation of Kepler-7b has shown that high-precision broadband optical photometry can help characterise exoplanet atmospheres. In the coming decade, photometric missions such as CHEOPS [52], PLATO [53] and TESS [54] will provide optical phase curves of numerous targets. Over the same period, the James Webb Space Telescope will provide the necessary infrared-discrimination power to separate the planet components due to reflected starlight and thermal emission. Future exoplanet missions will then be able to obtain multi-colour and spectrally-resolved phase curves.
We have explored the added value of multi-colour data. We produced model phase curves at =0.4 m, 0.65 m, and 0.9 m based on our best-matching solutions of the Kepler-7b data. Again, we assumed that thermal emission at all wavelengths considered is negligible and accounted for wavelength-dependent changes in and by assuming that the dominating cloud particles have =0.1 m, =1.5 and =0. The synthetic phase curves (Fig. 3, Bottom) and the differences between them of up to 20 ppm suggest that multi-colour observations will provide additional constraints on cloud properties.
Relevance to General Circulation Models
There are other approaches to interpret optical phase curves.
One of these is based on general circulation models (GCMs),
which jointly treat the dynamics, energetics and chemistry of 3D atmospheres
[16, 55, 56, 57].
GCMs often omit clouds however, a simplification
likely to affect the simulated atmospheric fields.
In addition, omitting clouds will affect the overall planet
brightness, as clouds
potentially reflect much of the visible-wavelength incident starlight.
Our finding that a continuum of cloud patterns is consistent with Kepler-7b’s optical phase curve suggests that
more than one GCM solution will also reproduce a given observed optical phase curve.
We have shown that difficult-to-constrain factors such as the extent and location of the cloud pattern
(dependent on the condensation of available atmospheric substances
and on whether the cloud forms locally or is transported from the night side by planet-scale winds)
or the asymmetry parameter (dependent on the cloud particle microphysics)
may compensate for one another and result in visually equivalent optical phase curves.
The credibility of GCM-based predictions of optical phase curves is
sensitive to these considerations: ignoring them
may lead to the misinterpretation of available and future optical data.
Acknowledgments
We acknowledge Brice-Olivier Demory (University of Cambridge, Cambridge, UK) for kindly providing the Kepler-7b data, Agustín Sánchez-Lavega and Santiago Pérez-Hoyos (Universidad del País Vasco/Euskal Herriko Unibertsitatea (UPV/EHU), Spain) for ideas on confidence intervals, and Christian Schneider (European Space Agency/European Space Research and Technology Centre (ESA/ESTEC), the Netherlands) for a critical reading of the manuscript and discussions on the estimation of uncertainties. A.G.M. gratefully acknowledges generous ESA support through an ESA Research Fellowship.
References
- [1] Arking, A. & Potter, J. (1968) The phase curve of Venus and the nature of its clouds. J. Atmos. Sci., 25:617–628.
- [2] Mallama, A. (2009) Characterization of terrestrial exoplanets based on the phase curves and albedos of Mercury, Venus and Mars. Icarus, 204:11–14.
- [3] Tomasko, M.G. & Smith, P.H. (1982) Photometry and polarimetry of Titan: Pioneer 11 observations and their implications for aerosol properties. Icarus, 51:65–95.
- [4] Angerhausen, D., DeLarme, E. & Morse, J. A. A comprehensive study of Kepler phase curves and secondary eclipes - Temperatures and albedos of confirmed Kepler giant planets. Publ. Astron. Soc. Pac, in press.
- [5] Coughlin, J.L. & López-Morales, M. (2012) A uniform search for secondary eclipses of hot Jupiter in Kepler Q2 light curves. Astrophys. J., 143:id.39.
- [6] Demory, B.-O., Seager, S., Madhusudhan, N., Kjeldsen, H., Christensen-Dalsgaard, J., et al. (2011) The high albedo of the hot Jupiter Kepler-7 b. Astrophys. J. Lett., 735:L12.
- [7] Demory, B.-O., de Wit, J., Lewis, N., Fortney, J., Zsom, A., et al. (2013) Inference of inhomogeneous clouds in an exoplanet atmosphere. Astrophys. J. Lett., 776:L25.
- [8] Demory, B.-O. (2014) The albedos of Kepler’s close-in super-Earths. Astrophys. J. Lett., 789:L20.
- [9] Esteves, L.J., De Mooij, E.J.W. & Jayawardhana, R. (2013) Optical phase curves of Kepler exoplanets. Astrophys. J., 772:id.51.
- [10] Esteves, L.J., De Mooij, E.J.W. & Jayawardhana, R. (2015). Changing phases of alien worlds: Probing atmospheres of Kepler planets with high-precision photometry. Astrophys. J., 804:id.150.
- [11] Faigler, S. & Mazeh, T. (2011) Photometric detection of non-transiting short-period low-mass companions through the beaming, ellipsoidal and reflection effects in Kepler and CoRoT light curves. Mon. Not. R. Astron. Soc., 415:3921–3928.
- [12] Gelino, D.M. & Kane, S.R. (2014) Phase curves of the Kepler-11 multi-planet system. Astrophys. J., 787:id.105.
- [13] Kipping, D.M. & Spiegel, D.S. (2011) Detection of visible light from the darkest world. Mon. Not. R. Astron. Soc., 417:L88.
- [14] Kipping, D. & Bakos, G. (2011) An independent analysis of Kepler-4b through Kepler-8b. Astrophys. J. Lett., 730:id.50.
- [15] Snellen, I.A.G., de Mooij, E.J.W. & Albrecht, S. (2009) The changing phases of extrasolar planet CoRoT-1b. Nature, 459:543–545.
- [16] Knutson, H.A., Charbonneau, D., Allen, L.E., Forntey, J.J., Agol, E. et al. (2007) A map of the day-night contrast of the extrasolar planet HD 189733b. Nature, 447:183–186.
- [17] Crossfield, I.J.M., Hansen, B.M.S., Harrington, J., Cho, J. Y.-K., Deming, D. et al. (2010) A new 24 m phase curve for Andromedae b. Astrophys. J., 723:1436–1446.
- [18] Lewis, N.K., Knutson, H.A., Showman, A.P., Cowan, N.B., Laughlin, G. et al. (2013) Orbital phase variations of the eccentric giant planet HAT-P-2b. Astrophys. J., 766:id.95.
- [19] Stevenson, K.B., Désert, J.-M., Line, M.R., Bean, J.L., Fortney, J.J. et al. (2014) Thermal structure of an exoplanet atmosphere from phase-resolved emission spectroscopy. Science, 346:838–841.
- [20] Cahoy, K.L., Marley, M.S. & Fortney, J.J. (2010) Exoplanet albedo spectra and colors as a function of planet Phase, separation, and metallicity. Astrophys. J., 724:189–214.
- [21] Heng, K. & Demory, B.-O. (2013) Understanding trends associated with clouds in irradiated exoplanets. Astrophys. J., 777:id.100.
- [22] Marley, M.S., Gelino, C., Stephens, D., Lunine, J. & Freedman, R. (1999) Reflected spectra and albedos of extrasolar giant planets. I. Clear and cloudy atmospheres. Astrophys. J., 513:879–893.
- [23] Schwartz, J.C. & Cowan, N.B. Balancing the energy budget of short-period giant planets: Evidence for reflective cloud and optical absorbers. MNRAS, 449:4192-4203.
- [24] Seager, S., Whitney, B.A. & Sasselov, D.D. (2000) Photometric light curves and polarization of close-in extrasolar giant planets. Astrophys. J., 540:504–520.
- [25] Sudarsky, D., Burrows, A. & Pinto, P. (2000) Albedo and reflection spectra of extrasolar planets. Astrophys. J., 538:885–903.
- [26] Latham, D.W., Borucki, W.J., Koch, D.G., Brown, T.M., Buchhave, L.A. et al. (2010) Kepler-7b: A transiting planet with unusually low density. Astrophys. J. Lett., 713:L140.
- [27] Baraffe, I., Chabrier, G. & Barman, T. (2010) The physical properties of extra-solar planets. Reports on Progress in Physics, 73:id.016901.
- [28] Fortney, J.J. & Nettelmann, N. (2010) The interior structure, composition, and evolution of giant planets. Space Science Reviews, 152:423–447.
- [29] Barclay, T., Huber, D., Rowe, J.F., Fortney, J.J., Morley, C.V. et al. (2012) Photometrically derived masses and radii of the planet and star in the TrES-2 system. Astrophys. J., 761:id.53.
- [30] Rowe, J.F., Matthews, J.M., Seager, S., Miller-Ricci, E., Sasselov, D. et al. (2008) The very low albedo of an extrasolar planet: MOST space-based photometry of HD 209458. Astrophys. J., 689:1345–1353.
- [31] Martins, J.H.C., Santos, N.C., Figueira, P., et al. (2015) Evidence for spectroscopic direct detection of reflected light from 51 Peg b? Astron. & Astrophys., 576:A134.
- [32] Evans, T.M, Pont, F., Sing, D.K., Aigrain, S., Barstow, J.K., et al. (2013) The Deep Blue Color of HD 189733b: Albedo Measurements with Hubble Space Telescope/Space Telescope Imaging Spectrograph at Visible Wavelengths. Astrophys. J. Lett., 772:L16.
- [33] Santerne, A., Bonomo, A.S., Hébrard, G., Deleuil, M., Moutou, C., et al. (2011) SOPHIE velocimetry of Kepler transit candidates. IV. KOI-196b: a non-inflated hot Jupiter with a high albedo. Astron. & Astrophys., 536:id.A70.
- [34] Hu, R., Demory, B.-O., Seager, S., Lewis, N. & Showman, A. (2015) A semi-analytical model of visible-wavelength phase curves of exoplanets and applications to Kepler-7 b and Kepler-10 b. Astrophys. J., 802:51.
- [35] Webber, M.W., Lewis, N.K., Marley, M., Morley, C., Fortney, J. & Cahoy, K. (2015) Effect of Longitude-dependent Cloud Coverage on Exoplanet Visible Wavelength Reflected-light Phase Curves. Astrophys. J., 804:id.94.
- [36] Hovenier, J.W. & Hage, J.I. (1989) Relations involving the spherical albedo and other photometric quantities of planets with thick atmospheres. Astron. & Astrophys., 214:391–401.
- [37] Lavvas, P., Koskinen, T. & Yelle, R.V. (2014) Electron densities and alkali atoms in exoplanet atmospheres. Astrophys. J., 796:id.15.
- [38] Spiegel, D.S., Silverio, K. & Burrows, A. (2009) Can TiO explain thermal inversions in the upper atmospheres of irradiated giant planets? Astrophys. J., 699:1487–1500.
- [39] García Muñoz, A. (2015) Towards a comprehensive model of Earth’s disk-integrated Stokes vector. Int. J. Astrobiology, 14:379–390.
- [40] García Muñoz, A. & Mills, F.P. (2015) Pre-conditioned backward Monte Carlo solutions to radiative transport in planetary atmospheres. Fundamentals: Sampling of propagation directions in polarising media. Astron. & Astrophys., 573:A72.
- [41] Bevington, P.R. & Robinson, D.K. (2003) Data reduction and error analysis for the physical sciences. McGraw Hill.
- [42] Press, W.H., Teukolsky, S.A., Vetterling, W.T. & Flannery, B.P. (2003) Numerical recipes in Fortran 77. Cambridge University Press.
- [43] Hansen, J.E. & Travis, L.D. (1974) Light scattering in planetary atmospheres. Space Science Reviews, 16:527–610.
- [44] Hansen, J.E. & Arking, A. (1971) Clouds of Venus: Evidence for their nature. Science, 171:669–672.
- [45] Hansen, J.E. & Hovenier, J.W. (1974) Interpretation of the polarization of Venus. J. Atmos. Science, 31:1137–1160.
- [46] Mishchenko, M.I., Travis, L.D. & Lacis, A.A. (2002) Scattering, absorption and emission of light by small particles. Cambridge Univ. Press.
- [47] Morley, C.V., Fortney, J.J., Marley, M.S., Visscher, C., Saumon, D. & Leggett, S.K. (2012) Neglected Clouds in T and Y Dwarf Atmospheres. Astrophys. J., 756:id.172.
- [48] Wakeford, H.R. & Sing, D.K. (2015) Transmission spectral properties of clouds for hot Jupiter exoplanets. Astron. & Astrophys., 573:id.A122.
- [49] Ueda, K., Yanagi, H., Noshiro, R., Hosono, H. & Kawazoe, H. (1998) Vacuum ultraviolet reflectance and electron energy loss spectra of CaTiO3. J. Phys.: Condens. Matter, 10:3669–3677.
- [50] Kitamura, R., Pilon, L. & Jonasz, M. (2007) Optical constants of silica glass from extreme ultraviolet to far infrared at near room temperature. Appl. Optics, 46:8118–8133.
- [51] Parmentier, V., Showman, A.P. & Lian, Y. (2013) 3D mixing in hot Jupiters atmospheres I. Application to the day/night cold trap in HD 209458b. Astron. & Astrophys., 558:id.A91.
- [52] Fortier, A., Beck, T., Benz, W., Broeg, C., Cessa, V. et al. (2014) CHEOPS: A space telescope for ultra-high precision photometry of exoplanet transits. Proc. SPIE 9143, Space Telescopes and Instrumentation, 91432J.
- [53] Rauer, H., Catala, C., Aerts, C., Appourchaux, T., Benz, W. et al. (2014) The PLATO 2.0 mission. Experimental Astronomy, 38:249-330.
- [54] Ricker, G.R., Winn, J.N., Vanderspek, R., Latham, D.W., Bakos, G.A. et al. (2015) Transiting Exoplanet Survey Satellite (TESS). J. Astronomical Telescopes, Instruments, and Systems, 1:id.014003.
- [55] Heng, K., Menou, K. & Phillipps, P.J. (2011) Atmospheric circulation of tidally locked exoplanets: a suite of benchmark tests for dynamical solvers. Mon. Not. R. Astron. Soc., 413:2380–2402.
- [56] Mayne, N.J., Baraffe, I., Acreman, D.M., Smith, C. Browning, M.K. et al. (2014) The unified model, a fully-compressible, non-hydrostatic, deep atmosphere global circulation model, applied to hot Jupiters. ENDGame for a HD 209458b test case. Astron. & Astrophys., 561:id.A1.
- [57] Showman, A.P., Lewis, N.K. & Fortney, J.J. (2015) 3D Atmospheric Circulation of Warm and Hot Jupiters. Astrophys. J., 801:id.95.
| Parameter | Grid values | Total |
|---|---|---|
| 1, 2, 5, 10, 20, 50, 100, 150, 200 | 9 | |
| [∘] | 560, step of 5 | 12 |
| [∘] | 090, step of 5;100150, step of 10 | 25 |
| 0.50, 0.75, 0.90, 0.95, 0.98, 0.99, 1 | 7 | |
| 00.95, step of 0.05 | 20 | |
| 0, 0.1, 0.2, 0.3 | 4 | |
| 1,512,000 | ||
| Model input parameters | Inferred output parameters | |||||||
| Comment | ||||||||
| [∘] | [∘] | |||||||
| Best; =0.0 | 100 | 25 | 65 | 1 | 0.40 | 1.013 | 0.274 | 0.455 |
| Minimal- set; =0.0 | 20–200 | 20–45 | 45–120 | 1 | 0.1–0.7 | 1.025 | 0.24–0.31 | 0.42–0.49 |
| Best; =0.1 | 150 | 25 | 75 | 1 | 0.45 | 1.009 | 0.275 | 0.461 |
| Minimal- set; =0.1 | 50–200 | 20–40 | 55–120 | 1 | 0.05–0.7 | 1.021 | 0.24–0.30 | 0.43–0.49 |
| Best; =0.2 | 150 | 25 | 80 | 1 | 0.50 | 1.027 | 0.276 | 0.487 |
| Minimal- set; =0.2 | 50–200 | 20–35 | 60–120 | 1 | 0.1–0.65 | 1.039 | 0.25–0.31 | 0.46–0.51 |
| Best; =0.3 | 200 | 25 | 90 | 1 | 0.50 | 1.076 | 0.295 | 0.512 |
| Minimal- set; =0.3 | 50–200 | 15–35 | 60–120 | 1 | 0.15–0.6 | 1.088 | 0.28–0.32 | 0.49–0.54 |