The effect of particle density in turbulent channel flow laden with finite size particles in semi-dilute conditions
Abstract
We study the effect of varying the mass and volume fraction of a suspension of rigid spheres dispersed in a turbulent channel flow. We performed several Direct Numerical Simulations using an Immersed Boundary Method for finite-size particles changing the solid to fluid density ratio , the mass fraction and the volume fraction . We find that varying the density ratio between 1 and 10 at constant volume fraction does not alter the flow statistics as much as when varying the volume fraction at constant and at constant mass fraction. Interestingly, the increase in overall drag found when varying the volume fraction is considerably higher than that obtained for increasing density ratios at same volume fraction. The main effect at density ratios of the order of 10 is a strong shear-induced migration towards the centerline of the channel. When the density ratio is further increased up to 1000 the particle dynamics decouple from that of the fluid. The solid phase behaves as a dense gas and the fluid and solid phase statistics drastically change. In this regime, the collision rate is high and dominated by the normal relative velocity among particles.
I Introduction
The transport of particles in flows is relevant to many industrial applications and environmental processes.
Examples include sediment transport in rivers, avalanches and pyroclastic flows, as well as many oil industry and
pharmaceutical processes. Often the flow regime encountered in such applications is turbulent due to the high flow
rates and it can be substantially affected by the presence of the solid phase. Depending on the features of both
fluid and solid phases, many different scenarios can be observed and the understanding of such flows is still incomplete.
The rheological properties of these suspensions have mainly been studied in the viscous Stokesian regime and in the low speed
laminar regime. Even limiting our attention to monodisperse rigid neutrally buoyant spheres suspended in Newtonian
liquids, we find interesting rheological behaviors such as shear thinning or thickening, jamming at high volume fractions,
and the generation of high effective viscosities and normal stress differences stickel2005 ; morris2009 ; wagner2009 .
It is known that the effective viscosity of a suspension changes with respect to that of the pure fluid
due to the modification of the response of the complex fluid to the local deformation rateguazz2011 . In the dilute
regime, an expression for the effective viscosity with the solid volume fraction has first been proposed by
Einsteineinstein1906 ; einstein1911 and then corrected by Batchelorbatchelor1970 and Batchelor and
Greenbatchelor1972 . As the volume fraction increases, the mutual interactions among particles become more important
and the effective viscosity increases until the system jamssierou2002 . At high volume fractions, the variation of the
effective viscosity is described exclusively by semi-empirical laws such as those by Eiler and Krigher & Dougherty
stickel2005 that also capture the observed divergence at the maximum packing limit, boyer2011 .
In laminar flows, shear-thickening or normal stress differences occur due to inertial effects at the
particle scale. Indeed, when the particle Reynolds number is non negligible the symmetry of the particle pair trajectories
is broken and the microstructure becomes anisotropic, leading to macroscopical behaviors such as shear-thickening Morrispof08 ; picano2013 ; Morris2014 .
Finally, in the highly inertial regime
the effective viscosity increases
linearly with shear rate due to augmented particle collisions bagnold1954 .
Another important feature observed in viscous flows is shear-induced migration. When considering a pressure-driven Poiseuille flow, either in a tube or in a channel, the particles irreversibly migrate toward the centerline, i.e. from high to low shear rate regionsguazz2011 ; koh1994 . Interestingly when inertial effects become important, a different kind of migration occurs as the particles tend to move radially away from both the centerline and the walls, toward an intermediate equilibrium position. This type of migration was first observed in a tube guazz2011 ; segre1962 and was named tubular pinch. It is mechanistically unrelated to the rheological properties of the flow and results from the fluid-particle interaction within the conduit. The case of the laminar square duct flow has also been studied to identify the particle equilibrium positions chun2006 ; abbas2014 . It was found that finite-size particles migrate toward the corners or to the center of edges depending on the bulk Reynolds number. At high Reynolds numbers (but still in the laminar regime), some particles were also found in an inner region near the center of the duct.
Typically, as the Reynolds number is increased inertial effects become important and the unladen flow undergoes a transition from laminar to turbulent conditions. The presence of the solid phase may alter this process by either increasing or reducing the critical Reynolds number above which the transition to the turbulent regime occurs. The case of a dense suspension of particles in a pipe flow has been studied experimentally matas2003 and numerically yu2013 . It has been suggested that transition depends upon the pipe to particle diameter ratios and the volume fraction. For larger particles, transition shows a non-monotonic behavior that cannot be solely explained in terms of an increase of the effective viscosity. For smaller neutrally-buoyant particles instead, the critical Reynolds number increases monotonically with the solid volume fraction due to the raise in effective viscosity.
The transition in dilute suspensions of finite-size particles in plane channels has been studied by Lashgari et al. lashg2015 and Loisel et al. loisel2013 . It has been shown that the critical Reynolds number above which turbulence is sustained, is reduced. At fixed Reynolds number and solid volume fraction, the initial arrangement of particles is important to trigger the transition. Lashgari et al. lashgari2014 also investigated numerically a channel flow laden with solid spherical particles at higher volume fractions and for a wide range of Reynolds numbers. These authors identified three different regimes for different values of the solid volume fraction and the Reynolds number . In each regime (laminar, turbulent and inertial shear-thickening), the flow is dominated by different components of the total stress (viscous, turbulent or particle stresses respectively).
Regarding the fully turbulent regime, most of the previous studies have focused on dilute or very dilute suspensions of particles smaller than the hydrodynamic scales and heavier than the fluid. In the one-way coupling regime balach-rev2010 (i.e. when the solid phase has a negligible effect on the fluid phase) and limiting our attention to wall-bounded flows, it has been shown that particles migrate from regions of high to low turbulence intensities reeks1983 . This phenomenon is known as turbophoresis and it has been shown to be stronger when the turbulent near-wall characteristic time and the particle inertial time scale are similar soldati2009 . Small-scale clustering has also been observed in this kind of inhomogeneous flows sardina2012 , leading together with turbophoresis to the formation of streaky particle patterns sardina2011 . In the two-way coupling regime (i.e. when the mass density ratios are high and the back-reaction of the dispersed phase on the fluid cannot be neglected) the solid phase has been shown to reduce the turbulent near-wall fluctuations increasing their anisotropy kulick1994 and eventually reducing the total drag zhao2010 .
When the suspensions are dense it is of fundamental importance to consider particle-particle interactions and collisions. Indeed, the chaotic dynamics of the fluid phase affects the rheological properties of the suspension, especially at high Reynolds numbers. This is known as a four-way coupling regime. Increasing the particle size directly affects the turbulent structures at smaller and comparable scales naso2010 thereby modulating the turbulent field. In a turbulent channel flow it has been reported that finite-size particles larger than the dissipative length scale increase the turbulent intensities and the Reynolds stresses pan1996 . Particles are also found to preferentially accumulate in the near-wall low-speed streaks pan1996 . This has also been observed in open channel flows laden with heavy finite-size particles. In this case the flow structures are found to have a smaller streamwise velocity kida2013 ; kida2014 .
Concerning turbulent channel flows of neutrally buoyant particles, recent studies with report that due to the attenuation of the large-scale streamwise vortices, the fluid streamwise velocity fluctuation is reduced. When the particles are heavier than the carrier fluid and therefore sediment, the bottom wall acts as a rough boundary which makes the particles resuspend shao2012 . Recent simulations from our group have shown that the overall drag increases as the volume fraction is increased from up to . This trend cannot be solely explained in terms of the increase of the suspension effective viscosity. It is instead found that as particle volume fraction increases, the velocity fluctuation intensities and the Reynolds shear stresses decrease while there is a significant increase of the particle induced stresses. The latter, in turn, lead to a higher overall drag picano2015 .
As noted by Prosperetti prosp2015 , however, results obtained for solid to fluid density ratios cannot be easily extrapolated to other cases (e.g. when ). In the present study we therefore investigate numerically the effects of varying the density ratio of the suspended phase and consequently the mass fraction for different volume fractions. The aim is to understand separately the effects of excluded volume and (particle and fluid) inertia on the statistical observables of both phases. To isolate the effects of different density ratios on the macroscopical behavior of the suspension, we consider an ideal situation where the effect of gravity is neglected, leaving its analysis to future studies.
We consider a turbulent channel flow laden with rigid spheres of radius where is the half-channel height (see Picano et al. picano2015 ). Direct numerical simulations (DNS) fully describing the solid phase dynamics via an immersed boundary method (IBM) are performed as in Lucci et al. lucci2010 and Kidanemariam et al. kida2013 among others. First, cases at fixed mass fractions are examined and compared to cases with constant volume fraction and density ratios ranging from to . It is observed that the influence of the density ratio on the statistics of both phases is less important than that of an increasing volume fraction . The main effects at density ratio are shear-induced migration towards the centerline of the channel and slight reduction of the fluid velocity fluctuations in the log-layer. The results drastically change when further increasing (up to ). It is found that for sufficiently high (), the solid phase behaves as a dense gas uncorrelated to the details of the carrier fluid flow.
II Methodology
II.1 Numerical method
Different methods have been proposed in the last years to perform Direct Numerical Simulations of multiphase flows. In the present study, simulations have been performed using the algorithm originally developed by Breugembreugem2012 that fully describes the coupling between the solid and fluid phases. The Eulerian fluid phase is evolved according to the incompressible Navier-Stokes equations,
| (1) |
| (2) |
where , and are the fluid velocity, density and kinematic viscosity respectively ( is the dynamic viscosity), while and are the pressure and a generic force field (used to model the presence of particles). The particles centroid linear and angular velocities, and are instead governed by the Newton-Euler Lagrangian equations,
| (3) | ||||
| (4) |
where and are the particle volume and moment of inertia; is the fluid stress, with the deformation tensor; is the distance vector from the center of the sphere while is the unity vector normal to the particle surface . Dirichlet boundary conditions for the fluid phase are enforced on the particle surfaces as .
In the numerical code, an immersed boundary method is used to couple the fluid and solid phases. The boundary condition at the moving particle surface (i.e. ) is modeled by adding a force field on the right-hand side of the Navier-Stokes equations. The fluid phase is therefore evolved in the whole computational domain using a second order finite difference scheme on a staggered mesh while the time integration is performed by a third order Runge-Kutta scheme combined with a pressure-correction method at each sub-step. The same integration scheme is also used for the Lagrangian evolution of eqs. (3) and (4). Each particle surface is described by uniformly distributed Lagrangian points. The force exchanged by the fluid on the particles is imposed on each Lagrangian point and is related to the Eulerian force field by the expression . In the latter represents the volume of the cell containing the Lagrangian point while is the Dirac delta. This force field is calculated through an iterative algorithm that ensures a second order global accuracy in space. In order to maintain accuracy, eqs. (3) and (4) are rearranged in terms of the IBM force field,
| (5) | ||||
| (6) |
where is the distance from the center of a particle while the second terms on the right-hand sides are corrections to account for the inertia of the fictitious fluid contained within the particle volume. Particle-particle interactions are also considered. When the gap distance between two particles is smaller than twice the mesh size, lubrication models based on Brenner’s asymptotic solution (brenner1961, ) are used to correctly reproduce the interaction between the particles. A soft-sphere collision model is used to account for collisions between particles and between particles and walls. An almost elastic rebound is ensured with a restitution coefficient set at . These lubrication and collision forces are added to the right-hand side of eq. (5). For more details and validations of the numerical code, the reader is referred to previous publications breugem2012 ; lambert2013 ; picano2015 ; fornari2015 .
II.2 Flow configuration
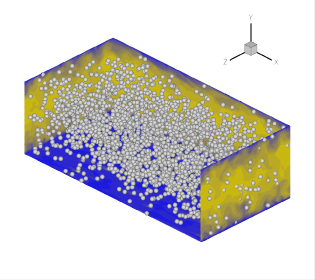
We consider a turbulent channel flow between two infinite flat walls located at and , where is the wall-normal direction while and are the streamwise and spanwise directions. The domain has size , and and periodic boundary conditions are imposed in the streamwise and spanwise directions. A fixed value of the bulk velocity is achieved by imposing a mean pressure gradient in the streamwise direction. The imposed bulk Reynolds number is equal to (where represents the kinematic viscosity of the fluid) and corresponds to a Reynolds number based on the friction velocity for the single phase case. The friction velocity is defined as , where is the stress at the wall. A cubic staggered mesh of grid points is used to discretize the domain. All results will be reported either in non-dimensional outer units (scaled by and ) or in inner units (with the superscript ’+’, scaled by and ).
The solid phase consists of non-Brownian rigid spheres with a radius to channel half-width ratio fixed to . For a volume fraction , this radius corresponds to about 10 plus units. In figure 1 we display the instantaneous streamwise velocity on four orthogonal planes together with the finite-size particles dispersed in the domain. Each particle is discretized with Lagrangian control points while their radii are Eulerian grid points long. Using an Eulerian mesh consisting of grid points per particle radius () is a good compromise in terms of computational cost and accuracy. We have performed a simulation with a finer mesh ( points per particle radius, ), and . We find indeed that the friction Reynolds number changes by , and the velocity fluctuations change locally at most by .
At first, we will compare results obtained at different density ratios and constant mass fraction with those at constant volume fraction . The mass fraction is defined as and is chosen to be : four simulations are performed with and (which correspond to and particles). At constant instead, we examine four cases with and . The reference unladen case () is also presented in the different figures. The case with and will be discussed later. The full set of simulations is summarized in table 1.
The simulations start from the laminar Poiseuille flow for the fluid phase since we observe that the transition naturally occurs at the present moderately high Reynolds number, due to the noise added by the particles. Particles are initially positioned randomly with velocity equal to the local fluid velocity. Statistics are collected after the initial transient phase.
| % | |||
|---|---|---|---|
III Results
III.1 Analysis of Mass and Volume Fraction Effects
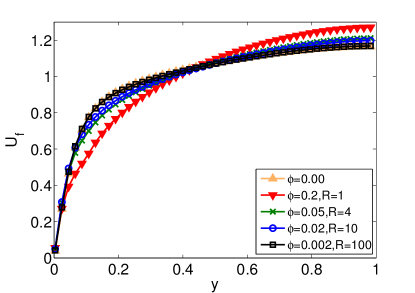
We show the mean fluid velocity profiles in outer and inner units ( and ) in figure 2. The statistics conditioned to the fluid phase have been calculated neglecting the points occupied by the solid phase in each field (phase-ensemble average). We notice in 2(a) and (c) that the velocity profile tends towards that for the single fluid phase as the volume fraction is reduced even if the mass fraction is constant. Conversely, when the volume fraction is kept constant at (panels b and d) the differences observed when increasing the density ratios are small; in particular smaller velocities near the wall and larger velocities in the centre of the channel for larger . The decrease of the profiles in inner units, observed when increasing and less so increasing at fixed , indicates also an overall drag increase. Indeed for the mean profile follows the log-law pope2000 :
| (7) |
where and are the von Kármán constant and an additive coefficient. As increases, is found to decrease from to while is reduced from to (see figure 2d). Usually a decrease in denotes drag reduction while a smaller or negative leads to an increase in drag virk1975 . In the cases studied this combined effect leads to a small increase of the overall drag since the friction Reynolds number grows from to . The reduction in the additive coefficient is believed to be caused by the intense particle-fluid interactions occurring near the wall picano2015 , which are augmented by the increased inertia of the solid phase at higher .
| % | |||||
|---|---|---|---|---|---|
We report in table 2 the values of and obtained for all the cases studied. For the case with and (yet ) we almost recover the single phase log-law with and (for the single fluid and ) and the increase in friction Reynolds number is limited (from to ), which can be explained by the small number of particles in the flow. As shown above, the cases at the same mass fraction () and different density ratios reveal most significant variations, explained by the changes in volume fraction (excluded volume effect).
At high , the bulk flow seems to be relaminarized, see figure 2(a). However, although the Reynolds stresses are reduced, the particle presence induces fluctuations and enhances the overall friction via particle-induced stresses lashgari2014 ; picano2015 ; lash2015 .
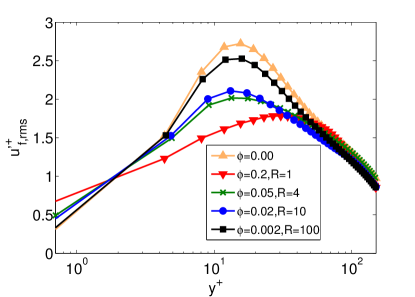
The root-mean-square (r.m.s.) of the fluid velocity fluctuations are reported in inner units in figure 3. Panels (a),(c) and (e) show the cases at constant while the cases at constant are reported in panels (b),(d) and (f). As for the mean flow, the major changes in fluid velocity fluctuations are associated to an increase in volume fraction . As is increased from to (constant ), the wall-normal and spanwise components increase especially in the proximity of the wall, i.e. in the viscous sublayer. We observe also an important reduction of the streamwise fluctuation intensity around at higher . As we will show later, a layer of particles is formed close to the walls and the fluid between these particles and the walls is therefore squeezed. This results in a reduction of the streamwise fluid velocity fluctuations and an increase of the fluctuations in the other directions. The neutrally buoyant case at higher volume fractions (, ) exhibits higher fluctuations close to the walls that drop well below the values found for the smaller volume fractions as is further increased. Only the streamwise component approaches the values obtained at smaller when .
The fluid velocity fluctuation profiles do not show a significant dependence on the density ratio . However, one can notice that increasing the density ratio to leads to a reduction of the fluctuation intensities in all directions (when ), similarly to what observed at and increasing (see previous discussion or the work by Picano and collaborators picano2015 for a more complete discussion). Important differences are found for (i.e. very close to the wall) where the velocity fluctuations increase when increasing the volume fraction while they remain approximately constant when varying .
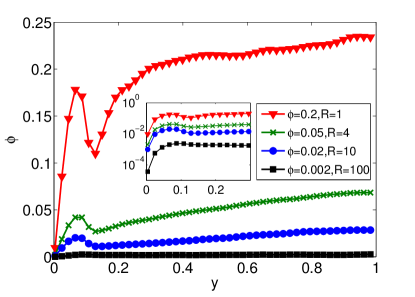
As mean velocity profiles are affected mostly by variations in the solid volume fraction , the explanation for the change in fluid velocity fluctuations must be searched in the context of fluid-solid interactions and of particle distribution. We therefore report in figure 4 the local solid volume fraction along the wall-normal direction . The phase-ensemble averages for the solid phase have been obtained considering the Eulerian grid points contained within the volume of each particle at each time step. It is evident that for a layer of particles forms close to the walls as soon as the volume fraction is above .
As shown in figure 4(b) for a constant volume fraction (), as the density ratio increases more particles tend to migrate toward the centerline while the layer close to the wall is preserved. The peak of close to the wall is slightly reduced and less particles occupy the volume between and . We therefore observe a shear-induced particle migration from regions of high to low shear rates, an effect more pronounced as the density ratio increases. The local volume fraction increases drastically at the centerline (): the local volume fraction at the centerline is approximately twice that found at (i.e. close to the wall where the first layer of particles form) when . The difference is even higher when – . This shear-induced migration becomes more intense as the density ratio increases although, as we will see later, the picture totally changes at very high ().
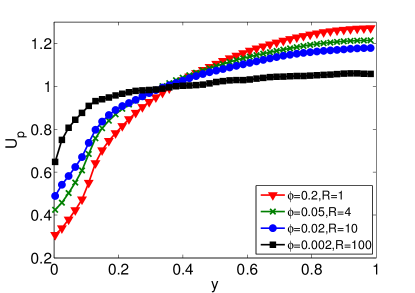
We report the mean particle streamwise velocity in figure 5. The results for constant are shown in panel (a) where we notice that the mean particle streamwise velocity profiles are similar for and when and . For and instead, the mean particle streamwise velocity profile changes drastically showing higher velocities close to the wall and smaller velocities in the rest of the channel (). Comparing with the other cases we find a reduction of at the centerline. Generally we find that as the volume fraction increases, the mean particle streamwise velocity decreases closer to the walls while exhibiting higher values at the centerline.
When the volume fraction is fixed (fig. 5b), is only slightly altered by an increase in density ratio . However, at the highest density ratio () particles move faster in proximity of the walls and around the centerline while is reduced between these two regions. The particles that lie in this region have a streamwise velocity directly linked to that of the fluid, while particles are accelerated in proximity of the wall and around the centerline where collision are more frequent. The mean particle velocity is finite close to the walls, since particles can have a relative tangential motion. The phase-ensemble averages of particle velocities are computed considering the velocities of the Eulerian grid points contained within the volume of each particle, with and (where and are the position of the particle centroid and its velocity).
In figure 6 we show the instantaneous particle positions from the simulation with projected in the streamwise-wall-normal () plane. The interaction between two approaching particles slightly shifted in the wall-normal direction and in the proximity of the wall is also sketched to explain shear-induced inertial migration. In this high shear rate region, the particle denoted by , with velocity , approaches particle , moving in the same direction with velocity . Since the latter is closer to the wall, its streamwise velocity is smaller (on average) than that of particle , so a collision takes place. The scenario following this collision depends on the inertia of the fluid and solid phases, and thereby on the density ratio .
If particles and are neutrally buoyant , their dynamics is mainly determined by the carrier fluid flow. After the collision, the two particles would tend to move radially apart and their motion becomes rapidly correlated to that of the fluid phase. As a result, they are on average transported downstream by the flow. As the particle inertia increases (i.e. increases), the particle motion is less sensitive to the fluid flow and longer times are needed for the particle to adjust to the fluid velocity after the collision. Indeed, for , the particle relaxation time is longer than the fluid timescale. Therefore, particles migrate almost undisturbed in opposite wall-normal directions after a collision. Owing to the presence of the wall, we therefore observe a net migration towards the channel centre. Being this an inertial effect, the particle migration is more evident as the solid to fluid density ratio increases. As we will discuss later, however, this effect disappears at very high density rations, , when the particle mean velocity is almost uniform, and there is no a mean shear. On average, this inertial shear-induced migration leads to high peaks of the local solid volume fraction at the centerline (see figure 4 b). The effect is so strong at , that it is easy to identify intermittently depleted regions of particles close to the walls (as shown in the snapshot in figure 6).

A similar wall-normal particle migration has been observed for dense suspensions () of neutrally buoyant rigid spherical particles at bulk Reynolds numbers ranging from to lash2015 . In these cases, the profiles of local volume fraction, , do not vary significantly by increasing the bulk Reynolds number and the observed migration has been attributed to the imbalance of normal stresses in the wall-normal direction. Although the resulting behavior is similar, the driving mechanisms are different.
In this section we have studied the dependence of the suspension properties on both the solid to fluid density ratio and the solid volume fraction . We have shown that the mean and fluctuating velocity fields of both phases are predominantly influenced by variations in the volume fraction (i.e. excluded volume effects). The mean fields are only marginally altered by increasing the density ratio . The main effect of increasing particle inertia is the shear-induced migration just discussed.

III.2 Effects of Density Ratio
In this section we discuss the results obtained in an idealized scenario where the density ratio is allowed to further increase while gravity effects are neglected. We compare results obtained at and and showing that above a certain density ratio (), the solid phase decouples from the fluid leading to a completely different scenario. We have also looked at an intermediate case with density ratio , but being the results closer to those obtained for , these have not been shown for sake of clarity.
III.2.1 Single-point statistics
The streamwise fluid velocity profiles in outer and inner units (panels (a) and (b)), the particle streamwise velocity profile (panel (c)) and the local volume fraction profile (panel (d)) are displayed in figure 7 for and increasing particle density.
The mean fluid and particle velocity changes significantly at the highest density ratio considered, . The fluid velocity increases more rapidly from the wall and reaches a constant value slight above for . This value is about smaller than what found at the centerline for the cases with lower density ratio. The difference between the different profiles is even more evident when the data are scaled with inner units (fig. 7b). As already mentioned in the previous section, the mean velocity profiles are similar for density ratios between 1 and 10, still giving different coefficients for the fitting of the log-law. The velocity profiles almost overlap in the viscous sublayer and converge to approximately the same values of for . For the case with , instead, the mean velocity is close to that for only close to the wall, .
Larger differences are found for the solid phase velocity, figure 7(c): the average streamwise particle velocity is constant and approximately equal to , the bulk value. This is similar to the behavior previously reported for and . All particles move in average with the same streamwise velocity, no matter if they are close to the walls or to the centerline. Their motion seems not to be affected by turbulent fluid flow (there is a one-way coupling between phases, since the fluid flow is actually modified by the presence of particles). A pseudo-plug flow is generated across the channel, as confirmed by the local volume fraction profile, , shown in figure 7(d). Indeed, the particles are distributed almost uniformly across the channel, with the first particle layer appearing at approximately particle radii from the walls.
As discussed in the previous section, particle inertia and near-wall shear induce particle migration toward the centerline when . This effect becomes more evident as the density of the particles increases, until for very high , their inertia is so high that their motion almost completely decouples from the one of the fluid phase. In this granular-like regime particles move ballistically between successive collisions and almost uniformly downstream with also an uniform wall-normal distribution. The turbulent flow structures are disrupted by these heavy particles and the typical features of a turbulent channel flow are lost.
It is now interesting to look at the particle Stokes number , the ratio between the particle time scale, due to the particle inertia, and a characteristic flow time scale. We consider the convective time as flow characteristic time, , while the particle relaxation time is . The effect of finite inertia (i.e. of a non negligible Reynolds number) should be taken into account in the definition of the particle Stokes number and we therefore consider the following correction of the particle drag coefficient to account for inertial effects schil1935
| (8) |
(where is the particle Reynolds number) so that the modified Stokes number
| (9) |
For sake of simplicity and in first approximation we define a shear-rate based particle Reynolds number . The modified Stokes number then becomes equal to and for and . As expected, particle inertia becomes more and more relevant as the density ratio increases. For the inertia of the fluid and solid phases is comparable and they mutually influence each other. When , conversely, the particle Stokes number is much larger than 1 and particles are only slightly affected by the fluid phase. The solid phase behaves as a dense gas, uncorrelated to the fluid phase.
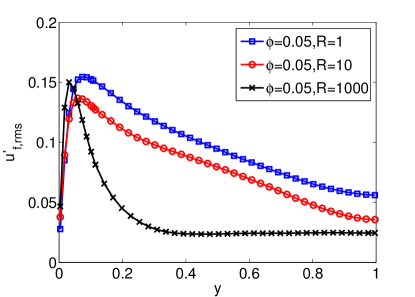
In figure 8 we compare the fluid and particle velocity fluctuations for the three different density ratios under investigation. It can be seen from the plots in 8(a),(c) and (e) that the fluid velocity fluctuations are significantly different at the highest . All velocity components display larger values close to the wall and then drop rapidly to a constant value of approximately . Anisotropy in the energy distribution is maintained very close to the walls only, whereas a quasi-isotropic energy distribution is found in the rest of the channel. The particle velocity fluctuations reported in panels (b),(d),(f) also exhibit an almost isotropic distribution, with a fluctuation intensity of about . This statistical isotropy is typical of gaseous systems and due to the strong influence of the solid phase on the fluid phase (previously explained by means of the particle Stokes number), the fluid velocity fluctuations are forced to approach a quasi-isotropic statistical steady state.
We finally observe that, approaching the centerline, particle and fluid velocity fluctuations pertaining the case with are smaller than those of the neutrally buoyant case. On average, particles are more likely to be at the channel centre and move in the direction of the pressure gradient. Fluctuations, in all directions, are therefore reduced, and due to the strong coupling between the two phases, the fluid velocity fluctuations also decrease in this more ordered structure.
III.2.2 Particle Dispersion
Next, we discuss the particle dispersion in the streamwise and spanwise directions. The motion of the particles is constrained in the wall-normal direction by the presence of the walls and is therefore not examined here. The dispersion is quantified by the variance of the particle displacement as function of the separation time . Here, we compute the mean-square displacement of the particle trajectories
| (10) |
where the square displacements are averaged over time and the number of particles .
Figure 9(a) shows the particle dispersion in the
streamwise direction, , while the spanwise dispersion, , is reported in panel (b) of the same figure.
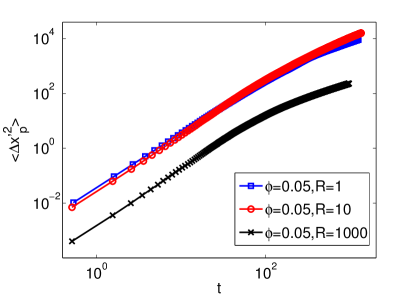
Dispersion in the streamwise direction is similar for the cases with and . The particle trajectories are initially correlated and the displacements proportional to time . In this so-called ballistic regime, the mean square dispersion shows a quadratic dependence on time. Only after , the curve approaches the linear behavior typical of a diffusive motion. This is induced by particle-particle and hydrodynamic interactions that decorrelate the trajectories in time.
As discussed above, the motion of the solid phase is almost uncorrelated to that of the fluid when increasing the density ratio to .
Since the mean particle velocity is flat across the channel, the
dispersion is not enhanced by the inhomogeneity of the velocity profile typical of shear flows, the so-called Taylor-Aris dispersion taylor53 ; aris56 .
Therefore is approximately one or two orders of magnitude lower than in the two cases at lower . Interestingly,
the purely diffusive behavior is attained faster and the transition from the ballistic behavior begins already at .
The dispersion in the spanwise direction, , is similar for all density ratios considered.
Again, one can identify a quadratic and linear
behavior in time with a transition between the two regimes at .
We also note that, for
the spanwise dispersion of the particles of highest density is close to that of particles with , while for the
behavior appears similar to that found for .
To conclude this section, we emphasize that the statistics of particle dispersion reveal that the particle motion only slightly changes when increasing the particle density ratio from to , supporting the observation that the bulk flow behavior depends more on the excluded volume, i.e. , rather than on the particle inertia.
III.2.3 Particle velocity probability density functions and collision rates
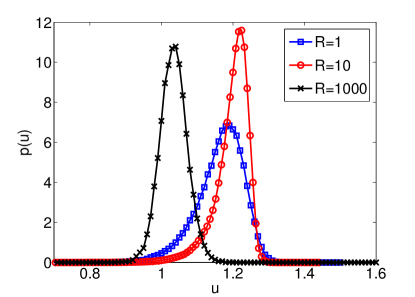
We wish to give further insight on the behavior of the solid phase dynamics by examining the velocity probability density functions. We will focus on the case with and and and calculate the probability density function for each component of the particle velocity in the volume around the centerline of the channel (of size ). The distributions of the streamwise, wall-normal and spanwise components of the particle velocity are depicted in panels (a),(b) and (c) of figure 10
We see in panel (a) that the distribution pertaining the streamwise component, , exhibits a negative skewness ( and ) for and , indicating that particles exhibit with higher probability intense fluctuations lower than the mean value, as observed also in single-phase turbulent channel flowkim1987turbulence . As is increased from to , the variance is however reduced, whereas the flatness increases (from to ) indicating that rare events become more frequent. The results for show that the velocity distribution changes to what, at first sight, may seem a normal distribution with smaller modal value and variance, almost vanishing skewness () and flatness close to ().
The velocity distributions in the cross-stream directions (reported in panels b and c) resemble a normal distribution centered around a zero mean value. As for the streamwise component, the flatness exhibits high values (between and ) only for while for the remaining two cases it is just slightly greater than .
Next, we report the probability distributions of the modulus of the velocity fluctuations,
| (11) |
calculated in the same volume around the centerline in figure 10(d). The most peculiar distribution is the one found for . It closely resembles a Maxwell-Boltzmann distribution (or a distribution with three degrees of freedom) defined as follows:
| (12) |
where is a scale parameter (velocity). This distribution describes the velocity of atoms of an ideal gas that freely move inside a stationary container. In such case the scale parameter becomes where is the Boltzmann’s constant, the thermodynamic temperature and the particle mass. Fitting our results with equation 12 we find , corresponding to the Maxwell-Boltzmann distribution displayed in panel (d) with dashed line. The root mean square of such a distribution is , using the value of previously reported. Examining again figure 8(b),(d),(f), we notice that the velocity fluctuations are approximately equal to , with modulus . Thus the root mean square is completely defined by . These findings further confirm our previous speculations about the appearance of a dense gaseous regime at high density ratios .
Finally we examine particle-pair statistics, function of the distance between the centers , and show that the large variations of the particle velocity also affect the particle-pair dynamics, in particular the collisions. As the distance approaches the particle diameter, the near field interactions become important and collisions may occur (whenever ). An indicator of the radial separation among pair of particles is the Radial Distribution Function . In a reference frame with origin at the centre of a particle, the is the average number of particle centers located in the shell of radius and thickness , normalized with the number of particles of a random distribution. Formally the is defined as
| (13) |
where is the number of particle pairs on a sphere of radius , is the density of particle pairs in the volume , with the total number of particles. The value of the at distances of the order of the particle radius reveals the intensity of clustering; the RDF tends to as , corresponding to a random (Poissonian) distribution.
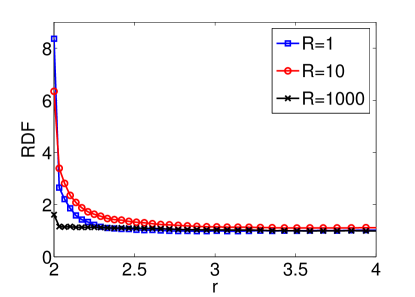
Here, we are mainly interested in the particle-pair statistics around the centerline, and therefore compute the in the volume defined by for the three density ratios and and volume fraction . The data obtained are shown in figure 11(a). At lower density ratios, and 10, the peaks of the ’s are found at exactly particle radii from the centre of the reference particles. The drops quickly to the value of the uniform distribution (i.e. ) at in the neutrally buoyant case, whereas the decay is somewhat slower for , reaching the final plateau at . This difference can be explained by the shear-induced migration previously discussed: this enhances the number of particles around the centerline, thus increasing the local volume fraction and consequently the small scale clustering. At the highest density ratio under investigation, instead, the gaseous behavior of the solid phase leads to an uncorrelated statistical distribution of particles, corresponding to a constant value of the equal to .
Figure 11(b) and (c) show the averaged normal relative velocity between two approaching particles , and the collision kernel . This collision kernel sundaram1997 is obtained as the product of the and :
| (14) |
when . In the figure, we display the behavior of this observable with the distance , which can be interpreted as the approach rate of particle pairs at distance . The normal relative velocity of a particle pair is obtained as the projection of the relative velocity in the direction of the distance between the two interacting particles
| (15) |
(where and denote the two particles). This scalar quantity can be either positive (when two particles depart form each other) or negative (when they approach). Hence, the averaged normal relative velocity can be decomposed into . To estimate the probability of a collision, i.e. the collision kernel , the mean negative normal relative velocity is therefore needed.
It is shown in figure 11(b) that the absolute value of increases with when . Particle pairs are more likely to approach with higher speeds when further away. This increase of with is less pronounced for , which can be explained recalling that, in this case, there is a significant accumulation in the region around the centerline where the particles are transported downstream at almost constant velocity. When , is constant and equal to . In a dense gaseous regime, particles are, on average, uniformly distributed and approach each other at similar speeds and at different radial locations: their motion is uncorrelated.
The collision rate is mainly determined by the averaged normal relative velocity when . As shown in figure 11(c), is approximately constant at different radial distances, showing slightly larger values near contact, . In the cases with and 10, is determined at small separations by the particle clustering and by the normal relative velocities at higher separations. When shear-induced migration occurs, , the collision kernel is higher than in the case of neutrally buoyant particles for separations between and particle radii. When the Radial Distribution Function drops to and the approach rate is therefore determined by the averaged normal relative velocity. Since the absolute value of grows more slowly with for , shows the same trend.
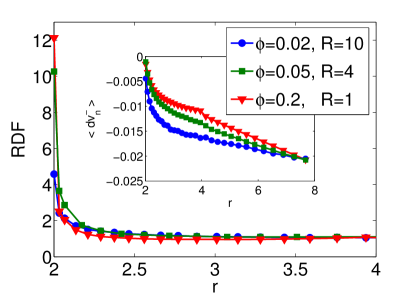
Before concluding the section, we examine the collision statistics when increasing the volume fraction while keeping the mass fraction constant. To this aim, we show in figure 12 the radial distribution function , the averaged normal relative velocity and the collision kernel from 3 of the cases at constant mass fraction previously discussed: and ; and ; and .
The small-scale clustering increases as the volume fraction increases, see figure 12(a), i.e. the at is highest for the flow with . However, as the excluded volume increases with , the mean distance between the particles is reduced and these approach each other on average with a smaller relative velocity, as shown by the reduction in at higher in the inset of figure 12(a). Finally, figure 12(b) reveals that also at constant the collision rate is mainly governed by the averaged normal relative velocity. We observe indeed that is higher in the most dilute cases and the data scale with the volume fraction.
IV Final remarks
We study the effect of varying solid to fluid density ratio and volume fraction in a turbulent channel flow laden with finite-size rigid spheres in the semi-dilute regime. The numerical simulations do not include the effect of gravity to disentangle the role of fluid and particle inertia, as well as of the excluded volume on the mean and fluctuating fluid velocities and particle motion.
The main finding of the work is that variations of the volume fraction have a larger impact on the statistics of fluid and solid phases than modifications of the density ratio . Indeed, we show that, when the volume fraction is kept constant () and the density ratio, , increased from 1 to , the mean fluid velocity and velocity fluctuation profiles are only slightly affected. The main effect of increasing the density ratio (up to ) is the change of the mean local volume fraction, i.e. the wall-normal particle distribution across the channel. At , we report a significant shear-induced migration toward the centerline. This is shown to be an inertial effect induced by the particle density, , and the presence of a wall.
When the volume fraction is changed and either the mass fraction or the density ratio kept constant, instead, the flow statistics vary significantly. The mean streamwise velocity profiles in outer units show lower values closer to the walls and higher values toward the centerline. In inner units, the difference is even more evident, showing a continuos variation of the von Kármán constant and of the additive coefficient of the log-law, see also Ref. picano2015, for comparisons at constant . The increase in overall drag found when varying the volume fraction is considerably higher than that obtained for increasing density ratios at same volume fraction.
We also consider cases at same and . At this high , the motion of the solid phase decouples from the dynamics of the fluid phase and the statistics drastically change. The particles are uniformly distributed across the channel and behave as a dense gas with uniform mean streamwise velocity and uniform isotropic velocity fluctuations across the channel. The dense gas behavior of the solid phase clearly emerges in the probability density function of the modulus of the velocity fluctuations that closely follows a Maxwell-Boltzmann distribution. The fluid velocity fluctuations are reduced and are almost constant except in the regions close to the walls. For we also find that the streamwise dispersion is one or two orders of magnitude smaller than in the cases at lower . In channel flows, the streamwise particle dispersion is enhanced by the inhomogeneity of the mean velocity profile. However as we have shown, at very high density ratios this inhomogeneity is lost leading to a reduction of the mean streamwise particle displacement.
Finally, we have examined the radial distribution of particles and their collision kernel. For and constant , the collision rate is mostly controlled by the particle clustering near contact. Instead, for , the number of collisions is enhanced and essentially determined by the particle average normal relative velocity. For suspensions at fixed mass fraction , the collision rate decreases with increasing .
Our results therefore suggest that the particle motion in the absence of gravity is not significantly different between neutrally buoyant particles and heavy particles with density ratios typical of sediments and metal particles in liquids. The main effects on the flow statistics are due to variations of the volume fraction, thus of the excluded volume. The main effect of increasing the density ratio is the appearance of a shear-induced migration while velocity statistics are almost unchanged. The present results may help to interpret the dynamics of sediments in shear turbulence.
Acknowledgements.
This work was supported by the European Research Council Grant No. ERC-2013-CoG-616186, TRITOS, from the Swedish Research Council (VR), through the Outstanding Young Researcher Award, and from the COST Action MP1305: Flowing matter. Computer time provided by SNIC (Swedish National Infrastructure for Computing) and CINECA, Italy (ISCRA Grant FIShnET-HP10CQQF77).References
- (1) Jonathan J Stickel and Robert L Powell, “Fluid mechanics and rheology of dense suspensions,” Annual Review of Fluid Mechanics 37, 129–149 (2005).
- (2) Jeffrey F Morris, “A review of microstructure in concentrated suspensions and its implications for rheology and bulk flow,” Rheologica acta 48, 909–923 (2009).
- (3) Norman J Wagner and John F Brady, “Shear thickening in colloidal dispersions,” Physics Today 62, 27–32 (2009).
- (4) Elisabeth Guazzelli and Jeffrey F Morris, A physical introduction to suspension dynamics, Vol. 45 (Cambridge University Press, 2011).
- (5) Albert Einstein, “Eine neue bestimmung der moleküldimensionen,” Annalen der Physik 324, 289–306 (1906).
- (6) Albert Einstein, “Berichtigung zu meiner arbeit:„eine neue bestimmung der moleküldimensionen” ̵︁,” Annalen der Physik 339, 591–592 (1911).
- (7) GK Batchelor, “The stress system in a suspension of force-free particles,” Journal of Fluid Mechanics 41, 545–570 (1970).
- (8) GK Batchelor and JT Green, “The determination of the bulk stress in a suspension of spherical particles to order c2,” Journal of Fluid Mechanics 56, 401–427 (1972).
- (9) A Sierou and JF Brady, “Rheology and microstructure in concentrated noncolloidal suspensions,” Journal of Rheology (1978-present) 46, 1031–1056 (2002).
- (10) Francois Boyer, Élisabeth Guazzelli, and Olivier Pouliquen, “Unifying suspension and granular rheology,” Physical Review Letters 107, 188301 (2011).
- (11) P.M. Kulkarni and J.F. Morris, “Suspension properties at finite reynolds number from simulated shear flow,” Physics of Fluids 20 (2008).
- (12) Francesco Picano, Wim-Paul Breugem, Dhrubaditya Mitra, and Luca Brandt, “Shear thickening in non-brownian suspensions: an excluded volume effect,” Physical Review Letters 111, 098302 (2013).
- (13) J. F. Morris and H. Haddadi, “Microstructure and rheology of finite inertia neutrally buoyant suspensions,” Journal of Fluid Mechanics 749, 431–459 (2014).
- (14) Ralph A Bagnold, “Experiments on a gravity-free dispersion of large solid spheres in a newtonian fluid under shear,” in Proceedings of the Royal Society of London A: Mathematical, Physical and Engineering Sciences, Vol. 225 (The Royal Society, 1954) pp. 49–63.
- (15) Christopher J Koh, Philip Hookham, and LG Leal, “An experimental investigation of concentrated suspension flows in a rectangular channel,” Journal of Fluid Mechanics 266, 1–32 (1994).
- (16) G Segre and A Silberberg, “Behaviour of macroscopic rigid spheres in poiseuille flow part 2. experimental results and interpretation,” Journal of Fluid Mechanics 14, 136–157 (1962).
- (17) B Chun and AJC Ladd, “Inertial migration of neutrally buoyant particles in a square duct: An investigation of multiple equilibrium positions,” Physics of Fluids (1994-present) 18, 031704 (2006).
- (18) M Abbas, P Magaud, Y Gao, and S Geoffroy, “Migration of finite sized particles in a laminar square channel flow from low to high reynolds numbers,” Physics of Fluids (1994-present) 26, 123301 (2014).
- (19) J-P Matas, Jeffrey F Morris, and E Guazzelli, “Transition to turbulence in particulate pipe flow,” Physical Review Letters 90, 014501 (2003).
- (20) Zhaosheng Yu, Tenghu Wu, Xueming Shao, and Jianzhong Lin, “Numerical studies of the effects of large neutrally buoyant particles on the flow instability and transition to turbulence in pipe flow,” Physics of Fluids (1994-present) 25, 043305 (2013).
- (21) Iman Lashgari, Francesco Picano, and Luca Brandt, “Transition and self-sustained turbulence in dilute suspensions of finite-size particles,” Theoretical and Applied Mechanics Letters(2015).
- (22) Vincent Loisel, Micheline Abbas, Olivier Masbernat, and Eric Climent, “The effect of neutrally buoyant finite-size particles on channel flows in the laminar-turbulent transition regime,” Physics of Fluids (1994-present) 25, 123304 (2013).
- (23) Iman Lashgari, Francesco Picano, Wim-Paul Breugem, and Luca Brandt, “Laminar, turbulent, and inertial shear-thickening regimes in channel flow of neutrally buoyant particle suspensions,” Physical Review Letters 113, 254502 (2014).
- (24) S Balachandar and John K Eaton, “Turbulent dispersed multiphase flow,” Annual Review of Fluid Mechanics 42, 111–133 (2010).
- (25) MW Reeks, “The transport of discrete particles in inhomogeneous turbulence,” Journal of Aerosol Science 14, 729–739 (1983).
- (26) Alfredo Soldati and Cristian Marchioli, “Physics and modelling of turbulent particle deposition and entrainment: Review of a systematic study,” International Journal of Multiphase Flow 35, 827–839 (2009).
- (27) G Sardina, Philipp Schlatter, Luca Brandt, F Picano, and CM Casciola, “Wall accumulation and spatial localization in particle-laden wall flows,” Journal of Fluid Mechanics 699, 50–78 (2012).
- (28) Gaetano Sardina, Francesco Picano, Philipp Schlatter, Luca Brandt, and Carlo Massimo Casciola, “Large scale accumulation patterns of inertial particles in wall-bounded turbulent flow,” Flow, turbulence and combustion 86, 519–532 (2011).
- (29) Jonathan D Kulick, John R Fessler, and John K Eaton, “Particle response and turbulence modification in fully developed channel flow,” Journal of Fluid Mechanics 277, 109–134 (1994).
- (30) LH Zhao, Helge I Andersson, and JJJ Gillissen, “Turbulence modulation and drag reduction by spherical particles,” Physics of Fluids (1994-present) 22, 081702 (2010).
- (31) Aurore Naso and Andrea Prosperetti, “The interaction between a solid particle and a turbulent flow,” New Journal of Physics 12, 033040 (2010).
- (32) Y Pan and S Banerjee, “Numerical simulation of particle interactions with wall turbulence,” Physics of Fluids (1994-present) 8, 2733–2755 (1996).
- (33) Aman G Kidanemariam, Clemens Chan-Braun, Todor Doychev, and Markus Uhlmann, “Direct numerical simulation of horizontal open channel flow with finite-size, heavy particles at low solid volume fraction,” New Journal of Physics 15, 025031 (2013).
- (34) Aman G Kidanemariam and Markus Uhlmann, “Direct numerical simulation of pattern formation in subaqueous sediment,” Journal of Fluid Mechanics 750, R2 (2014).
- (35) Xueming Shao, Tenghu Wu, and Zhaosheng Yu, “Fully resolved numerical simulation of particle-laden turbulent flow in a horizontal channel at a low reynolds number,” Journal of Fluid Mechanics 693, 319–344 (2012).
- (36) Francesco Picano, Wim-Paul Breugem, and Luca Brandt, “Turbulent channel flow of dense suspensions of neutrally buoyant spheres,” Journal of Fluid Mechanics 764, 463–487 (2015).
- (37) Andrea Prosperetti, “Life and death by boundary conditions,” Journal of Fluid Mechanics 768, 1–4 (2015).
- (38) Francesco Lucci, Antonino Ferrante, and Said Elghobashi, “Modulation of isotropic turbulence by particles of taylor length-scale size,” Journal of Fluid Mechanics 650, 5–55 (2010).
- (39) Wim-Paul Breugem, “A second-order accurate immersed boundary method for fully resolved simulations of particle-laden flows,” Journal of Computational Physics 231, 4469–4498 (2012).
- (40) Howard Brenner, “The slow motion of a sphere through a viscous fluid towards a plane surface,” Chemical Engineering Science 16, 242–251 (1961).
- (41) Ruth A Lambert, Francesco Picano, Wim-Paul Breugem, and Luca Brandt, “Active suspensions in thin films: nutrient uptake and swimmer motion,” Journal of Fluid Mechanics 733, 528–557 (2013).
- (42) Walter Fornari, Francesco Picano, and Luca Brandt, “Sedimentation of finite-size spheres in quiescent and turbulent environments,” Journal of Fluid Mechanics 788, 640–669 (2016).
- (43) Stephen B Pope, Turbulent flows (Cambridge university press, 2000).
- (44) Preetinder S Virk, “Drag reduction fundamentals,” AIChE Journal 21, 625–656 (1975).
- (45) Iman Lashgari, Francesco Picano, Wim Paul Breugem, and Luca Brandt, “Channel flow of rigid sphere suspensions: particle dynamics in the inertial regime,” International Journal of Multiphase Flow 78, 12–24 (2016).
- (46) L Schiller and A Naumann, “A drag coefficient correlation,” Vdi Zeitung 77, 51 (1935).
- (47) Geoffrey Taylor, “Dispersion of soluble matter in solvent flowing slowly through a tube,” in Proceedings of the Royal Society of London A: Mathematical, Physical and Engineering Sciences, Vol. 219 (The Royal Society, 1953) pp. 186–203.
- (48) Rutherford Aris, “On the dispersion of a solute in a fluid flowing through a tube,” in Proceedings of the Royal Society of London A: Mathematical, Physical and Engineering Sciences, Vol. 235 (The Royal Society, 1956) pp. 67–77.
- (49) John Kim, Parviz Moin, and Robert Moser, “Turbulence statistics in fully developed channel flow at low reynolds number,” Journal of Fluid Mechanics 177, 133–166 (1987).
- (50) Shivshankar Sundaram and Lance R Collins, “Collision statistics in an isotropic particle-laden turbulent suspension. part 1. direct numerical simulations,” Journal of Fluid Mechanics 335, 75–109 (1997).