Vol.0 (200x) No.0, 000–000
Structures of GMC W 37
Abstract
We carried out observations toward the giant molecular cloud W 37 with the transitions of 12CO, 13CO, and C18O using the 13.7 m single-dish telescope at the Delingha station of Purple Mountain Observatory. Based on the three CO lines, we calculated the column densities, cloud masses for the molecular clouds with radial velocities at around . The gas mass of W 37, calculated from 13CO emission, is , above the criteria of giant molecular cloud. The dense ridge of W 37 is a dense filament, which is supercritical in linear mass ratio. Dense clumps found by C18O emission are aligned along the dense ridge with a regular interval about 2.8 pc, similar to the clump separation caused by large-scale ‘sausage instability’. We confirm the identification of the giant molecular filament (GMF) G 18.0-16.8 by Ragan et al. (2014) and find a new giant filament, G 16.5-15.8, located in the west of G 18.0-16.8. Both GMFs are not gravitationally bound, as indicated by their low linear mass ratio (). We compared the gas temperature map with the dust temperature map from Herschel images, and find similar structures. The spatial distributions of class I objects and the dense clumps is reminiscent of triggered star formation occurring in the northwestern part of W 37, which is close to NGC 6611.
keywords:
ISM: clouds – ISM: structure – ISM: kinematics and dynamics – Individual: W 37 – Individual: M 161 Introduction
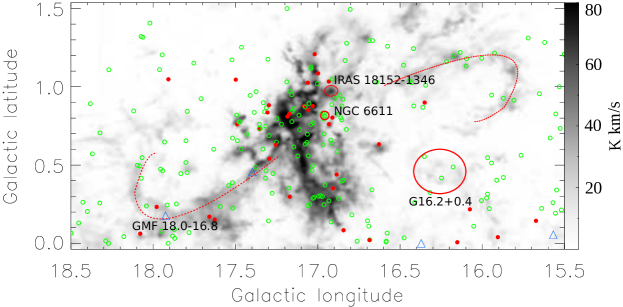
Giant molecular clouds (GMCs) are generally accompanied with star formation activities. In the close proximity of the cloud core region of GMC W 37, the well-known star-forming region M 16 or so-called ‘Eagle nebula’ represents the most active area of star formation inside W 37. M 16 is ionized by NGC 6611, a massive young star cluster which is dominated by the massive binary system HD 168076 consisting of an O3.5 V and an O7.5 V star (Evans et al. 2005; Martayan et al. 2008; Alecian et al. 2008). This system has a total of solar masses and provides about half the ionizing radiation for the nebula (Evans et al. 2005). The studies of NGC 6611 show that there are numbers of OB members (Martayan et al. 2008; Alecian et al. 2008), and the members are as young as only few million years (Hillenbrand et al. 1993; Guarcello et al. 2007). The interplay between the OB cluster NGC 6611 and the surrounding molecular clouds (part of W 37) have been observed in various scales. For instance, the CO observations with the BIMA interferometer at a resolution about 0.1 pc of the ‘pillars of creation’ (McLeod et al. 2015) in M 16 show that the velocity gradients along the ‘pillars of creation’ are produced by ionization front impact with a cloud core (Pound 1998). In the scale of the whole GMC W 37, the Herschel images enable Hill et al. (2012) to find a prominent eastern filament running southeast-northwest and away from the high-mass star-forming central region M 16 and the NGC 6611 cluster, as well as a northern filament which extends around and away from the cluster in the forms of dust temperature and column density maps. Moreover, the dust temperature in each of these filaments decreases with increasing distance from the NGC 6611 cluster, indicating a heating penetration depth of pc in each direction in column density filaments. These results suggest that the NGC 6611 cluster impacts the temperature of future star-forming sites inside the W 37 cloud, modifying the initial conditions for collapse (Hill et al. 2012).
Previous CO lines observations toward the GMC W 37 were from the 12CO survey of the entire Milky Way (Dame et al. 2001). This CO survey (hereafter 1.2 m CO survey) has an angular resolution at 115 GHz, and a velocity resolution mostly at around 0.65 km s-1. Along the same line of sight (LOS) toward W 37, the 1.2 m CO survey detects CO line emissions in the range between and . Ragan et al. (2014) identify a giant molecular filament (GMF), which is running in the galactic longitude range with a length of 88 pc and its near end located about only away from the GMC W 37. The velocity range of this GMF is in the form of 13CO line emissions, very close to the velocity of W 37 (). Because of this coherent velocity structure, Ragan et al. (2014) regard the association of this GMF with respect to W 37.
In this work, we present the preliminary results of the CO line observations toward the galactic coordinate range and , as a part of the new Galactic Plane survey using the transitions of 12CO, 13CO, and C18O molecules. In section 2, the observations and data reduction are described. The results based on the CO lines are presented in section 3. Section 4 discusses the structures of W 37. A summary is addressed in section 5.
| Line | v0 | HPBW | Tsys | Tmb rms noise | ||
|---|---|---|---|---|---|---|
| ( = 1 - 0) | (GHz) | (′′) | (K) | (km s-1) | (K) | |
| 12CO | 115.271204 | 523 | 220-500 | 43.6% | 0.160 | 0.55 |
| 13CO | 110.201353 | 523 | 150-310 | 48.0% | 0.158 | 0.22 |
| C18O | 109.782183 | 523 | 150-310 | 48.0% | 0.158 | 0.22 |
0.92The beam width and main beam effieiency are given by annual report of the telescope status in the year 2013.
2 Observations and data reduction
We observed GMC W 37 in 12CO , 13CO , and C18O with the Purple Mountain Observatory Delingha (PMODLH) 13.7 m telescope (Zuo et al. 2011) as one of the scientific targets regions of the Milky Way Imaging Scroll Painting (MWISP) project111http://www.radioast.nsdc.cn/yhhjindex.php (Sun et al. 2015). The time span of the observations is from October 6th to December 13th, 2013. The three CO lines were observed simultaneously with the 9-beam Superconducting Spectroscopic Array Receiver (Shan et al. 2012) working in sideband separation mode and with the Fast Fourier transform spectrometer . The pointing accuracy is checked every year by carrying out five-point observation for the planets (e.g., Jupiter), and found to be stably better than when tracking targets. During all observations, standard sources were observed every two hours for calibration and monitoring the systematic performance. The typical receiver noise temperature (Trx) is about 30 K as given by the status report of PMODLH in the year 2013. The typical system temperature during observations is 280 K for 12CO and 185 K for 13CO and C18O .
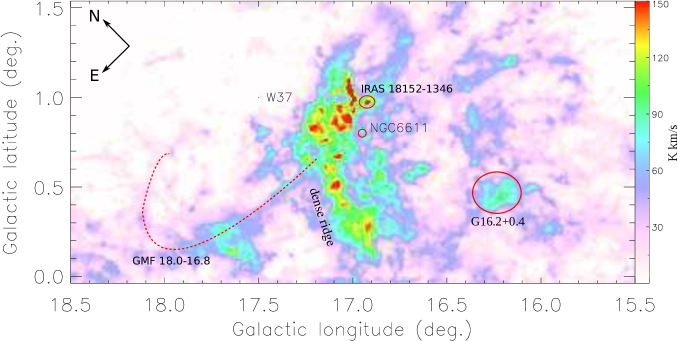
Our observations covered an area from galactic longitude to and galactic latitude from to (see Fig. 1). The GMC W 37 was mapped using the on-the-fly observation mode, with the standard chopper wheel method for calibration (Penzias & Burrus 1973). To conduct the observation, the whole region is split into many cells,each of dimension. Each cell is scanned along the galactic longitude and then the latitude direction on the sky at a constant rate of per second, and receiver records spectra every 0.3 second. Every cell was repeatedly observed with this observation pattern until the root mean square (RMS) of spectra decreases down to the RMS levels required by MWISP, which are 0.5 K for 12CO line, and 0.3 K both for 13CO and C18O line, respectively.
After removing the bad channels in the spectra, we calibrated the antenna temperature () to the main beam temperature () with a main beam efficiency of 44% for 12CO and 48% for 13CO and C18O. The calibrated data were then re-gridded to 30 pixels and mosaicked to a FITS cube using the GILDAS software package (Guilloteau & Lucas 2000). A first order base-line was applied for the spectra. The resulting RMS level is 0.55 K for 12CO at the resolution of 0.159 km s-1, 0.25 K for 13CO and 0.22 K for C18O at the resolution of 0.166 km s-1. A summary of the observation parameters is provided in Table 1.
3 Results
3.1 The basic characteristics of the CO emissions
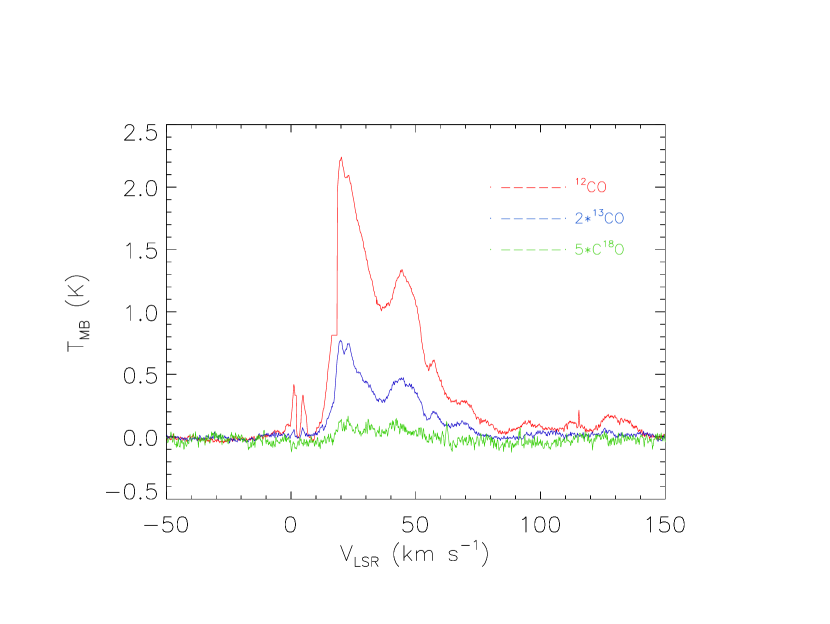
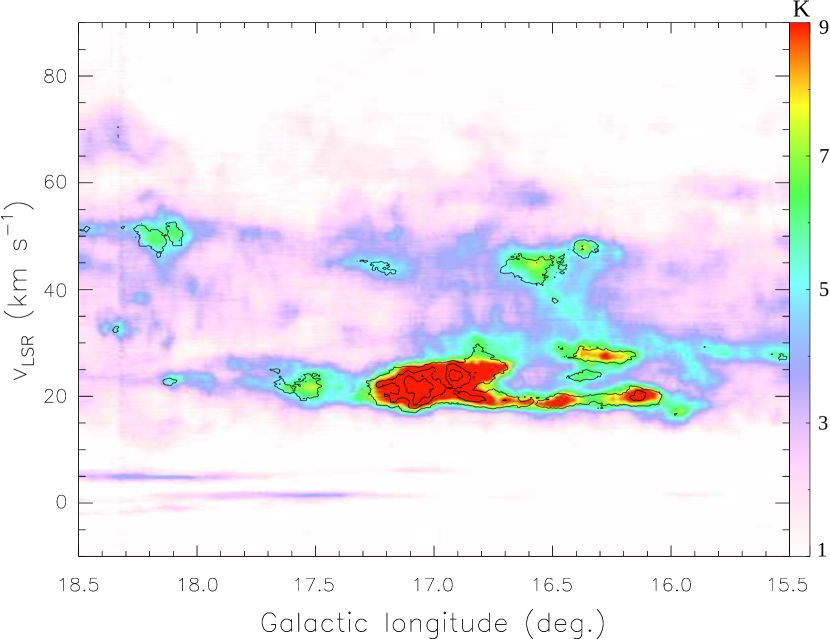
The average spectra of the whole observed region in the three lines are shown in Fig. 3. We clearly see several velocity components in the range in the 12CO spectrum; among them the component at around is strongest. Another component slightly weaker than the component shows a radial velocity at around . Other velocity components are significantly weaker than the components of 20 km s-1 and 24 km s-1. Those diverse velocity components likely come from different molecular clouds with different distances along the same LOS. Given the distances of the Galactic spiral arms from the Sun (Vallée 2008), as well as the rotation curve of the Galaxy (Mannheim & O’Brien 2012), we can attribute most of the observed CO emissions to their natal spiral arms. The components of W 37 peaked at and have kinematic distances between kpc. Because of the association between M 16 and W 37, the distance of M 16, 2.0 kpc, used by Linsky et al. (2007) is accepted here for W 37’s distance. W 37 is located at the near side of the Sagittarius arm. We can marginally identify the molecular clouds located at the far side of the Sagittarius arm, which has typical radial velocity in the range , as seen in Fig. 3. The third strongest component at around is probably located at the Scutum-Centaurus Arm. Besides these molecular clouds on the spiral arms, there are other molecular clouds with radial velocities which cannot be attributed to any spiral arms lying on the same LOS. They might be inter-arm molecular clouds with relative low density.
3.2 The structure of W 37
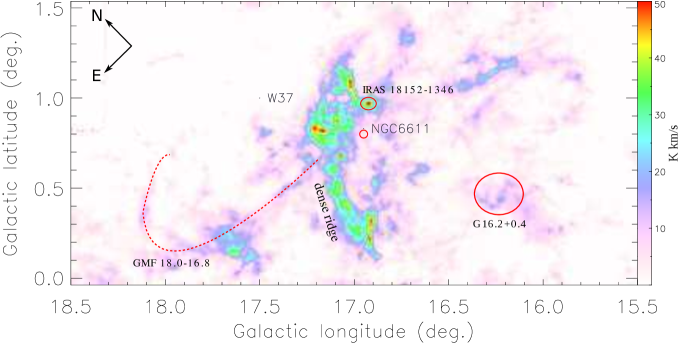
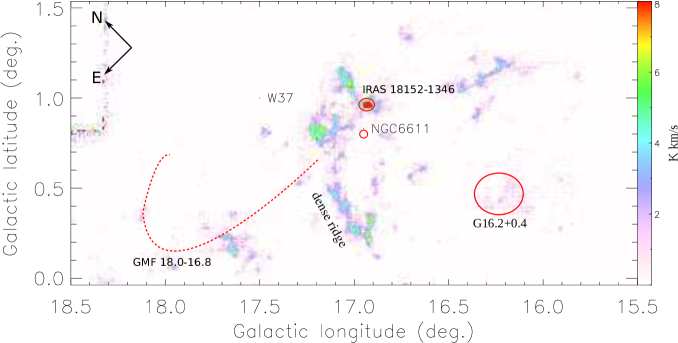
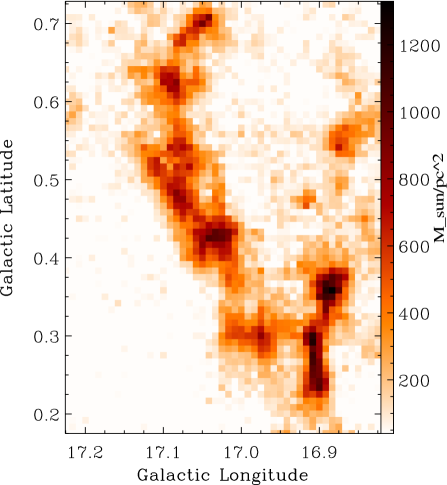
This paper focuses on the bulk gas component of W 37 with a peak radial velocity . Fig. 1 shows the integrated intensity maps of the three lines. The distribution of 12CO gas outlines the overall morphology of the GMC W 37, which is running perpendicular to the Galactic plane with a length about 46 pc. While the 13CO emissions trace the relatively dense parts of W 37, which also distribute perpendicular to the Galactic plane. In the C18O emission, W 37 can be split into two major parts: the dense filamentary structure in between (hereafter the dense ridge) and the northwestern part closest to the massive cluster NGC 6611. A very bright clump located in northwest of NGC 6611 shows stronger C18O emission than the dense ridge . Indebetouw et al. (2007) identified this bright clump as a massive young stellar object (YSO), also known as IRAS 18152-1346.
The column density map of W 37 (37\arcsecresolution, Fig. 2 in Hill et al. 2012) derived from the Herschel images shows very similar morphology to the 12CO gas distribution. However, what the dust column density map cannot tell us is the morphology variation of W 37 along with the radial velocity in our CO lines observations. Therefore, we show this morphological variation in the form of 13CO channel map in Fig. 4. The dense ridge appears mainly in the range , meanwhile the northwestern part shows wider velocity range from to . There are dense clumps () at positions around , separated from the dense ridge about , or 25 pc at a distance of 2.0 kpc. We refer these dense clumps as the isolated molecular cloud G16.2+0.4, which is independent to the GMC W 37.
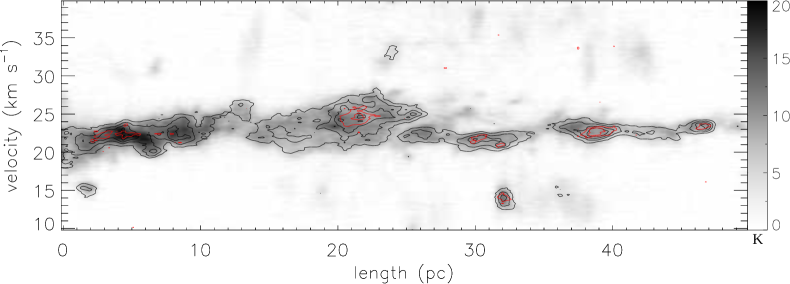
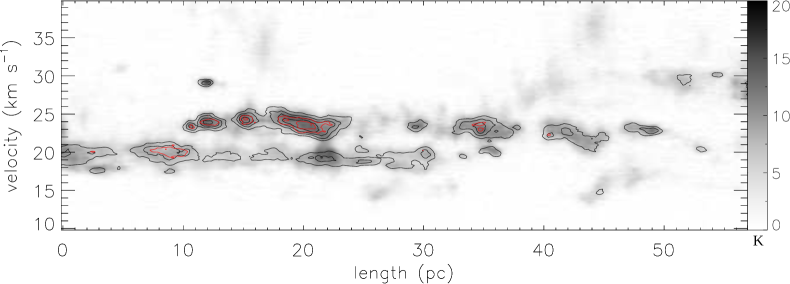
Interestingly, we note a pair of filaments located in the two sides of W 37 in the velocity range . This pair of filaments is symmetric with respect to W 37. The position velocity maps of this symmetric pair of filaments are shown in Fig. 5. This pair of filaments show coherent velocity distribution peaked both at around .
3.3 Masses, column densities of the clouds
Better than the 1.2 m CO survey using a single CO line, our new CO three-line survey enables us to obtain the column density of CO gas under the assumption of local thermodynamic equilibrium (LTE). In general, the 12CO line is optically thick, hence the excitation temperature can be determined via the formula:
| (1) |
We assume that 13CO and C18O have the same as 12CO. Assuming 13CO and C18O lines optically thin, the optical depths of the two isotopes of 12CO are only functions of and :
| (2) |
To obtain the column density for a molecule, i.e. 13CO or C18O, one must sum over all energy levels of the molecule. In the LTE case, the total column density of 13CO or C18O is given by
| (3) |
Substituting the and can calculate the column density of 13CO and C18O, respectively. Adopting fractional abundances of HCO and HC18O (Castets & Langer 1995), CO) and are then converted to the H2 column density, respectively. Then we calculate the mass of the H2 gas as
| (4) |
where is the average molecular weight, and S is the summed area of 13CO S/N ratios . Note that this criteria filters out many diffuse areas where only the 12CO lines are significant. Therefore the total masses of the molecular clouds calculated from the 13CO line can be treated as the lower limits. . Specially, we refer the molecular gas mass derived from the C18O line as the dense gas mass because of the highest critical density of the C18O molecule. The physical properties of the GMC W 37 and the isolated cloud G16.2+0.4 are listed in Table 2. W 37’s physical properties and length (46 pc) all fall in the typical ranges for the GMCs previously identified (e.g., Murray 2011 and references therein). The comparison between W 37 and G16.2+0.4 clearly states the physical differences between a GMC and a molecular cloud.
| Cloud | Velocity | N(H2) | N(H2) | Cloud | Dense Gas |
|---|---|---|---|---|---|
| range | 13CO | C18O | mass | mass | |
| [km s-1] | [ cm-2] | [ cm-2] | [M⊙] | [M⊙] | |
| W 37 | |||||
| G16.2+0.4 |
0.86For both molecular clouds, mass calculation is made at a distance of 2.0 kpc (Linsky et al. 2007).
4 Discussion
4.1 Filamentary structures
The dense ridge shows a filament morphology between . We show this peculiar part in Fig. 6 for clarifying its property. The dense ridge is clumpy, and clumps are distributed along the filament. The clumpy structure is most likely the result of gravitational collapse of a cylinder. If we regard the dense gas traced by the emission as a whole, the stability of the filament can be described by the virial parameter (Su et al. 2015 and references therein), where , , and are the average velocity dispersion of emission, the length of the dense filament, and the gravitational constant, respectively. In the calculation, we take the long dense filament as a symmetrical cylinder. The geometric size of the cylinder () can be obtained from the surface mass density map ( cutoff in Fig. 6). We use the mean full width at half maximum (FWHM) of emission () in the filament to estimate the mean velocity dispersion . The virial parameter is estimated to be 0.6, indicating that the dense filament is gravitationally bound. Moreover, we can estimate the fragmentation separation within the filament to clarify whether ‘sausage instability’ dominates the fragmentation process. Adopting as the mean density of the dense filament, the filament scale height is about 0.14 pc due to the ‘sausage instability’ of a self-gravitating fluid cylinder (Su et al. 2015 and references therein). This leads to a spacing of between the fragmentation clumps. Applying the clump identification algorithm ‘GaussClumps’ integrated in the Starlink/CUPID package 222More information about CUPID: http://starlink.eao.hawaii.edu/starlink/CUPID to the surface mass density map of emission, seven clumps are found along the dense filament. The seven clumps are roughly regularly spaced with a mean fragmentation separation about 2.8 pc, which results in good agreement with the ‘sausage instability’. We notice another shorter and denser filament running in in the right lower corner of Fig. 6, which is worthy of detailed analyses in an individual paper.
We recall the pair of filaments almost perpendicular to W 37, as noticed in the 13CO channel map Fig. 4. The left part was identified by Ragan et al. (2014) as a GMF named G 18.0-16.8. However, our CO data reveal the counterpart of the G 18.0-16.8, which is not found in Ragan et al. (2014)’s paper. Upon the coherent velocity distribution of this pair of filaments, the GMF found by Ragan et al. (2014) is only one part of this pair. Although the two parts of this pair are continuous in velocity, they are separated by a gap about 28 pc, where W 37 is located in between. The right half (hereafter G 16.5-15.8) has a length about 50 pc, at a distance of 2 kpc. Moreover, the two GMFs have total masses on the order of , which are comparable to the masses of GMFs reported by Wang et al. (2015). Ragan et al. (2014) associate the left GMF with the GMC 37 upon considering the comparable radial velocities between them. Because of the same argument, we take this association with respect to W 37 for the right GMF.
| Transition | Mass ( 10) | () | ) | |||
|---|---|---|---|---|---|---|
| Line | right | left | right | left | right | left |
| 13CO | 1.2 | 2.7 | 3.1 | 3.8 | 1.9 | 2.0 |
| C18O | 0.55 | 1.3 | 4.7 | 5.6 | 1.4 | 1.2 |
0.86 For both molecular clouds, mass calculation is made at a distance of 2.0 kpc (Linsky et al. 2007).
The geometric structure that the two GMFs are separated by W 37 might be the result of the dynamical evolution of an entire GMF, which is disconnected by the contraction of W 37 located at its middle way. In addition, about six class I objects have positions overlapped with the GMF on the left side, while no class I object is lying on the GMF on the right side (see Fig. 8). However, this differential distribution between the two GMFs is not noticed for the class II objects, which seem to be equally distributed on the two GMFs. The differential distributions of class I objects on the two GMFs could be simply due to their differential physical properties. We can estimate the linear mass density (mass per unit length) of the two GMFs, which are help to clarify whether they are gravitationally stable or not. The mean linear mass density is thus estimated to be and for the left and right GMF, respectively, where gas mass is calculated from the emission, filament length is obtained from Fig. 5, and mean filament width is derived by dividing the filament area with filament length. The linear mass density has a maximum value , over which a filament will break up into pieces.The mean FWHM of emission (see Table 3) leads to a maximum linear mass density about for the two GMFs. Both GMFs are not dense enough to initiate large-scale fragmentation. On the other hand, the mean dense gas fraction of the two GMFs are similar, which are 0.48 and 0.46 for the left and right GMF, respectively. To conclude, the mean physical properties of the two GMFs are very similar (see also Table 3), which is against the differential distributions of class I objects. Alternatively, a more plausible explanation is class I objects are just overlapped with the left GMF along the same LOS with no physical associations.
4.2 Young stellar objects in W 37
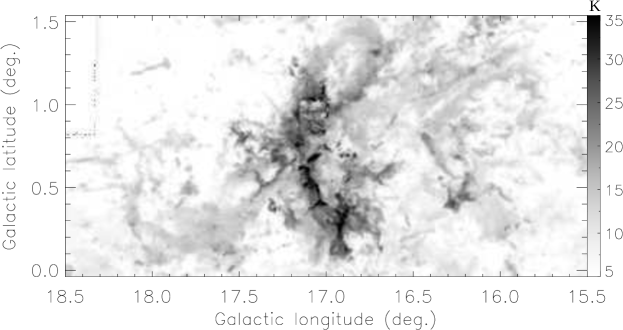
Fig. 7 shows the excitation temperature map of GMC W 37. There are two domains of , which correspond to the dense ridge and the northwestern part of W 37, respectively. These relative warm clouds are believed to be at the very beginning phases of gravitational contraction. Moreover, the dense ridge and the northwestern part of W 37 are also prominent in the dust temperature map from Herschel images (Hill et al. 2012), whereas, they both shows dust temperature about 17 K, lower than the gas temperature. This temperature difference might naturally comes from the two temperature tracers. The detected 12CO emission mostly originates from the surface layer because the emission from inner areas are self-absorbed, however, the dust continuum emission even from the inner most area can also be detected. In addition, this temperature difference is consistent with the theoretical point that the surface layer is warmer than the inner area of a molecular cloud.
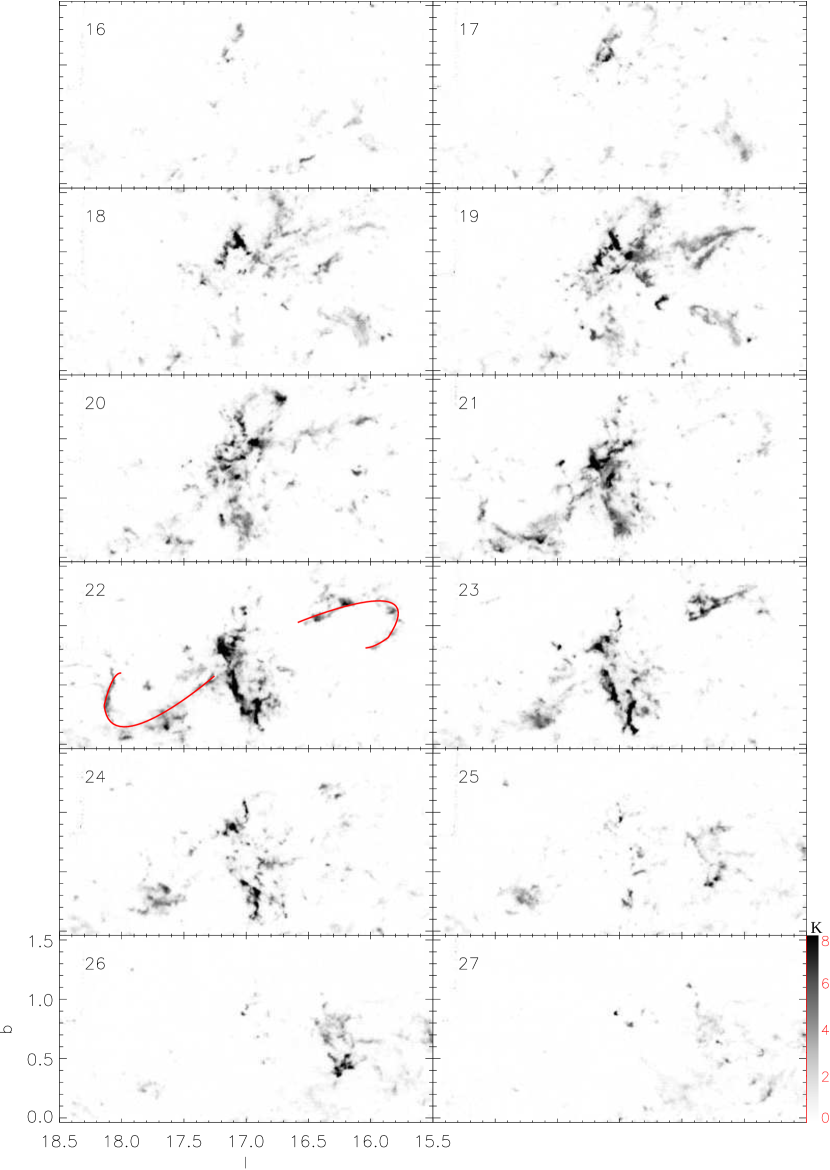
We used the latest WISE (Wright et al. 2010) source catalogue ALLWISE 333ALLWISE catalogue can be retrieved by http://wise2.ipac.caltech.edu/docs/release/allwise/ to identify YSO candidates located inside the observed region, adopting the criteria from Koenig & Smolin (2014). The class I objects are mostly distributed in the proximity of molecular gas, while the class II objects can be also frequently seen in areas with little/no molecular gas (see Fig. 8). This phenomenon can be interpreted as the result of the age differences between class I and class II objects. Further on, class I objects are better tracers of early stage star formation than class II objects. We still note that the class II objects have a trend of being concentrated toward the GMC W 37, and much more class I objects are found in the northwestern part than in the dense ridge. The class I objects in the northwestern part of W 37 are located close to NGC 6618. Hill et al. (2012) argued that NGC 6611 impacts the conditions of W 37 by heating. The penetrating depth of this heating effect is found to be about 9 pc for the northwestern part whose column density is (Hill et al. 2012). This penetration depth is almost identical to the northwestern part’s size, indicating that molecular clumps inside the northwestern part are very likely influenced by the cluster’s heating effect. More class I objects found in the area close to NGC 6611 can be interpreted as the result of the heating effect of the cluster, i.e., NGC 6611 triggers the star formation in the northwestern part of W 37. Because the northern part of W 37 is massive and dense enough to avoid of being destroyed by the high-mass cluster NGC 6611, the star formation inside this area can be the result of the direct compression of pre-existing density enhancements in this area (Elmegreen 1998). Therefore, the northwestern part of W 37 is a promising candidate of triggering star formation by cluster’s influence, and is worthy of continuous investigation.
5 Summary
We observed the transition lines of 12CO, 13CO, and C18O toward GMC W 37, as a part of the MWISP project. The bulk of W 37’s molecular gas have radial velocities between , which can be attributed to the near end of the Sagittarius arm. The gas mass traced by 13CO emission is for W 37. The dense ridge of W 37 is a dense and gravitationally bound filament, as indicated by its large linear mass ratio. Dense clumps traced by C18O emission are regularly spaced along the dense ridge with a mean separation about 0.28 pc, which agrees with the mean clump separation caused by ‘sausage instability’ in large scale. Our comprehensive CO lines survey toward W 37 confirm the discovery of G 18.0-16.8 by Ragan et al. (2014), and identify another GMF, G 16.5-15.8, in the west of G 18.0-16.8. Both GMFs have very similar linear mass ratio about , far less than the maximum value , over which a filament will break up into pieces. The gas excitation temperature map shows that W 37’s dense ridge and northwestern part have higher temperatures than the ambient gas, in contrast with the dust temperature derived by Hill et al. (2012). Combining the spatial distributions of class I objects identified by AllWISE catalog and the dense clumps from our CO emission maps, it is likely that the star formation activities within the W 37 northwestern part are triggered by the associated nearby massive young cluster NGC 6611.
Acknowledgements.
This work is supported by the Strategic Priority Research Program ‘The Emergence of Cosmological Structure’ of the Chinese Academy of Sciences, grant No. XDB09000000, the Millimeter Wave Radio Astronomy Database, and the Key Laboratory for Radio Astronomy, CAS. Z.J. acknowledges the support by NSFC 11233007. X.Z. acknowledges Dr S. Zhang and Dr. Y. Su for their fruitful comments. This publication makes use of data products from the Wide-field Infrared Survey Explorer, which is a joint project of the University of California, Los Angeles, and the Jet Propulsion Laboratory/California Institute of Technology, funded by the National Aeronautics and Space Administration.References
- Alecian et al. (2008) Alecian, E., Wade, G. A., Catala, C., et al. 2008, A&A, 481, L99
- Castets & Langer (1995) Castets, A., & Langer, W. D. 1995, A&A, 294, 835
- Dame et al. (2001) Dame, T. M., Hartmann, D., & Thaddeus, P. 2001, ApJ, 547, 792
- Elmegreen (1998) Elmegreen, B. G. 1998, in Origins, Astronomical Society of the Pacific Conference Series, vol. 148, edited by C. E. Woodward, J. M. Shull, & H. A. Thronson, Jr., 150
- Evans et al. (2005) Evans, C. J., Smartt, S. J., Lee, J.-K., et al. 2005, A&A, 437, 467
- Guarcello et al. (2007) Guarcello, M. G., Prisinzano, L., Micela, G., et al. 2007, A&A, 462, 245
- Guilloteau & Lucas (2000) Guilloteau, S., & Lucas, R. 2000, in Imaging at Radio through Submillimeter Wavelengths, Astronomical Society of the Pacific Conference Series, vol. 217, edited by J. G. Mangum & S. J. E. Radford, 299
- Hill et al. (2012) Hill, T., Motte, F., Didelon, P., et al. 2012, A&A, 542, A114
- Hillenbrand et al. (1993) Hillenbrand, L. A., Massey, P., Strom, S. E., & Merrill, K. M. 1993, AJ, 106, 1906
- Indebetouw et al. (2007) Indebetouw, R., Robitaille, T. P., Whitney, B. A., et al. 2007, ApJ, 666, 321
- Koenig & Smolin (2014) Koenig, R., & Smolin, J. A. 2014, Journal of Mathematical Physics, 55, 122202
- Linsky et al. (2007) Linsky, J. L., Gagné, M., Mytyk, A., McCaughrean, M., & Andersen, M. 2007, ApJ, 654, 347
- Mannheim & O’Brien (2012) Mannheim, P. D., & O’Brien, J. G. 2012, Phys. Rev. D, 85, 124020
- Martayan et al. (2008) Martayan, C., Floquet, M., Hubert, A. M., et al. 2008, A&A, 489, 459
- McLeod et al. (2015) McLeod, A. F., Dale, J. E., Ginsburg, A., et al. 2015, MNRAS, 450, 1057
- Murray (2011) Murray, N. 2011, ApJ, 729, 133
- Penzias & Burrus (1973) Penzias, A. A., & Burrus, C. A. 1973, ARA&A, 11, 51
- Pound (1998) Pound, M. W. 1998, ApJ, 493, L113
- Ragan et al. (2014) Ragan, S. E., Henning, T., Tackenberg, J., et al. 2014, A&A, 568, A73
- Shan et al. (2012) Shan, W., Yang, J., Shi, S., et al. 2012, IEEE Transactions on Terahertz Science and Technology, 2, 593
- Su et al. (2015) Su, Y., Zhang, S., Shao, X., & Yang, J. 2015, ApJ, 811, 134
- Sun et al. (2015) Sun, Y., Xu, Y., Yang, J., et al. 2015, ApJ, 798, L27
- Vallée (2008) Vallée, J. P. 2008, AJ, 135, 1301
- Wang et al. (2015) Wang, K., Testi, L., Ginsburg, A., et al. 2015, MNRAS, 450, 4043
- Wright et al. (2010) Wright, E. L., Eisenhardt, P. R. M., Mainzer, A. K., et al. 2010, AJ, 140, 1868
- Zuo et al. (2011) Zuo, Y.-X., Li, Y., Sun, J.-X., et al. 2011, Chinese Astron. Astrophys., 35, 439