Controlling herding in minority game systems
Abstract
Resource allocation takes place in various types of real-world complex systems such as urban traffic, social services institutions, economical and ecosystems. Mathematically, the dynamical process of complex resource allocation can be modeled as minority games in which the number of resources is limited and agents tend to choose the less used resource based on available information. Spontaneous evolution of the resource allocation dynamics, however, often leads to a harmful herding behavior accompanied by strong fluctuations in which a large majority of agents crowd temporarily for a few resources, leaving many others unused. Developing effective control strategies to suppress and eliminate herding is an important but open problem. Here we develop a pinning control method. That the fluctuations of the system consist of intrinsic and systematic components allows us to design a control scheme with separated control variables. A striking finding is the universal existence of an optimal pinning fraction to minimize the variance of the system, regardless of the pinning patterns and the network topology. We carry out a detailed theoretical analysis to understand the emergence of optimal pinning and to predict the dependence of the optimal pinning fraction on the network topology. Our theory is generally applicable to systems with heterogeneous resource capacities as well as varying control and network topological parameters such as the average degree and the degree distribution exponent. Our work represents a general framework to deal with the broader problem of controlling collective dynamics in complex systems with potential applications in social, economical and political systems.
pacs:
89.75.Fb, 02.50.-r, 89.75.Hc, 89.65.-sResource allocation is an essential process in many real-world systems such as ecosystems of various sizes, transportation systems (e.g., Internet, urban traffic grids, rail and flight networks), public service providers (e.g., marts, hospitals, and schools), and social and economic organizations (e.g., banks and financial markets). The underlying system that supports resource allocation often contains a large number of interacting components or agents on a hierarchy of scales, and there are multiple resources available for each agent. As a result, complex behaviors are expected to emerge ubiquitously in the dynamical evolution of resource allocation. In particular, in a typical situation, agents or individuals possess similar capabilities in information processing and decision making, and they share the common goal of pursuing as high payoffs as possible. The interactions among the agents and their desire to maximize payoffs in competing for limited resources can lead to vast complexity in the system dynamics.
Given resource-allocation system that exhibits complex dynamics, a defining virtue of optimal performance is that the available resources are exploited evenly or uniformly by all agents in the system. In contrast, an undesired or even catastrophic behavior is the emergence of herding, in which a vast majority of agents concentrate on a few resources, leaving many other resources idle or unused PBC:2000 ; Vazquez:2000 ; GL:2002 ; ZWZYL:2005 ; EZ:2000 ; LK:2004 ; WYZJZW:2005 ; ZYZXLW:2005 ; HWGW:2006 ; HZDHL:2012 ; ZHDHL:2013 ; DHHL:2014 . If this behavior is not controlled, the few focused resources would be depleted, possibly directing agents to a different but still small set of resources. From a systems point of view, this can lead to a cascading type of failures as resources are being depleted one after another, eventually resulting in a catastrophic breakdown of the system on a global scale. In this paper, we analyze and test an effective strategy to control herding dynamics in complex resource-allocation systems.
A universal paradigm to model and understand the interactions and dynamical evolutions in many real world systems is complex adaptive systems Kauffman:book ; Levin:1998 ; AAP:book , among which minority game (MG) CZ:1997 ; CMZ:2013 stands out as a particularly pertinent framework for resource allocation. MG dynamics was introduced by Challet and Zhang to address the classic El Farol bar-attendance problem conceived by Arthur Arthur:1994 . In an MG system, each agent makes choice (e.g., or , to attend a bar or to stay at home) based on available global information from the previous round of interaction. The agents who pick the minority strategy are rewarded, and those belonging to the majority group are punished due to limited resources. The MG dynamics has been studied extensively in the past CM:1999 ; CMZ:2000 ; MMM:2004 ; BMM:2007 ; RMR:1999 ; KSB:2000 ; Slanina:2000 ; ATBK:2004 ; JHH:1999 ; HJJH:2001 ; LCHJ:2004 ; TCHJ:2005 ; CMM:2008 ; BMFM:2008 ; XWHZ:2005a ; ZZZH:2005 ; MR:2002 ; CMZ:2013 ; CHWL:2015 .
To analyze, understand, and exploit the MG dynamics, there are two theoretical approaches: mean field approximation and Boolean dynamics. The mean field approach was mainly developed by researchers from the statistical-physics community to cast the MG problem in the general framework of non-equilibrium phase transitions CZ:1997 ; Moro:2004 ; YZ:2008 ; CMZ:2013 . In the Boolean dynamics, for any agent, detailed information about the other agents that it interacts with is assumed to be available, and the agent responds accordingly PBC:2000 ; Vazquez:2000 ; GL:2002 ; ZWZYL:2005 ; HWGW:2006 ; HZDHL:2012 ; ZHDHL:2013 ; DHHL:2014 . Both approaches can lead to “better than random” performance in resource utilization. However, herding behavior in which many agents take identical action DIMCCWK:2008 can also take place, which has been extensively studied and recognized as one important factor contributing to the origin of complexity that leads to enhanced fluctuations and, consequently, to significant degradation in efficiency PBC:2000 ; Vazquez:2000 ; GL:2002 ; ZWZYL:2005 ; EZ:2000 ; LK:2004 ; WYZJZW:2005 ; ZYZXLW:2005 ; HWGW:2006 ; HZDHL:2012 ; ZHDHL:2013 ; DHHL:2014 .
The control strategy we analyze in this paper is the pinning method
that has been studied in controlling the collective dynamics, such
as synchronization, in complex networks WC:2002 ; LWC:2004 ; CLL:2007 ; XLCCY:2007 ; TWF:2009 ; PF:2009 ; YCL:2009 ; ZHDHL:2013 . For the general
setting of pinning control, the two key parameters are the “pinning
fraction,” the fraction of agents chosen to hold a fixed strategy, and
the “pinning pattern,” the configuration of plus or minus
strategies assigned to the pinned agents. Our previous
work ZHDHL:2013 treated the special case of two resources
of identical capacities, where the pinning pattern was such that
the probabilities of agents pinned to positive or negative strategies
(to be defined later) are equal. Here, we investigate a more realistic
model setting and articulate a general mathematic control framework.
A striking finding is that biased pinning control pattern can lead to
an optimal pinning fraction for a variety of network topologies, so
that the system efficiency can be improved remarkably. We develop a
theoretical analysis based on the mean-field approximation to understand the
non-monotonic behavior of the system efficiency about the optimal pinning
fraction. We also study the dependence of the optimal fraction on the
topological features of the system, such as the average degree and
heterogeneity, and obtain a theoretical upper bound of the system
efficiency. The theoretical predictions are validated with extensive
numerical simulations. Our work represents a general framework
to optimally control the collective dynamics in complex MG systems with
potential applications in social, economical and political systems.
Results
Boolean dynamics.
In the original Boolean system, a population of agents compete for two alternative resources, denoted as and , which have the same accommodating capacity . Similar to the MG dynamics, only the agents belonging to the global minority group are rewarded by one unit of payoff. As a result, the profit of the system is equal to the number of agents selecting the resource with attendance less than the accommodating capacity, which constitute the global-minority group. The dynamical variable of the Boolean system is denoted as , the number of agents in the system at time step . The variance of about the capacity characterizes the efficiency of the system. The densities of the and agents in the whole system are and , respectively. The state of the system can be conveniently specified by the column vector .
A Boolean system has two states (a binary state system), in which agents make decision according to the local information from immediate neighbors. The neighborhood of an agent is determined by the connecting structure of the underlying network. Each agent receives inputs from its neighboring agents and updates its state according to the Boolean function, a function that generates either and from the inputs GL:2002 . Realistically, for any agent, global information about the minority choice from all other agents at the preceding time step may not be available. Under this circumstance, the agent attempts to decide the global minority choice based on neighbors’ previous strategies. To be concrete, we assume ZHDHL:2013 ; ZWZYL:2005 that agent with neighbors chooses at time step with the probability
| (1) |
and chooses with the probability , where and , respectively, are the numbers of and neighbors of at time step , with . The expressions of probabilities, however, are valid only under the assumption that the two resources have the same accommodating capacity, i.e., . In real-world resource allocation systems, typically we have . Consider, for example, the extreme case of . Suppose we have for agent . In this case, rationality demands a stronger preference to the resource (i.e., with a higher probability). To investigate the issues associated with the control of realistic Boolean dynamics, we define
| (2) |
where is the response function of each agent to its local environment , i.e., the local neighbor’s configuration with and . The quantity (or ) characterizes the contribution of the -neighbors (or -neighbors) to the probability for to adopt . The quantity represents the strength of assimilation effect among the neighbors, while quantifies the dissimilation effect. Intuitively, the resource with a larger accommodating capacity would have a stronger assimilation effect among agents. By definition, the elements in each column in the matrix satisfy , i.e., the total probability for an agent to choose and is unity.
Using the mean-field assumption that the configuration of neighbors is uniform over the whole system, i.e., , we have that the stable solution for Eq. (2) satisfies , which leads to the eigenstate of as
| (9) |
The rational response () of agents to nonidentical accommodation capacities of resources will lead to the equality , i.e., the stable fraction of the agent densities in and is simply the ratio of the capacities. The elements of can then be defined accordingly using this ratio and the condition , which characterizes a stronger preference to the resource with a larger capacity. For the specific case of identical-capacity resources, we have , and the solution reduces to the result of the original Boolean dynamics ZHDHL:2013 ; ZWZYL:2005 . The optimal solution for the resource allocation is .
A general measure of Boolean system’s performance is the variance of with respect to the capacity :
| (10) |
which characterizes, over a time interval , the statistical deviations from the optimal resource utilization ZWZYL:2005 . A smaller value of indicates that the resource allocation is more optimal. A general phenomenon associated with Boolean dynamics is that, as agents strive to join the minority group, an undesired herding behavior can emerge, as characterized by large oscillations in . Our goal is to understand, for the general setting of nonidentical resource capacities, the effect of pinning control on suppressing/eliminating the herding behavior.
Pinning control scheme.
Our basic idea to control the herding behavior is to “pin” certain agents to freeze their states so as to realize optimal resource allocation, following the general principle of pinning control of complex dynamical networks WC:2002 ; LWC:2004 ; CLL:2007 ; XLCCY:2007 ; TWF:2009 ; PF:2009 ; YCL:2009 ; ZHDHL:2013 . Let be the fraction of agents to be pinned, so the fraction of unpinned (or free) nodes is . The numbers of the two different types of agents, respectively, are and . The free agents make choices according to local time-dependent information, for whom the inputs from the pinned agents are fixed.
The two basic quantities characterizing a pinning control scheme are the order of pinning (the way how certain agents are chosen to be pinned) and the pinning pattern ZHDHL:2013 . We adopt the degree-preferential pinning (DPP) strategy in which the agents are selected to be pinned according to their connectivity or degrees in the underlying network. In particular, agents of higher degrees are more likely to be pinned. This pinning strategy originated from the classic control method to mitigate the effects of intentional attacks in complex networks AJB:2000 ; CNSW:2000 ; CEbAH:2001 . The selection of the pinning pattern can be characterized by the fractions and of the pinned agents that select and , respectively, where . The quantities and are thus the pinning pattern indicators. Different from the previous work ZHDHL:2013 that investigated the specific case of (half-half pinning pattern), here we consider the more general case where is treated as a variable. The pinning schemes are implemented on random networks and scale-free networks with different values of the scaling exponent in the power-law degree distribution BA:1999 ; RRM:2005 . As we will see below, one uniform optimal pinning fraction exists for various values of the pinning pattern indicator .
Simulation Results.
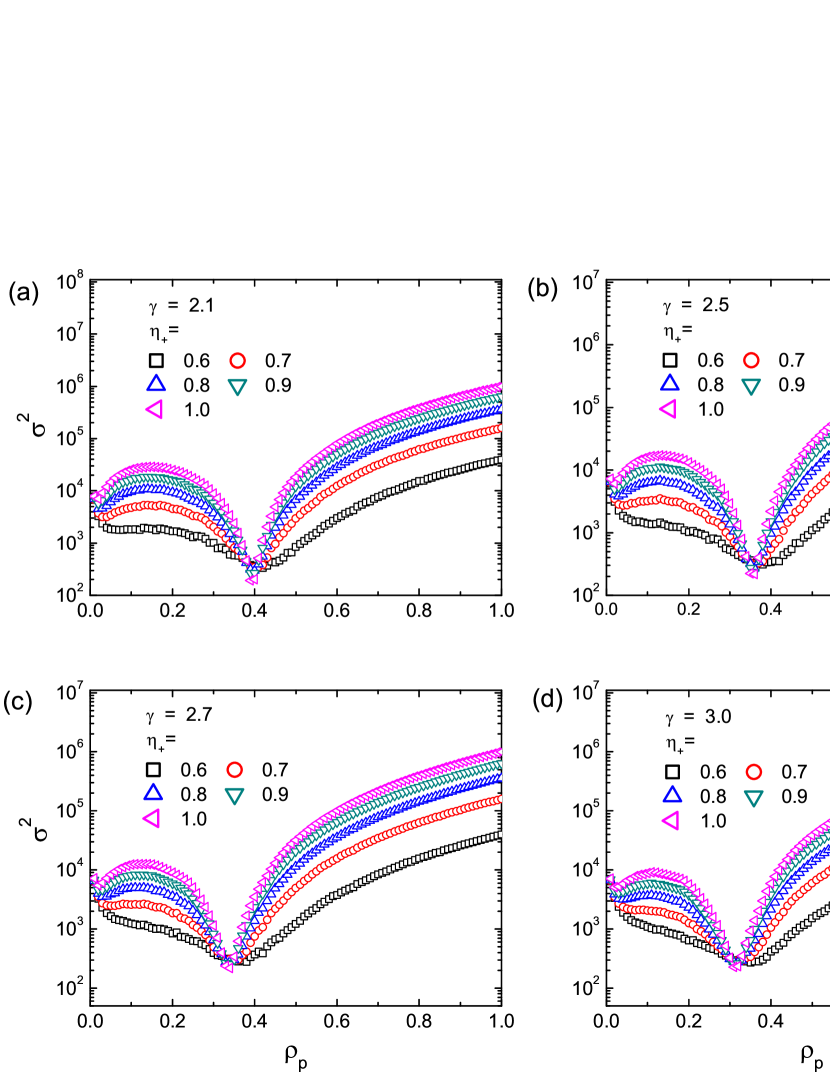
To gain insight, we first study the original Boolean dynamics with and for different values of the pinning pattern indicator . The game dynamics are implemented on scale-free networks of size and of the scaling exponent with the average degree ranging from to . The DPP scheme is performed with pinning fraction and values ranging from (i.e., half-half pinning) to (i.e., all to pinning). The variance versus for different values of and different degree are shown in Fig. 1. We see that, in general, systems with larger values of exhibit larger variance, implying that a larger deviation of from the ratio of the capacity can lead to lower efficiency in resource allocation. Surprisingly, there exists a universal optimal pinning fraction (denoted by ) about , where the variance is minimized and exhibits an opposite trend for , i.e., larger values of result in smaller values of . The implication is that, deviations of from provide an opportunity to achieve better performance (with smaller variances ), due to the non-monotonic behavior of with . To understand the emergence of the optimal pinning fraction , we see from Fig. 1 that the values of are approximately identical for different values of , which decrease with the average degree . As we will see below, in the large degree limit , the value of can be predicted theoretically (c.f., Fig. 4).
Simulations using scale-free networks of different degrees of
heterogeneity also indicate the existence of the universal optimal
pinning control strategy, as can be seen from the behaviors of the
variance calculated from scale-free networks of different degree
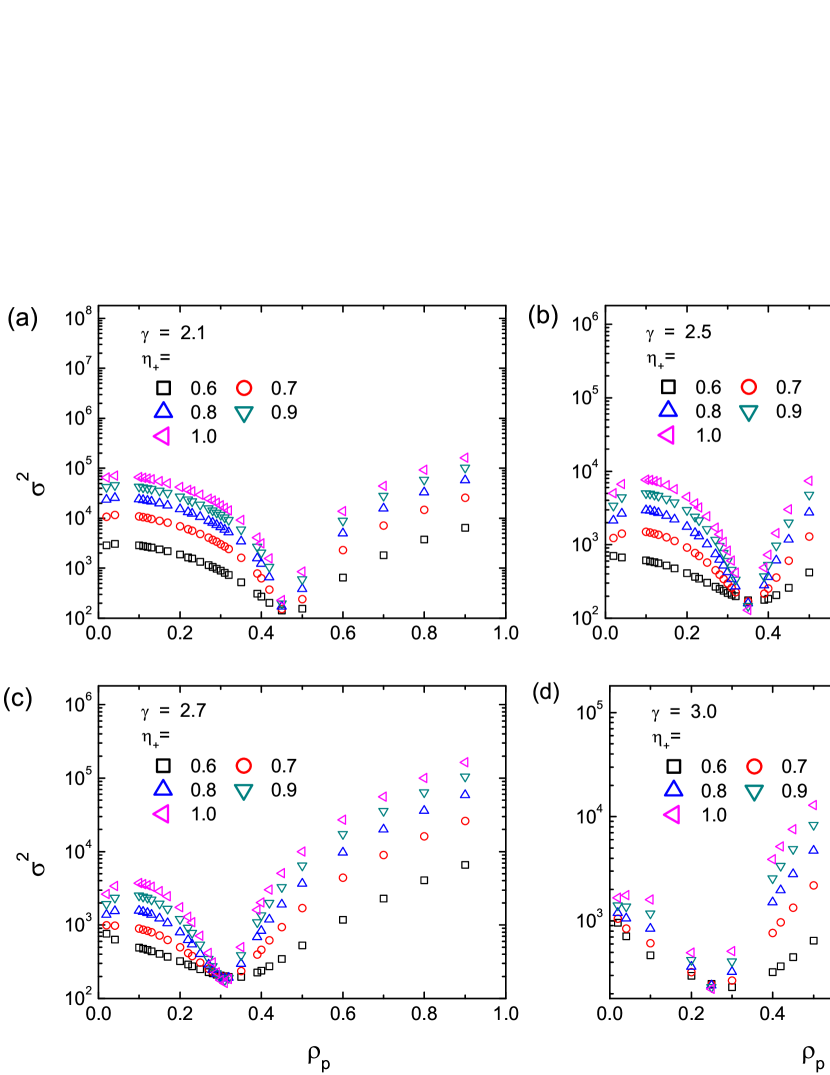
exponents (Fig. 2), where smaller values of
point to a stronger degree of heterogeneity of the system. We see
that an optimal value of exists for all cases,
which decreases only slightly with , i.e., more heterogeneous
networks exhibit larger values of the optimal pinning fraction
, a phenomenon that can also be predicated theoretically
(c.f., Fig. 5).
Theoretical Analysis
The phenomenon of the existence of a universal optimal pinning fraction
, independent of the specific values of pinning pattern
indicator , is remarkable. Here we develop a quantitative
theory to explain this phenomenon.
To begin, we note that MG is effectively a stochastic dynamical process due to the randomness in the selection of strategies by the agents. The variance of the system, a measure of the efficiency of the system, is determined by two separated factors. The first, denoted as , is the intrinsic fluctuations of about its expected value , defined as , which can be calculated once the stable distribution of attendance is known, where can be obtained either analytically (c.f., Fig. 3) or numerically. The second factor, denoted as , is the difference of the expected value from the capacity of the system: , which leads to a constant contribution to the variance of the system. Taking into account the two factors, we can write the system variance [defined in Eq. (10)] as
| (11) |
a direct summation of the two factors and . In contrast to the simplified case discussed in the previous works ZWZYL:2005 ; ZHDHL:2013 , the expected value in the dynamical process is not necessarily equal to the capacity . Nonzero values of are a result of biased pinning pattern () or improper response to the capacities of resources. In addition, recent studies of flux-fluctuation law in complex systems also found that, the variance of the system is determined by the two factors: the intrinsic fluctuation and the systematic external drives deMB:2004 ; DA:2006 ; YYK:2007 ; MGLM:2008 ; ZHYXW:2010 ; ZHHLYX:2013 ; HDHL:2014 .
Stable distribution of attendance.
To quantify the process of biased pinning control, we derive a discrete-time master equation and then discuss the effect of network topology on control.
Discrete-time master equation for biased pinning control.
To understand the response of the Boolean dynamics to pinning control with varied values of the pinning pattern indicator , we generalize our previously developed analysis ZHDHL:2013 . Let be the probability for a neighbor of one given free agent to be pinned so that the probability of encountering a free agent is . The transition probability of the system from to can be expressed in terms of . In particular, note that the state transition is due to updating of the free agents, as the remaining agents are fixed. To simplify notations, we set , , and , for . The conditional transition probability from at to at is
| (12) | |||||
where is the probability for a free agent to choose with the first and second terms representing the contributions of the pinned and free neighbors, respectively. In the Boolean system, the values of attendance oscillate about its equilibrium value ZHDHL:2013 . The transition probability between the state at and can be expressed as a function of :
| (13) | |||||
Equation (Discrete-time master equation for biased pinning control.) takes into account the effect of pinning patterns, which was ignored previously ZHDHL:2013 . The resulting balance equation governing the dynamics of the Markov chains becomes
| (14) |
which is the discrete-time master equation. The stable state that the system evolves into can be defined in the matrix form as
| (15) |
where is an matrix with elements , and is the corresponding vector of with ranging from to .
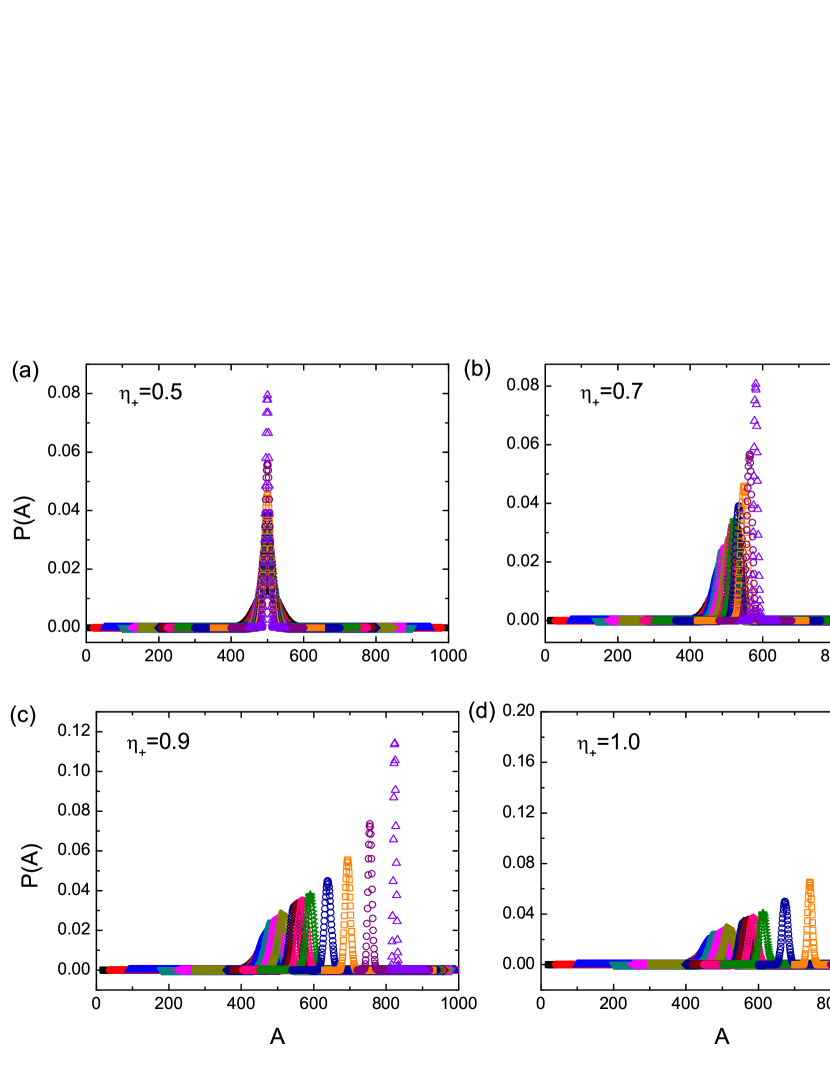
The probability distribution is a binomial function with various expectation values, as shown in Fig. 3. In addition, the probability is zero for , which defines the boundary condition in the sense that there are pinned agents. Once the stable distribution is obtained from Eq. (15), the cumulative variance of the system can be calculated from
| (16) |
The theoretical prediction of as a function of can thus be made through (a) identifying the function , (b) defining the matrix that depends on and , and (c) calculating the stable state .
Effect of network topology on pinning control.
The topology of the network system has an effect on the probability . For the particular case of scale-free networks with degree exponent , our previous work ZHDHL:2013 demonstrated that preferential pinning of the large-degree agents leads to . Here, we consider systems with degree distribution , where is the minimum degree of the network. For the DPP scheme where pinning occurs in the order from large to small degree agents, the relation between the minimum degree of pinned agents (denoted by ) and the pinning fraction is
| (17) |
For a given pinning fraction in which all the agents with are pinned, the probability for one neighbor of a given free agent to be a pinned agent is given by
| (18) |
Equations (17) and (18) are applicable to DPP scheme on networks of any degree distribution . For a scale-free network, as a function of can be expressed as
| (19) |
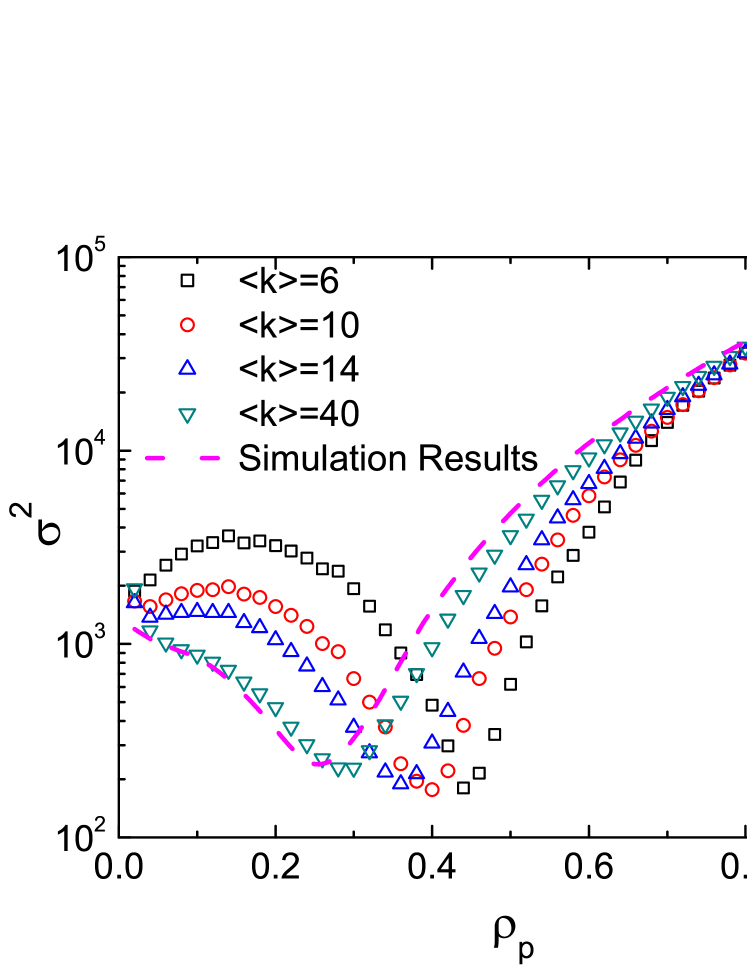
For the special case of , Eq. (19) reduces to the specific relationship obtained earlier ZHDHL:2013 : . As indicated by Eqs. (Discrete-time master equation for biased pinning control.-16), the specific form of matrix with respect to can be obtained by substituting Eq. (19) into Eq. (Discrete-time master equation for biased pinning control.), leading to the distribution and finally the variance of the system as a function of . Figure 4 displays the theoretical predicted (dashed curves) for various values of the pinning fraction and of the pinning pattern indicator . The trend and, more importantly, the existence of the optimal pinning fraction , agree well with the simulation results (marked with different symbols). In the limit , the system approaches a well-mixed state that can be fully characterized by Eq. (19), indicating that the simulation results approach the curve predicted by the mean-field theory as the average degree is increased.
Figure 5 shows the theoretical prediction of for scale-free networks with different values of the degree exponent , which agrees well with the results from direct simulation as in Fig. 2. For the case of highly heterogeneous networks (), the theoretical prediction deviates slightly from the numerical results for the reason that the networks in simulation inevitably exhibit certain topological features that are not taken into account in the theoretical analysis of , such as the degree associativity.
Optimal pinning.
Our analysis based on the master equation (14) applies to systems with and identical resource capacity. We now consider the more general case of varying values to further understand the optimal pinning control scheme.
Deviation of expected attendance from resource capacity.
The dependence of on can be obtained through the general form of the response matrix . For convenience, we use the column vector to denote the fraction of the agents pinned at and , where , is the fraction of free agents adopting strategies and , respectively, with . The state of the system can be expressed as , from which we have
| (20) |
At the next time step, the expected value of the state based on through the response matrix can be written as
| (21) |
Substituting Eq. (20) into Eq. (21), we get the relationship between and . A self-consistency process stipulated by Eqs. (20) and (21) can yield the stable state of the system with the expected number of agents choosing given by
| (22) |
In a free system without pinning, the rational response of agents to nonidential capacities of resources leads to Eq. (9), implying the relationship . From Eq. (22), we can obtain as a function of the value of the pinning pattern indicator , the elements of the matrix , the pinning fraction , and the parameter associated with network topology. We have
| (23) | |||||
which has the form of separated variables associated with and .
Optimal pinning pattern and fraction.
Optimizing the system requires minimum , i.e., in Eq. (23), leading to two independent solutions:
| (24a) | |||||
| (24b) | |||||
which respectively correspond to the optimal value of the pinning pattern indicator and the optimal pinning fraction . Here, for convenience, we define a parameter: so that Eq. (24b) can be expressed concisely as . Once the values of and satisfy either Eq. (24a) or Eq. (24b), we can obtain . The variance depends on the fluctuation factor only.
Equation (24a) specifies the pinning pattern with the same ratio as that of the resource capacity. The Boolean dynamics studied previously ZHDHL:2013 is a special case where the optimal pinning pattern indicator is for systems with , and the variance is simply determined by the factor .
From Eq. (24b), we see that the optimal pinning fraction is independent of but depends on both the network structure through and on the response function . Additionally, the condition and nonzero denominator require
| (25) |
The function for scale-free networks, as in Eq. (19), increases monotonically with . Figure 6(a) displays the curves and , i.e., both sides of Eq. (24b). The existence of nonzero for demands
| (26) |
For scale-free networks, diverges at . Equation (26) thus holds, implying that the DPP pinning scheme has a nonzero optimal pinning fraction , leading to . However, for homogeneous networks, Eq. (26) may not hold. In this case, a more specific implicit condition can be obtained from Eq. (26) through the following analysis. In particular, without an analytical expression of , the derivative of with respect to can be obtained from Eqs. (17) and (18):
| (27) |
For degree preferential pinning, in the limit , the maximum degree for free agents is . We thus have
| (28) |
which requires that the network be heterogeneous. For , we have , ensuring the existence of a nonzero value for .
The contour map of the optimal pinning fraction in the parameter space of and for scale-free networks with is shown in Fig. 6(b). The boundary associated with condition Eq. (25) is represented by the white dashed line, where nonzero solutions of do not exist below the lower-left region. Figures 6(c) and 6(d) show for as a function of for scale-free and random networks, respectively, where is varied and is fixed to . The theoretical prediction of [red solid curve in (c) and red open circle in (d)] is given by the intersections of the curves and in Fig. 6(a). For scale-free networks, since Eq. (26) holds, Eq. (25) is the only constraint on the value of (red dashed arrow), with the region at the right-hand side yielding nonzero solutions. The red solid curve in Fig. 6(c) represents the theoretical prediction, and the open squares denote the simulation results from scale-free networks of size , power-law exponent , and average degree .
For random networks, the existence of nonzero solutions requires that Eqs. (25) and (27) or (28) hold. For the Poisson degree distribution, the maximum degree of the network can be calculated from
| (29) |
We can obtain an estimate of the value of that satisfies Eq. (28), as indicated by the blue arrow (labeled as boundary 2) in Fig. 6(d). The right-hand side of this point satisfies both Eqs. (25) and (28), implying the existence of nonzero . Comparison of the results from random and scale-free networks with different scaling exponents (Figs. 2, 5 and 6) shows that, stronger heterogeneity tends to enhance the values of , which can also be seen from Eq. (26).
To better understand the non-monotonic behavior of with , we provide a physical picture of the behavioral change for greater or less than . The effect of pinning control is determined by the number of edges between pinned and free agents, which are pinning-free edges. For a small pinning fraction , the average effect per pinned agent on the system (represented by the number of pinned-free edges per pinned agent) is relatively large. However, as is increased, the average impact is reduced for two reasons: (a) an increase in the edges within the pinned agents’ community itself (i.e., two connected pinned agents), which has no effect on control, and (b) a decrease in the number of free agents, which directly reduces the number of pinned-free edges. Consider the special case of and . For small , the pinned agents have a significant impact so that the free agents tend to overestimate the probability of winning by adopting . In this case, the expected value is smaller than , corresponding to . For highly heterogeneous systems, the average impact per pinned agent is larger for a given small value of . As is increased, the average influence per pinned agent reduces and, consequently, restores towards . For and , the system variance [Eq. (11)] is minimized due to , and the corresponding pinning fraction achieves the optimal value . For strongly heterogeneous systems, due to the large initial average impact caused by pinning the hub agents, the optimal pinning fraction appears in the larger region. Further increase in with will lead to and , thereby introducing nonzero again and, consequently, generating an increasing trend in .
Collapse of variance.
For certain networks, the variance is determined by the values of the pinning pattern indicator and the pinning fraction . Our analysis so far focuses on the contribution of to the variance as the pinning fraction is increased but for fixed . It is thus useful to define a quantity related to the variance , which can be expressed in the form of separated variables. For two different values of the pinning pattern indicator, and , for a given value of , the relative weight of can be obtained from Eq. (23) as
| (30) |
where is a function of both and . Remarkably, the ratio depends on and but it is independent of , due to the form of separated variables in Eq. (23). From the simple relationship Eq. (30), we can define the relative changes in these quantities due to an increase in the value of from a reference value as
| (31) | |||
| (32) |
and then obtain the change rate associated with and as,
| (33) |
where is independent of . In the limit , the rate of change becomes
| (34) |
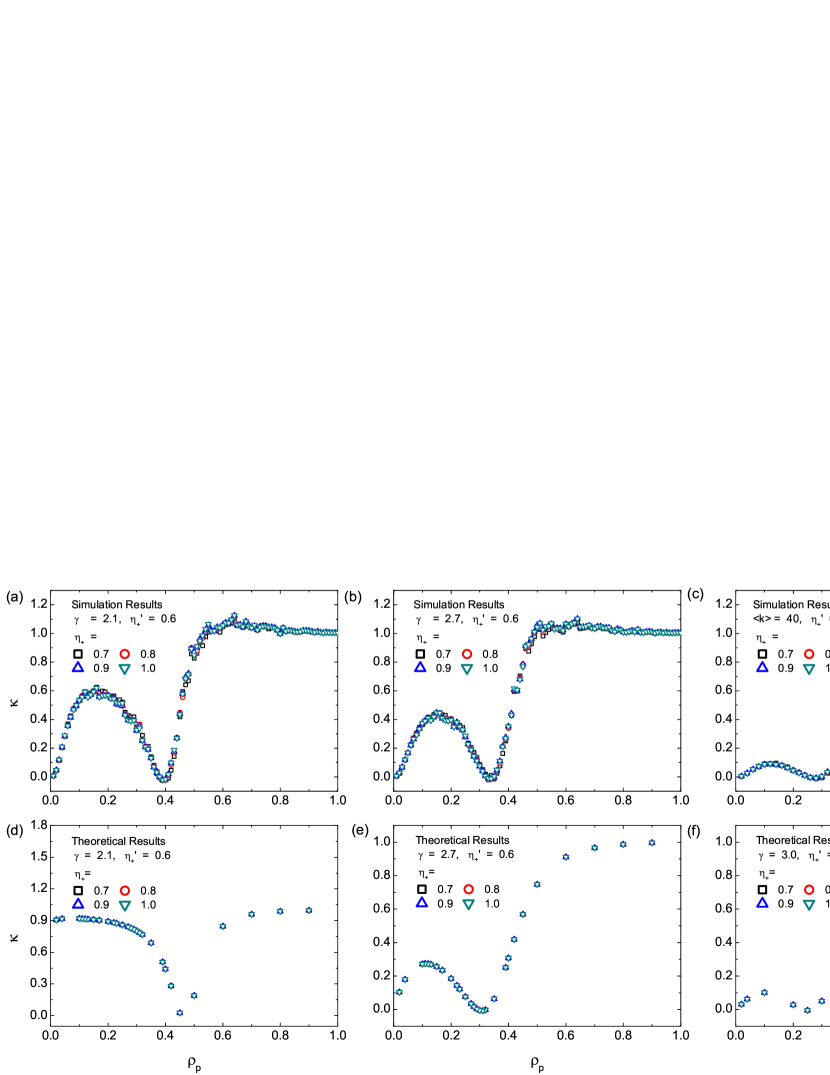
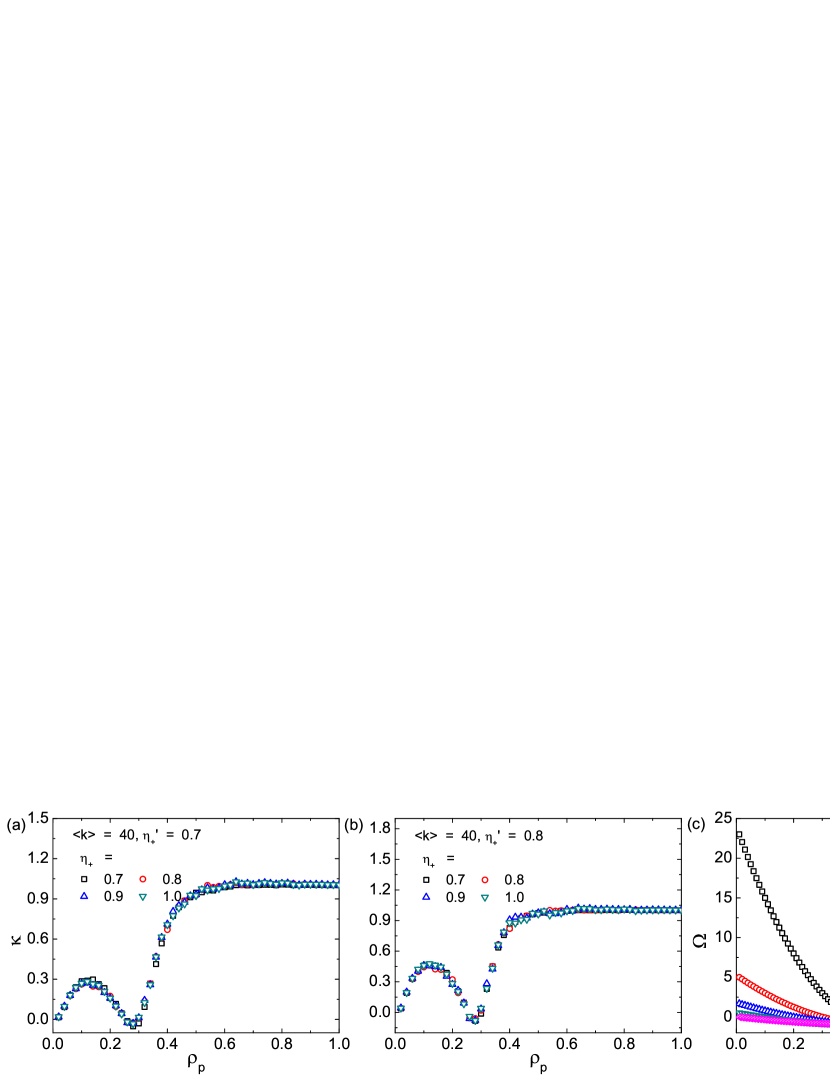
Figure 7 shows as a function of for scale-free networks, where the value of the reference pinning pattern indicator is . To obtain the values of , we first calculate by substituting the values of , and the elements of into Eqs. (30) and (32). We then obtain by substituting the values of into Eq. (31), with either from simulation as in Figs. 1 and 2 or from theoretical analysis as in Fig. 5. We see that the values from simulation results of [Figs. 7(a-c) marked by “Simulation Results”] and theoretical prediction of [Figs. 7(d-f) marked by “Theoretical Results”] show the behavior in which the curves of for different values of collapse into a single one. This indicates that depends solely on the pinning fraction ; it is independent of the value of the pinning pattern indicator . Extensive simulations and analysis of scale-free networks with different average degree or different degree exponent verify the generality of the collapsing behavior.
From Eq. (34), we see that the variance and the quantity are closely related. For example, a smaller value of indicates that contributes more to the variance of as is changed, and vice versa. In Fig. 7, corresponds to the intersecting points of the curves of with different values of shown in Figs. 1, 2, and 5. It can also be verified analytically that, the minimal point with coincides with the optimal pinning fraction at which is minimized, which is supported by simulation results in Figs. 7, 1, 2, and 5.
Variance in the form of separated variables.
From Eq. (33), for a given value of the reference pinning pattern indicator , we can obtain an expression of in the form of separated variables as
| (35) |
where is independent of the change in , and is independent of . The consequence of Eq. (35) is remarkable, since it defines in the parameter space a function in the form of separated variables which, as compared with the original quantity , not only simplifies the description but also gives a more intuitive picture of the system behavior. Specifically, for the MG dynamics, the influences of various factors on the variance or can be classified into two parts: (I) the function that reflects the effects of the pinning fraction and the network structure among agents (in terms of the degree distribution , the average degree , and the scaling exponent ), and (II) the function that characterizes the impact of the pinning pattern indicator and the response of agents to resource capacities and through . Figures 8(a) and 8(b) show the values of as a function of for and , respectively, whereas Fig. 8(c) shows for several values of . From Eqs. (30) and (32), we see that is a quadratic function of with the symmetry axis at , which depends on the setting of response function . The second derivative of the function depends on .
From the definition in Eq. (31), the variance of the system for arbitrary values of and can be obtained as
| (36) |
where specifies the reference pinning pattern.
Once we have the two respective curves
for the two specific pinning patterns as specified by
and , in the whole
parameter space can be calculated accordingly.
In particular, the quantities
and serve as a
holographic representation of the dynamical behavior of the
system in the whole parameter space. In particular, one can first
obtain from Eqs. (23) and (32),
and then calculate
, and finally obtain the value of
by substituting and
into Eq. (36).
Discussions
The phenomenon of herding is ubiquitous in social and economical systems.
Especially, in systems that involve and/or rely on fair resource allocation,
the emergence of herding behavior is undesirable, as in such a state a
vast majority of the individuals in the system share only a few resources,
a precursor of system collapse at a global scale. A generic
manifestation of herding behavior is relatively large fluctuations in
the dynamical variables of the system such as the numbers of individuals
sharing certain resources. It is thus desirable to develop effective control
strategies to suppress herding. An existing and powerful mathematical
framework to model and understand the herding behavior is minority games.
Investigating control of herding in the MG framework may provide useful
insights into developing more realistic control strategies for real-world
systems.
Built upon our previous works in MG systems ZWZYL:2005 ; ZHDHL:2013 , in this paper we articulate, test, and analyze a general pinning strategy to control herding behavior in MG systems. A striking finding is the universal existence of an optimal pinning fraction that minimizes the fluctuations in the system, regardless of system details such as the degree of homogeneity of the resource capacities, topology and structures of the underlying network, and different patterns of pinning. This means that, generally, the efficiency of the system can be optimized for some relatively small pinning fraction. Employing the mean-field approach, we develop a detailed theory to understand and predict the dynamics of the MG system subject to pinning control, for various network topologies and pinning schemes. The key observation underlying our theory is the two factors contributing to the system fluctuations: intrinsic dynamical fluctuations and systematic deviation of agents’ expected attendance from resource capacity. The theoretically predicted fluctuations (quantified by the system variance) agree with those from direct simulation. In particular, in the large degree limit, for a variety of combinations of the network and pinning parameters, the numerical results approach those predicted from our mean field theory. Our theory also correctly predicts the optimal pinning fraction for various system and control settings.
In real world systems in which resource allocation is an important component, resource capacities and agent interactions can be diverse and time dependent. To develop MG model to understand the effects of diversity and time dependence on herding dynamics, and to exploit the understanding to develop optimal control strategies to suppress or eliminate herding are open issues at the present. Furthermore, implementation of pinning control in real systems may be associated with incentive policies that provide compensations or rewards to the pinned agents. How to minimize the optimal pinning fraction then becomes an interesting issue. Our results provide insights into these issues, and represent a step toward the goal of designing highly stable and efficient resource allocation systems in modern society and economy.
References
- (1) Paczuski, M., Bassler, K. E. & Corral, A. Self-organized networks of competing boolean agents. Phys. Rev. Lett. 84, 3185–3188 (2000).
- (2) Vázquez, A. Self-organization in populations of competing agents. Phys. Rev. E 62, R4497 (2000).
- (3) Galstyan, A. & Lerman, K. Adaptive boolean networks and minority games with time-dependent capacities. Phys. Rev. E 66, 015103 (2002).
- (4) Zhou, T., Wang, B.-H., Zhou, P.-L., Yang, C.-X. & Liu, J. Self-organized boolean game on networks. Phys. Rev. E 72, 046139 (2005).
- (5) Eguíluz, V. M. & Zimmermann, M. G. Transmission of information and herd behavior: An application to financial markets. Phys. Rev. Lett. 85, 5659–5662 (2000).
- (6) Lee, S. & Kim, Y. Effects of smartness, preferential attachment and variable number of agents on herd behavior in financial markets. J. Korean. Phys. Soc. 44, 672–676 (2004).
- (7) Wang, J. et al. Evolutionary percolation model of stock market with variable agent number. Physica A 354, 505–517 (2005).
- (8) Zhou, P.-L. et al. Avalanche dynamics of the financial market. New Math. Nat. Comp. 1, 275–283 (2005).
- (9) Huang, Z.-G., Wu, Z.-X., Guan, J.-Y. & Wang, Y.-H. Memory-based boolean game and self-organized phenomena on networks. Chin. Phys. Lett. 23, 3119 (2006).
- (10) Huang, Z.-G., Zhang, J.-Q., Dong, J.-Q., Huang, L. & Lai, Y.-C. Emergence of grouping in multi-resource minority game dynamics. Sci. Rep. 2, 703 (2012).
- (11) Zhang, J.-Q., Huang, Z.-G., Dong, J.-Q., Huang, L. & Lai, Y.-C. Controlling collective dynamics in complex minority-game resource-allocation systems. Phys. Rev. E 87, 052808 (2013).
- (12) Dong, J.-Q., Huang, Z.-G., Huang, L. & Lai, Y.-C. Triple grouping and period-three oscillations in minority-game dynamics. Phys. Rev. E 90, 062917 (2014).
- (13) Kauffman, S. A. The origins of order: Self-organization and selection in evolution (Oxford university press, 1993).
- (14) Levin, S. A. Ecosystems and the biosphere as complex adaptive systems. Ecosystems 1, 431–436 (1998).
- (15) Arthur, W. B., Durlauf, S. N. & Lane, D. A. The economy as an evolving complex system II, vol. 28 (Addison-Wesley Reading, MA, 1997).
- (16) Challet, D. & Zhang, Y.-C. Emergence of cooperation and organization in an evolutionary game. Physica A 246, 407–418 (1997).
- (17) Challet, D., Marsili, M., Zhang, Y.-C. et al. Minority games: interacting agents in financial markets. OUP Catalogue (2013).
- (18) Arthur, W. B. Inductive reasoning and bounded rationality. Am. Econ. Rev. 84, 406–411 (1994).
- (19) Challet, D. & Marsili, M. Phase transition and symmetry breaking in the minority game. Phys. Rev. E 60, R6271–R6274 (1999).
- (20) Challet, D., Marsili, M. & Zecchina, R. Statistical mechanics of systems with heterogeneous agents: Minority games. Phys. Rev. Lett. 84, 1824–1827 (2000).
- (21) Martino, A. D., Marsili, M. & Mulet, R. Adaptive drivers in a model of urban traffic. Europhys. Lett. 65, 283 (2004).
- (22) Borghesi, C., Marsili, M. & Miccichè, S. Emergence of time-horizon invariant correlation structure in financial returns by subtraction of the market mode. Phys. Rev. E 76, 026104 (2007).
- (23) Savit, R., Manuca, R. & Riolo, R. Adaptive competition, market efficiency, and phase transitions. Phys. Rev. Lett. 82, 2203 (1999).
- (24) Kalinowski, T., Schulz, H.-J. & Birese, M. Cooperation in the minority game with local information. Physica A 277, 502 (2000).
- (25) Slanina, F. Harms and benefits from social imitation. Physica A 299, 334–343 (2001).
- (26) Anghel, M., Toroczkai, Z., Bassler, K. E. & Korniss, G. Competition-driven network dynamics: Emergence of a scale-free leadership structure and collective efficiency. Phys. Rev. Lett. 92, 058701 (2004).
- (27) Johnson, N. F., Hart, M. & Hui, P. M. Crowd effects and volatility in markets with competing agents. Physica A 269, 1–8 (1999).
- (28) Hart, M., Jefferies, P., Johnson, N. F. & Hui, P. M. Crowd-anticrowd theory of the minority game. Physica A 298, 537–544 (2001).
- (29) Lo, T. S., Chan, H. Y., Hui, P. M. & Johnson, N. F. Theory of networked minority games based on strategy pattern dynamics. Phys. Rev. E 70, 056102 (2004).
- (30) Lo, T. S., Chan, K. P., Hui, P. M. & Johnson, N. F. Theory of enhanced performance emerging in a sparsely connected competitive population. Phys. Rev. E 71, 050101 (2005).
- (31) Challet, D., Martino, A. D. & Marsili, M. Dynamical instabilities in a simple minority game with discounting. J. Stat. Mech. Theory E. L04004 (2008).
- (32) Bianconi, G., Martino, A. D., Ferreira, F. F. & Marsili, M. Multi-asset minority games. Quant. Financ. 8, 225–231 (2008).
- (33) Xie, Y.-B., Wang, B.-H., Hu, C.-K. & Zhou, T. Global optimization of minority game by intelligent agents. Europ. Phys. J. B 47, 587–593 (2005).
- (34) Zhong, L.-X., Zheng, D.-F., Zheng, B. & Hui, P. M. Effects of contrarians in the minority game. Phys. Rev. E 72, 026134 (2005).
- (35) Moelbert, S. & De Los Rios, P. The local minority game. Physica A 303, 217–225 (2002).
- (36) Chen, Q., Huang, Z.-G., Wang, Y. & Lai, Y.-C. Multiagent model and mean field theory of complex auction dynamics. New J. Phys. 17, 093003 (2015).
- (37) Moro, E. Advances in Condensed Matter and Statistical Physics, chap. The Minority Games: An Introductory Guide (Nova Science Publishers, 2004).
- (38) Yeung, C. H. & Zhang, Y.-C. Minority games. In Meyers, R. A. (ed.) Encyclopedia of Complexity and Systems Science, 5588–5604 (Springer New York, 2009).
- (39) Dyer, J. R. et al. Consensus decision making in human crowds. Anim. Behav. 75, 461–470 (2008).
- (40) Wang, X. F. & Chen, G. Pinning control of scale-free dynamical networks. Physica A 310, 521–531 (2002).
- (41) Li, X., Wang, X. & Chen, G. Pinning a complex dynamical network to its equilibrium. IEEE Trans. Circ. Sys. 51, 2074–2087 (2004).
- (42) Chen, T., Liu, X. & Lu, W. Pinning complex networks by a single controller. IEEE Trans. Circ. Sys. 54, 1317–1326 (2007).
- (43) Xiang, L., Liu, Z., Chen, Z., Chen, F. & Yuan, Z. Pinning control of complex dynamical networks with general topology. Physica A 379, 298–306 (2007).
- (44) Tang, Y., Wang, Z. & Fang, J.-a. Pinning control of fractional-order weighted complex networks. Chaos 19, 013112 (2009).
- (45) Porfiri, M. & Fiorilli, F. Node-to-node pinning control of complex networks. Chaos 19, 013122 (2009).
- (46) Yu, W., Chen, G. & Lü, J. On pinning synchronization of complex dynamical networks. Automatica 45, 429–435 (2009).
- (47) Albert, R., Jeong, H. & Barabási, A.-L. Error and attack tolerance of complex networks. Nature 406, 378–382 (2000).
- (48) Callaway, D. S., Newman, M. E., Strogatz, S. H. & Watts, D. J. Network robustness and fragility: Percolation on random graphs. Phys. Rev. Lett. 85, 5468 (2000).
- (49) Cohen, R., Erez, K., Ben-Avraham, D. & Havlin, S. Breakdown of the internet under intentional attack. Phys. Rev. Lett. 86, 3682 (2001).
- (50) Barabási, A.-L. & Albert, R. Emergence of scaling in random networks. Science 286, 509–512 (1999).
- (51) Catanzaro, M., Boguñá, M. & Pastor-Satorras, R. Generation of uncorrelated random scale-free networks. Phys. Rev. E 71, 027103 (2005).
- (52) de Menezes, M. & Barabási, A. L. Fluctuations in network dynamics. Phys. Rev. Lett. 92, 028701 (2004).
- (53) Duch, J. & Arenas, A. Scaling of fluctuations in traffic on complex networks. Phys. Rev. Lett. 96, 218702 (2006).
- (54) Yoon, S., Yook, S.-H. & Kim, Y. Scaling property of flux fluctuations from random walks. Phys. Rev. E 76, 056104 (2007).
- (55) Meloni, S., Gómez-Gardees, J., Latora, V. & Moreno, Y. Scaling breakdown in flow fluctuations on complex networks. Phys. Rev. Lett. 100, 208701 (2008).
- (56) Zhou, Z., Huang, Z.-G., Yang, L., Xue, D.-S. & Wang, Y.-H. The effect of human rhythm on packet delivery. J. Stat. Mech. Theory E. 2010, P08001 (2010).
- (57) Zhou, Z. et al. Universality of flux-fluctuation law in complex dynamical systems. Phys. Rev. E 87, 012808 (2013).
- (58) Huang, Z.-G., Dong, J.-Q., Huang, L. & Lai, Y.-C. Universal flux-fluctuation law in small systems. Sci. Rep. 4, 6787 (2014).
Acknowledgement
We thank Prof. L. Huang for helpful discussions. This work was supported by ARO under Grant W911NF-14-1-0504, and the NSF of China under Grants Nos. 11575072, 11135001 and 11275003.
Author contributions
ZGH and YCL devised the research project. JQZ, ZGH, and RS performed numerical simulations. JQZ, ZGH, YCL, and ZXW analyzed the results and wrote the paper.
Additional information
Competing financial interests: The authors declare no competing financial interests.


.