789\Yearpublication2015\Yearsubmission2015\Month11\Volume999\Issue88
A Dynamical Evolution Study of 40 2MASS Open Clusters
Abstract
We investigate the dynamical evolution of 40 open
clusters (OCs) by means of their astrophysical parameters derived
from field-decontaminated 2MASS photometry. We find a bifurcation
in the planes core radius vs. age and cluster radius vs. age, in
which part of the clusters appear to expand with time probably due
to the presence of stellar black holes while others seem to shrink
due to dynamical relaxation.
Mass functions (MFs) are built for 34 of the sample (31 OCs),
which are used to search for indications of mass segregation and
external dynamical processes by means of relations among
astrophysical, structural and evolutionary parameters.
We detect a flattening of MF slopes ocurring at the evolutionary
parameters and ,
respectively.
Within the uncertainties involved, the overall MF slopes of 14
out of 31 OCs with are consistent with
Kroupa’s initial mass function, implying little or no dynamical
evolution for these clusters. The remaining 17 OCs with MF slopes
departing from that of Kroupa show mild/large scale mass
segregation due to dynamical evolution.
keywords:
CCD 2 MASS photometry, open clusters and associations, stars1 Introduction
The internal dynamical processes of open clusters (OCs) are mass loss during stellar evolution, mass segregation and evaporation of its stellar content with time. Tidal interactions with the Galaxy’s disc and bulge, as well as collisions with Giant Molecular clouds (hereafter GMCs) are the main external dynamical effects upon OCs. Because of these dynamical interactions, as clusters age, their structures are subject to considerable changes, and may even be dissolved in the Galactic field. A massive cluster can be dissolved by central tidal effects in 50 Myr Portegies Zwart et al. (2002); Bergond et al. (2001). This time is much shorter than found for most OCs within the Solar circle Bonatto & Bica (2006a). Interactions with the galactic disc, the tidal pull of the Galactic bulge and collisions with GMCs destroy more easily the poorly-populated OCs, on a time-scale of yr , particularly inside the Solar circle Bergond et al. (2001).
A cluster loses low-mass stars from its outer regions into the field by stellar evaporation. As a result of this mass segregation, low-mass stars are transferred from its core to the cluster’s outskirts while massive stars accumulate in the core Bonatto & Bica (2005); Schilbach et al. (2006). This results in a flat mass function (MF hereafter) in the core and steep one in the halo. These external and internal dynamical processes play different roles, depending on the location of an OC with respect to the Solar circle: old OCs with Age Gyr tend to be concentrated in the anti-centre, a region with a low density of GMCs van den Bergh & McClure (1980); Camargo et al. (2009). Tidal shocks from the Galaxy and from GMCs and observational incompleteness or biases are responsible for the scarcity of OCs in direction to the Galactic center Bonatto & Bica (2007a). Due to absorption and crowding in regions dominated by disc and bulge stars, the OCs’ observational completeness is decreased. With the effect of tidal interaction, an OC heats and its stars gain kinetic energy, which leads to an increase in the evaporation rate.
In this paper we have considered 40 OCs with 2MASS JH photometric data, which are selected in respective to the cluster location and the age (Age Myr) from WEBDA OC and Dias et al. catalogues Mermilliod (1992); Dias et al. (2012). These OCs have been considered to study their dynamical evolution, particularly in dependence of their location in the Galaxy. We state that our sample is relatively small but our work have the advantage of being based on a uniform database, in the sense that we determine the parameters following the same methods, based on the same kind of photometry. The robust structural parameters have been derived from high-contrast stellar radial density profiles following the method of Bonatto & Bica (2007a), and the ages were derived from a fit of isochrones to decontaminated colour-magnitude diagrams of the 2MASS JH photometric data. As can be seen from the WEBDA database, CCD-based CMDs of these 40 OCs are also available. We stress that the CMDs presented here go fainter than is available there.
From our sample of young, intermediate and old OCs (), the relations between the dynamical evolution indicators and cluster radius (RRDP, hereafter), core radius (Rcore, hereafter), mass, mass function slope , mass density , evolutionary parameter -, and the parameters have been derived and compared with the values given in the literature. Here, d, RGC, and z denote heliocentric, galactocentric (hereafter RGC), and Galactic plane distances, respectively. Such relations have been studied by Lynga (1982), Janes & Phelps (1994),Nilakshi et al. (2002), Tadross et al. (2002), Bonatto & Bica (2005), Schilbach et al. (2006), Sharma et al. (2006), Bonatto & Bica (2007a), Maciejewski & Niedzielski (2007), Bukowiecki et al. (2011), and Camargo et al. (2009). In this paper, R⊙ kpc which is based on the updated distances of Galactic globular clusters Bica et al. (2006b), is taken through this paper.
This paper is organised as follows: the selection of the OCs is presented in Section 2. In Section 3 the 2MASS JH photometry and the field star decontamination algorithm (employed in the CMD analyses) are given. The derivations of astrophysical and structural parameters, mass and mass functions, relaxation time and evolutionary parameter are presented in Sections 4 to 6. Section 7 is devoted to Results, which contain the following subsections: 7.1 the relation between and , 7.2 relations of cluster dimensions with distance and age, 7.3 the relations between and and with , 7.4 the relations with and with , 7.5 the spatial distribution of the 40 OCs in the Galaxy, 7.6 relations between the overall mass with (, ) and with , 7.7 the relations between the mass density with slopes, , and with , 7.8 the relation between the slopes and the evolutionary parameter, and a comparison with Kroupa’s IMF. Conclusions are presented in Section 8.
2 Open cluster sample and Spatial distribution
We applied two criteria to select the OCs for our work from WEBDA OC and Dias et al. catalogues Mermilliod (1992); Dias et al. (2012). Namely, the cluster location in the Galaxy and their ages, see Fig. 1. In order to study dynamical evolution of middle- and older-age OCs, 40 OCs with as a function of the Galactic location (see Fig. 1, slices I-IV) from the 2MASS data base are considered. The location criteria is important because the longevity/survival rate of the OCs are related to the Galactic slices inside/outside the Solar circle. Over 40 OCs in WEBDA OC Mermilliod (1992) and Dias et al. (2012) catalogue have been considered. The OCs which were not appropriate to the decontamination technique of field stars were eliminated by examining their decontamination surface density distributions (see sect. 3). Thus the sample size resulted to be 40 OCs. We are aware that the sample is not large but we intended that the sample with robust parameters would be significant to address the dynamical problems mentioned earlier. From the 40 OCs, we have also studied the relations between the parameters (Age, d, RGC, ) and dynamical indicators (Rcore, RRDP, , , ).
1148 OCs out of 2000 OCs in Dias et al. (2012) catalogue, which can be considered the most representative for our purpose have age determinations. As can be seen from Table 1, there are 13 OCs with (3.5 %), 26 OCs with (14.5 %) and one with in our sample.
| Age (Myr) | N (This work) | N(Dias) | Percentage (%) |
|---|---|---|---|
| Age 200 | 1 | 579 | 0.17 |
| 200 Age 1000 | 13 | 373 | 3 |
| 1000 Age 5000 | 26 | 179 | 15 |
| 5000 Age 10000 | - | 17 | - |
| Total | 40 | 1148 | 3 |
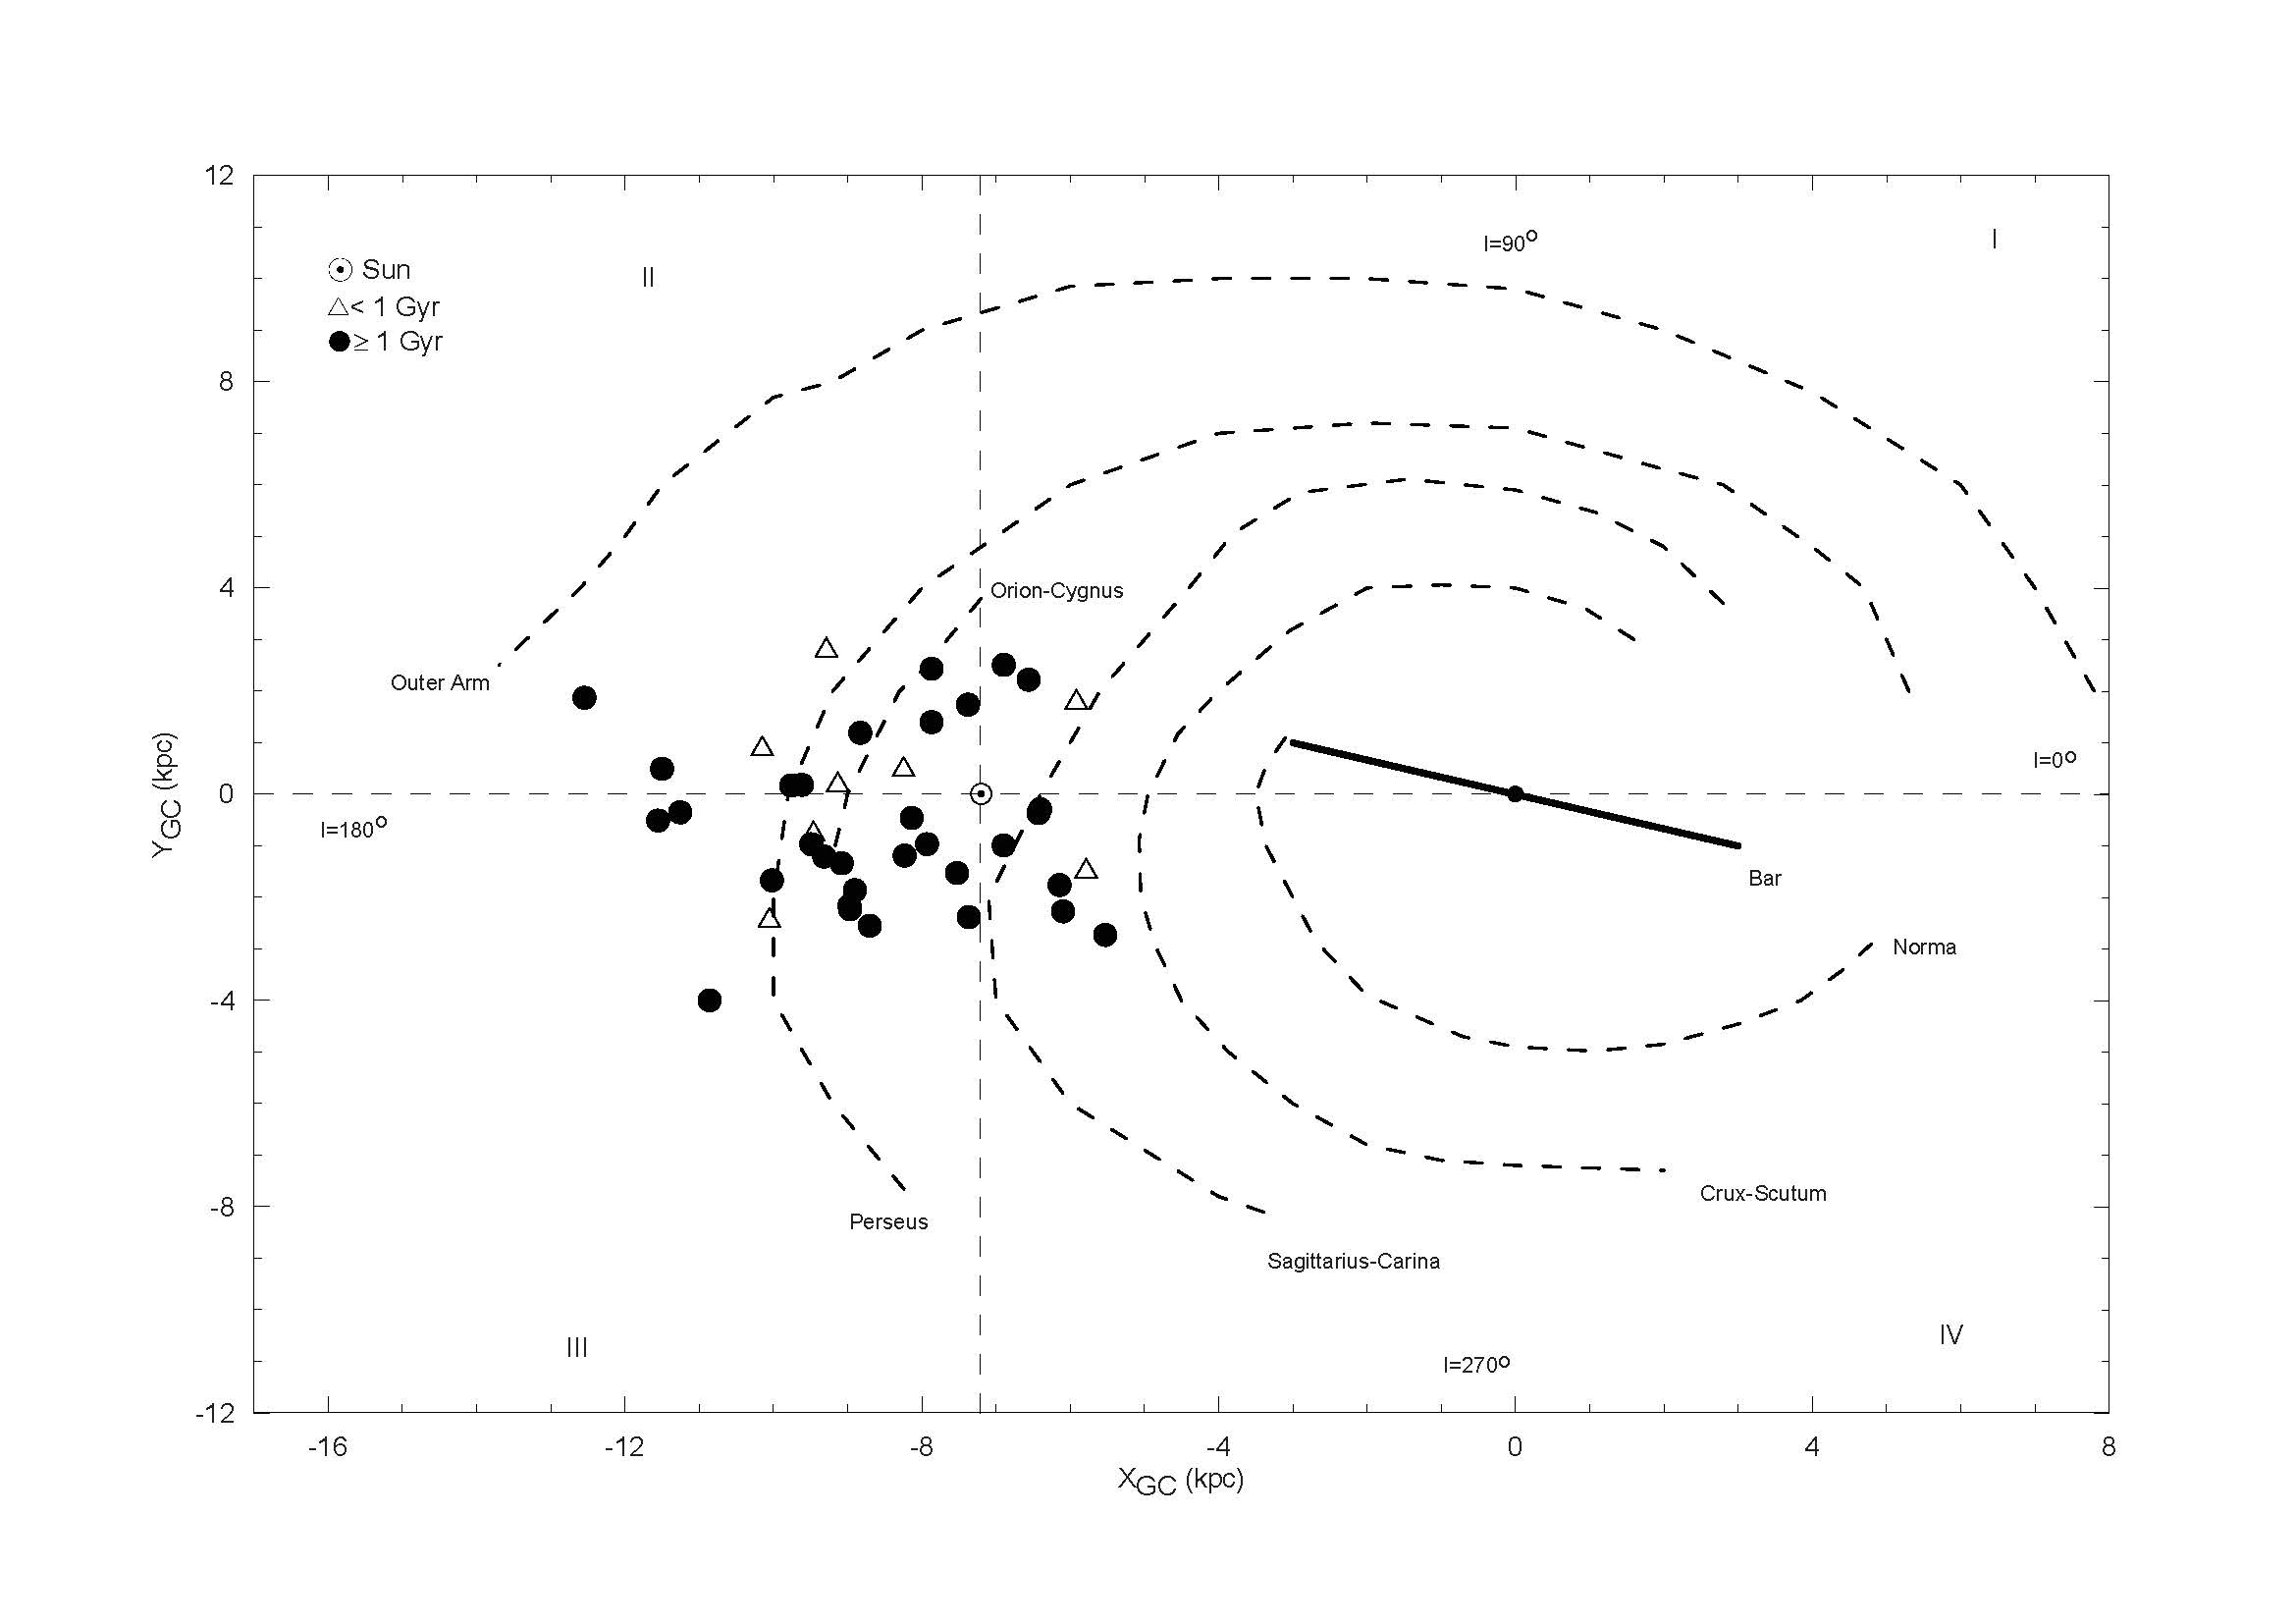
The spatial distribution in (X, Y) plane together spiral arms 111(X, Y) is a right handed Cartesian coordinate system with the Sun on its center, with the X axis pointing towards the Galactic centre and the Y axis pointing in the disc rotation direction. of the 40 OCs is displayed in Fig. 1. As seen from the Fig. 1, our sample comprises the OCs of four Galactic slices (I-IV). Note that the number of OCs towards the anti-center in Fig. 1 is larger than the ones toward the Galactic center directions. Six out of eight OCs with Age Gyr fall in the Galactic anticenter directions, whereas the remaining two occupy the Galactic center direction. This is because the OCs in Galactic center directions cannot be observed due to strong absorption, crowding or were systematically dissolved by different tidal effects such as high frequency of collisions with GMCs (Gieles et al., 2006).
The majority of OCs with Age 1 Gyr lies outside the Solar circle. From Fig. 1, one readily sees that the number of OCs inside the Solar radius is biased in direction of the Galactic center. The reason is that the inner Galaxy clusters cannot be observed because of strong absorption and crowding, or because they have been dissolved by a combination of tidal effects. In a good measure the latter is caused by the expected higher frequency of collisions with GMCs in that direction Gieles et al. (2006); Camargo et al. (2009). From an inspection of Fig. 1, there are more OCs in the anticentre direction than in the opposite direction, in agreement with van den Bergh & McClure (1980), who find that the OCs with Age 1.0 Gyr tend to be concentrated in the anticentre, which is a region with lower density of GMCs. Our sample has small statistics to draw significant conclusions in that respect. However, statistically, working with a representative sub-population of the Galactic OCs minimizes the occurrence of biases in the analyses.
Finally, to put the present OC sample in context, in Fig. 2 we compare some observational data together with fundamental parameters (derived in subsequent sections) with the corresponding ones found in OC databases. This analysis is also important for checking for the presence of systematic biases in our sample. For this analysis we use the parameters derived by Kharchenko et al. (2013) for 3006 OCs. The advantage of their work is that the parameters follow from a systematic and uniform analysis. Since Kharchenko et al. (2013) do not provide cluster mass, we take such values from Piskunov et al. (2008), although for a smaller number of OCs, 236.
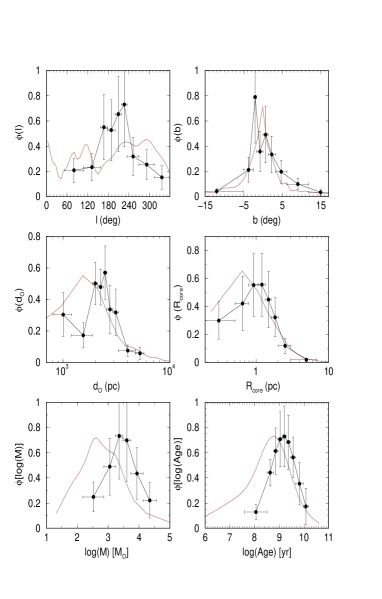
Our analysis compares distribution functions of the several parameters between both sets, as is seen from Fig. 2. Uncertainties in the parameters have been incorporated into the respective distribution function. And, since the samples differ significantly in the number of OCs, the distribution functions have been scaled to provide the best visual comparison between both. The top panels of Fig. 2 show how the OCs distribute with respect to the Galactic longitude (left) and latitude (right). Clearly, most of our sample corresponds to clusters directed towards the 2nd and 3rd Galactic quadrants. Regarding Galactic latitude, our sample tend to avoid the plane. In terms of distance from the Sun (middle-left), our sample is somewhat consistent with that of Kharchenko et al. (2013), particularly for distances in excess of 2 kpc. The same applies to the core radius (middle-right) for Rcore 1pc; below this threshold, our sample appears to contain a lower fraction of OCs than that in Kharchenko et al. (2013). Regarding mass, both distributions have a similar shape, but with a shift of 0.7 dex between the peaks, which suggests that our sample occupies the high-mass wing observed in Piskunov et al. (2008) distribution. The age distributions also have similar shapes, with our sample consisting essentially of clusters older than 100 Myrs. Thus, we can conclude that the 40 OCs dealt with here are a representative sub-sample of the Galactic OC population, with no systematic biases.
3 The 2MASS photometry and the field-star decontamination
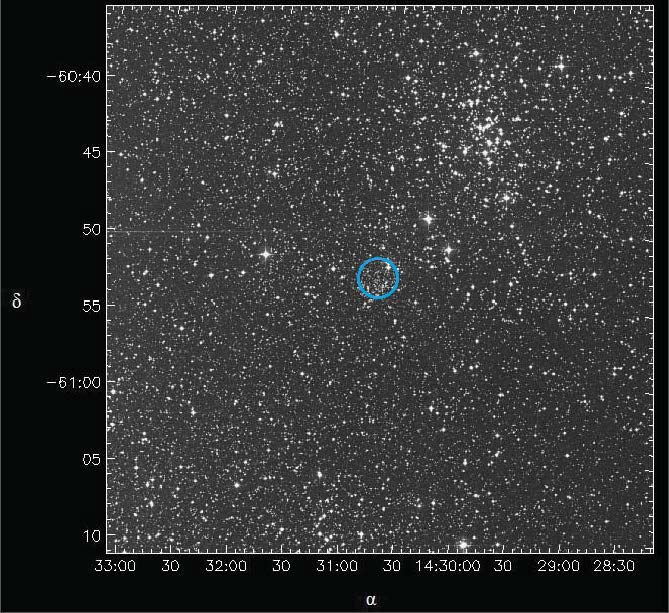
We have used JH photometry of 2MASS222The Two Micron All Sky Survey Catalogue, available at http://www.ipac.caltech.edu/2mass/releases/allsky/ to find the apparently cluster members of 40 OCs (Skrutskie et al., 2006). We used VizieR333http://vizier.u-strasbg.fr/viz-bin/VizieR?-source=II/246. to extract the near infrared (NIR) (J, H, and 2MASS) photometry for a large-area centered on each cluster, which is essential to build the RDPs with a high contrast relative to the background, and for a better field star decontamination. 2MASS provides an all-sky coverage with the spatial and photometric uniformity required for high star count statistics. For the photometric constraint, the 2MASS magnitude extractions have been restricted to stars with errors smaller than 0.2 mag in JH magnitudes. The extraction radii of 40 OCs have been chosen by visual inspection on the DSS-I image444Extracted from the Canadian Astronomy Data Centre (CADC), at http://ledas-www.star.le.ac.uk/DSSimage/, and taking into account the RDP, in the sense that the profile must become relatively stable in the outer region. As an example we show only the DSS-I image of Pismis 19 in Fig. 3.
The technique used here for determining the cluster members of the 40 OCs is known as the field star decontamination procedure coupled to the 2MASS JH photometry, and it was succesfully used by Bonatto & Bica (2007a, b, 2008) and more recently by Güneş et al. (2012), This decontamination procedure was applied to the 40 OCs discussed here. This technique samples photometric properties of the stars in a neighbour comparison field considered free of cluster stars to (statistically) remove the contamining field stars from the cluster stars with help of the colour magnitude diagrams (CMD).
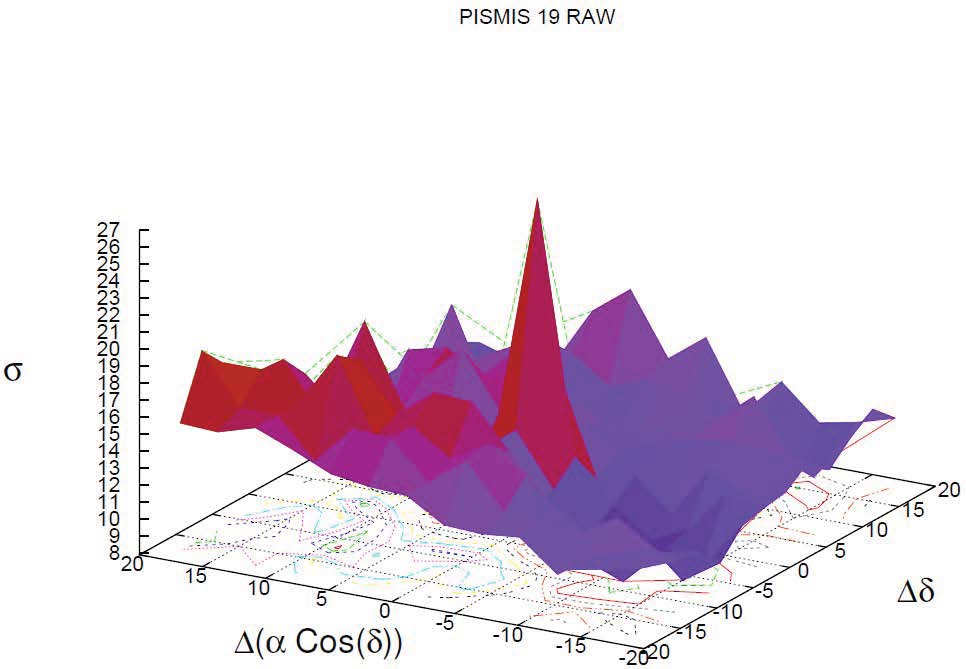
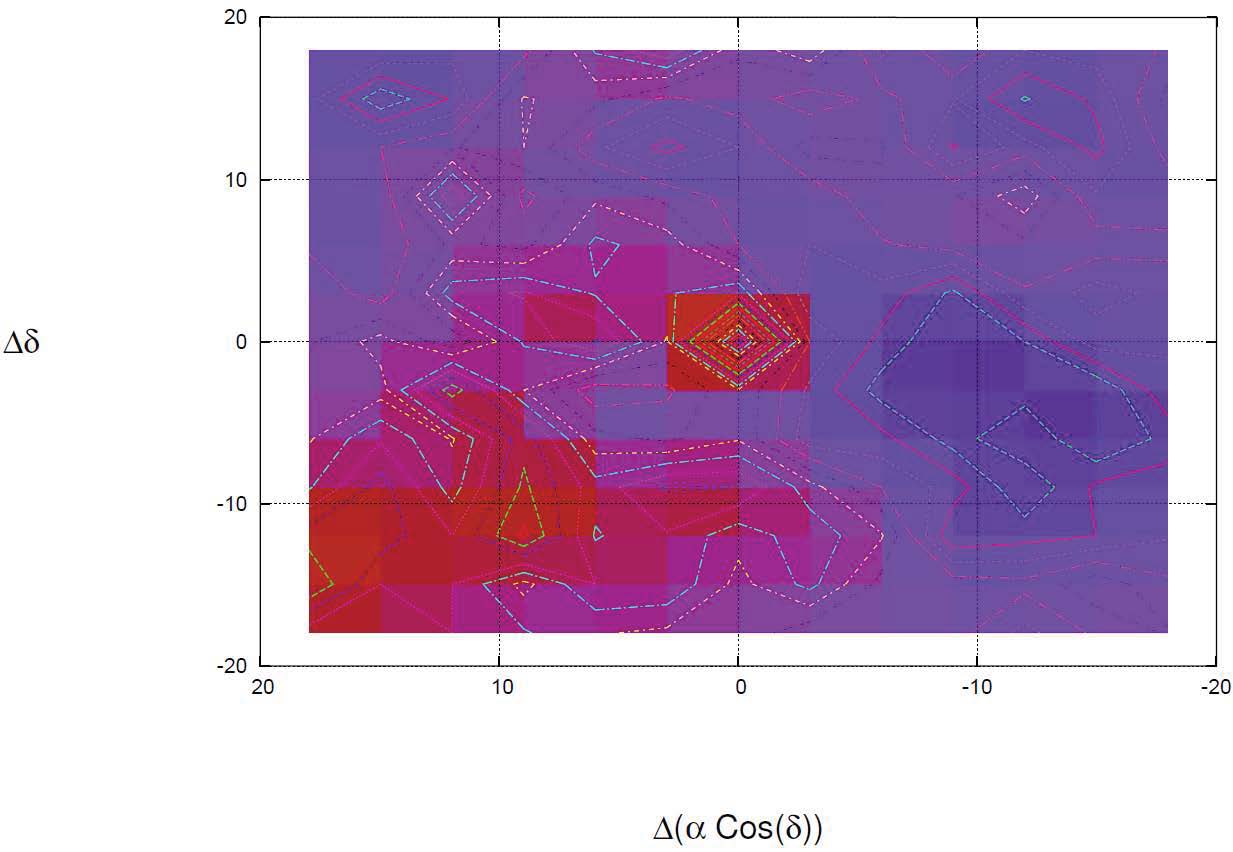
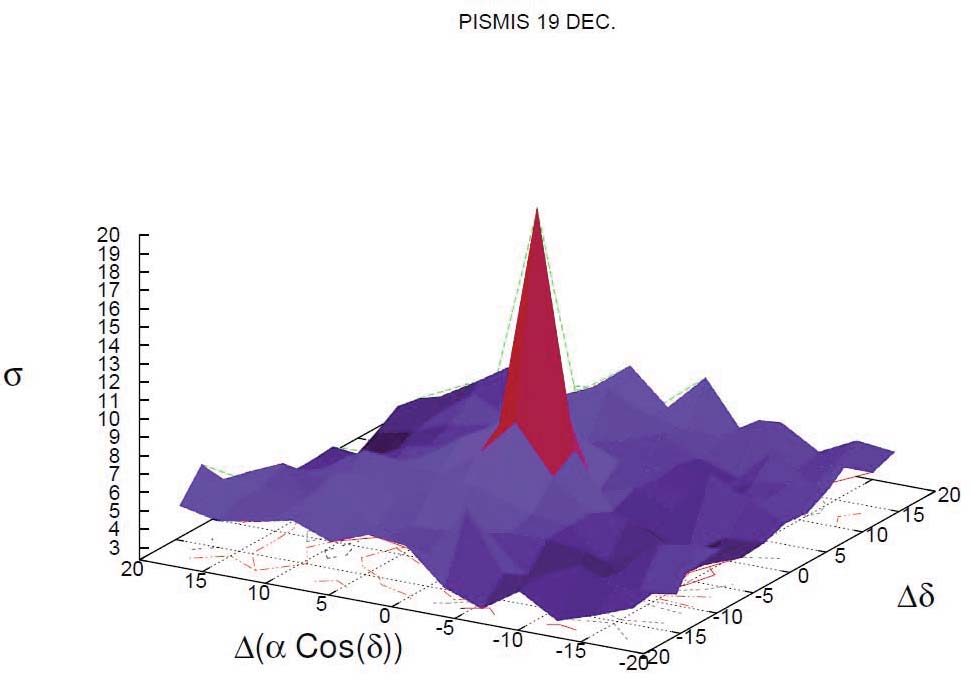
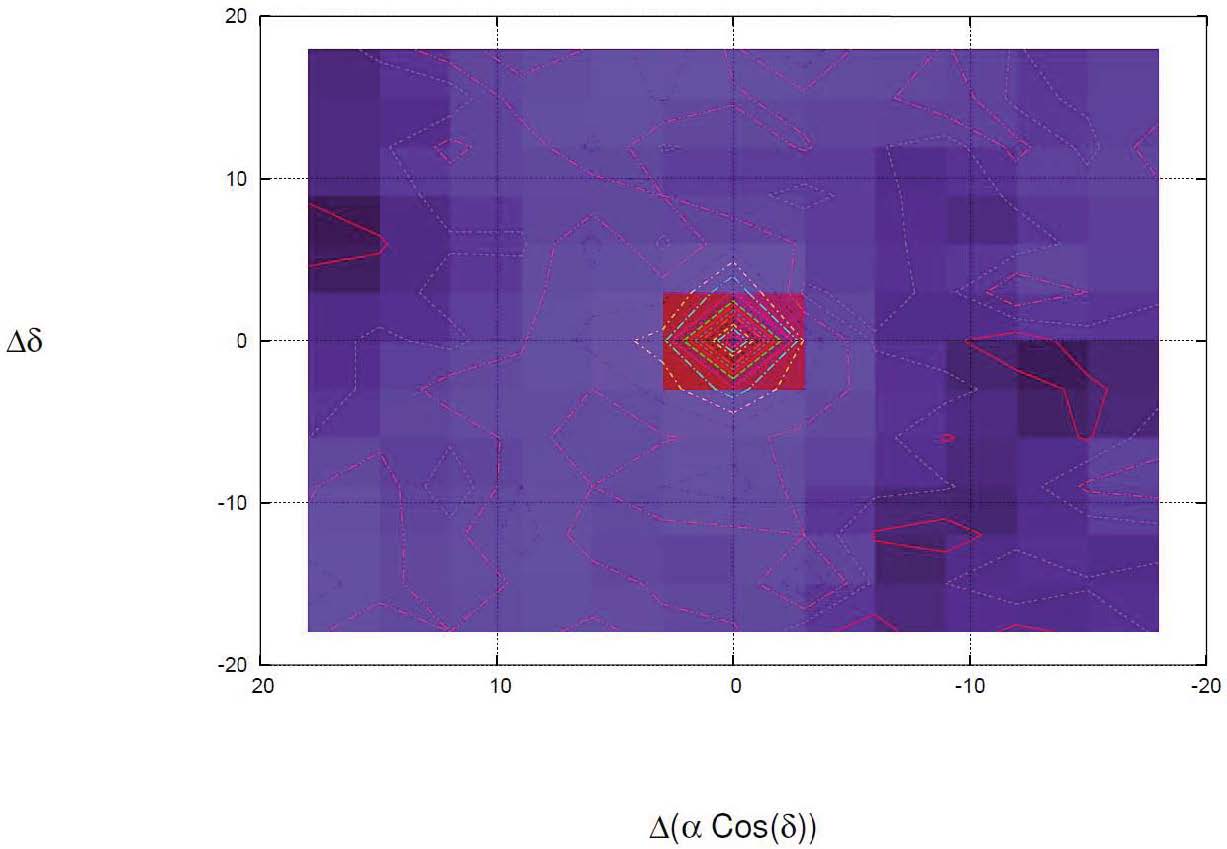
Firstly, the stellar surface densities and the surface isopleths of both the raw and decontamination data of 40 OCs, computed for a mesh size of and centred on the galactic coordinates of Table 2 (see Supplementary material section) If necessary, we have re-determined them in this work (see below). Here, isopleth is star density map. These maps have been used to maximise the contrast of the cluster against the background. In Figs. 4 and 5 we show the result for Pismis 19 as an example. The central stellar density excesses are significant in the decontamination surface-density distributions, as is seen in Fig. 5 for Pismis 19.
| Cluster | (2000) | (2000) | l | b | (2000) | (2000) | l | b |
|---|---|---|---|---|---|---|---|---|
| (h m s) | (o ′ ′′) | ( o ) | ( o ) | (h m s) | (o ′ ′′) | ( o ) | ( o ) | |
| NGC 436 | 01 15 58 | 58 48 42 | 126.11 | -3.91 | 01 15 58 | 58 48 42 | 126.11 | -3.91 |
| King 5 | 03 14 45 | 52 41 12 | 143.78 | -4.29 | 03 14 45 | 52 41 12 | 143.78 | -4.29 |
| NGC 1513 | 04 09 57 | 49 30 54 | 152.59 | -1.57 | 04 09 50 | 49 31 17 | 152.57 | -1.58 |
| Be 15 | 05 02 06 | 44 30 43 | 162.26 | 1.62 | 05 02 06 | 44 30 43 | 162.26 | 1.62 |
| NGC 1798 | 05 11 39 | 47 41 30 | 160.70 | 4.85 | 05 11 39 | 47 41 30 | 160.70 | 4.85 |
| Be 17 | 05 20 36 | 30 36 00 | 175.65 | -3.65 | 05 20 38 | 30 34 28 | 175.67 | -3.66 |
| NGC 1907 | 05 28 05 | 35 19 30 | 172.62 | 0.31 | 05 28 09 | 35 18 20 | 172.64 | 0.31 |
| NGC 2112 | 05 53 45 | 00 24 36 | 205.87 | -12.62 | 05 53 51 | 00 25 44 | 205.87 | -12.58 |
| Koposov 12 | 06 00 56 | 35 16 36 | 176.16 | 6.00 | 06 00 56 | 35 16 36 | 176.16 | 6.00 |
| NGC 2158 | 06 07 25 | 24 05 48 | 186.63 | 1.78 | 06 07 30 | 24 05 50 | 186.64 | 1.80 |
| Koposov 53 | 06 08 56 | 26 15 49 | 184.90 | 3.13 | 06 08 56 | 26 15 49 | 184.90 | 3.13 |
| NGC 2194 | 06 13 45 | 12 48 24 | 197.25 | -2.35 | 06 13 45 | 12 48 24 | 197.25 | -2.35 |
| NGC 2192 | 06 15 17 | 39 51 18 | 173.42 | 10.65 | 06 15 22 | 39 51 06 | 173.42 | 10.67 |
| NGC 2243 | 06 29 34 | -31 17 00 | 239.48 | -18.01 | 06 29 34 | -31 17 00 | 239.48 | -18.01 |
| Trumpler 5 | 06 36 42 | 09 26 00 | 202.86 | 1.05 | 06 36 36 | 09 25 21 | 202.86 | 1.02 |
| Col 110 | 06 38 24 | 02 01 00 | 209.65 | -1.98 | 06 38 35 | 02 01 30 | 209.66 | -1.93 |
| NGC 2262 | 06 39 38 | 01 08 36 | 210.57 | -2.10 | 06 39 38 | 01 08 36 | 210.57 | -2.10 |
| NGC 2286 | 06 47 40 | -03 08 54 | 215.31 | -2.27 | 06 47 43 | -03 10 20 | 215.33 | -2.27 |
| NGC 2309 | 06 56 03 | -07 10 30 | 219.84 | -2.24 | 06 56 02 | -07 11 05 | 219.85 | -2.25 |
| Tombaugh 2 | 07 03 05 | -20 49 00 | 232.83 | -6.88 | 07 03 05 | -20 49 00 | 232.83 | -6.88 |
| Be 36 | 07 16 06 | -13 06 00 | 227.38 | -0.59 | 07 16 24 | -13 11 23 | 227.49 | -0.56 |
| Haffner 8 | 07 23 24 | -12 20 00 | 227.53 | 1.34 | 07 23 09 | -12 16 12 | 227.45 | 1.32 |
| Mel 71 | 07 37 30 | -12 04 00 | 228.95 | 4.50 | 07 37 30 | -12 04 00 | 228.95 | 4.50 |
| NGC 2425 | 07 38 22 | -14 52 54 | 231.52 | 3.31 | 07 38 22 | -14 52 54 | 231.52 | 3.31 |
| NGC 2506 | 08 00 01 | -10 46 12 | 230.56 | 9.93 | 07 59 59 | -10 45 28 | 230.55 | 9.93 |
| Pismis 3 | 08 31 22 | -38 39 00 | 257.86 | 0.50 | 08 31 16 | -38 39 02 | 257.85 | 0.48 |
| NGC 2660 | 08 42 38 | -47 12 00 | 265.93 | -3.01 | 08 42 38 | -47 12 00 | 265.93 | -3.01 |
| NGC 3680 | 11 25 38 | -43 14 36 | 286.76 | 16.92 | 11 25 35 | -43 15 11 | 286.76 | 16.91 |
| Ru 96 | 11 50 38 | -62 08 23 | 295.89 | -0.10 | 11 50 37 | -62 09 04 | 295.89 | -0.11 |
| Ru 105 | 12 34 15 | -61 34 11 | 300.88 | 1.24 | 12 34 12 | -61 33 00 | 300.88 | 1.25 |
| Trumpler 20 | 12 39 34 | -60 37 00 | 301.48 | 2.22 | 12 39 34 | -60 37 00 | 301.48 | 2.22 |
| Pismis 19 | 14 30 40 | -60 53 00 | 314.71 | -0.30 | 14 30 40 | -60 53 00 | 314.71 | -0.30 |
| NGC 6134 | 16 27 46 | -49 09 06 | 334.92 | -0.20 | 16 27 46 | -49 09 06 | 334.92 | -0.20 |
| IC 4651 | 17 24 49 | -49 56 00 | 340.09 | -7.91 | 17 24 46 | -49 55 06 | 340.10 | -7.89 |
| NGC 6802 | 19 30 35 | 20 15 42 | 55.33 | 0.92 | 19 30 33 | 20 15 48 | 55.32 | 0.92 |
| NGC 6819 | 19 41 18 | 40 11 12 | 73.98 | 8.48 | 19 41 18 | 40 11 12 | 73.98 | 8.48 |
| Be 89 | 20 24 36 | 46 03 00 | 83.16 | 4.82 | 20 24 30 | 46 02 53 | 83.15 | 4.84 |
| NGC 6939 | 20 31 30 | 60 39 42 | 95.90 | 12.30 | 20 31 30 | 60 39 42 | 95.90 | 12.30 |
| NGC 7142 | 21 45 09 | 65 46 30 | 105.35 | 9.48 | 21 45 12 | 65 47 43 | 105.36 | 9.50 |
| NGC 7789 | 23 57 24 | 56 42 30 | 115.53 | -5.39 | 23 57 24 | 56 42 30 | 115.53 | -5.39 |
The stellar radial density profiles (RDP) were derived from the isopleth surfaces of each cluster, the coordinates were checked and the cluster radii were determined (e.g. Table 4). The residual background level of each RDP corresponds to the average number of CM-filtered stars measured in the comparison field. A wide external ring centered in the cluster (Col. 11 of Tables 4 and S4) has been considered to eliminate field stars of the 40 OCs. Stars within the cluster radii have been considered to be probable members.
The stellar radial density profile (RDP) of each cluster, built based on the JH photometry extracted with the WEBDA555www.univie.ac.at/WEBDA-Mermilliod & Paunzen (2003) coordinates are displayed in Table 2 and have been computed to check cluster centering. In some cases the RDP built with the original cluster coordinates presented a dip at the center. Then, new central coordinates are searched after field star decontamination to maximise the star counts in the innermost RDP bin. From these RDPs, the cluster radii of 40 OCs are determined (Table 4). The stellar RDP is the projected number of stars per area around the cluster centre. To avoid oversampling near the centre and undersampling for large radii, the RDPs are built by counting stars in concentric rings of increasing width with distance to the centre. The number and width of rings are optimised so that the resulting RDPs have adequate spatial resolution with moderate Poission errors. The residual background level of each RDP corresponds to the average number of CM-filtered stars measured in the comparison field.
As Camargo et al. (2010) noted, RDPs of OCs built based on the WEBDA coordinates usually show a dip in the inner RDP region when a mismatch between the ”true” and catalogue coordinates exists. For this reason, new central coordinates of these clusters have been searched to maximise the star counts at the innermost RDP bin. Then, the 2MASS photometry was extracted again, but now centered on the optimized cluster coordinates. As a representative, the optimised central coordinate of Pismis 19 is displayed in Fig. 3 as small circle, and given in the right section of Table 2.
To have the intrinsic morphology of the clusters in the CMD, as explained above, the statistical field star decontamination procedure of Bonatto & Bica (2007a) is used. This procedure is based on the relative stars densities per sky area in a cluster region and on a neighboring offset field. It divides the full range of magnitudes and colours of a CMD into the cell dimensions of , and . These dimensions are adequate to allow for sufficient star counts in individual cells and preserve the intrinsic morphology of the evolutionary sequences. Bonatto & Bica (2007a) showed that the field star decontamination procedure with 2MASS JH photometry is efficient isolating those stars with a high probability of being cluster members. More details on the algorithm can be found in Bonatto & Bica (2007a, b), Bonatto & Bica (2009a, b, c), and Camargo et al. (2010).
By following the field decontamination technique which is briefly explained above,the probable cluster members of the 40 OCs have been identified for further analysis.
| Cluster | Z | E(J-H) | E(B-V) | Age(Gyr) | (m-M)j | d(kpc) | RGC(kpc) |
|---|---|---|---|---|---|---|---|
| NGC 436 | 0.019 | 0.130.03 | 0.420.10 | 0.40.1 | 12.540.31 | 3.220.46 | 9.480.28 |
| King 5 | 0.0105 | 0.260.05 | 0.830.16 | 1.00.2 | 11.530.24 | 2.030.23 | 8.930.18 |
| NGC 1513 | 0.019 | 0.230.02 | 0.740.06 | 0.10.02 | 10.370.28 | 1.180.15 | 8.290.13 |
| Be 15 | 0.019 | 0.270.03 | 0.860.10 | 0.50.1 | 12.450.31 | 3.100.44 | 10.210.42 |
| NGC 1798 | 0.0105 | 0.160.04 | 0.510.13 | 1.50.3 | 13.510.26 | 5.030.59 | 12.070.55 |
| Be 17 | 0.006 | 0.260.04 | 0.830.13 | 5.00.5 | 11.930.29 | 2.430.33 | 9.650.33 |
| NGC 1907 | 0.019 | 0.180.03 | 0.580.10 | 0.40.1 | 11.450.26 | 1.950.24 | 9.160.23 |
| NGC 2112 | 0.019 | 0.200.04 | 0.640.13 | 2.00.3 | 10.150.23 | 1.070.11 | 8.180.10 |
| Koposov 12 | 0.0105 | 0.070.02 | 0.220.06 | 1.80.2 | 11.560.18 | 2.050.17 | 9.260.17 |
| NGC 2158 | 0.019 | 0.050.01 | 0.160.03 | 2.50.3 | 13.210.10 | 4.390.21 | 11.590.21 |
| Koposov 53 | 0.019 | 0.010.00 | 0.030.02 | 1.00.1 | 13.050.18 | 4.080.34 | 11.280.34 |
| NGC 2194 | 0.019 | 0.130.04 | 0.420.13 | 0.80.2 | 11.870.27 | 2.370.30 | 9.510.28 |
| NGC 2192 | 0.019 | 0.010.00 | 0.030.00 | 1.30.1 | 13.120.15 | 4.210.29 | 11.370.28 |
| NGC 2243 | 0.0105 | 0.010.00 | 0.030.00 | 2.00.2 | 13.370.12 | 4.730.26 | 10.360.14 |
| Trumpler 5 | 0.006 | 0.240.05 | 0.770.16 | 3.00.3 | 12.190.29 | 2.740.36 | 9.800.33 |
| Col 110 | 0.019 | 0.060.01 | 0.190.03 | 3.00.2 | 11.930.15 | 2.440.17 | 9.410.15 |
| NGC 2262 | 0.0105 | 0.110.01 | 0.350.03 | 1.30.1 | 12.360.30 | 2.960.41 | 9.880.35 |
| NGC 2286 | 0.019 | 0.030.00 | 0.100.02 | 1.00.2 | 11.820.30 | 2.310.32 | 9.200.26 |
| NGC 2309 | 0.019 | 0.160.02 | 0.510.06 | 0.50.1 | 12.410.21 | 3.030.29 | 9.740.22 |
| Tombaugh 2 | 0.019 | 0.350.05 | 1.120.16 | 3.00.3 | 10.430.24 | 1.220.14 | 8.010.08 |
| Be 36 | 0.019 | 0.120.02 | 0.380.06 | 3.01.0 | 13.670.16 | 5.420.40 | 11.590.27 |
| Haffner 8 | 0.006 | 0.060.02 | 0.190.06 | 1.00.1 | 11.980.16 | 2.490.18 | 9.090.12 |
| Mel 71 | 0.019 | 0.010.00 | 0.030.02 | 1.50.2 | 11.540.15 | 2.030.14 | 8.690.09 |
| NGC 2425 | 0.019 | 0.100.02 | 0.320.06 | 3.20.5 | 12.270.26 | 2.850.34 | 9.260.21 |
| NGC 2506 | 0.006 | 0.030.01 | 0.100.03 | 2.00.3 | 12.270.20 | 2.840.26 | 9.270.17 |
| Pismis 3 | 0.006 | 0.330.02 | 1.060.06 | 3.20.2 | 11.190.11 | 1.730.09 | 7.770.03 |
| NGC 2660 | 0.019 | 0.130.03 | 0.420.10 | 1.50.3 | 11.890.17 | 2.390.19 | 7.760.06 |
| NGC 3680 | 0.019 | 0.050.01 | 0.160.03 | 1.50.2 | 10.160.10 | 1.080.05 | 7.000.02 |
| Ru 96 | 0.019 | 0.070.01 | 0.220.03 | 1.00.1 | 12.010.25 | 2.520.29 | 6.530.15 |
| Ru 105 | 0.019 | 0.050.01 | 0.160.03 | 1.00.4 | 11.560.20 | 2.050.19 | 6.410.10 |
| Trumpler 20 | 0.019 | 0.100.03 | 0.320.10 | 1.50.5 | 12.520.31 | 3.200.46 | 6.190.27 |
| Pismis 19 | 0.019 | 0.410.03 | 1.310.10 | 0.80.1 | 11.420.38 | 1.920.34 | 6.020.24 |
| NGC 6134 | 0.019 | 0.100.01 | 0.320.03 | 1.50.1 | 10.220.12 | 1.110.06 | 6.230.06 |
| IC 4651 | 0.019 | 0.020.00 | 0.060.02 | 2.50.3 | 9.640.20 | 0.850.08 | 6.440.07 |
| NGC 6802 | 0.019 | 0.230.03 | 0.740.10 | 0.90.1 | 11.770.31 | 2.250.32 | 6.220.19 |
| NGC 6819 | 0.019 | 0.020.00 | 0.060.02 | 2.50.5 | 11.840.15 | 2.340.16 | 6.960.06 |
| Be 89 | 0.019 | 0.230.02 | 0.740.06 | 2.00.5 | 12.370.21 | 2.970.28 | 7.470.11 |
| NGC 6939 | 0.019 | 0.120.03 | 0.380.10 | 2.00.3 | 11.270.31 | 1.790.26 | 7.610.06 |
| NGC 7142 | 0.019 | 0.130.03 | 0.420.10 | 2.50.3 | 12.040.22 | 2.560.25 | 8.270.10 |
| NGC 7789 | 0.0105 | 0.080.02 | 0.260.06 | 1.80.2 | 11.230.21 | 1.760.17 | 8.130.08 |
4 Astrophysical parameters
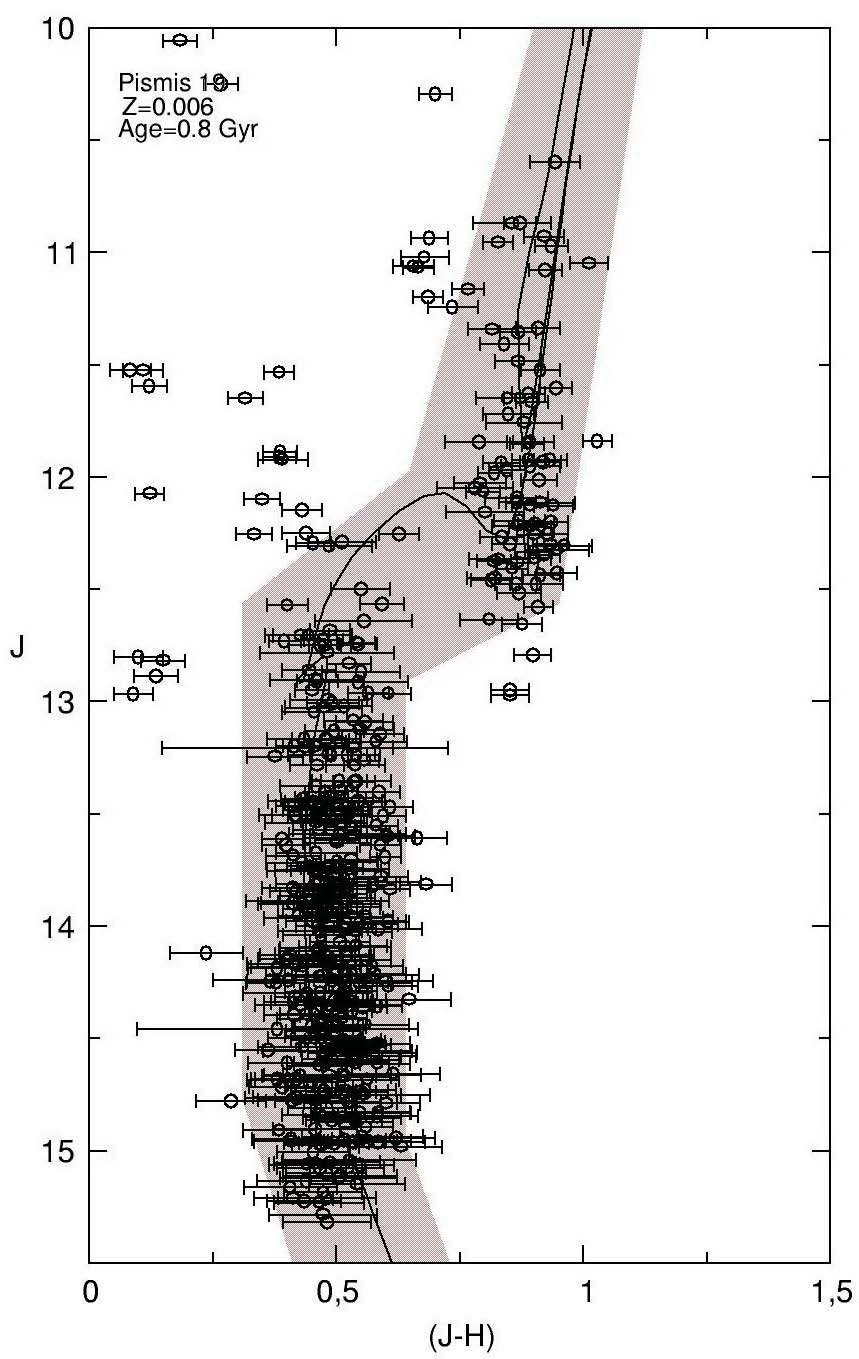
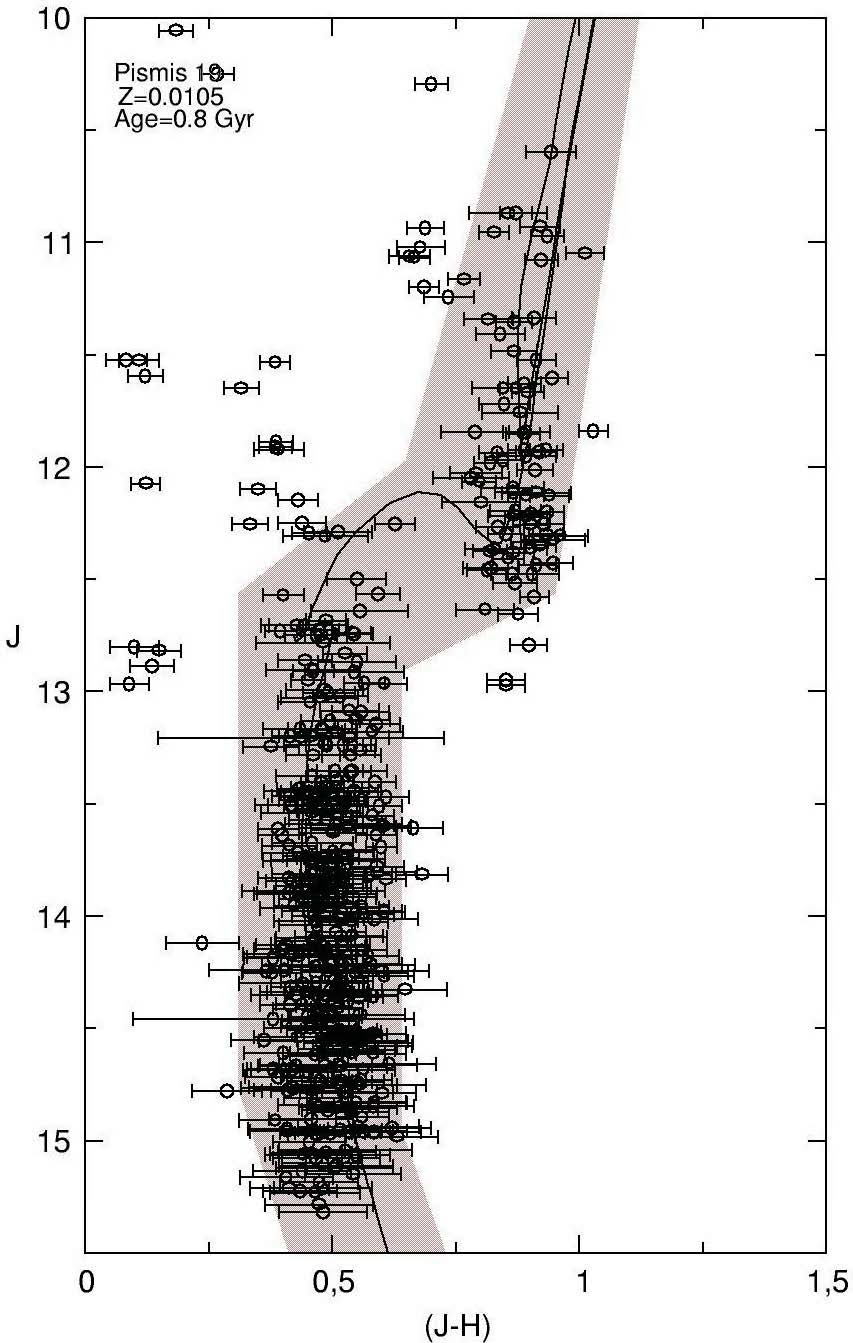
We have derived the fundamental parameters of 40 OCs using the decontaminated CMDs (see Figs. S5-S9 in the supplementary material) eye-fitted with Padova isochrones (Marigo et al., 2008, hereafter M08). Since the spectroscopic metal abundances [Fe/H]spec are only available for 21 (Col. 7, Table 4) out of 40 OCs, we have considered the abundances of ([Fe/H]=0), ([Fe/H]=0.25), and ([Fe/H]=0.50), respectively. In the sense OCs need to be uniformly and homogeneously analysed. M08 isochrones for three Z abundances were fitted to the CMDs of each of the 40 OCs. The most appropriate fit solution on the CMDs has been made by eye. Accordingly, the M08 isochrones of for 29 OCs, for six OCs, and for five OCs, respectively, have provided us good fits for reddening, age and distance modulus. As an example, such CMDs have been displayed in Figs. 6(a)-(c) for Pismis 19, for three Z abundances. The shaded areas in the panels are the colour-magnitude filters which follow the distribution of the decontaminated star sequences in the CMDs, or stars comprised in the shaded area are considered probable members. These filters are wide enough to accommodate the colour distributions of main sequence and evolved stars of the clusters, allowing 1 photometric uncertainties. The fitted 0.8 Gyr isochrone of for Pismis 19 in panel (a) provides a good solution. As can be seen from Fig. 6(a), the M08 isochrone fits well the main sequence (MS), turnoff (TO) and Red Giant/Red Clump (RG/RC) regions on the CMD of Pismis 19. Due to the presence of binaries, the M08 isochrones have been shifted to the left and below of the main sequence in Figs. 6(a)(c), and all CMDs of the 40 OCs are presented in Figs. S5S9 as supplementary material. The reddening, distance modulus (i.e. distance), age and the appropriate abundances were derived this way for all 40 OCs of our sample. These astrophysical parameters together with their uncertainties are presented in Table 3.
However, the reddening is degenerate with the metallicity. For this, we have determined E(B-V), d (pc), Age (Gyr) of 21 OCs (Table 4) for three Z abundances. The E(B-V) and d (pc) values (Table 4) of three Z abundances are reasonably close to our original ones (Table 3) within the uncertainties. The age values (Col. 6, Table 4) derived from three Z values are the same. As stated by Bonatto & Bica (2009a), any metallicity for the range of would produce acceptable solutions for the astrophysical parameters, due to the filters of 2MASS.
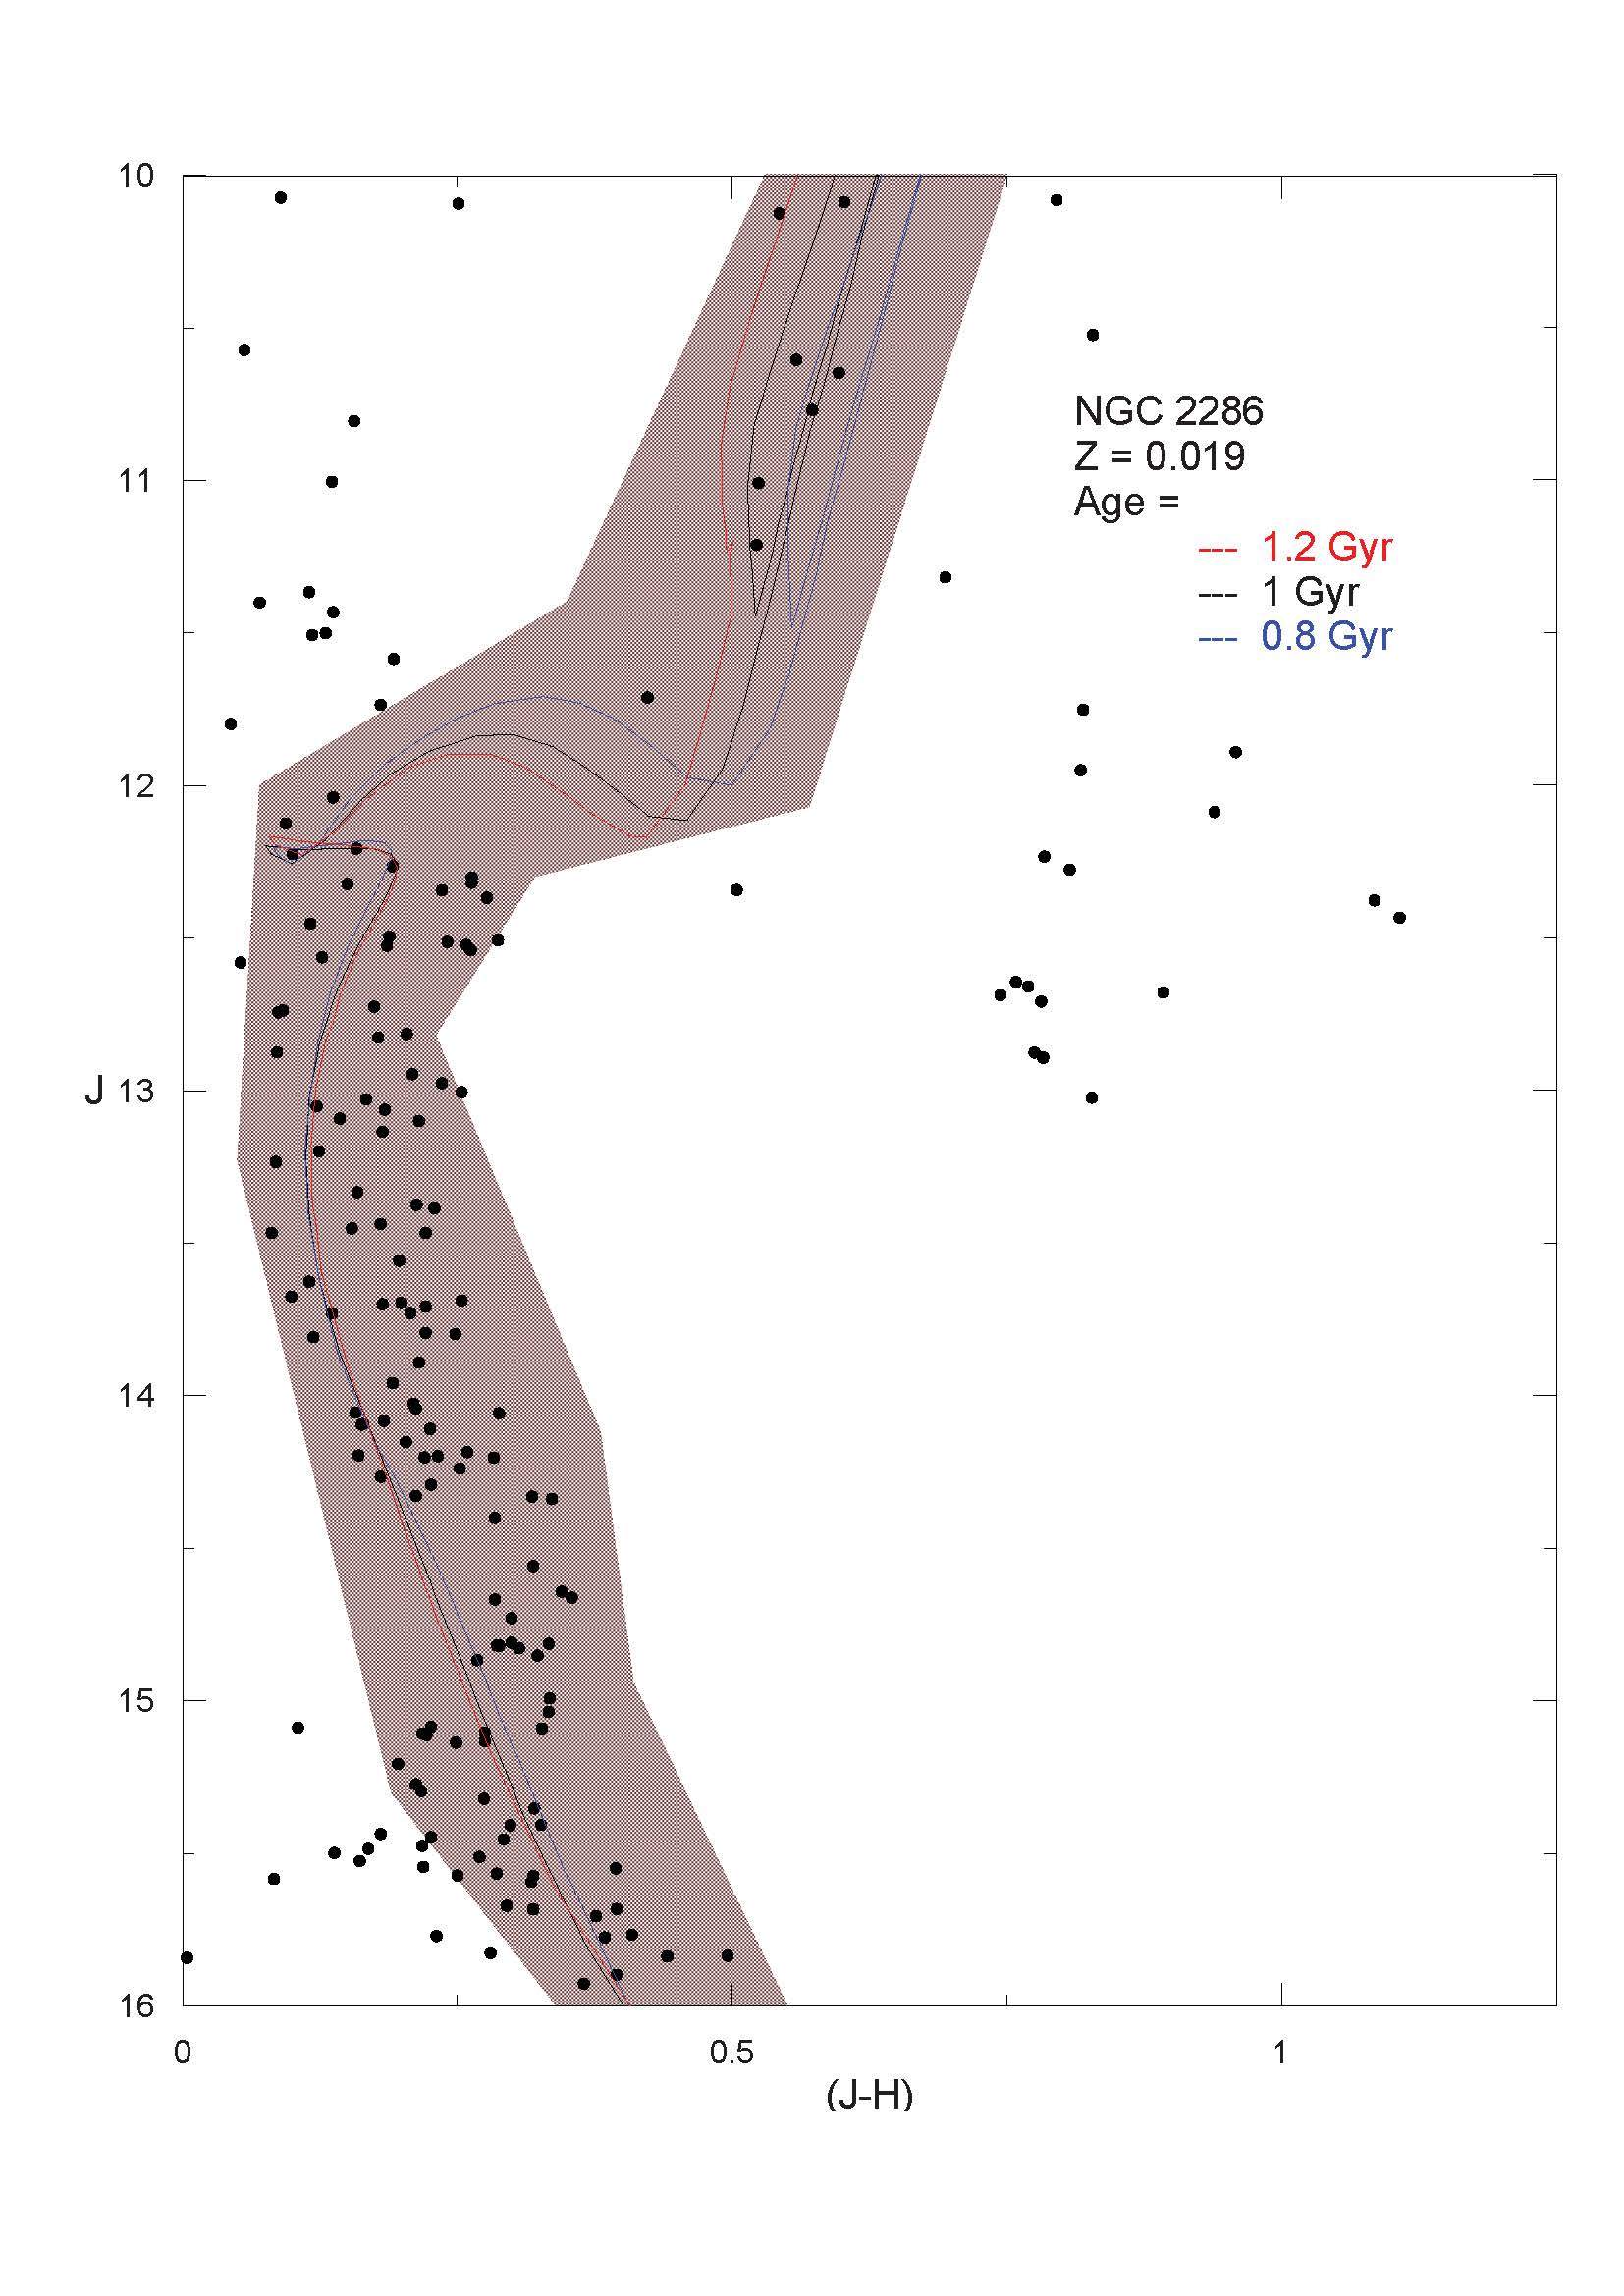
Our derived ages here are almost robust enough to allow inferences about cluster evolution. For this, NGC 2286 (Fig. 7) is presented as an example. The 0.8 Gyr (blue line), 1 Gyr (solid black line), and 1.2 Gyr (red line) isochrones of for NGC 2286 are fitted to CMD of the cluster. As is seen from Fig. 7, 10.2 Gyr isochrone (solid line) fit well the main sequence (MS), turnoff (TO) and Red Giant/Red Clump (RG/RC) regions on the CMD of the cluster. The uncertainties in our derived ages of 40 OCs are in the level of 0.020.5 Gyr (Table 3), except for Be 36 (1 Gyr).
JHK photometry is unsensitive to metallicity, in opposition to optical photometry, where the blue (B) and principally the ultraviolet (U) are sensitive to the photospheric metal lines, reaching its maximum blanketing effect by SpT F5. For later than SpT = G2 it becomes too fuzzy to disentagle it from the molecular lines. On the other hand, metallicity affects significantly the distance and the age of a cluster, i.e. the less Z is, the shorter the distance and larger the age.

| Cluster | Z | E(B-V) | [Fe/H]iso | d (kpc) | Age(Gyr) | [Fe/H]spec | Reference |
|---|---|---|---|---|---|---|---|
| Trumpler 5 | 0.019 | 0.540.13 | 3.130.39 | 3 | |||
| 0.0105 | 0.700.16 | 2.870.38 | 3 | ||||
| 0.006 | 0.770.16 | -0.50 | 2.740.36 | 3 | -0.36 | Carrera et al. 2007 | |
| NGC 2158 | 0.019 | 0.160.03 | 0 | 4.390.21 | 2.5 | -0.28 | Jacobson et al. 2011 |
| 0.0105 | 0.290.03 | 3.980.19 | 2.5 | ||||
| 0.006 | 0.380.03 | 3.750.18 | 2.5 | ||||
| Col 110 | 0.019 | 0.190.03 | 0 | 2.440.17 | 3 | -0.01 | Carrera et al. 2007 |
| 0.0105 | 0.290.06 | 2.290.17 | 3 | ||||
| 0.006 | 0.420.06 | 2.030.15 | 3 | ||||
| NGC6134 | 0.019 | 0.320.03 | 0 | 1.110.06 | 1.5 | 0.12 | Smiljanic et al.2009 |
| 0.0105 | 0.480.06 | 0.970.07 | 1.5 | ||||
| 0.006 | 0.640.10 | 0.850.07 | 1.5 | ||||
| NGC2425 | 0.019 | 0.320.06 | 0 | 2.850.34 | 3.2 | -0.15 | Jacobson et al. 2011 |
| 0.0105 | 0.420.10 | 2.740.33 | 3.2 | ||||
| 0.006 | 0.510.16 | 2.640.35 | 3.2 | ||||
| Trumpler 20 | 0.019 | 0.320.10 | 0 | 3.200.46 | 1.5 | 0.09 | Carraro et al. 2014 |
| 0.0105 | 0.480.10 | 2.800.40 | 1.5 | ||||
| 0.006 | 0.640.10 | 2.450.35 | 1.5 | ||||
| NGC 2112 | 0.019 | 0.640.13 | 0 | 1.070.11 | 2 | -0.10 | Brown et al. 1996 |
| 0.0105 | 0.770.06 | 0.870.12 | 2 | ||||
| 0.006 | 0.900.06 | 0.770.09 | 2 | ||||
| Mel 71 | 0.019 | 0.030.02 | 0 | 2.030.14 | 1.5 | -0.30 | Brown et al. 1996 |
| 0.0105 | 0.160.06 | 1.930.14 | 1.5 | ||||
| 0.006 | 0.290.06 | 1.920.17 | 1.5 | ||||
| NGC 7789 | 0.019 | 0.190.03 | 1.810.17 | 1.8 | |||
| 0.0105 | 0.260.06 | -0.25 | 1.760.17 | 1.8 | 0.02 | Jacobson et al. 2011 | |
| 0.006 | 0.320.06 | 1.720.19 | 1.8 | ||||
| NGC 3680 | 0.019 | 0.160.03 | 0 | 1.080.05 | 1.5 | 0.04 | Smiljanic et al.2009 |
| 0.0105 | 0.320.06 | 0.950.06 | 1.5 | ||||
| 0.006 | 0.480.10 | 0.850.07 | 1.5 | ||||
| IC 4651 | 0.019 | 0.060.02 | 0 | 0.850.08 | 2.5 | 0.10 | Pasquini et al. 2004 |
| 0.0105 | 0.160.03 | 0.780.08 | 2.5 | ||||
| 0.006 | 0.260.06 | 0.720.08 | 2.5 | ||||
| NGC 6819 | 0.019 | 0.060.02 | 0 | 2.340.16 | 2.5 | 0.09 | Bragaglia et al.2001 |
| 0.0105 | 0.160.03 | 2.150.18 | 2.5 | ||||
| 0.006 | 0.320.10 | 1.840.15 | 2.5 | ||||
| NGC 1798 | 0.019 | 0.320.06 | 5.690.54 | 1.5 | |||
| 0.0105 | 0.510.13 | -0.25 | 5.030.59 | 1.5 | -0.12 | Carrera 2012 | |
| 0.006 | 0.70.16 | 4.450.58 | 1.5 | ||||
| NGC 2243 | 0.019 | 0.0050.005 | 5.010.23 | 2 | |||
| 0.0105 | 0.030.005 | -0.25 | 4.730.26 | 2 | -0.48 | Gratton et al. 1994 | |
| 0.006 | 0.160.03 | 4.490.25 | 2 | ||||
| NGC 6939 | 0.019 | 0.380.10 | 0 | 1.790.26 | 2 | 0 | Jacobson et al. 2007 |
| 0.0105 | 0.450.13 | 1.640.26 | 2 | ||||
| 0.006 | 0.580.19 | 1.500.26 | 2 | ||||
| NGC 7142 | 0.019 | 0.420.10 | 0 | 2.560.25 | 2.5 | 0.08 | Jacobson et al. 2008 |
| 0.0105 | 0.540.13 | 2.320.26 | 2.5 | ||||
| 0.006 | 0.670.16 | 2.110.25 | 2.5 | ||||
| NGC 2194 | 0.019 | 0.420.13 | 0 | 2.370.30 | 0.8 | -0.08 | Jacobson et al. 2011 |
| 0.0105 | 0.510.16 | 2.150.26 | 0.8 | ||||
| 0.006 | 0.610.16 | 1.970.24 | 0.8 | ||||
| NGC 2660 | 0.019 | 0.420.10 | 0 | 2.390.19 | 1.5 | 0.04 | Bragaglia et al.2008 |
| 0.0105 | 0.510.13 | 2.200.19 | 1.5 | ||||
| 0.006 | 0.670.16 | 1.970.21 | 1.5 | ||||
| Be 17 | 0.019 | 0.640.13 | 3.020.38 | 5 | |||
| 0.0105 | 0.740.13 | 2.710.40 | 5 | ||||
| 0.006 | 0.830.13 | -0.50 | 2.430.33 | 5 | -0.10 | Friel et al. 2005 | |
| Tombaugh 2 | 0.019 | 1.120.16 | 0 | 1.220.14 | 3 | -0.45 | Brown et al. 1996 |
| 0.0105 | 1.220.19 | 1.180.14 | 3 | ||||
| 0.006 | 1.310.19 | 1.130.18 | 3 | ||||
| NGC 2506 | 0.019 | 0.020.005 | 3.070.28 | 2 | |||
| 0.0105 | 0.060.03 | 2.940.27 | 2 | ||||
| 0.006 | 0.100.03 | -0.50 | 2.840.26 | 2 | -0.20 | Carretta et al. 2004 |
The reddenings (Col. 3 in Table 3) of the 40 OCs were derived from the CMD diagrams. These are converted to (Col. 4 in Table 3) with the extinction law , and (Dutra et al., 2002), assuming a constant total-to-selective absorption ratio . The distance moduli of the clusters have been derived and listed in Col. 6 of Table 3. The estimated heliocentric and its corresponding galactocentric (kpc) distances are given in Cols. 78, respectively. When estimating the distances, we adopted the galactocentric distance of the Sun as kpc of Bica et al. (2006b).
The errors in E(J-H), hence in colour excess E(B-V), distance moduli and ages, given in Table 3 have been estimated as follows:
-
1.
The uncertainties of E(J-H) were estimated moving the M08 isochrones up and down, back and forward and in direction of the reddening vector in the colour-magnitude diagram until a good fit with the observed MS, TO, the subgiant branch (SG), RG/RC sequences were achieved.
-
2.
The uncertainties of distance moduli in Table 3 stem to a lesser degree from the photometric errors and fitting the appropriate isochrone to the observational data points in the CMDs. A larger uncertainty, up to 2 mag in the distance moduli, originates by the assumption of the metallicity: for a larger Z the OCs are more distant and metal poor stars are nearer.
-
3.
For the uncertainties in the age estimates, see those of the distance moduli. Again, metal-rich stars are younger than the metal- poor ones.
The precision of the parameters depends on the scatter of the data points in the CMDs. The uncertainties of distance moduli in Table 3 stem from fitting the appropriate isochrone to the observation in the CMDs, by taking into the uncertainties of the photometric data. The uncertainties of distance moduli of 40 OCs are at the level of 0.100.31. The uncertainty of age is obtained from fitting the M08 isochrone with appropriate heavy element to the CMDs. In this regard, the uncertainty of the age depends on the uncertainties of E(J-H) and distance moduli of 40 OCs. The uncertainties of the ages of 40 OCs in Table 3 fall in the range of 0.021.0 Gyr.
The relations of – versus Galactic longitude and – versus Galactic latitude as a function of the cluster distances, are displayed in Figs. 8(a) and (b), respectively. In Figs. 8 open and filled circles show the kpc and kpc subsets, respectively. The reddenings of the OCs in the anticentre directions have . From panel (a), the bulk of the 40 clusters lies within and . There are two OCs with in the Galactic centre directions.

The reddenings of 40 OCs have been compared to those of the dust maps of (Schlegel et al., 1998, hereafter SFD), which are based on the COBE/DIRBE and IRAS/ISSA maps. These maps take into account the dust absorption all the way to infinity.
The relations of – versus –, and –versus – of the 40 OCs are displayed in Figs. 9(a) and (b), respectively. As is seen from Fig. 9(a), the values of – are at the level of –. For seven clusters, differences in between both reddenings are , while the differences of 33 OCs are larger than 0.10 mag. The equation given by Bonifacio et al. (2000) has been adopted to correct the SFD reddening estimates. Then the final reddening, –, for a given star is reduced compared to the total reddening –by a factor , given by Bahcall & Soneira (1980), where , , and are the Galactic latitude (Col. 9 of Table 2), the distance from the observer to the object (Col. 7 of Table 3), and the scale height of the dust layer in the Galaxy, respectively. The value of pc is adopted (Bonifacio et al., 2000). The reduced final reddenings have been compared with the ones of 40 OCs in Fig. 9(b). The reduced – values fall in the range of .

There are significant differences for 27 OCs between both – color excess values. For the rest, the – values of 13 OCs are quite close to the ones of SFD. Note that SFD maps are not reliable at regions due to contaminating sources and uncertainties in the dust temperatures (Gonzalez et al., 2012). Therefore, the SFD values resulted from line-of-sight integral through the Milky Way and with low spatial resolution, it is quite a normal to have different reddening values for these relatively close ( kpc) star clusters.
| Cluster | (1′) pc | (*pc-2) | (*pc-2) | Rcore(pc) | RRDP (pc) | (*’-2) | (*’-2) | Rcore (′) | RRDP (′) | R(′) | C.C. |
|---|---|---|---|---|---|---|---|---|---|---|---|
| NGC 436 | 0.94 | 10.942.97 | 0.710.03 | 1.040.20 | 6.970.26 | 9.602.60 | 0.620.03 | 1.110.22 | 7.440.27 | 22-32 | 0.93 |
| King 5 | 0.59 | 24.795.28 | 2.700.06 | 0.950.15 | 5.620.18 | 8.651.84 | 0.940.02 | 1.600.25 | 9.520.30 | 20-30 | 0.94 |
| NGC 1513 | 0.34 | 30.604.73 | 17.440.44 | 1.650.26 | 6.510.20 | 3.610.55 | 2.050.05 | 4.800.75 | 16.990.58 | 42-57 | 0.94 |
| Be 15 | 0.90 | 25.7011.33 | 0.970.02 | 0.350.10 | 5.040.30 | 20.899.20 | 0.790.02 | 0.390.11 | 5.590.33 | 30-40 | 0.86 |
| NGC 1798 | 1.46 | 6.641.90 | 0.580.01 | 1.100.22 | 9.110.48 | 18.205.22 | 1.590.03 | 0.670.13 | 5.510.29 | 50-60 | 0.92 |
| Be 17 | 0.71 | 7.251.38 | 3.260.10 | 2.100.39 | 5.290.20 | 3.620.69 | 1.630.05 | 2.980.55 | 7.480.29 | 42-52 | 0.94 |
| NGC 1907 | 0.57 | 17.034.16 | 4.320.19 | 1.280.27 | 4.260.16 | 5.471.34 | 1.390.06 | 2.260.47 | 7.500.28 | 50-60 | 0.91 |
| NGC 2112 | 0.31 | 24.693.51 | 6.960.21 | 1.640.21 | 5.920.19 | 2.390.34 | 0.670.02 | 5.280.68 | 19.010.61 | 50-60 | 0.95 |
| Koposov 12 | 0.60 | 8.963.74 | 1.270.05 | 0.870.27 | 3.820.20 | 3.181.33 | 0.450.02 | 1.460.46 | 6.410.33 | 15-25 | 0.83 |
| NGC 2158 | 1.27 | 28.854.67 | 1.450.06 | 1.740.20 | 14.030.71 | 47.057.61 | 2.370.10 | 1.360.16 | 10.990.56 | 45-60 | 0.97 |
| Koposov 53 | 1.18 | 7.120.23 | 0.480.05 | 0.660.04 | 4.180.33 | 10.040.33 | 0.670.08 | 0.560.03 | 3.520.28 | 25-35 | 0.99 |
| NGC 2194 | 0.69 | 21.003.31 | 3.300.15 | 1.660.22 | 6.550.21 | 9.981.58 | 1.570.07 | 2.410.32 | 9.50.31 | 40-50 | 0.96 |
| NGC 2192 | 1.22 | 5.261.59 | 0.410.01 | 1.110.24 | 5.470.34 | 7.872.42 | 0.620.02 | 0.910.19 | 4.470.28 | 45-55 | 0.90 |
| NGC 2243 | 1.38 | 13.354.18 | 0.220.01 | 0.890.18 | 12.940.37 | 25.287.95 | 0.420.02 | 0.650.13 | 9.400.27 | 20-30 | 0.93 |
| Trumpler 5 | 0.79 | 13.621.72 | 3.370.09 | 3.860.43 | 15.180.47 | 8.651.09 | 2.140.06 | 4.850.54 | 19.050.58 | 27-37 | 0.97 |
| Col 110 | 0.71 | 5.320.51 | 2.680.05 | 6.250.63 | 12.120.40 | 2.680.26 | 1.350.02 | 8.790.88 | 17.070.57 | 40-50 | 0.97 |
| NGC 2262 | 0.86 | 22.035.17 | 1.930.05 | 0.850.14 | 6.370.24 | 16.323.81 | 1.430.04 | 0.990.17 | 7.400.28 | 30-45 | 0.94 |
| NGC 2286 | 0.67 | 6.812.29 | 2.660.12 | 1.590.48 | 6.390.19 | 3.071.03 | 1.200.05 | 2.370.72 | 9.510.29 | 27-37 | 0.85 |
| NGC 2309 | 0.88 | 12.415.96 | 0.640.05 | 0.840.28 | 7.500.25 | 9.644.63 | 0.500.04 | 0.950.32 | 8.510.29 | 50-60 | 0.84 |
| Tombaugh 2 | 0.35 | 134.2983.62 | 3.670.25 | 0.170.07 | 1.920.11 | 16.9110.5 | 0.460.03 | 0.470.18 | 5.420.31 | 20-25 | 0.98 |
| Be 36 | 1.57 | 3.301.76 | 0.510.02 | 1.320.51 | 10.230.40 | 8.214.39 | 1.270.04 | 0.830.32 | 6.500.25 | 25-40 | 0.79 |
| Haffner 8 | 0.72 | 5.312.85 | 3.890.08 | 1.470.68 | 6.930.21 | 2.791.50 | 2.040.04 | 2.030.94 | 9.560.29 | 45-60 | 0.69 |
| Mel 71 | 0.59 | 22.613.97 | 4.390.09 | 1.270.18 | 5.000.17 | 7.891.39 | 1.530.03 | 2.160.30 | 8.460.29 | 45-60 | 0.95 |
| NGC 2425 | 0.83 | 11.002.04 | 2.280.04 | 1.160.17 | 5.430.22 | 7.551.41 | 1.570.03 | 1.400.20 | 6.540.26 | 42-47 | 0.95 |
| NGC 2506 | 0.82 | 18.563.13 | 1.070.04 | 1.650.20 | 10.760.48 | 12.672.14 | 0.730.03 | 2.000.24 | 13.020.58 | 40-50 | 0.96 |
| Pismis 3 | 0.50 | 26.092.91 | 6.530.11 | 2.100.20 | 8.580.29 | 6.610.74 | 1.650.03 | 4.170.40 | 17.050.57 | 37-47 | 0.98 |
| NGC 2660 | 0.69 | 90.4424.32 | 3.840.09 | 0.390.07 | 5.270.17 | 43.7111.74 | 1.860.04 | 0.550.10 | 7.580.25 | 25-35 | 0.94 |
| NGC 3680 | 0.31 | 19.377.61 | 1.840.05 | 0.470.13 | 2.980.10 | 1.900.75 | 0.180.005 | 1.490.41 | 9.490.32 | 40-50 | 0.85 |
| Ru 96 | 0.73 | 6.522.75 | 5.950.13 | 1.430.53 | 2.600.21 | 3.541.45 | 3.200.07 | 1.940.73 | 3.540.29 | 50-60 | 0.77 |
| Ru 105 | 0.56 | 2.631.81 | 1.520.05 | 1.350.78 | 3.830.21 | 0.930.64 | 0.540.02 | 2.271.30 | 6.420.34 | 47-57 | 0.64 |
| Trumpler 20 | 0.93 | 10.221.22 | 4.730.12 | 3.120.38 | 13.980.55 | 8.861.06 | 4.100.10 | 3.360.41 | 15.020.59 | 40-50 | 0.97 |
| Pismis 19 | 0.56 | 104.0615.47 | 13.680.18 | 0.540.06 | 6.160.33 | 32.464.82 | 4.270.05 | 0.960.10 | 11.030.59 | 47-57 | 0.97 |
| NGC 6134 | 0.32 | 72.1224.74 | 7.820.18 | 0.450.11 | 3.080.10 | 7.522.59 | 0.810.02 | 1.390.34 | 9.530.30 | 13-22 | 0.86 |
| IC 4651 | 0.25 | 38.577.88 | 12.500.99 | 1.020.22 | 2.350.08 | 2.360.48 | 0.760.06 | 4.130.91 | 9.490.31 | 50-60 | 0.92 |
| NGC 6802 | 0.65 | 34.489.18 | 7.900.27 | 1.030.18 | 4.240.18 | 14.723.63 | 3.380.12 | 1.580.28 | 6.490.38 | 45-60 | 0.92 |
| NGC 6819 | 0.68 | 38.224.18 | 3.970.08 | 1.500.12 | 12.920.40 | 17.151.95 | 1.840.04 | 2.200.18 | 18.980.59 | 40-50 | 0.98 |
| Be 89 | 0.88 | 7.021.35 | 3.800.12 | 2.750.53 | 7.480.26 | 5.421.04 | 2.900.09 | 3.100.60 | 8.500.30 | 15-20 | 0.93 |
| NGC 6939 | 0.52 | 33.065.19 | 3.350.17 | 1.160.15 | 4.920.18 | 8.961.41 | 0.910.05 | 2.240.28 | 9.460.28 | 35-45 | 0.97 |
| NGC 7142 | 0.74 | 10.151.87 | 1.720.10 | 1.980.32 | 11.190.44 | 5.631.04 | 0.950.05 | 2.650.43 | 15.020.59 | 50-60 | 0.94 |
| NGC 7789 | 0.51 | 31.232.22 | 3.880.04 | 2.320.13 | 26.880.74 | 8.180.58 | 1.020.01 | 4.520.25 | 52.51.44 | 55-70 | 0.99 |
5 Structural parameters
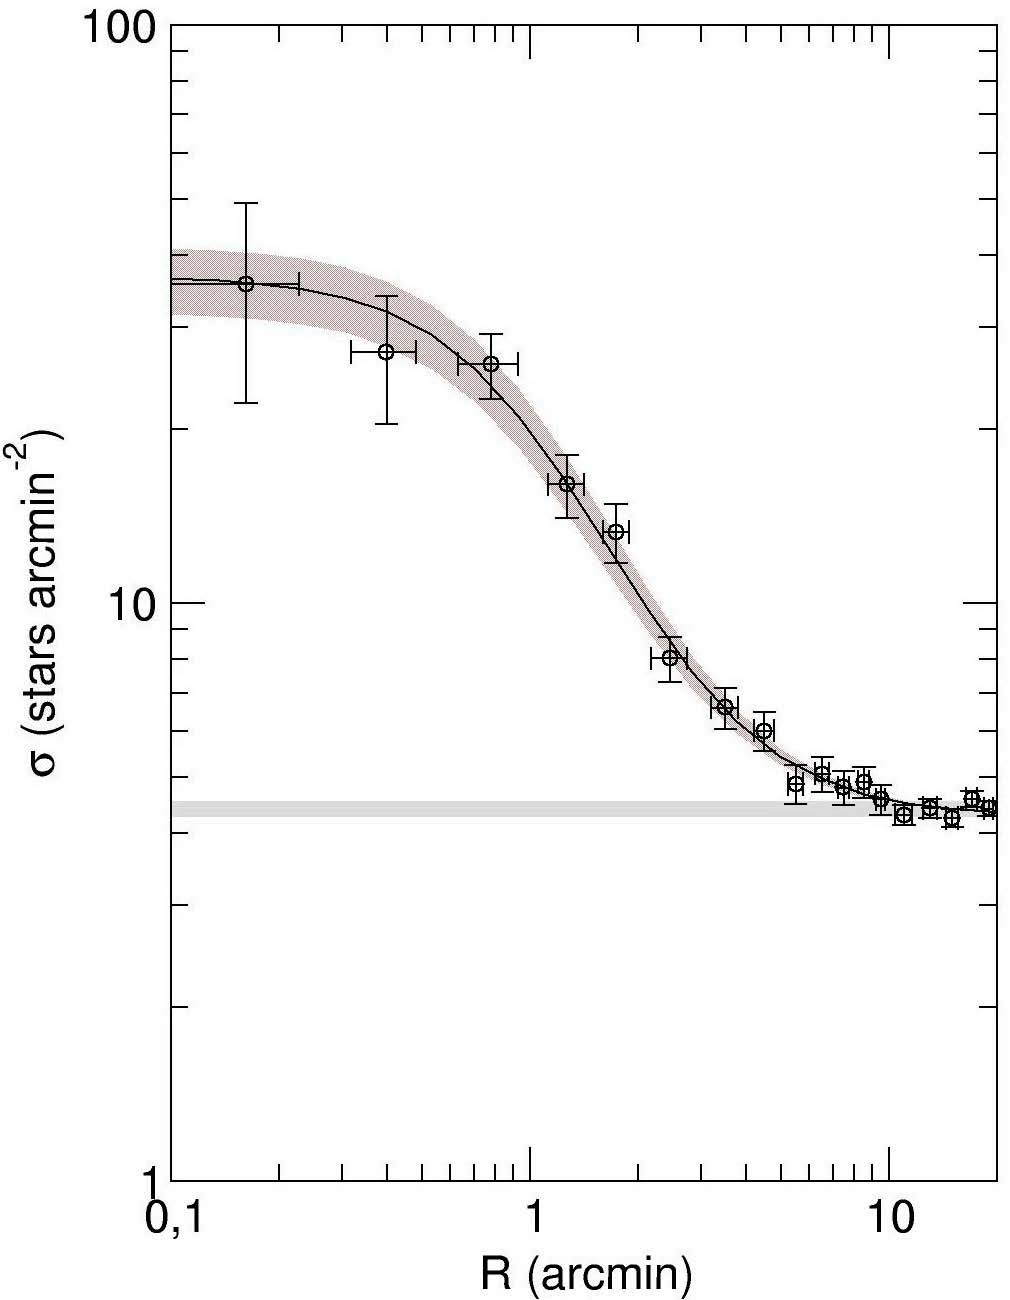
We derived the structural parameters of 40 OCs from the stellar radial density profiles (RDPs). Usually, the RDPs of star clusters can be described by an analytical profile, like the empirical, single mass, modified isothermal spheres of King (1966) and Wilson (1975), and the power law with a core of Elson et al. (1987). These functions are characterized by different sets of parameters that are related to the cluster structure. Here we adopted the two-parameter function , where is the residual background density, the central density of stars, and Rcore the core radius. Applied to star counts, this function is similar to that used by King (1962) to describe the surface brightness profiles in the central parts of globular clusters. To minimize degrees of freedom in RDP fits with the King-like profile, was kept fixed (measured in the respective comparison fields) while and were determined by the best profile fit to the data. As a representative of the OCs sample, the RDP of Pismis 19 fitted with King’s profile is shown in Fig. 10, where the solid line shows the best profile fit. The horizontal red bar in the figure denotes the stellar background level measured in the comparison field, and the profile fit uncertainty is shown by the shaded domain. The stellar RDPs fitted profiles of the 40 OCs have been given in Figs. S10S13 as supplementary material. The cluster radius (RRDP) is also obtained from the measured distance from the cluster centre where the RDP and residual background are statistically indistinguishable (Bonatto & Bica, 2007a). The RRDP can be taken as an observational truncation radius, whose value depends on the radial distribution of member stars and the stellar field density. means the wide external ring of the stellar comparison field (see also Sect. 3). These structural parameters and their meaning are listed in Table 5.
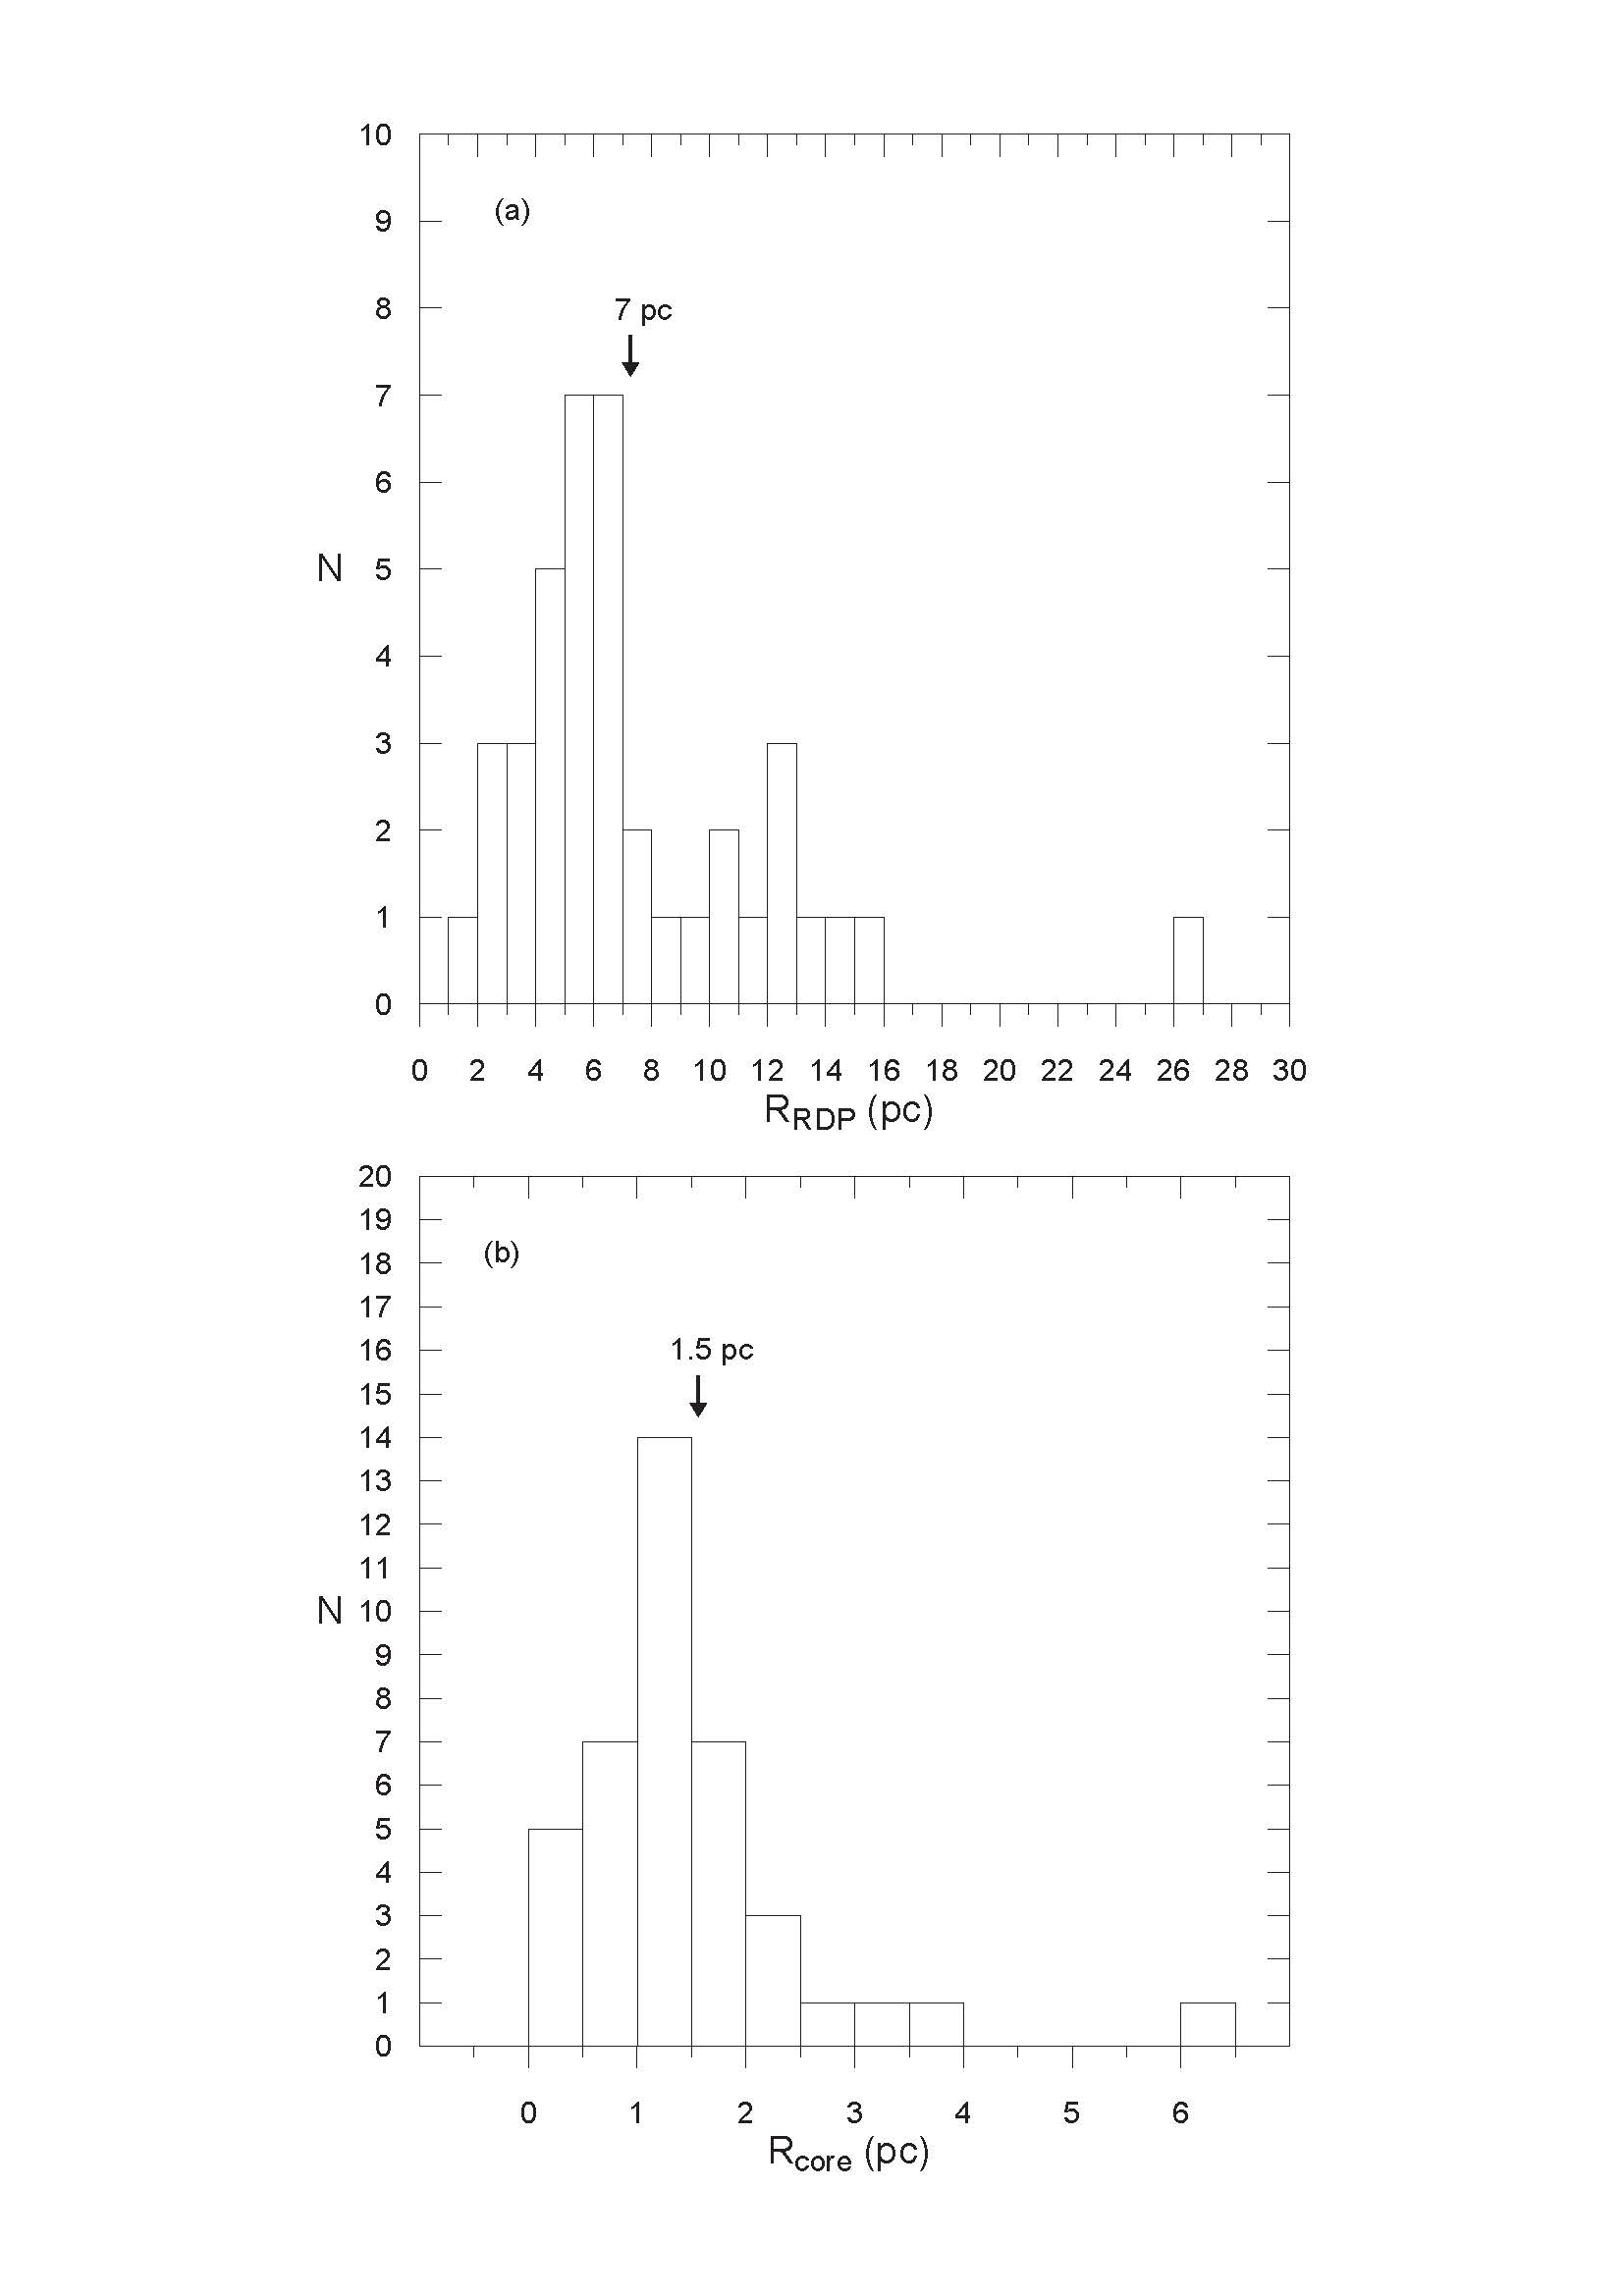
From the distributions of Rcore and RRDP, given in Fig. 11(a) and (b), there seems to be two groupings at RRDP7 pc and Rcore1.5 pc, respectively, which are close to the values of 10 pc and 1.5 pc of Bukowiecki et al. (2011).
6 Mass and Mass functions
The stellar masses stored in the OCs of our sample have been determined by means of their mass functions (MFs), built for the observed MS mass range, according to Bica et al. (2006a). By following the algorithm, which is basically defined by Bonatto & Bica (2005), luminosity functions from the decontaminated diagrams of the OCs have been transformed into MFs through the corresponding mass-luminosity relations derived from the M08 isochrones which correspond to the ages in Col. 5 of Table 3. We determined the overall masses of 26 OCs and the core masses of 24 OCs in our sample. The total mass locked up in stars of these OCs was obtained by considering all stars from the turnoff to the H-burning mass limit. We do this by directly extrapolating the low-mass MFs down to . Here we have based our results on the CMD filtered photometry of open cluster and offset field stars. The filtering process contemplates most of the background, leaving a residual contamination. Due to the relatively large sizes of the OCs and the brightness limitation of the 2MASS photometry, we do not have access to the whole stellar mass range of the OCs. Here, we stress that the values we derive should be taken as approximations.
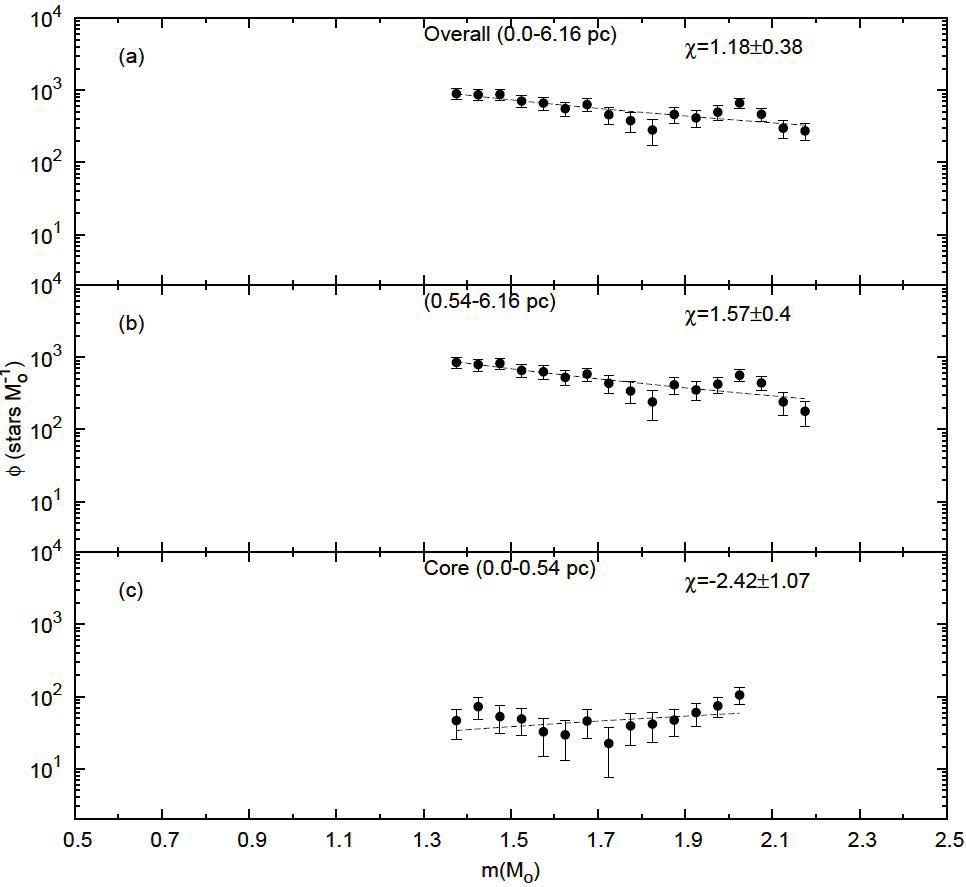
The relation of versus of our representative open cluster Pismis 19 is shown in Figs. 12(a)(c) for different cluster regions. The main sequence mass functions (MFs) in the panels (a)(c) of Fig. 12 are fitted with the function , and the MF slopes () have been determined for the different segments of the mass function MF in Col. 1 of Table 6. More details of this approach are given in Table 6, where we also show the number and mass of the evolved stars (mevol). The MF slopes of the core (29 OCs) and the overall (31 OCs) regions of OCs are presented in Cols. 2 and 5 of Table 7. Since the lower MS is not accessible on the diagrams of the OCs sample, we assumed that the low-mass content is still present, and use Kroupa’s MF666 Kroupa (2001) for , for , and for to estimate the total stellar mass, down to the H-burning mass limit. The results: number of stars, MS and evolved star contents (mobs), MF slope (), and mass extrapolated (mtot) to 0.08 ) for each cluster region are given in Table 6. The mass densities of in unit of are also estimated and given in Cols. 8 and 11 of Table 6 (See also sect. 7.7).
When deriving the mass functions, the part of the steep, that is observed in the core may come from crowding and completeness. 2MASS is not very photometrically deep and has just a moderate spatial resolution. So, in crowded regions (such as the core of most clusters) many stars are not detected, especially the faint ones. This, in turn may mimic mass segregation.
The relaxation time (Myr) is the characteristic time-scale for a cluster to reach some level of energy equipartition (Binney & Merrifield, 1998). As discussed in Bonatto & Bica (2005), Bonatto & Bica (2006a), and Bonatto & Bica (2007a), the evolutionary parameter () appears to be a good indicator of dynamical state. Following Bonatto & Bica (2006a), we parameterize as , where N is the number of stars located inside the region of radius R. The relaxation time and evolutionary parameter for both core and the overall regions are listed in Table 7. The uncertainties in the evolutionary parameters () of OCs have been estimated by propagating the errors in Age (Table 3), Radii (Table 5) and N (Table 6) into and . When propagated, the latter two errors produce a large uncertainty in (Table 7) and, consequently, a large uncertainty in the evolutionary parameter. In this sense, both and should be taken simply as an order of magnitude estimate.
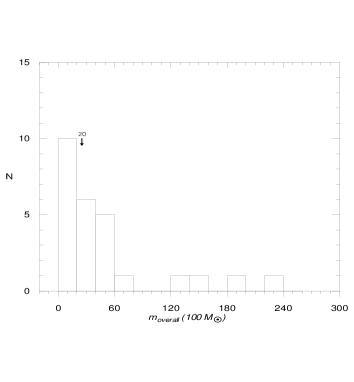
From the overall mass distribution () of 26 OCs displayed in Fig. 13, 2000 value is considered as a criteria in classifying the clusters as less massive and massive.
| NGC 436 | ||||||||||
| Evolved | Observed+Evolved | Extrapolated+Evolved | ||||||||
| Region | N* | mevol | 1.38-2.78 | - | N* | mobs | N* | mtot | ||
| (pc) | (Stars) | () | () | () | () | ( | ||||
| 0.0-1.04 | 11 | 0.40.4 | -1.460.47 | - | 0.250.03 | 0.560.28 | 11.95.97 | 0.40.1 | 0.70.03 | 15.26.11 |
| 1.04-6.97 | 126 | 3.51.8 | 1.740.36 | - | 1.010.1 | 20.57 | 0.140.04 | 25.619.6 | 9.83.8 | 0.690.27 |
| 0.0-6.97 | 146 | 3.91.9 | 0.860.29 | - | 1.120.09 | 2.550.63 | 0.180.04 | 17.111.9 | 7.92.4 | 0.560.17 |
Col. 1: the distance from the core. Cols. 2,6,9 : cluster stars for the regions in Col. 1.
Col. 4 gives the MF slopes (), derived for the low-mass and high-mass ranges.
The masses of , , and are listed in Cols. 3, 7 and 10, respectively.
The mass densities are given in Cols. 8 and 11.
| Core | Overall | |||||
|---|---|---|---|---|---|---|
| Cluster | trlx(Myr) | core | trlx(Myr) | overall | ||
| NGC 436 | 1.460.47 | 0.460.12 | 869.57314.19 | 0.860.29 | 63.9538.60 | 6.254.08 |
| King 5 | 3.060.96 | 0.580.11 | 1724.14475.22 | 1.800.49 | 215.00148.09 | 4.653.34 |
| NGC 1513 | 1.120.24 | 10.216.40 | 9.796.44 | 1.900.12 | 175.88118.13 | 0.570.40 |
| Be 15 | - | - | - | 1.541.15 | 5.052.78 | 99.0157.99 |
| NGC 1907 | 0.760.40 | 1.710.43 | 233.9282.95 | 0.000.23 | - | - |
| NGC 2112 | 1.280.51 | 3.283.59 | 609.76673.63 | 0.500.42 | 126.2278.13 | 15.8510.10 |
| NGC 2158 | 4.241.00 | 5.050.16 | 495.0561.44 | 1.550.71 | - | - |
| Koposov 53 | 3.963.40 | - | - | 0.930.81 | 15.5111.41 | 64.4747.86 |
| NGC 2194 | 0.380.42 | 13.157.87 | 60.8439.46 | 2.520.37 | 456.55311.22 | 1.751.27 |
| NGC 2192 | 2.780.96 | 0.360.10 | 3611.111040.84 | 3.120.43 | 7.230.85 | 179.8125.26 |
| NGC 2243 | - | - | - | 2.091.01 | 826.05654.27 | 2.421.93 |
| Trumpler 5 | 0.420.75 | 1195.27869.82 | 2.511.84 | 1.321.18 | 3804.932817.13 | 0.790.59 |
| Col 110 | 2.580.21 | 29.784.37 | 100.7416.24 | 2.840.57 | 100.0122.83 | 30.007.13 |
| NGC 2262 | 1.490.80 | 0.430.15 | 3023.261079.96 | 1.010.44 | 186.81126.13 | 6.964.73 |
| NGC 2286 | 1.300.50 | 5.974.26 | 167.50124.13 | 1.450.30 | 99.9565.65 | 10.016.87 |
| NGC 2309 | 1.521.03 | 0.350.07 | 1428.57404.06 | 0.890.60 | - | - |
| Haffner 8 | 1.280.77 | 5.504.79 | 181.82159.39 | 1.820.59 | 101.1468.47 | 9.896.77 |
| Mel 71 | 0.301.04 | - | - | 1.290.40 | 146.5599.37 | 10.247.08 |
| NGC 2506 | 4.111.63 | 56.0049.28 | 35.7131.88 | 0.970.63 | 822.94594.95 | 2.431.79 |
| Pismis 3 | 1.600.84 | 10.422.03 | 307.1062.83 | 1.710.49 | 1348.20939.15 | 2.371.66 |
| Ru 96 | 4.580.98 | 17.7015.06 | 56.5048.40 | 4.550.65 | 57.4940.92 | 17.3912.50 |
| Trumpler 20 | 1.070.50 | 12.8517.60 | 116.73164.55 | 2.060.68 | 2272.781663.64 | 0.660.53 |
| Pismis 19 | 2.421.07 | 0.450.10 | 1777.78453.27 | 1.180.38 | 402.04272.33 | 1.991.37 |
| NGC 6134 | 0.950.90 | - | - | 0.831.11 | - | - |
| IC 4651 | 2.780.75 | 1.090.06 | 2293.58302.81 | 0.600.41 | - | - |
| NGC 6802 | 0.460.84 | - | - | 1.660.24 | 232.20156.40 | 3.882.65 |
| NGC 6819 | 1.070.55 | - | - | 0.470.40 | 680.42429.71 | 3.672.43 |
| Be 89 | 0.180.66 | - | - | 1.640.93 | 312.83220.34 | 6.394.78 |
| NGC 6939 | 2.170.66 | 1.420.07 | 1408.45222.38 | 0.840.46 | - | - |
| NGC 7142 | 1.971.44 | - | - | 1.060.56 | - | - |
| NGC 7789 | 0.420.45 | - | - | 0.790.65 | 5471.493972.27 | 0.330.24 |
7 Results
7.1 Relation of RRDP–Rcore
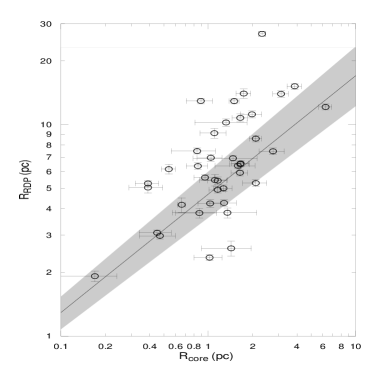
The cluster and core radii (RRDP, Rcore) of 40 OCs, given in Fig. 14 are related by the following relation, RRDP with a mild correlation coefficient (CC, hereafter) of 0.61. This relation of Fig. 14 is almost linear between and , where the axes are in a log-log scale. Their core and cluster sizes are and , respectively. The OCs in our sample which do not follow the relation above are either intrinsically small or have been suffering significant evaporation effects. Our coefficient value (4.69) of Fig. 14 falls in the range of of the literature (Table 8). However the coefficients in Table 8 are affected by the sample size. The relation between RRDP and Rcore found by us is reasonably similar to that given by Camargo et al. (2010). However analogue functions were found by other authors, Nilakshi et al. (2002); Bica & Bonatto (2005); Sharma et al. (2006); Maciejewski & Niedzielski (2007); Bukowiecki et al. (2011).
| Author | a | b | CC | N |
|---|---|---|---|---|
| Nilakshi et al. (2002) | - | 6 | - | 38 |
| Bica & Bonatto (2005) | 1.05 | 7.73 | 0.95 | 16 |
| Sharma et al. (2006) | - | 3.1 | - | 9 |
| Maciejewski & Niedzielski (2007) | - | 3.1 | 0.74 | 42 |
| Camargo et al. (2010) | 0.3 | 8.9 | - | 50 |
| Bukowiecki et al. (2011) | 0.58 | 6.98 | 0.93 | 140 |
7.2 Relations of Cluster Dimensions to the Distance and Age
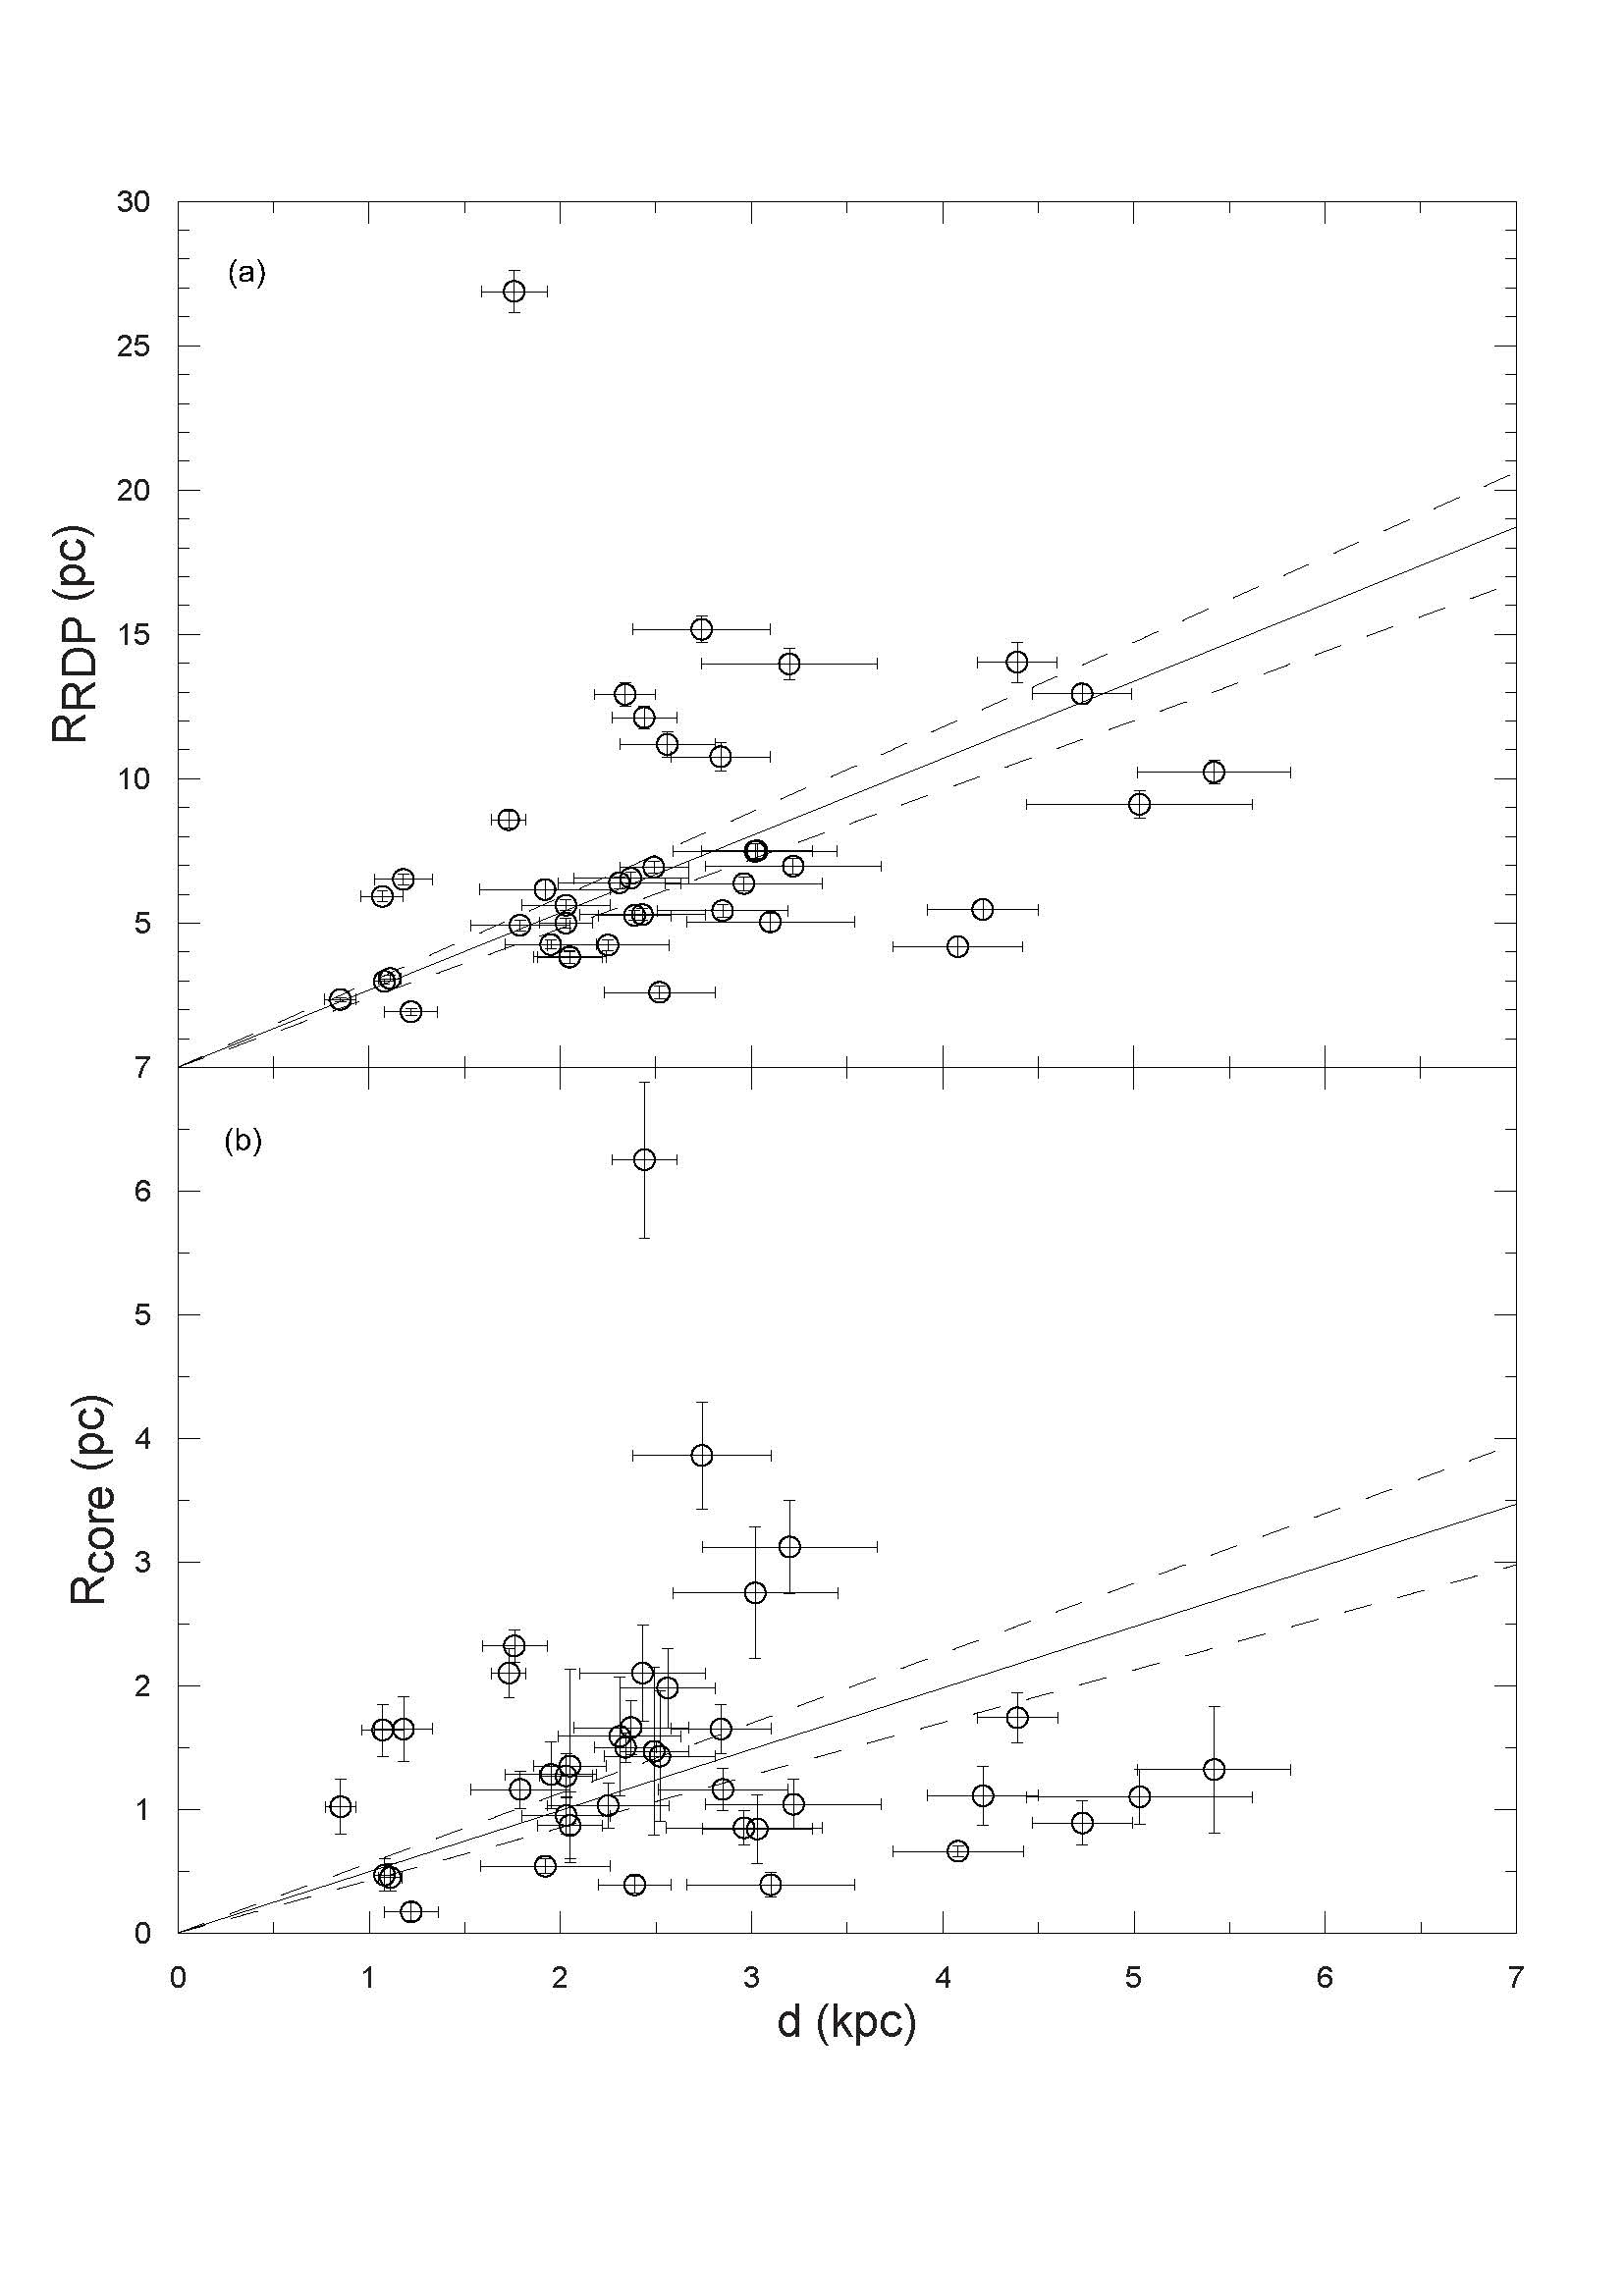
The relations of RRDP and Rcore with d(kpc) are apparently linear, and are displayed in Figs. 15(a)(b). The linear best fit to the data (solid lines) are the following, R (CC0.84) and R d(kpc) (CC0.76), respectively. Given a couple of deviants, the sizes (RRDP and Rcore) increase on the average with the distance from the Sun. Similar trends were also obtained by Lynga (1982), van den Berg et al. (1991), Tadross et al. (2002), Bonatto & Bica (2010) and Bukowiecki et al. (2011).
The relations of and RGC as a function of Age and RRDP, respectively, are presented in Figs. 16(a)(b). Younger and older clusters than 1 Gyr in panels (a)(b) lie inside/outside the Solar circle. No cluster with R pc is seen in panel (a). The OCs with Age1 Gyr in panel (b) do not show any dependence of RGC and RRDP. The OCs, NGC 2243 and NGC 2192 with pc outside the Solar circle in panels (b)(c), where GMCs are scarce, might have been moved to outer parts of the Galactic radii via tidal interactions with the disc and the Galactic bulge, and collisions with GMCs. Alternatively, they may have been formed from molecular clouds at these distances. Note that Schilbach et al. (2006) have also detected large and small sized clusters outside the Solar circle. From panel (b) we note that most of large/small sized OCs inside or outside the Solar circle are located near the galactic plane ( pc) and the OCs inside the Solar circle seem to survive four or more rotations around the Galactic centre. Their survival can be explained by which they survived against external shocks (Janes & Phelps, 1994).

Old clusters with large dimensions inside the Solar circle in panel (b) may have a primordial origin, or their sizes may have been increased via expansion due to stellar mass black hole couples. For the relation, - Age as a function of R⊙ in Fig. 16(c), the OCs with Age Gyr reach higher z distances, whereas those with Age Gyr have pc.
7.3 Relations of RRDP-Age and Rcore-Age
The relations of RcoreAge and RRDPAge have been displayed in Figs. 17(a)(b). In Fig. 17, filled circles and empty triangles show 16 OCs with and 10 OCs with , respectively. 14 OCs which have no mass determinations are marked by open squares. The relation in Figs. 17(a)(b) suggests a bifurcation which is seen at an age 1 Gyr. In the sense, in Fig. 17 some clusters appear to expand (‘A’ arrow), while others contract (‘B’ arrow) with a bifurcation occuring at about 1 Gyr. Mackey et al. (2008) observed the bifurcation at 500-600 Myr (shown with ‘C’ in the panels of Fig. 17). This kind of relations in the panels were also observed by Bonatto & Bica (2007a), Maciejewski & Niedzielski (2007), and Camargo et al. (2010) from their OC samples.
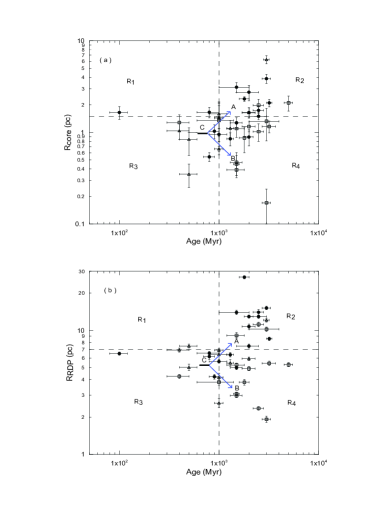
Mackey et al. (2008) argue that some clusters show the expanded cores due to stellar mass black holes (hereafter BHs), and others contract due to dynamical relaxation and core collapse. To be able to see the effect of BHs in our core radius-age relation, the information of the OCs in regions of R2 and R4 in Fig. 17(a) is given in Tables 910. We call the regions in Fig. 17 as R1, R2, R3 and R4. Nbh in Tables 910 means the estimated number of stellar mass black holes (BHs). This value is estimated from a relation N, given by Portegies Zwart & McMillan (2000). Here, is the extrapolated number of stars in the OCs, and is given in Col. 9 of Table 6 for the overall regions of OCs. Because the extrapolated stellar number for NGC 2158 is not available (Col. 9 of Table 6; supplementary material), the number of BHs could be estimated from the relation of , given by Portegies Zwart & McMillan (2000). The BH numbers of seven OCs in the regions R2 and R4 in Fig. 17(a) cannot be estimated, because their extrapolated star numbers or overall masses are not available (see Col. 9 of Table 6; supplementary material).
| Cluster | Age | RRDP | Rcore | moverall | Nbh |
|---|---|---|---|---|---|
| (Myr) | (pc) | (pc) | (100m | ||
| NGC 2112 | 2000 | 5.92 | 1.64 | 18.10 | 4 |
| NGC 2158 | 2500 | 14.03 | 1.74 | 33.40 | 7 |
| Trumpler 5 | 3000 | 15.18 | 3.86 | 223.0 | 45 |
| Col 110 | 3000 | 12.12 | 6.25 | 16.50 | 3 |
| NGC 2286 | 1000 | 6.39 | 1.59 | 11.10 | 2 |
| NGC 2506 | 2000 | 10.76 | 1.65 | 65.80 | 13 |
| Pismis 3 | 3200 | 8.58 | 2.10 | 133.00 | 27 |
| Trumpler 20 | 1500 | 13.98 | 3.12 | 150.00 | 30 |
| NGC 6819 | 2500 | 12.92 | 1.50 | 49.10 | 10 |
| Be 89 | 2000 | 7.48 | 2.75 | 32.00 | 6 |
| NGC 7789 | 1800 | 26.88 | 2.32 | 194.00 | 39 |
| Cluster | Age | RRDP | Rcore | moverall | Nbh |
|---|---|---|---|---|---|
| (Myr) | (pc) | (pc) | (100m | ||
| King 5 | 1000 | 5.62 | 0.95 | 30.00 | 6 |
| Koposov 53 | 1000 | 4.18 | 0.66 | 2.37 | 0 |
| NGC 2192 | 1300 | 5.47 | 1.11 | 2.27 | 0 |
| NGC 2243 | 2000 | 12.94 | 0.89 | 51.70 | 10 |
| NGC 2262 | 1300 | 6.37 | 0.85 | 24.10 | 5 |
| Haffner 8 | 1000 | 6.93 | 1.47 | 9.85 | 2 |
| Mel 71 | 1500 | 5.00 | 1.27 | 21.80 | 4 |
| Ru 96 | 1000 | 2.60 | 1.43 | 15.80 | 3 |
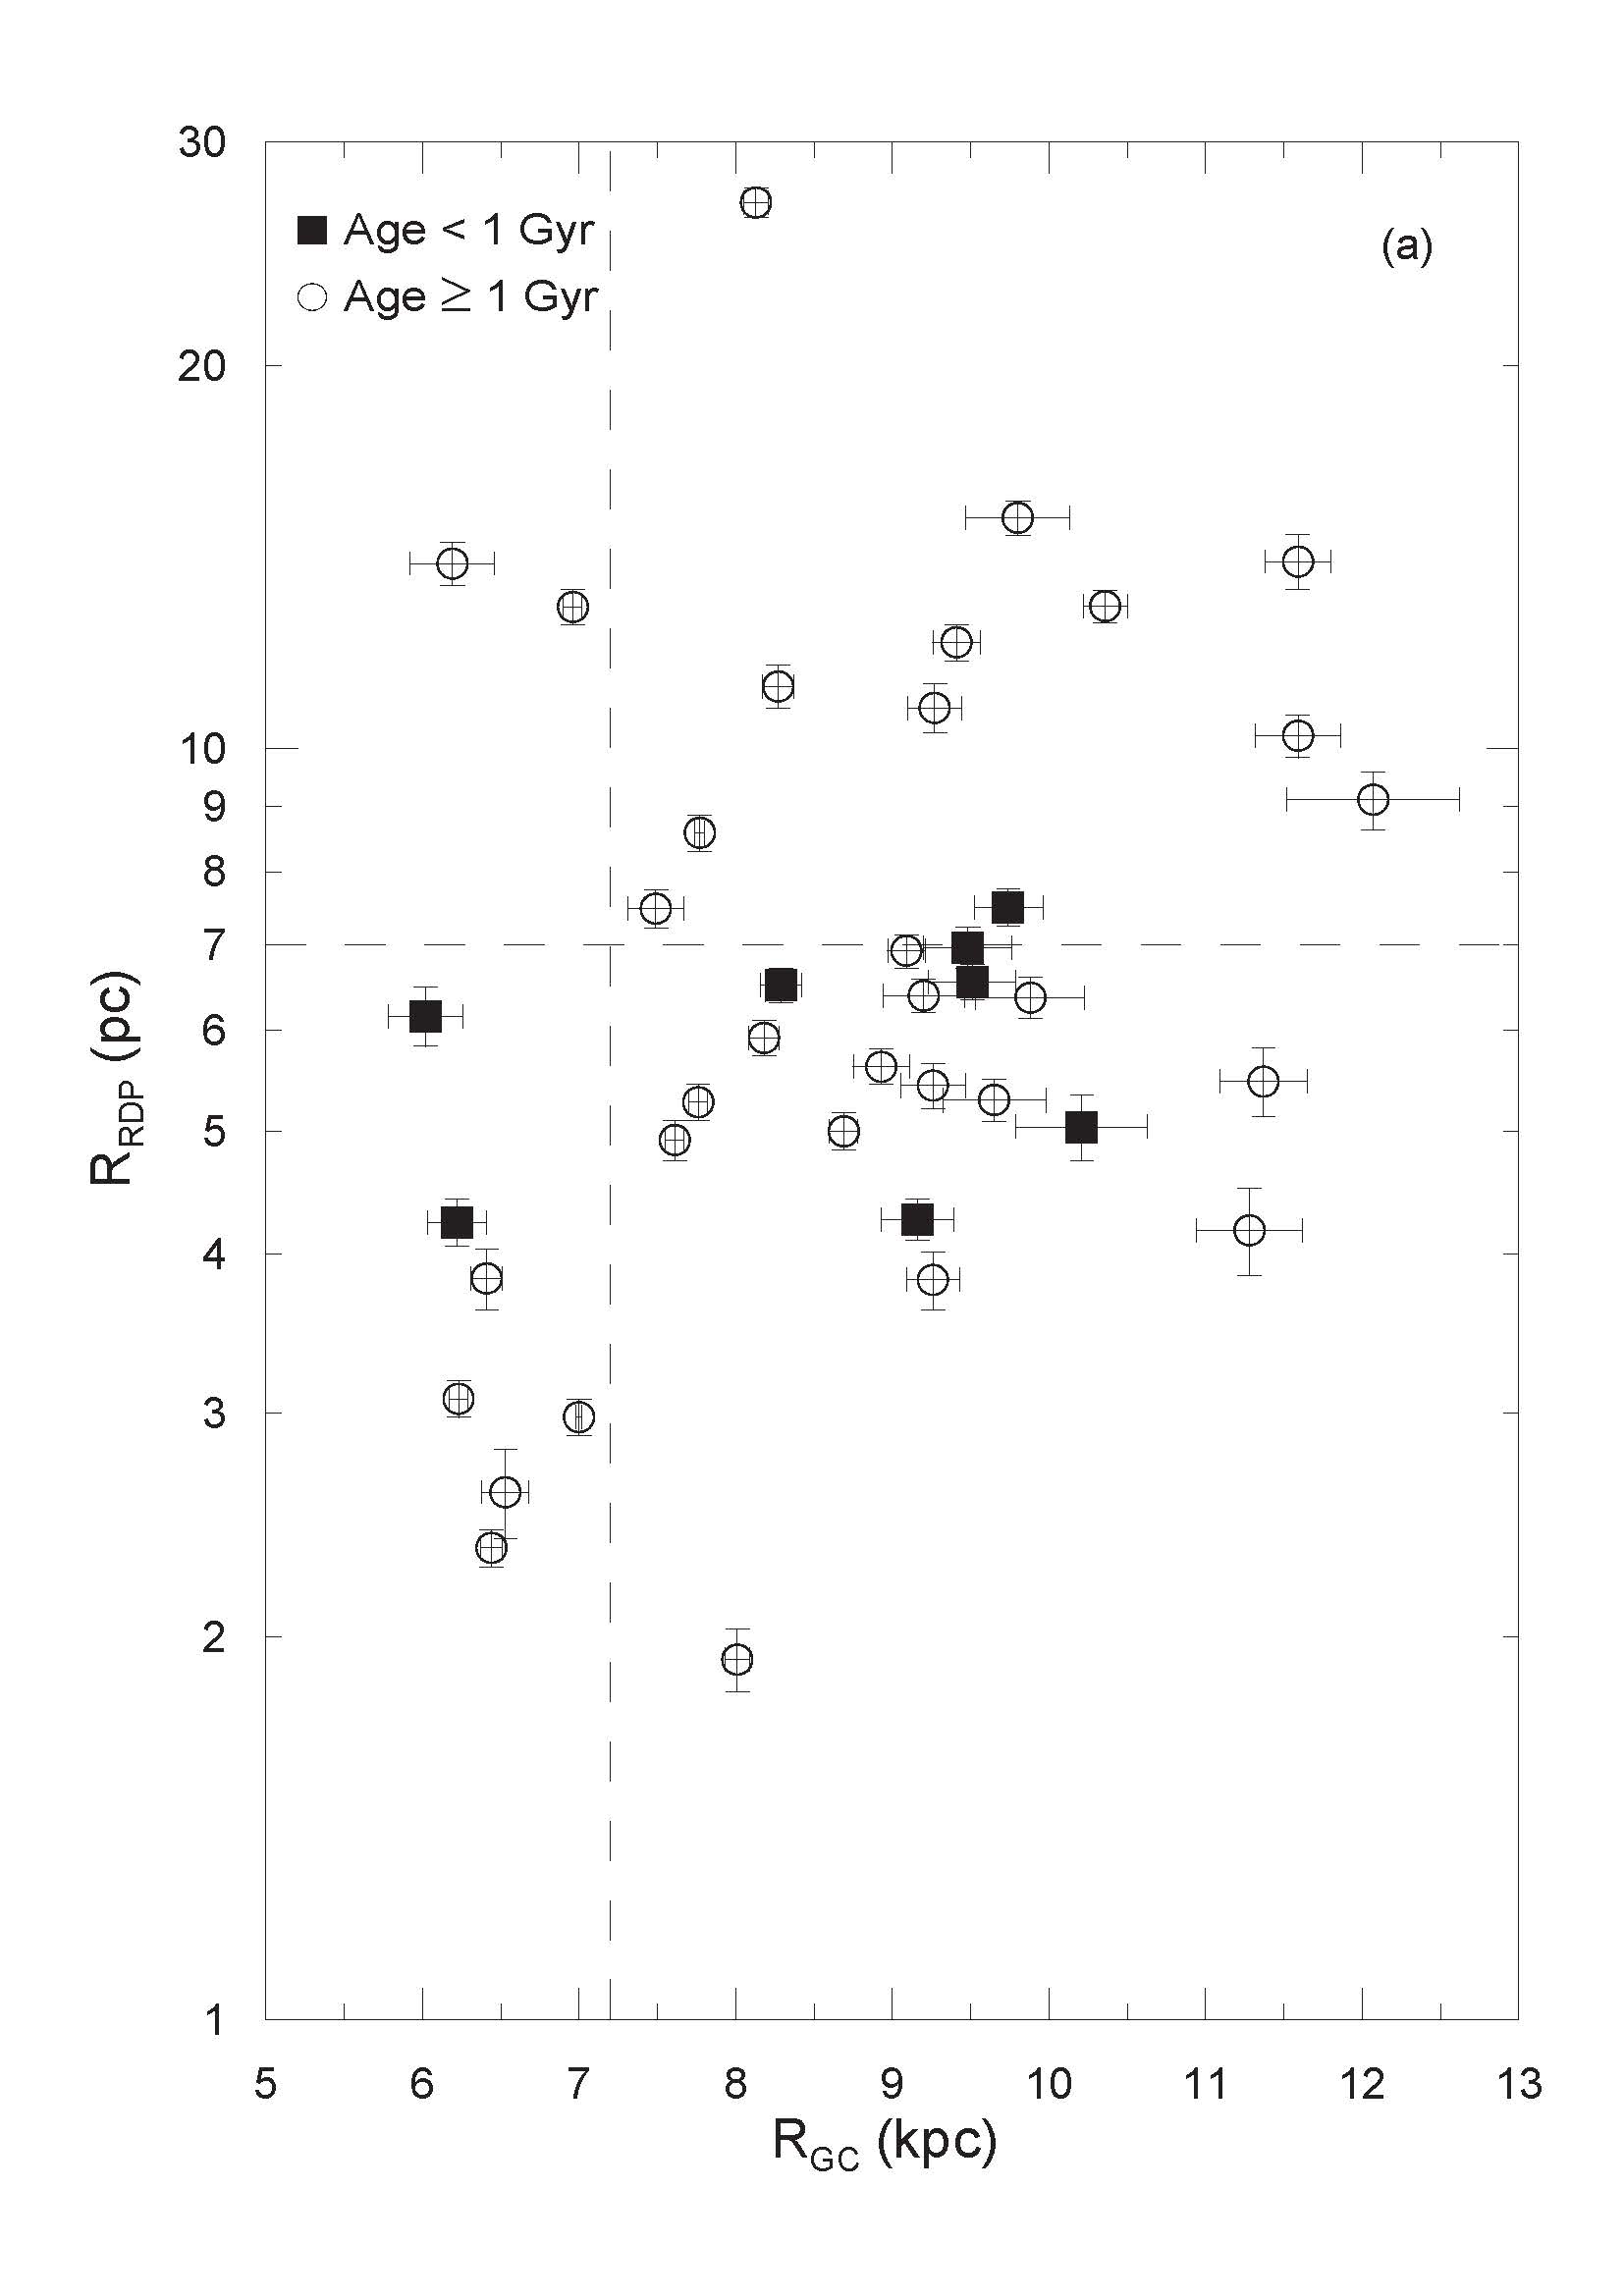
7.4 Relations of RRDP and Rcore with RGC
The dependence of the structural parameters (RRDP & Rcore) with their galactocentric distance RGC of the 40 OCs and as a function of the ages are plotted in Figs. 18(a)(b). The large and small-sized clusters in Fig. 18(a) occupy the inner- and the outer- Galactic radii. Two OCs with RRDP 7 pc and Age 1 Gyr in Fig. 18(a) are locate inner Galactic radius. Such OCs with these sizes and ages are also seen in Schilbach et al. (2006, their fig. 3(c)). The relation between RRDP and RGC is the following, RRDP, with a correlation coefficient of 0.53 (see Fig. 18a), Our result shows that there is no strong dependence of RRDP on RGC. However, Lynga (1982), Tadross et al. (2002) and Camargo et al. (2009, 2010) mention a correlation from their OC samples.

7.5 Relations of moverall with RRDP, Rcore, Age and RGC
Figs. 19(a) and (b) show the relations of moverall versus RRDP and moverall versus Rcore as a function of Age of 26 of our 40 OCs. The relations to fit moverall with RRDP and with Rcore are (CC0.60) and (CC0.53), respectively. These correlations between size and mass of the clusters are in concordance with the mass-radius relation for massive OCs with Age 100 Myr (Portegies Zwart et al., 2010; Camargo et al., 2010). In Figs. 20(a) and (b) the relations of moverall with RGC and of moverall with Age of 26 of our 40 OCs are shown. As is seen from Fig. 20(a), massive and less massive OCs than m are located indistinctly in- or outwards of the Solar circle.


7.6 Relations between MF slopes, Age, RRDP, RGC, and the mass density
The relation of with of 29 OCs is presented in Fig. 21. The fit which is applied to the data is given as following, , with a moderate CC0.60. The OCs with flat/steep positive overall MF slopes for in Fig. 21 show signs of a mild to large scale mass segregation, whereas the OCs with negative overall MF slopes for indicate an advanced dynamical evolution. These MF slopes of in Fig. 21 can be explained by the external dynamical effects such as tidal stripping by tidal interactions (in the form of shocks) due to disc and bulge crossings, as well as encounters with GMCs.

The relations of Age vs. of 31 OCs and Age vs. of 29 OCs of our sample are displayed in Figs. 22(a) and (b). The age dependence of the overall and core MF slopes has been parameterised by the linear-decay function (shown as dashed curve) , where represents the MF slope in the early phases and is the flattening time scale. For the overall MF we derive and Myr (CC0.44); the core values and Myr (CC0.68). Within the expected uncertainties the overall MF values are quite close to of Kroupa (2001) and of Salpeter (1955).


The relations of moverall with the slope of 26 OCs and mcore with of 24 OCs have been presented in Figs. 23(a) and (b). In Fig. 23(a), most of the OCs of with positive overall slopes are mass-rich and present little or no signs of mass segregation. For the relation of mcore with dispayed in Fig. 23(b), most of OCs with m have negative core MF slopes implicating mass segregation effects at a larger scale.


In the relations of RRDP with and RRDP with for 31 and 29 OCs of our sample, respectively, given in Figs. 24(a) and (b), the OCs with larger or smaller dimensions than R have a positive or negative sloped overall- and core-MFs, repectively.


From the relations between RGC and of 31 OCs, and between RGC and of 29 OCs shown in Figs. 25(a) and (b), apparently MF slopes are not correlated with RGC or Age.


The cluster mass density is plotted in Fig. 26(a) and (b) as a function of for 26 OCs and for 24 OCs, respectively. In panel (a) the mass densities of the OCs having are low, as compared to the ones of the OCs with . This indicates that low mass stars of OCs with negative MF slopes are significantly lost due to external dynamical processes. From panel (b) one can see that and are not correlated.


7.7 Relation between the MF slope and the evolutionary parameter and a comparison to Kroupa’s IMF
From MF slopes and evolutionary parameters of the overall and the core of the OCs given in Table 7, the relations of with of 24 OCs and similarly, of with of 21 OCs have been plotted in Figs. 27(a)(b). The dashed curve on the figure shows the fit, . As seen in panels (a) and (b) of Figure 27, the overall- and core-MF slopes undergo an exponential decay with . Here, and mean MF slopes at birth and in the advanced stage, respectively. For the overall MF slope, we derive and (CC0.77); the core values and (CC0.64). Similar relations were obtained by Bica et al. (2006a, see their Fig. 8(a) and (b)) and Maciejewski & Niedzielski (2007, see their Figs. 7(b), (d), (e)).


8 Conclusions
Our main conclusions are summarized as follows:
-
1.
The astrophysical and structural parameteres of 40 OCs have been derived from the filtered 2MASS CMDs, and the stellar RDPs. The field star decontamination technique is utilised for separating the cluster members. The astrophysical parameters (Age, d, E(B-V)) of 40 OCs comprise with ages in the range of 0.1 Gyr to 5.0 Gyr, at heliocentric distances, 0.85 kpc to 5.42 kpc, and with reddenings, (Table 3). Having combined the derived structural, mass and mass functions, relaxation and evolutionary parameters with astrophysical parameters of 40 OCs, dynamical evolution of these OCs have been studied. The reduced final reddenings from the dust maps of SFD have been compared with the ones of 40 OCs (Fig. 9(b)). There are significant differences for 27 OCs between both – color excess values. For the rest, the – values of 13 OCs are quite close to the ones of SFD. Note that SFD maps are not reliable at regions due to contaminating sources and uncertainties in the dust temperatures (Gonzalez et al., 2012). Therefore, the SFD values resulted from line-of-sight integral through the Milky Way and with low spatial resolution, it is quite a normal to have different reddening values for these relatively close ( kpc) star clusters.
-
2.
The relation between RRDP and Rcore in Fig. 14 found by us is reasonably similar to that given by Camargo et al. (2010). The OCs in our sample which do not follow the relation are either intrinsically small or have been suffering significant evaporation effects. The dimensions (RRDP and Rcore) in Figs. 15(a) and (b) increase on the average with the distance from the Sun.
-
3.
From Fig. 17(a) and Tables 9-10, apparently the sizes of core radii of the OCs are related with their respective BH numbers. The black hole numbers of the OCs in region R2 of Fig. 17(a) are generally larger than the ones of the OCs in the region of IV. Note that the BH numbers of six, out of 10 OCs in Table 10 are almost close to the ones of the OCs in Table 9. However, with almost similar BH numbers, these six OCs show shrinkage, whereas those in Table 9 indicate the expanded cores. For example, If the statement of Mackey et al. (2008) is correct, NGC 2243 with its 10 BHs would develope a large core. However, NGC 2243 has small core value, Rcore = 0.89 pc. Col. 110 with a few BHs shows an expanding core with Rcore = 6.25 pc. The core sizes of NGC 7789 (Rcore = 2.32 pc) and Be 89 (Rcore = 2.75 pc), respectively are quite close together. But their BH numbers of the two OCs are very different. Therefore, the presence of BHs is not the only possible explanation for the bifurcation seen in Figs. 17(a) and (b). Alternatively, one should also consider the effect of the mass range of OCs. In other words, for clusters older than 1 Gyr, Fig. 17 shows that massive OCs (filled circles) can be found in both regions R2 and R4. There are two low-mass OCs (open triangles) in the region R4, (see Fig. 17(a)). In this sense, the distribution of OCs in Fig. 17 can be partly attributed to clusters with large radii retaining larger masses.
Mackey et al. (2003, 2008) also argue that the expanded cores are the cause of growth of the limiting radii and the shrinking cores lead to the contraction of the limiting radii. There are 32 OCs of our sample in the regions R2 and R4 in Fig. 17(a); 16 out of 19 OCs with R pc in the region R4 of Fig. 17(a) have R pc; three of 19 OCs have R pc. Similarly, 10 out of 13 OCs in the region R2 of Fig. 17(a) with R pc have R pc; three of them have R pc. Here, R pc means the separation into two groups of our sample (Fig.11a). These findings imply that the OCs with their core expanding could have small cluster limiting radii, in a similar manner, the OCs with shrinking cores could have large limiting cluster radii. Note that there are six OCs with incompatible cores and limiting radii in the regions R2 and R4 of Fig. 17(b). These six OCs are inconsistent with the arguments of Mackey et al. (2003, 2008).
-
4.
For this paper, we do not make an effort to determine the binary fractions of our sample OCs. However, the OCs Binaries widen the main sequence of the OCs by as much as 0.75 mag, so theoretical isochrones are fitted to the mid-points of CMDs of the OCs, rather than the faint or blue sides, as emphasized by Carney (2001). Binaries are indeed an effective way of storing energy in a cluster. Non-primordial binary formation, especially the close ones, requires many encounters of at least 3 stars, 2 of which end up having orbits around each other and the 3rd one gets ”ejected”. So, depending on the binary fraction, a cluster can get dynamically swollen. As a consequence of the dynamical evolution in OCs, multiple systems tend to concentrate in central regions Takahasi& Portegies Zwart (2000). As indicated by Bonatto et al. (2005), the main effect of a significant fraction of binaries in central parts of OCs is that the number of low-mass stars is underestimated with respect to the higher mass stars. Sollima et al. (2010) give the complete fractions of binaries as 35 to 70 . They also give a minimum binary fraction, which is larger than 11 within the core of OCs.
-
5.
It is seen from Figs. 18(a) and (b) that the OCs with R pc and R pc inside the Solar circle are older than 1 Gyr. As they lost their stellar content, they shrunk in size and mass with time. Nevertheless, they seem to survive against external shocks for a longer time, according to the simulations of Spitzer&Chevalier (1973). As one can see from Fig. 18(b), there is no strong dependence of Rcore with RGC.
-
6.
As can be seen in Figs. 19(a) and (b), OCs with large dimensions are on the average more massive. There does not seem to be an age dependence for the relations in the panels (a)(b) of Fig 19. As can be seen from Fig. 20(a), massive and less massive OCs than m are located indistinctly in- or outwards of the Solar circle. Less massive OCs which are located outside the Solar circle appear to survive, because they are subject to less external dynamical processes: The OCs inside the Solar radius survive against the combined dynamical effects such as interactions with GMCs, tidal effects with the spiral arm and the Galactic disc, which are quite efficient in the Galactic center directions. As is seen in Fig. 20(b), less massive OCs older than 1 Gyr are scarcer since they are dissolved into the field, i.e. the more massive and older OCs ( Gyr) survive.
-
7.
The OCs with flat/steep positive overall MF slopes for in Fig. 21 show signs of a mild to large scale mass segregation, whereas the OCs with negative overall MF slopes for indicate an advanced dynamical evolution. These MF slopes of in Fig. 21 can be explained by the external dynamical effects such as tidal stripping by tidal interactions (in the form of shocks) due to disc and bulge crossings, as well as encounters with GMCs.
-
8.
As considered these MF slopes in Figs. 22(a) and (b), OCs are formed with flat core and Kroupa and Salpeter-like overall MFs, as stated by Bonatto & Bica (2006a). As is seen from Fig. 22, at cluster birth the core MF seems to be much flatter than the overall MF. Early core flattening may be partly linked to primordial processes associated to molecular-cloud fragmentation. Within the expected uncertainties the overall MF values are quite close to of Kroupa (2001) and of Salpeter (1955). However, our core MF value are smaller than the ones of Kroupa and Salpeter. As is seen from panels (a)(b), except for few MF slopes, the overall and core MF slopes tend to be negative values towards older ages, because of mild/large scale mass segregation, the presence of GMCs and tidal effects from disk and Bulge crossings as external processes.
-
9.
Most of the OCs of with positive overall slopes in Fig. 23(a) are mass-rich and present little or no signs of mass segregation. Apparently they retain their low-mass stars because they are strongly bounded to the clusters. The OCs with negative overall MF slopes in Fig. 23(a) seem to be in the phase of more advanced dynamical evolution. In panels (a)(b) of Fig. 23 there is no indication of age dependence that is seen between the MF slopes and the core- or overall-masses. In panels (a)(b) of Fig. 23, the OCs with steep overall and core MF slopes present signs of larger scale mass segregation in the core or halo region. As expected, there are no indications of age dependence among the positive/negative MF slopes.
-
10.
From Fig. 27(a), one sees that for , the overall MF slopes of the OCs are negative, with one exception. For , the overall MF slopes of the remaining OCs fall in the range of . For , as a result of the loss of low mass stars, tends to negative values. As can be seen from panel (b), the core MF slopes for the majority of OCs tend to be negative values after , with two exceptions. In panel (b) there are two OCs with flat slopes for . For , it is seen from panel (b) that the OCs with dynamically evolved cores reveal a sign of strong mass segregation.
From eleven OCs, Bonatto & Bica (2005) detected the significant flattening in MF slopes for and , respectively. From their OCs, Maciejewski & Niedzielski (2007) give for these values and , respectively. Here we detect the flattening of MF slopes at and , respectively. However, these values are affected by the sample size with young and old OCs. Note that our sample also contains the OCs with intermediate and old ages.
The overall MF slopes of 31 OCs with , M⊙ could have been compared with the one given by Kroupa (2001, ). As compared to the uncertainties of our MF slopes (Col. 5; Table 7) and the one () of Kroupa, the overall MF slopes of 14 out of 31 OCs are consistent with the one of Kroupa (2001, ), which implies little or no dynamical evolution for these clusters. The remaining 17 OCs with MF slopes that depart from that of Kroupa (2001) show mild to large scale mass segregation, due to the dynamical evolution.
-
11.
We do not make an effort to determine the binary fractions of our sample OCs. Sollima et al. (2010) give the complete fractions of binaries as 35 to 70 . They also give a minimum binary fraction, which is larger than 11 within the core of OCs. However, binaries of the OCs widen the main sequence of the OCs by as much as 0.75 mag, so theoretical isochrones are fitted to the mid-points of CMDs of the OCs, rather than the faint or blue sides, as emphasized by Carney (2001). We have considered this issue for isochrone fitting to CMDs (see Sect.4). Binaries are indeed an effective way of storing energy in a cluster. Non-primordial binary formation, especially the close ones, requires many encounters of at least 3 stars, 2 of which end up having orbits around each other and the 3rd one gets ”ejected”. So, depending on the binary fraction, a cluster can get dynamically swollen. As a consequence of the dynamical evolution in OCs, multiple systems tend to concentrate in central regions (Takahasi& Portegies Zwart, 2000). As indicated by Bonatto et al. (2005), the main effect of a significant fraction of binaries in central parts of OCs is that the number of low-mass stars is underestimated with respect to the higher mass stars.
Acknowledgements.
We thank the anonymous referee for her/his comments and suggestions on the manuscript. We thank C. Chavarria for the correction of English in the text. This publication makes use of data products from the Two Micron All Sky Survey, which is a joint project of the University of Massachusetts and the Infrared Processing and Analysis Centre/California Institute of Technology, funded by the National Aeronautics and Space Administration and the National Science Foundation. This research has made use of the WEBDA database, operated at the Institute for Astronomy of the University of Vienna.References
- Arce & Goodman (1999) Arce, H. G., & Goodman, A. A. 1999., ApJ, 512, L135
- Bahcall & Soneira (1980) Bahcall, J.N., & Soneira, R.M., 1980, ApJ, 238, 17
- Bergond et al. (2001) Bergond, G., Leon, S., Guibert, J., 2001, A&A, 377, 462
- Bica & Bonatto (2005) Bica, E., Bonatto, Ch., 2005, A&A, 443, 465
- Bica et al. (2006a) Bica, E., Bonatto, Ch., Blumberg, R., 2006a, A&A, 460, 83
- Bica et al. (2006b) Bica, E., Bonatto, Ch., Barbuy, B., Ortolani, S., 2006b, A&A, 450, 105
- Bica et al. (2008a) Bica, E., Bonatto, Ch., Camargo, D., 2008, MNRAS, 385, 349
- Bica et al. (2008b) Bica, E., Bonatto, Ch., Dutra, C., 2008, A&A, 489, 1129
- Binney & Merrifield (1998) Binney, J. & Merrifield, M. 1998, in Galactic Astronomy, Princeton, NJ: Princeton University Press. (Princeton series in astrophysics)
- Bonatto et al. (2004) Bonatto, Ch., Bica, E., Girardi, L., 2004, A&A, 415, 571
- Bonatto & Bica (2005) Bonatto, Ch., Bica, E., 2005, A&A, 437, 483
- Bonatto et al. (2005) Bonatto, Ch., Bica, E., Santos Jr., J.F.C., 2005, A&A, 433, 917
- Bonatto & Bica (2006a) Bonatto, Ch., Bica, E., 2006a, A&A, 455, 931
- Bonatto et al. (2006b) Bonatto, Ch., Kerber, L.O., Bica, E., Santiago, B.X., 2006b, A&A, 446, 121
- Bonatto & Bica (2007a) Bonatto, Ch., Bica, E., 2007a, A&A, 473, 445
- Bonatto & Bica (2007b) Bonatto, Ch., Bica, E., 2007b, MNRAS, 377, 1301
- Bonatto & Bica (2008) Bonatto, C., Bica, E, 2008, A&A, 485, 81
- Bonatto & Bica (2009a) Bonatto, Ch., Bica, E., 2009a, MNRAS, 392, 483
- Bonatto & Bica (2009b) Bonatto, Ch., Bica, E., 2009b, MNRAS, 394, 2127
- Bonatto & Bica (2009c) Bonatto, Ch., Bica, E., 2009c, MNRAS, 397, 1915
- Bonatto & Bica (2010) Bonatto, Ch., Bica, E., 2010, A&A, 521, 74
- Bonatto & Bica (2011) Bonatto, Ch., Bica, E., 2011, MNRAS, 415, 2827
- Bonifacio et al. (2000) Bonifacio, P., Monai, S., Beers, T.C., 2000, AJ, 120, 2065
- Bragaglia et al. (2001) Bragaglia, A., Carretta, E., Gratton, R. G., Tosi, M. et al., 2001, AJ, 121, 327
- Bragaglia et al. (2008) Bragaglia, A., Sestito, P., Villanova, S., Carretta, E., Randich, S., Tosi, M., 2008 A&A, 480, 79
- Brown et al. (2008) Brown, J. A., Wallerstein, G., Geisler, D., Oke, J. B., 1996, AJ, 112, 1551
- Bukowiecki et al. (2011) Bukowiecki, L., Maciejewski, G., Konorski, P., Strobel, A., 2011, AcA, 61, 231
- Caetano et al. (2015) Caetano T.C., Dias, W.S., Lepine, J.R.D., Monteiro, H.S., Moitinho, A., Hickel, G.R., Oliveira, A.F., 2015, New A, 38, 31
- Camargo et al. (2009) Camargo, D., Bonatto, C., Bica, E., 2009, A&A, 508, 211
- Camargo et al. (2010) Camargo, D., Bonatto, C., Bica, E, 2010, A&A, 521, 42
- Cambresy et al. (2005) Cambresy, L., Jarett, T.H., Beichman, C.A., 2005, A&A, 435, 131
- Carney (2001) Carney, B. 2001, Star Clusters, Saas-Fee Advanced Course 28, Lecture Notes 1998, Swiss Society for Astrophysics and Astronomy, eds. L. Labhardt and B. Binggeli (Berlin: Springer-Verlag) pp. 1-222
- Carraro et al. (2014) Carraro, G., Villanova, S., Monaco, L., Beccari, G., Ahumada, J. A., Boffin, H. M. J., 2014, A&A, 562, A39
- Carrera et al. (2007) Carrera, R., Gallart, C., Pancino, E., Zinn, R., 2007, AJ, 134, 1298
- Carrera (2007) Carrera, R., 2012, A&A, 544, A109
- Carretta et al. (2004) Carretta, E., Bragaglia, A., Gratton, R. G., Tosi, M. 2004, A&A, 422, 951
- Chen et al. (1999) Chen, B., Figueras, F., Torra, J., Jordi, C, Luri, X., Galadi-Enriquez, D., 1999, A&A, 352, 459
- Dias et al. (2002) Dias, W. S., Alessi, B. S., Moitinho, A., & Lépine, J. R. D., 2002, A&A, 389, 871
- Dias et al. (2012) Dias, W. S., Alessi, B. S., Moitinho, A., & Lépine, J. R. D., 2012, 2012yCat, VizieR On-line Data Catalog: B/ocl.
- Dutra et al. (2002) Dutra, C.M., Santiago, B.X., Bica, E., 2002, A&A, 383, 219
- Dutra et al. (2002) Dutra, C.M., Bica, E., 2002, A&A, 383, 631
- Elson et al. (1987) Elson, R.A.W., Fall, S.M., & Freeman, K.C., 1987, ApJ, 323, 54
- Friel et al. (2005) Friel, E. D., Jacobson, H.R., Pilachowski, C.A., 2005, AJ, 129, 272
- Gieles et al. (2006) Gieles, M., Portegies-Zwart, S., Athanassoula, E., Baumardt, H., Lamers, H.J.G.L.M., Sipior, M, Leenaarts, J., 2006, MNRAS, 371, 793
- Gieles et al. (2007) Gieles, M., Athanassoula, E, Portegies-Zwart, S. 2007, MNRAS, 376, 809
- Gonzalez et al. (2012) Gonzalez, O.A., Rejkuba, M., Zoccali, M., Valenti, E., Minniti, D., Schultheis, M., Tobar, R., Chen, B., 2012, A&A, 543, 13
- Gratton et al. (1994) Gratton, R. G., Contarini, G. 1994, A&A, 283, 911
- Güneş et al. (2012) Güneş, O., Karataş, Y., Bonatto, C., 2012, New A, 17, 720
- Jacobson et al. (2007) Jacobson, H. R., Friel, E. D., Pilachowski, C. A., 2007, AJ, 134, 1216
- Jacobson et al. (2008) Jacobson, H. R., Friel, E. D., Pilachowski, C. A., 2008, AJ, 135, 2341
- Jacobson et al. (2011) Jacobson, H. R., Pilachowski, C. A., Friel, E. D., 2011, AJ, 142, 59
- Janes & Phelps (1994) Janes, K.A., Phelps, R.L., 1994, AJ, 108, 1773
- Joshii (2005) Joshii, Y.C., 2005, MNRAS, 362, 1259
- Kharchenko et al. (2013) Kharchenko, N. V., Piskunov, E. A., Schilbach, E., Roeser, S., Scholz, R. -D, 2013, A&A, 558A, 53
- King (1962) King, I., 1962, AJ, 67, 471
- King (1966) King, I., 1966, AJ, 71, 64
- Kroupa (2001) Kroupa, P., 2001, MNRAS, 322, 231
- Lamers & Gieles (2006) Lamers, H.J.G.L.M., Gieles, M., 2006, A&A, 455, 17
- Lynga (1982) Lynga, G., 1982, A&A, 109, 213
- Lynga (1988) Lynga, G., 1988, ESO Conf. Workshop Proc., 28, 379
- Mackey et al. (2003) Mackey, A.D., Gilmore, G.F., 2003, MNRAS, 338, 120
- Mackey et al. (2008) Mackey, A. D., Wilkinson, M. I., Davies, M. B., Gilmore, G. F., 2008, MNRAS, 386, 65
- Maciejewski & Niedzielski (2007) Maciejewski, G., Niedzielski, A., 2007, A&A, 467, 1065
- Marigo et al. (2008) Marigo, P., Girardi, L., Bressan, A., Groenewegen, M. A. T., Silva, L., & Granato, G. L., 2008, A&A, 482, 883 (M08)
- Mermilliod (1992) Mermilliod, J.C., 1992, Bull. Inform, CDS, 40, 115
- Momany et al. (2006) Momany, Y., Zaggia, S., Gilmore, G.F., Piotto, G., Carraro, G., Bedin, L.R., de Angeli, F., 2006, A&A, 451, 515
- Nilakshi et al. (2002) Nilakshi, S. R., Pandey, A. K., Mohan, V., 2002, A&A, 383, 153
- Nishiyama et al. (2006) Nishiyama, S., Nagata, T., Sato, S., Kato, D., Nagayama, T., Kusakabe, N., Matsunaga, N., Naoi, T., Sugitani, K., Tamura, M., 2006, ApJ, 647, 1093
- Pasquini et al. (2004) Pasquini, L., Randich, S., Zoccali, M., Hill, V., Charbonnel, C., Nordstrom, B., 2004, A&A, 424, 951
- Piskunov et al. (2008) Piskunov, E. A., Schilbach, E., Kharchenko, N. V., Roeser, S., Scholz, R. -D, 2008, A&A, 477, 165
- Portegies Zwart & McMillan (2000) Portegies Zwart, S., McMillan, S., 2000, ApJ, 17, 2000
- Portegies Zwart et al. (2002) Portegies Zwart, S., Makino, J., McMillan, S., Hut, P., 2002, ApJ, 565, 265
- Portegies Zwart et al. (2010) Portegies Zwart, S., McMillan, S., Gieles, M., 2010, ARA&A, 48, 431
- Salpeter (1955) Salpeter, E. 1955, ApJ, 121, 161
- Schilbach et al. (2006) Schilbach, E., Kharchenko, N. V., Piskunov, A.E., R ser, S., Scholz, R.-D., 2006, A&A, 456, 523
- Schuster et al. (2004) Schuster, W. J., Beers, T. C., Michel, R., Nissen, P. E., & García G., 2004, A&A, 422, 527
- Schlegel et al. (1998) Schlegel, D.J., Finkbeiner, D. P., & Davis, M., 1998, ApJ, 500, 525
- Sharma et al. (2006) Sharma, S., Pandey, A.K., Ogura, K., Mrro, H., Tarusawa, K., Sagar, R., AJ, 132, 1669,
- Skrutskie et al. (2006) Skrutskie, M.F., Cutri, R., Stiening, R., Weinberg, M.D., Schneider, S.E., Carpenter, J.M., Beichman, C., Capps, R., 2006, AJ, 131, 1163
- Smiljanic et al. (2008) Smiljanic, R., Gauderon, R., North, P., Barbuy, B., Charbonnel, C., Mowlavi, N., 2008, A&A, 502, 267
- Sollima et al. (2010) Sollima, A., Carballo-Bello, J.A., Beccari, G., Ferraro, F.R., Fusi Pecci, F., Lanzoni, A., 2010, MNRAS, 401, 577
- Spitzer&Chevalier (1973) Spitzer, L., Chevalier, R.A., 1973, ApJ, 183, 565
- Tadross et al. (2002) Tadross, A.L., Werner, P., Osman, A., Marie, M., 2002, New A, 7, 553
- Takahasi& Portegies Zwart (2000) Takahasi, K., & Portegies Zwart, S. F. 2000, ApJ, 535, 759
- Trumpler (1930) Trumpler, R.J., 1930, Lick Obs. Bull., 14, 154
- Wilson (1975) Wilson, C.P., 1975, AJ, 80, 175
- van den Bergh & McClure (1980) van den Bergh, S., McClure, R.D., 1980, A&A, 88, 360
- van den Berg et al. (1991) van den Berg, S., Morbey, C., Pazder, J., 1991, ApJ, 375, 594
9 Supplementary material
Figures S5-S9: Observed decontaminated J, (J-H) CMDs of 40 OCs. The CMD filter shown with the shaded area is used to isolate cluster MS/evolved stars.
Figures S10-S13: Stellar RDPs (open circles) of 40 Ocs built with CMD filtered photometry. Solid line shows the best-fit King profile. Horizontal red bar: stellar background level measured in the comparison field. Shaded region: King fit uncertainty.
Table S6: The number of stars, mass information, mass function slope, mass density, which correspond to cluster regions of available clusters for the cases of Evolved, Observed+Evolved, and Extrapolated+Evolved.
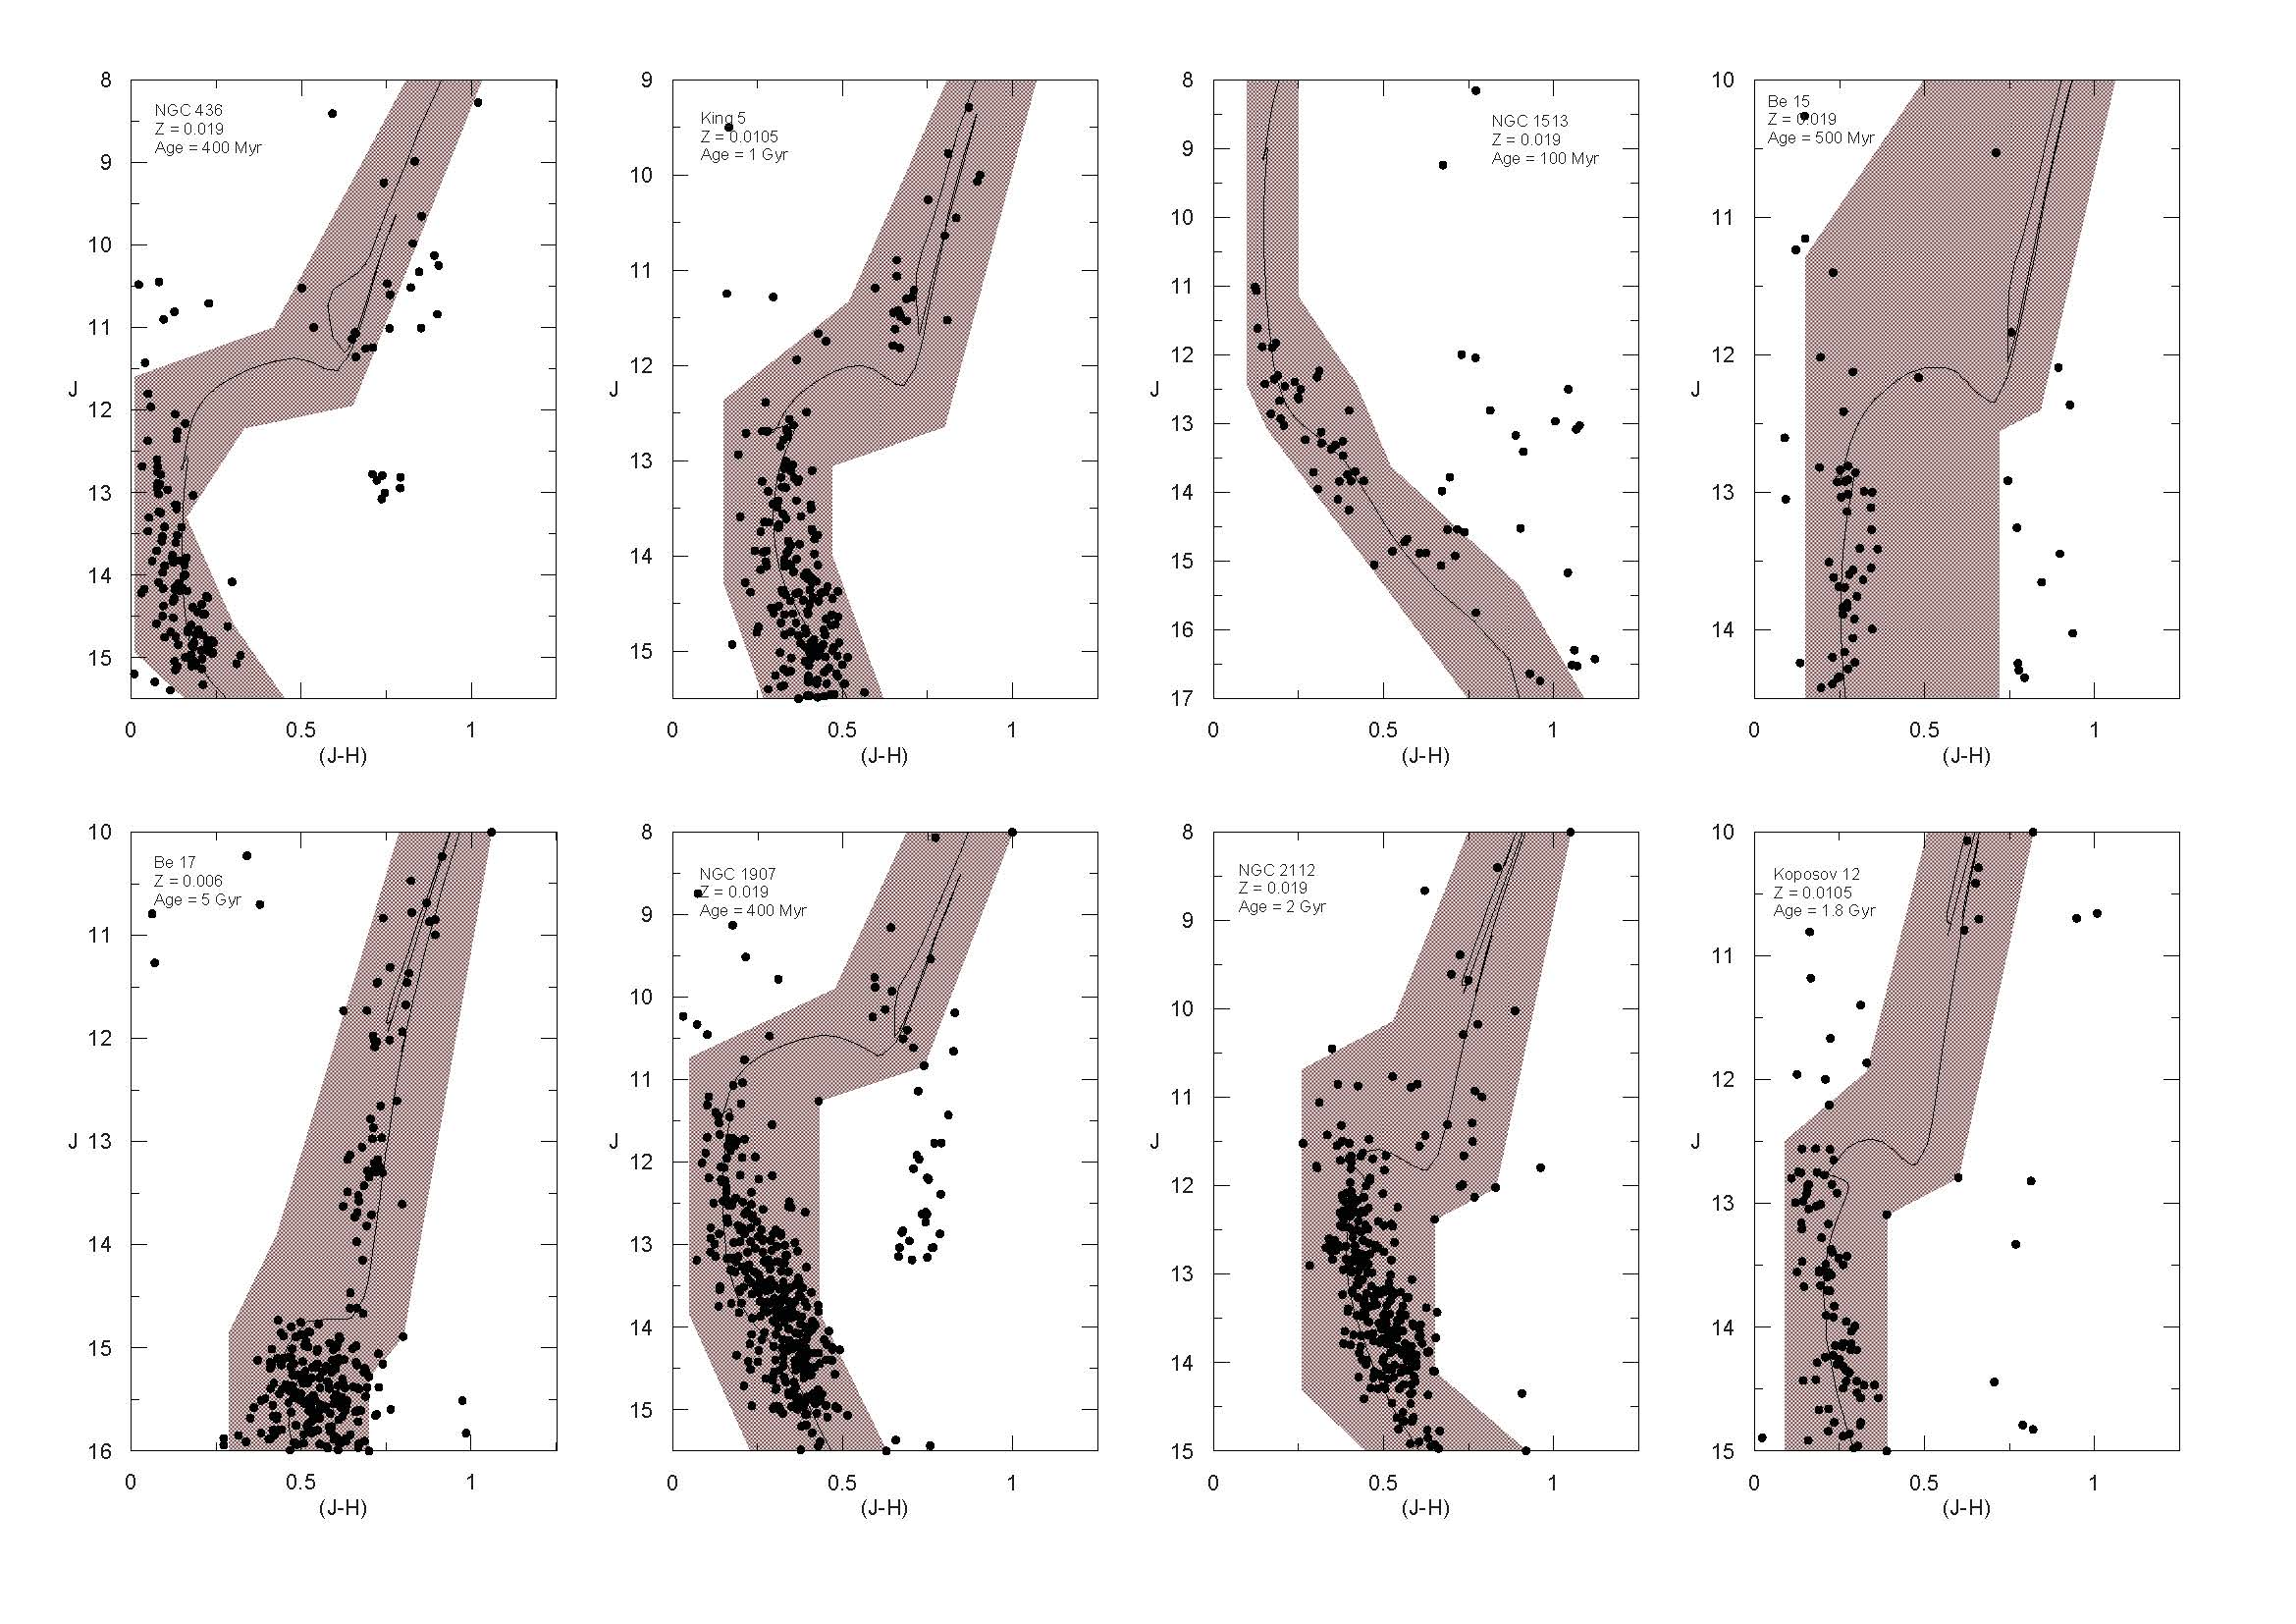

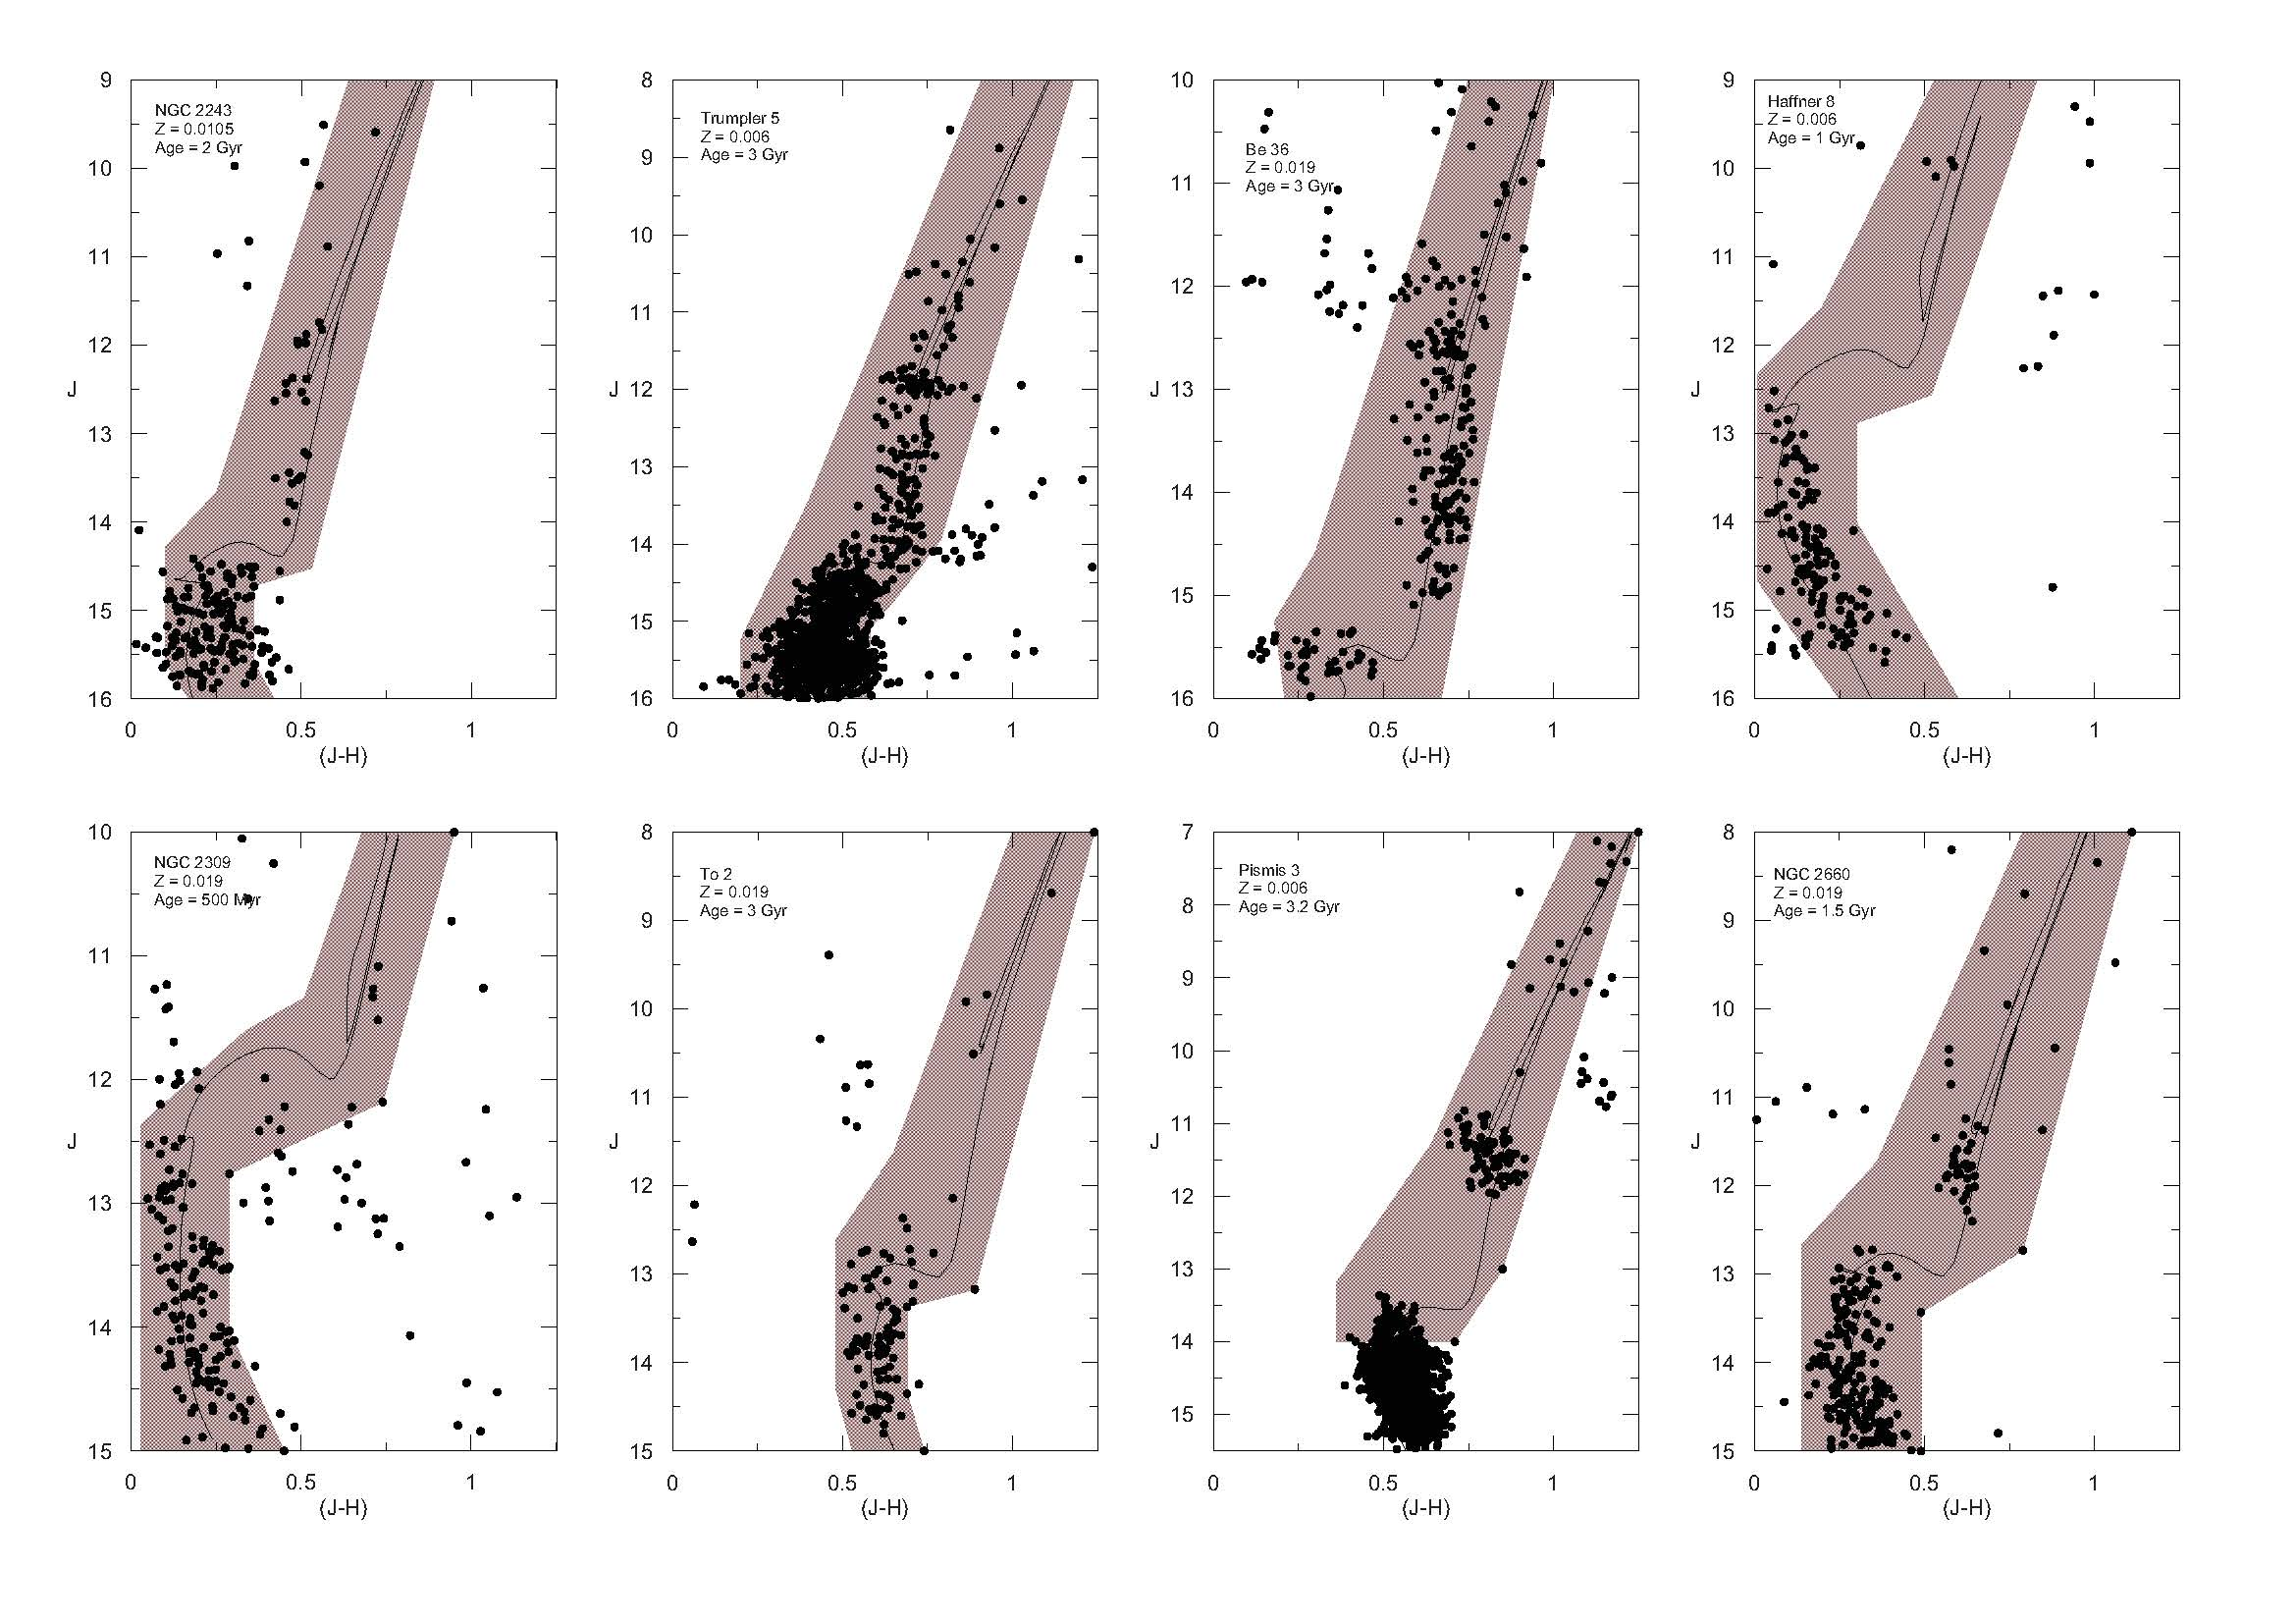
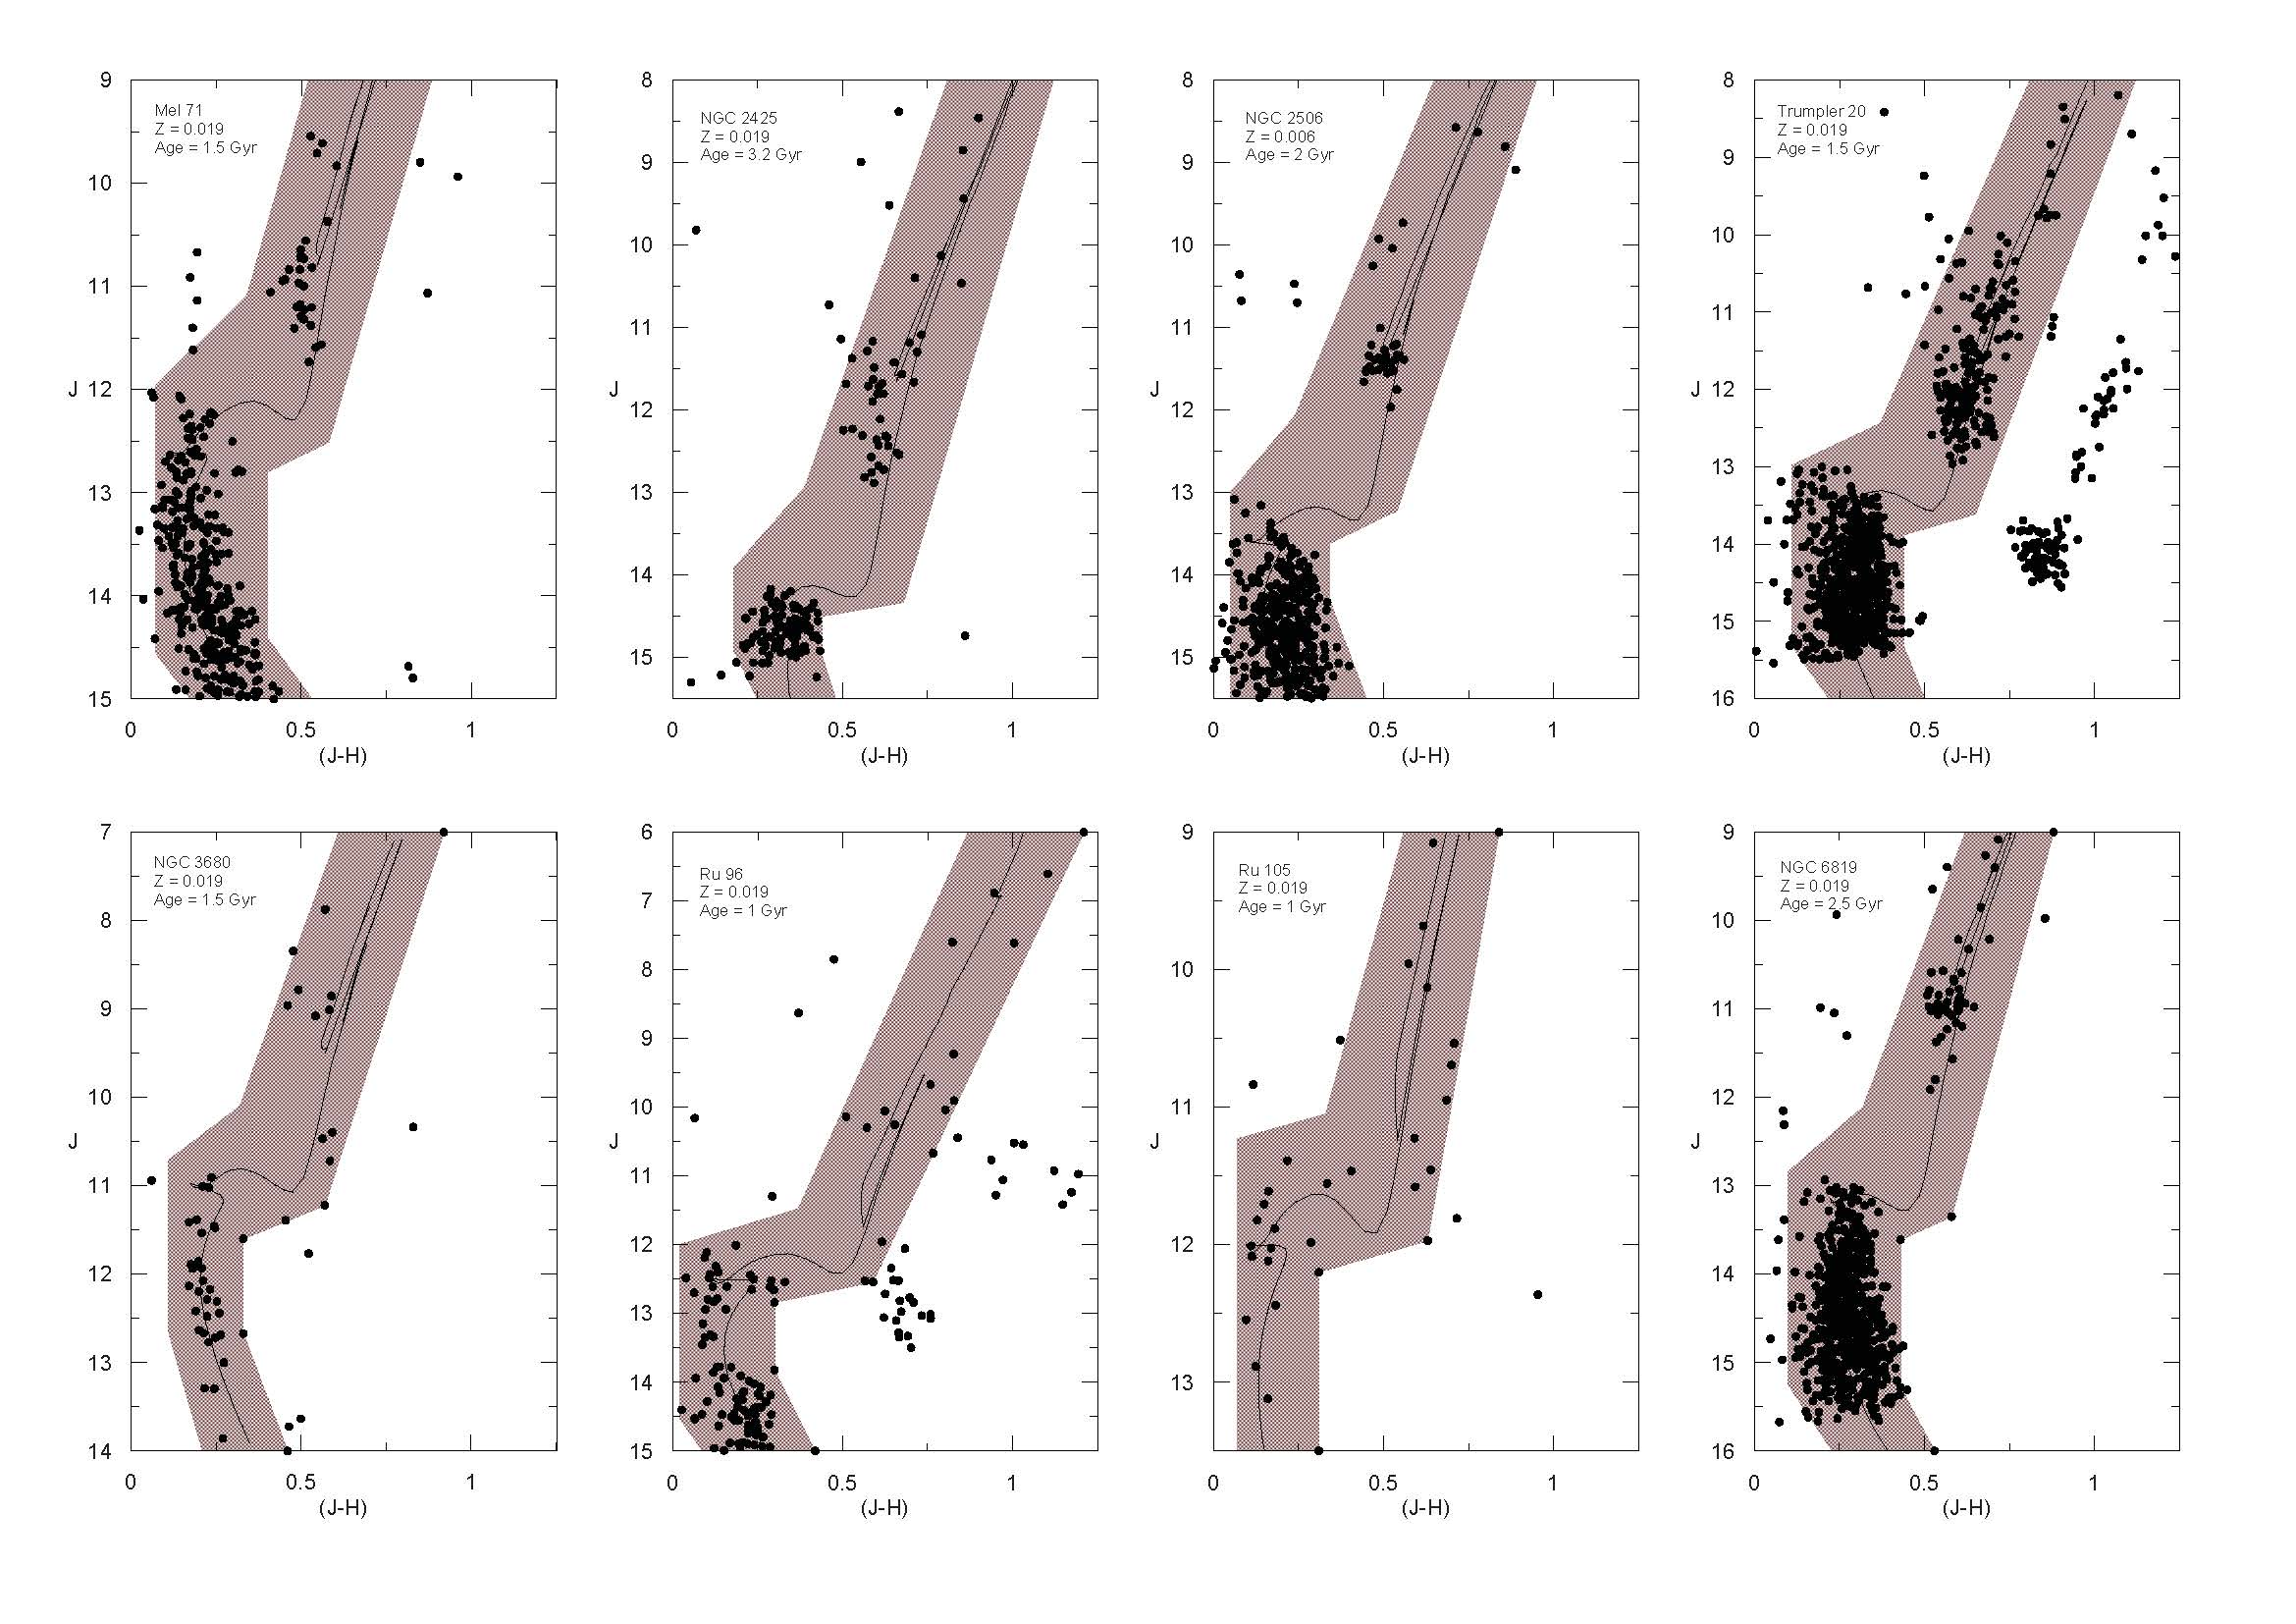
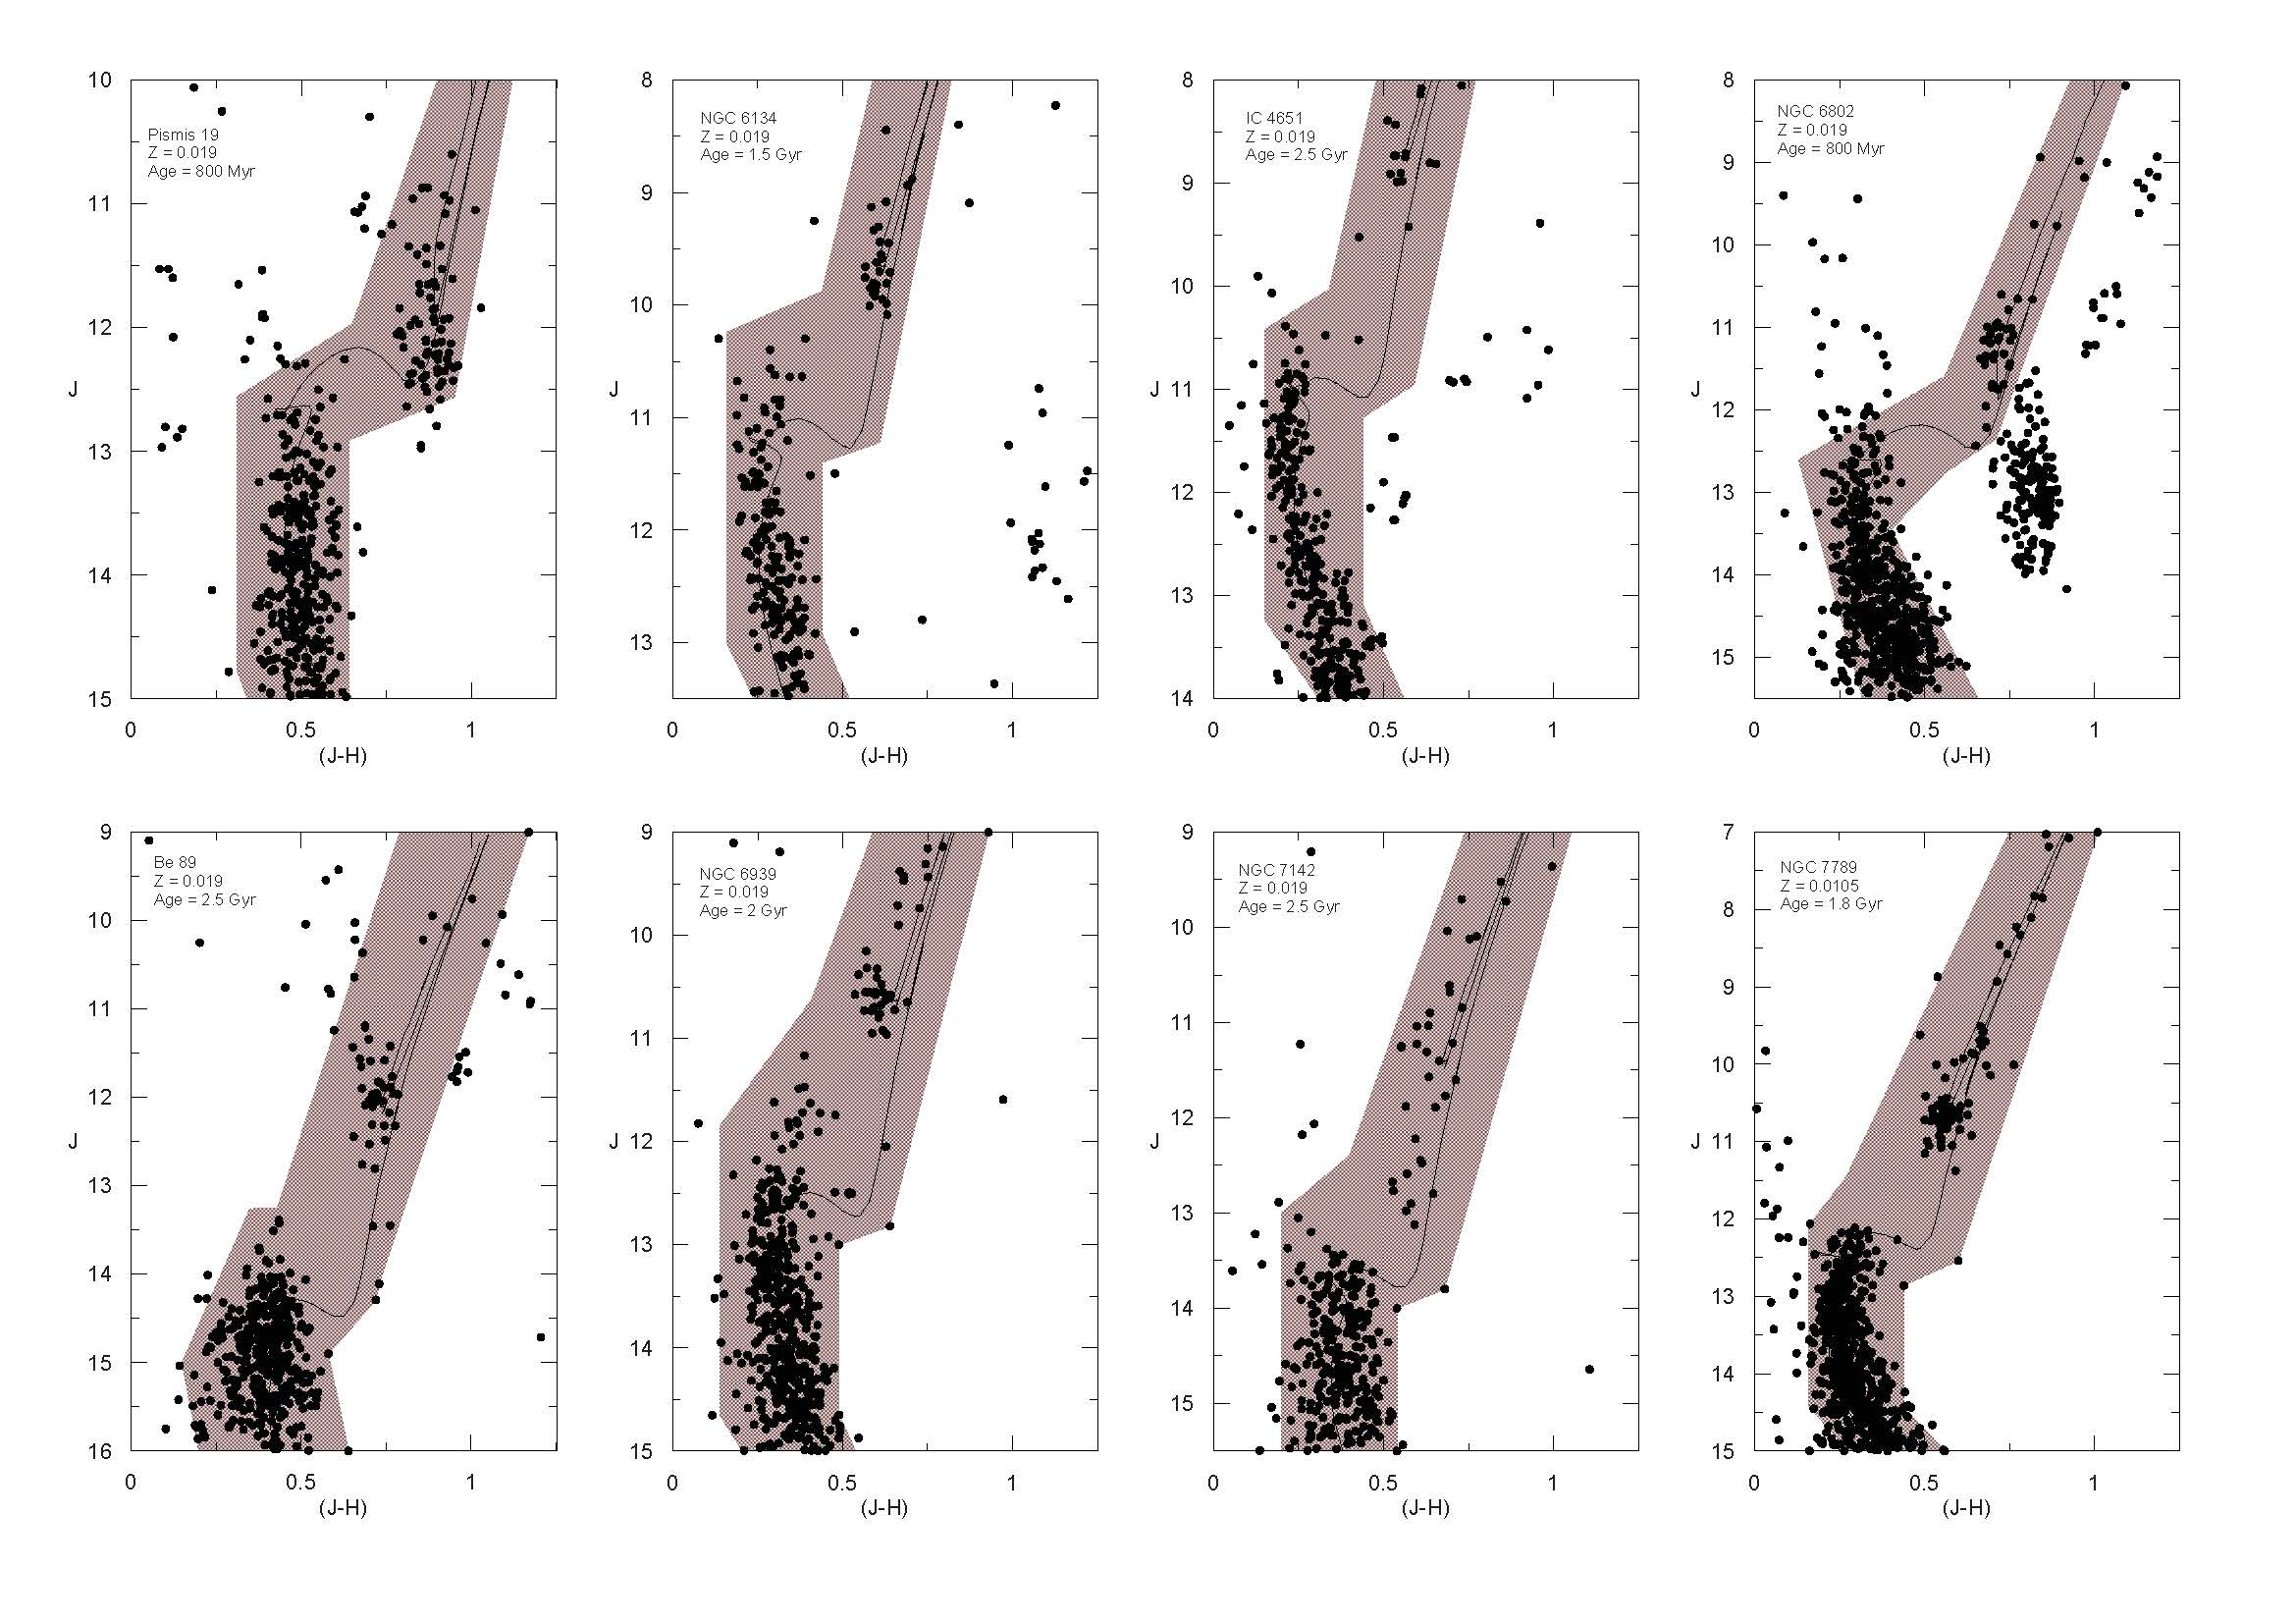
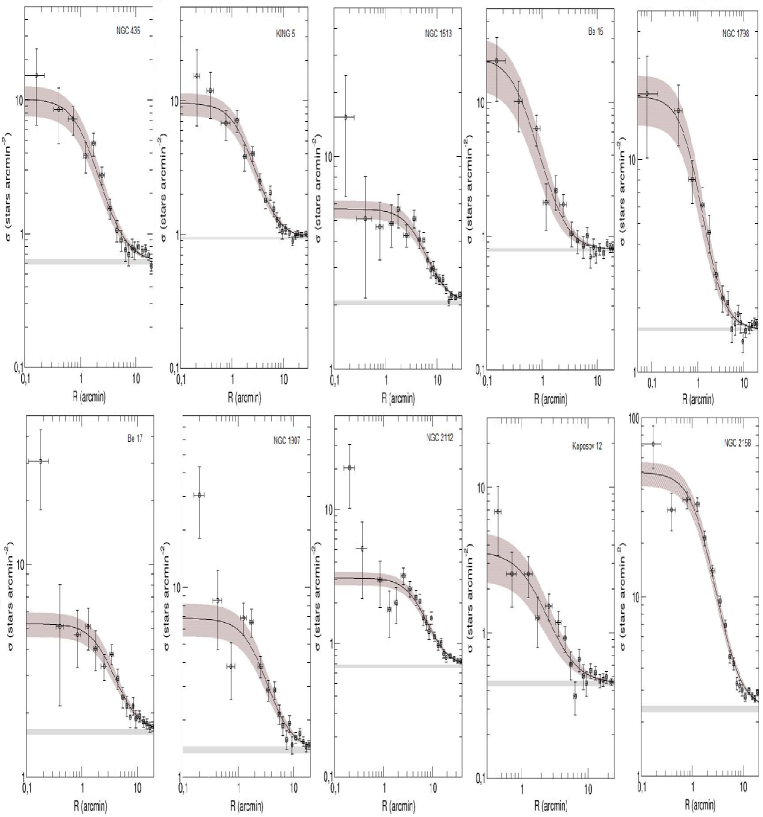
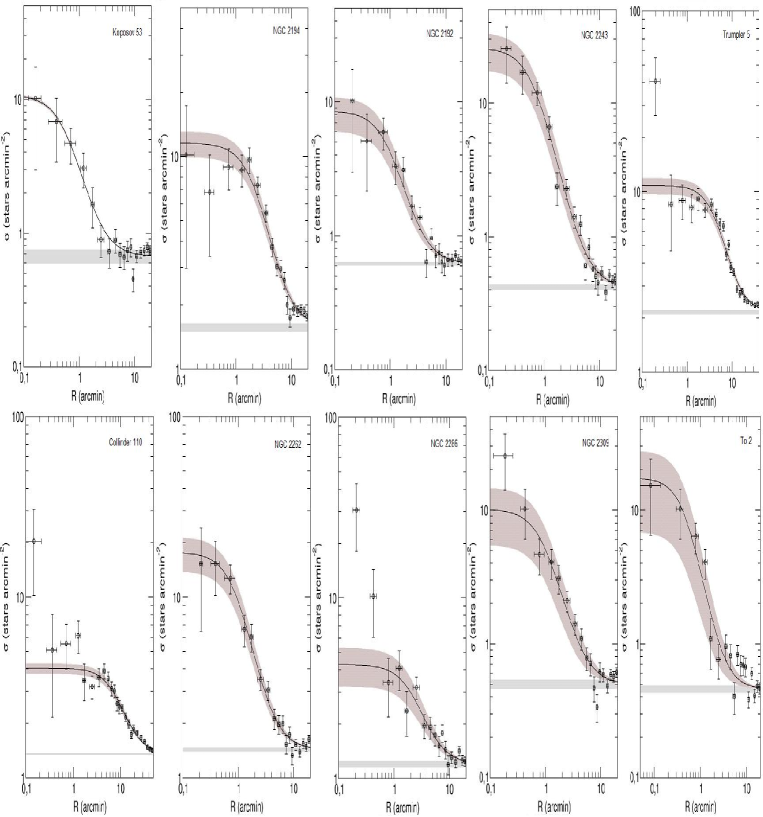
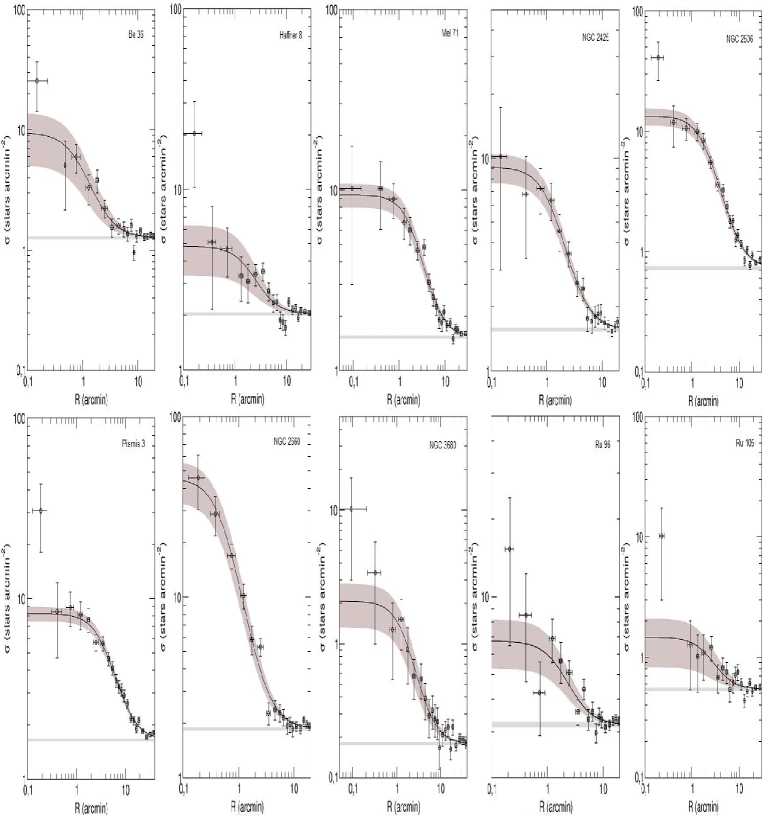
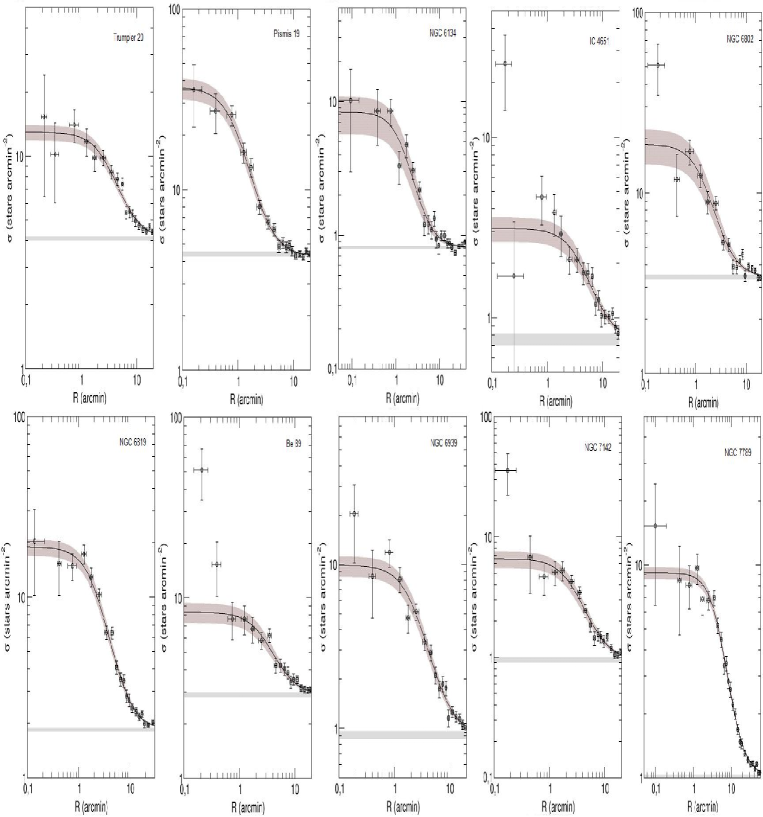
| NGC 436 | ||||||||||
| Evolved | Observed+Evolved | Extrapolated+Evolved | ||||||||
| Region | N* | mevol | 1.38-2.78 | - | N* | mobs | N* | mtot | ||
| (pc) | (Stars) | () | () | () | () | () | ||||
| 0.0-1.04 | 11 | 0.40.4 | -1.460.47 | - | 0.250.03 | 0.560.28 | 11.95.97 | 0.40.1 | 0.70.03 | 15.26.11 |
| 1.04-6.97 | 126 | 3.51.8 | 1.740.36 | - | 1.010.1 | 20.57 | 0.140.04 | 25.619.6 | 9.83.8 | 0.690.27 |
| 0.0-6.97 | 146 | 3.91.9 | 0.860.29 | - | 1.120.09 | 2.550.63 | 0.180.04 | 17.111.9 | 7.92.4 | 0.560.17 |
| King 5 | ||||||||||
| Evolved | Observed+Evolved | Extrapolated+Evolved | ||||||||
| Region | N* | mevol | 1.28-1.78 | - | N* | mobs | N* | mtot | ||
| (pc) | (Stars) | () | () | () | () | () | ||||
| 0.0-0.95 | 93 | 1.80.6 | -3.060.96 | - | 0.480.05 | 0.770.34 | 21.59.6 | 0.630.09 | 0.910.35 | 25.39.73 |
| 0.95-5.62 | 278 | 5.51.7 | 2.650.41 | - | 1.980.14 | 3.070.62 | 0.41.0.08 | 80.261.7 | 27.311.7 | 3.691.58 |
| 0.0-5.62 | 359 | 7.31.8 | 1.80.49 | - | 2.440.16 | 3.840.89 | 0.520.12 | 86.967.2 | 30.012.8 | 4.041.73 |
| NGC 1513 | ||||||||||
| Evolved | Observed+Evolved | Extrapolated+Evolved | ||||||||
| Region | N* | mevol | 0.68-0.98 | 0.98-3.33 | N* | mobs | N* | mtot | ||
| (pc) | (Stars) | () | () | () | () | () | ||||
| 0.0-1.65 | - | - | -3.370.52 | 1.120.24 | 1.770.11 | 2.310.27 | 12.31.41 | 10.87.65 | 4.541.43 | 24.17.6 |
| 1.65-6.51 | - | - | - | 2.080.17 | 4.250.3 | 50.42 | 0.440.04 | 45.234.6 | 15.46.42 | 1.350.57 |
| 0.0-6.51 | - | - | - | 1.90.12 | 5.90.32 | 7.130.46 | 0.620.04 | 58.644.4 | 20.48.23 | 1.770.71 |
| Be 15 | ||||||||||
| Evolved | Observed+Evolved | Extrapolated+Evolved | ||||||||
| Region | N* | mevol | 2.03-2.68 | - | N* | mobs | N* | mtot | ||
| (pc) | (Stars) | () | () | () | () | () | ||||
| 0.0-1.16 | - | - | - | - | - | - | - | - | - | - |
| 1.16-5.73 | - | - | -3.071.07 | - | 0.350.09 | 0.831.11 | 0.150.21 | 0.610.28 | 1.231.19 | 0.230.22 |
| 0.0-5.73 | - | - | -1.541.15 | - | 0.420.09 | 11.4 | 0.190.26 | 1.20.83 | 1.961.73 | 0.360.32 |
| NGC 1907 | ||||||||||
| Evolved | Observed+Evolved | Extrapolated+Evolved | ||||||||
| Region | N* | mevol | 1.18-2.83 | - | N* | mobs | N* | mtot | ||
| (pc) | (Stars) | () | () | () | () | () | ||||
| 0.0-1.28 | 93 | 2.50.9 | -0.760.4 | - | 0.780.07 | 1.680.61 | 19.26.99 | 1.622.02 | 2.240.84 | 25.59.55 |
| 1.28-4.26 | 33 | 0.91 | -0.730.43 | - | 1.60.11 | 2.810.93 | 0.890.3 | 3.698.12 | 42.42 | 1.270.77 |
| 0.0-4.26 | 125 | 3.51.3 | 0.00.23 | - | 2.360.14 | 4.560.91 | 1.410.28 | - | - | - |
| NGC 2112 | ||||||||||
| Evolved | Observed+Evolved | Extrapolated+Evolved | ||||||||
| Region | N* | mevol | 0.93-1.63 | - | N* | mobs | N* | mtot | ||
| (pc) | (Stars) | () | () | () | () | () | ||||
| 0.0-1.64 | 195 | 30.8 | -1.280.51 | - | 1.560.09 | 2.060.34 | 11.11.86 | 2.83.7 | 2.731.17 | 14.86.36 |
| 1.64-5.92 | 108 | 1.61.4 | 0.260.39 | - | 3.590.23 | 4.330.5 | 0.510.06 | - | - | - |
| 0.0-5.92 | 2810 | 4.61.6 | 0.50.42 | - | 5.110.24 | 6.380.78 | 0.730.09 | 44.931.5 | 18.15.96 | 2.080.69 |
| NGC 2158 | ||||||||||
| Evolved | Observed+Evolved | Extrapolated+Evolved | ||||||||
| Region | N* | mevol | 1.28-1.53 | - | N* | mobs | N* | mtot | ||
| (pc) | (Stars) | () | () | () | () | () | ||||
| 0.0-1.74 | 578 | 8.71.2 | -4.241 | - | 1.90.11 | 2.740.91 | 12.44.12 | 4.210.82 | 5.211.27 | 23.65.74 |
| 1.74-14.03 | 20322 | 30.80.3.3 | -0.080.6 | - | 8.390.31 | 122.56 | 0.1.0.02 | - | - | - |
| 0.0-14.03 | 26023 | 39.63.5 | -1.550.71 | - | 10.30.33 | 14.73.69 | 1.270.04 | - | 33.426.6 | 0.290.23 |
| Koposov 53 | ||||||||||
| Evolved | Observed+Evolved | Extrapolated+Evolved | ||||||||
| Region | N* | mevol | 1.28-2.08 | - | N* | mobs | N* | mtot | ||
| (pc) | (Stars) | () | () | () | () | () | ||||
| 0.0-0.66 | 21 | 0.4.0.3 | -3.96 3.4 | - | - | - | - | - | - | - |
| 0.66-4.18 | 13 | 0.30.6 | 1.360.92 | - | 0.260.05 | 0.430.26 | 0.140.08 | 7.336.22 | 2.621.3 | 0.860.43 |
| 0.0-4.18 | 33 | 0.50.7 | 0.930.81 | - | 0.330.05 | 0.540.28 | 0.180.09 | 5.945.15 | 2.371.1 | 0.780.36 |
| NGC 2194 | ||||||||||
| Evolved | Observed+Evolved | Extrapolated+Evolved | ||||||||
| Region | N* | mevol | 1.23-1.98 | - | N* | mobs | N* | mtot | ||
| (pc) | (Stars) | () | () | () | () | () | ||||
| 0.0-1.66 | 185 | 4.11.0 | 0.380.42 | - | 1.390.09 | 2.270.5 | 11.92.6 | 14.59.81 | 6.841.96 | 35.710.2 |
| 1.66-6.55 | 197 | 4.31.6 | 3.650.48 | - | 3.80.17 | 5.691.38 | 0.49.0.12 | 159123 | 53.223.3 | 4.62.01 |
| 0.0-6.55 | 389 | 8.41.9 | 2.520.37 | - | 5.180.2 | 8.031.56 | 0.680.13 | 170129 | 58.424.3 | 4.962.07 |
| NGC 2192 | ||||||||||
| Evolved | Observed+Evolved | Extrapolated+Evolved | ||||||||
| Region | N* | mevol | 1.43-1.68 | - | N* | mobs | N* | mtot | ||
| (pc) | (Stars) | () | () | () | () | () | ||||
| 0.0-1.11 | 21 | 0.30.3 | -2.780.96 | - | 0.170.03 | 0.270.16 | 4.712.77 | 0.270.06 | 0.370.17 | 6.492.89 |
| 1.11-5.47 | 175 | 3.31 | -3.070.76 | - | 0.620.07 | 1.030.36 | 0.150.05 | 1.320.26 | 1.780.45 | 0.260.07 |
| 0.0-5.47 | 196 | 3.51 | -3.120.43 | - | 0.790.08 | 1.280.28 | 0.190.04 | 1.70.21 | 2.270.35 | 0.330.05 |
| NGC 2243 | ||||||||||
| Evolved | Observed+Evolved | Extrapolated+Evolved | ||||||||
| Region | N* | mevol | 1.43-1.63 | - | N* | mobs | N* | mtot | ||
| (pc) | (Stars) | () | () | () | () | () | ||||
| 0.0-0.89 | 63 | 1.0.4 | - | - | - | - | - | - | - | - |
| 0.89-12.94 | 2910 | 4.81.6 | 4.811.16 | - | 1.330.08 | 1.991.31 | 0.030.01 | 198182 | 65.139.5 | 0.720.43 |
| 0.0-12.94 | 3610 | 5.8.11.7 | 2.091.01 | - | 1.490.08 | 2.261.35 | 0.030.01 | 154136 | 51.729.0 | 0.570.32 |
| Trumpler 5 | ||||||||||
| Evolved | Observed+Evolved | Extrapolated+Evolved | ||||||||
| Region | N* | mevol | 1.18-1.43 | - | N* | mobs | N* | mtot | ||
| (pc) | (Stars) | () | () | () | () | () | ||||
| 0.0-3.86 | 9312 | 13.21.7 | 0.420.75 | - | 4.350.18 | 5.751.23 | 2.390.51 | 879693 | 340138 | 14.15.72 |
| 3.86-15.18 | 16934 | 244.9 | 1.641.43 | - | 11.20.5 | 14.76.37 | 0.10.04 | 530444 | 16988.8 | 1.190.62 |
| 0.0-15.18 | 26237 | 37.25.2 | 1.321.18 | - | 15.60.54 | 20.47.15 | 0.140.05 | 699568 | 223111 | 1.550.76 |
| Col 110 | ||||||||||
| Evolved | Observed+Evolved | Extrapolated+Evolved | ||||||||
| Region | N* | mevol | 1.08-1.48 | - | N* | mobs | N* | mtot | ||
| (pc) | (Stars) | () | () | () | () | () | ||||
| 0.0-6.25 | 9312 | 13.11.7 | -2.580.21 | - | 4.570.19 | 5.910.41 | 0.580.04 | 7.971 | 8.540.56 | 0.830.05 |
| 6.25-12.12 | 7016 | 102.3 | -1.840.51 | - | 4.50.26 | 5.780.86 | 0.090.01 | 106.74 | 9.672.45 | 0.150.04 |
| 0.0-12.12 | 16321 | 23.13 | -2.840.57 | - | 9.060.34 | 11.71.84 | 0.160.02 | 15.13.95 | 16.52.44 | 0.220.03 |
| NGC 2262 | ||||||||||
| Evolved | Observed+Evolved | Extrapolated+Evolved | ||||||||
| Region | N* | mevol | 1.33-1.83 | - | N* | mobs | N* | mtot | ||
| (pc) | (Stars) | () | () | () | () | () | ||||
| 0.0-0.85 | 93 | 0. 160.06 | -1.490.80 | - | 0.260.04 | 0.430.16 | 21.88.3 | 0.50.2 | 0.60.2 | 31.89.59 |
| 0.85-6.37 | 228 | 0.420.15 | 1.320.61 | - | 2.120.14 | 3.351.12 | 0.310.1 | 79.563 | 27.612.4 | 2.61.1 |
| 0.0-6.37 | 318 | 0.590.16 | 1.010.44 | - | 2.40.14 | 3.80.9 | 0.350.08 | 64.449 | 24.19.4 | 2.20.87 |
| NGC 2286 | ||||||||||
| Evolved | Observed+Evolved | Extrapolated+Evolved | ||||||||
| Region | N* | mevol | 0.98-2.03 | - | N* | mobs | N* | mtot | ||
| (pc) | (Stars) | () | () | () | () | () | ||||
| 0.0-1.59 | 22 | 0.40.4 | 1.30.5 | - | 0.460.05 | 0.620.17 | 3.931.02 | 64.6 | 2.30.9 | 13.75.31 |
| 1.59-6.39 | 35 | 0.61 | 1.760.33 | - | 1.550.14 | 2.080.34 | 0.190.03 | 2720.4 | 9.33.8 | 0.860.35 |
| 0.0-6.39 | 55 | 11 | 1.450.3 | - | 1.980.15 | 2.70.39 | 0.250.04 | 31.523.6 | 11.14.4 | 1.010.4 |
| NGC 2309 | ||||||||||
| Evolved | Observed+Evolved | Extrapolated+Evolved | ||||||||
| Region | N* | mevol | 1.68-2.53 | - | N* | mobs | N* | mtot | ||
| (pc) | (Stars) | () | () | () | () | () | ||||
| 0.0-0.84 | - | - | -1.521.03 | - | 0.190.03 | 0.410.46 | - | 0.360.18 | 0.580.48 | 23.419.3 |
| 0.84-7.5 | - | - | -0.840.93 | - | 0.980.08 | 2.052 | 0.120.11 | - | 3.873.46 | 0.220.2 |
| 0.0-7.5 | - | - | -0.890.6 | - | 1.160.09 | 2.431.54 | 0.140.09 | - | 4.52.51 | 0.250.14 |
| Be 36 | ||||||||||
| Evolved | Observed+Evolved | Extrapolated+Evolved | ||||||||
| Region | N* | mevol | - | - | N* | mobs | N* | mtot | ||
| (pc) | (Stars) | () | () | () | () | () | ||||
| 0.0-1.32 | 154 | 2.10.6 | - | - | - | - | - | - | - | - |
| 1.32-13.39 | 8319 | 11.82.7 | - | - | - | - | - | - | - | - |
| 0.0-13.39 | 9820 | 13.82.8 | - | - | - | - | - | - | - | - |
| Haffner 8 | ||||||||||
| Evolved | Observed+Evolved | Extrapolated+Evolved | ||||||||
| Region | N* | mevol | 1.08-1.88 | - | N* | mobs | N* | mtot | ||
| (pc) | (Stars) | () | () | () | () | () | ||||
| 0.0-1.47 | - | - | 1.280.77 | - | 0.290.05 | 0.40.16 | 2.270.9 | 5.985.23 | 2.071.05 | 11.65.88 |
| 1.47-6.93 | - | - | 1.990.71 | - | 1.020.15 | 1.390.48 | 0.10.03 | 2519.6 | 8.433.75 | 0.610.27 |
| 0.0-6.93 | - | - | 1.820.59 | - | 1.230.16 | 1.690.5 | 0.120.04 | 29.122.5 | 9.854.27 | 0.710.31 |
| Mel 71 | ||||||||||
| Evolved | Observed+Evolved | Extrapolated+Evolved | ||||||||
| Region | N* | mevol | 1.08-1.78 | - | N* | mobs | N* | mtot | ||
| (pc) | (Stars) | () | () | () | () | () | ||||
| 0.0-1.27 | 134 | 2.40.7 | 0.31.04 | - | 0.770.06 | 1.130.44 | 13.15.11 | - | - | - |
| 1.27-5.0 | 187 | 3.21.3 | 1.820.42 | - | 2.40.15 | 3.390.63 | 0.660.12 | 62.947.8 | 21.48.95 | 4.161.74 |
| 0.0-5.0 | 318 | 5.51.4 | 1.290.4 | - | 3.170.16 | 4.440.72 | 0.850.14 | 64.149.0 | 21.89.21 | 4.261.76 |
| NGC 2506 | ||||||||||
| Evolved | Observed+Evolved | Extrapolated+Evolved | ||||||||
| Region | N* | mevol | 1.23-1.53 | - | N* | mobs | N* | mtot | ||
| (pc) | (Stars) | () | () | () | () | () | ||||
| 0.0-1.65 | 174 | 2.80.7 | 4.111.63 | - | 1.140.07 | 1.691.21 | 8.966.42 | 75.874.4 | 25.116.5 | 13387.9 |
| 1.65-10.76 | 4513 | 7.42.2 | 1.480.6 | - | 4.430.21 | 6.161.45 | 0.12.0.03 | 207161 | 68.230.6 | 1.310.59 |
| 0.0-10.76 | 6314 | 10.22.3 | 0.970.63 | - | 5.580.22 | 7.771.9 | 0.150.04 | 188151 | 65.829.4 | 1.260.56 |
| Pismis 3 | ||||||||||
| Evolved | Observed+Evolved | Extrapolated+Evolved | ||||||||
| Region | N* | mevol | 1.13-1.38 | - | N* | mobs | N* | mtot | ||
| (pc) | (Stars) | () | () | () | () | () | ||||
| 0.0-2.1 | 639 | 8.61.3 | -1.60.84 | - | 2.770.14 | 3.540.74 | 6.771.41 | 8.3416.6 | 7.455.43 | 14.210.4 |
| 2.1-8.58 | 2921 | 40.2.8 | 2.940.56 | - | 6.370.34 | 7.91.32 | 0.31.0.05 | 345267 | 10949.8 | 4.191.92 |
| 0.0-8.58 | 9223 | 12.53.1 | 1.710.49 | - | 9.140.38 | 11.41.59 | 0.430.06 | 418321 | 13359.8 | 5.032.26 |
| NGC 3680 | ||||||||||
| Evolved | Observed+Evolved | Extrapolated+Evolved | ||||||||
| Region | N* | mevol | 1.08-1.48 | - | N* | mobs | N* | mtot | ||
| (pc) | (Stars) | () | () | () | () | () | ||||
| 0.0-0.47 | 42 | 0.70.4 | - | - | - | - | - | - | - | - |
| 0.47-2.98 | 114 | 1.90.8 | 0.241.04 | - | 0.360.06 | 0.440.16 | 0.570.16 | - | - | - |
| 0.0-1.72 | 145 | 2.60.8 | -1.22.03 | - | 0.550.08 | 0.770.35 | 0.70.32 | - | - | - |
| Ru 96 | ||||||||||
| Evolved | Observed+Evolved | Extrapolated+Evolved | ||||||||
| Region | N* | mevol | 1.33-1.93 | - | N* | mobs | N* | mtot | ||
| (pc) | (Stars) | () | () | () | () | () | ||||
| 0.0-1.43 | 73 | 1.40.7 | 4.580.98 | - | 0.360.05 | 0.710.37 | 5.752.99 | 23.921 | 8.154.46 | 66.536.4 |
| 1.43-2.6 | 94 | 1.80.9 | 6.180.72 | - | 0.520.07 | 0.820.29 | 1.340.48 | 32.526.6 | 10.95.3 | 17.78.63 |
| 0.0-2.6 | 156 | 3.11.1 | 4.550.65 | - | 0.920.09 | 1.490.48 | 2.020.66 | 46.537.3 | 15.87.36 | 21.410 |
| Ru 105 | ||||||||||
| Evolved | Observed+Evolved | Extrapolated+Evolved | ||||||||
| Region | N* | mevol | - | - | N* | mobs | N* | mtot | ||
| (pc) | (Stars) | () | () | () | () | () | ||||
| 0.0-1.79 | 104 | 2.20.8 | - | - | - | - | - | - | - | - |
| 1.79-3.83 | 95 | 1.81.1 | - | - | - | - | - | - | - | - |
| 0.0-3.83 | 197 | 41.4 | - | - | - | - | - | - | - | - |
| Trumpler 20 | ||||||||||
| Evolved | Observed+Evolved | Extrapolated+Evolved | ||||||||
| Region | N* | mevol | 1.38-1.78 | - | N* | mobs | N* | mtot | ||
| (pc) | (Stars) | () | () | () | () | () | ||||
| 0.0-3.12 | 6910 | 12.31.8 | -1.070.5 | - | 2.181.35 | 3.580.79 | 2.810.62 | 6.710.8 | 6.943.32 | 5.452.61 |
| 3.12-13.98 | 18832 | 33.65.7 | 2.850.95 | - | 7.90.45 | 12.65.46 | 0.110.05 | 379326 | 13068.2 | 1.150.6 |
| 0.0-13.98 | 25634 | 45.96 | 2.060.68 | - | 10.10.47 | 16.24.96 | 0.140.04 | 434350 | 15069.9 | 1.310.61 |
| Pismis 19 | ||||||||||
| Evolved | Observed+Evolved | Extrapolated+Evolved | ||||||||
| Region | N* | mevol | 1.38-2.18 | - | N* | mobs | N* | mtot | ||
| (pc) | (Stars) | () | () | () | () | () | ||||
| 0.0-0.54 | 144 | 3.10.9 | -2.421.07 | - | 0.630.06 | 1.160.71 | 175108 | 0.950.23 | 1.470.74 | 222112 |
| 0.54-6.16 | 2612 | 5.92.7 | 1.570.4 | - | 5.160.3 | 8.912.55 | 0.910.26 | 173133 | 61.525.8 | 6.352.64 |
| 0.0-6.16 | 4013 | 92.9 | 1.180.38 | - | 5.380.28 | 9.192.69 | 1.030.28 | 158119 | 59.122.9 | 6.042.34 |
| NGC 6134 | ||||||||||
| Evolved | Observed+Evolved | Extrapolated+Evolved | ||||||||
| Region | N* | mevol | 1.28-1.78 | - | N* | mobs | N* | mtot | ||
| (pc) | (Stars) | () | () | () | () | () | ||||
| 0.0-0.45 | 93 | 1.50.5 | -0.950.9 | - | 0.340.04 | 0.520.20 | 13853.6 | - | 0.990.64 | 259167 |
| 0.45-3.08 | 4221 | 7.61.5 | -1.31.33 | - | 1.540.14 | 2.471.39 | 2.03.1.14 | - | 3.972.41 | 3.261.97 |
| 0.0-3.08 | 519 | 9.11.6 | -0.831.11 | - | 1.870.15 | 2.981.39 | 2.441.13 | - | - | - |
| IC 4651 | ||||||||||
| Evolved | Observed+Evolved | Extrapolated+Evolved | ||||||||
| Region | N* | mevol | 0.93-1.53 | - | N* | mobs | N* | mtot | ||
| (pc) | (Stars) | () | () | () | () | () | ||||
| 0.0-1.02 | 164 | 2.40.7 | -2.780.75 | - | 0.970.07 | 1.270.28 | 28.56.27 | 1.240.21 | 1.450.29 | 32.66.53 |
| 1.02-2.35 | 196 | 2.90.9 | 0.260.7 | - | 1.590.12 | 1.930.3 | 3.870.6 | - | - | - |
| 0.0-2.35 | 357 | 5.41.1 | -0.60.41 | - | 2.550.14 | 3.210.35 | 5.910.65 | - | - | - |
| NGC 6802 | ||||||||||
| Evolved | Observed+Evolved | Extrapolated+Evolved | ||||||||
| Region | N* | mevol | 1.28-2.08 | - | N* | mobs | N* | mtot | ||
| (pc) | (Stars) | () | () | () | () | () | ||||
| 0.0-1.03 | 184 | 3.90.9 | -0.460.84 | - | 1.020.07 | 1.80.88 | 39.419.2 | - | - | - |
| 1.03-4.24 | 257 | 5.31.4 | 2.40.24 | - | 3.590.17 | 5.770.85 | 1.830.27 | 12191.2 | 42.117 | 13.45.42 |
| 0.0-4.24 | 438 | 9.21.7 | 1.660.24 | - | 4.590.18 | 7.531.09 | 2.360.34 | 13097.7 | 46.418.3 | 14.55.72 |
| NGC 6819 | ||||||||||
| Evolved | Observed+Evolved | Extrapolated+Evolved | ||||||||
| Region | N* | mevol | 1.03-1.53 | - | N* | mobs | N* | mtot | ||
| (pc) | (Stars) | () | () | () | () | () | ||||
| 0.0-1.5 | 326 | 4.90.9 | -1.070.55 | - | 1.940.1 | 2.60.45 | 18.43.2 | - | 4.574.19 | 32.329.6 |
| 1.5-12.92 | 6823 | 10.33.5 | 0.960.42 | - | 8.710.41 | 111.4 | 0.120.01 | 152114 | 53.621.4 | 0.590.24 |
| 0.0-12.92 | 10024 | 15.13.7 | 0.470.4 | - | 10.60.42 | 13.61.63 | 0.150.02 | 12487.5 | 49.116.5 | 0.540.18 |
| Be 89 | ||||||||||
| Evolved | Observed+Evolved | Extrapolated+Evolved | ||||||||
| Region | N* | mevol | 1.13-1.63 | - | N* | mobs | N* | mtot | ||
| (pc) | (Stars) | () | () | () | () | () | ||||
| 0.0-2.75 | 115 | 1.90.8 | 0.180.66 | - | 1.150.09 | 1.560.37 | 1.790.43 | - | - | - |
| 2.75-7.48 | 1210 | 21.7 | 1.271.05 | - | 2.120.21 | 2.841.13 | 0.170.07 | 62.560.5 | 20.912.3 | 1.250.74 |
| 0.0-7.48 | 2312 | 3.81.9 | 1.640.93 | - | 3.260.23 | 4.421.57 | 0.250.09 | 9675.8 | 3214.6 | 1.830.83 |
| NGC 6939 | ||||||||||
| Evolved | Observed+Evolved | Extrapolated+Evolved | ||||||||
| Region | N* | mevol | 1.03-1.63 | - | N* | mobs | N* | mtot | ||
| (pc) | (Stars) | () | () | () | () | () | ||||
| 0.0-1.16 | 255 | 4.0.8 | -2.17 0.66 | - | 1.010.07 | 1.440.31 | 224.7 | 1.450.44 | 1.750.35 | 26.75.53 |
| 1.16-4.92 | 439 | 71.5 | -0.510.46 | - | 3.30.16 | 4.470.71 | 1.410.22 | - | - | - |
| 0.0-4.92 | 6810 | 11.11.7 | -0.840.46 | - | 4.30.17 | 5.890.91 | 1.820.28 | - | - | - |
| NGC 7142 | ||||||||||
| Evolved | Observed+Evolved | Extrapolated+Evolved | ||||||||
| Region | N* | mevol | 1.18-1.53 | - | N* | mobs | N* | mtot | ||
| (pc) | (Stars) | () | () | () | () | () | ||||
| 0.0-1.98 | 225 | 3.40.8 | -1.97 1.44 | - | 0.960.07 | 1.360.68 | 4.192.09 | - | 2.481.19 | 7.613.67 |
| 1.98-11.19 | 8518 | 12.92.7 | -0.580.68 | - | 4.240.25 | 5.861.35 | 0.10.02 | - | - | - |
| 0.0-11.19 | 10719 | 16.32.9 | -1.060.56 | - | 5.210.25 | 7.221.38 | 0.120.02 | - | - | - |
| NGC 7789 | ||||||||||
| Evolved | Observed+Evolved | Extrapolated+Evolved | ||||||||
| Region | N* | mevol | 1.08-1.38 | - | N* | mobs | N* | mtot | ||
| (pc) | (Stars) | () | () | () | () | () | ||||
| 0.0-2.32 | 749 | 121.5 | -0.420.45 | - | 3.870.14 | 5.40.82 | 10.31.56 | - | - | - |
| 2.32-26.88 | 14760 | 23.69.7 | 1.030.66 | - | 19.91.02 | 24.74.25 | 0.030.005 | 574471 | 19290.5 | 0.240.11 |
| 0.0-26.88 | 22161 | 35.69.8 | 0.790.65 | - | 23.81.03 | 29.74.87 | 0.040.006 | 556444 | 19485.5 | 0.240.1 |
Col. 1: the distance from the core. Cols. 2,6,9 : cluster stars for the regions in Col. 1.
Col. 4 gives the MF slopes (), derived for the low-mass and high-mass ranges.
The masses of , , and are listed in Cols. 3, 7 and 10, respectively.
The mass densities are given in Cols. 8 and 11.