KAT–7 observations of an unbiased sample of mass-selected galaxy clusters
Abstract
The presence of megaparsec-scale radio halos in galaxy clusters has already been established by many observations over the last two decades. The emerging explanation for the formation of these giant sources of diffuse synchrotron radio emission is that they trace turbulent regions in the intracluster medium, where particles are trapped and accelerated during cluster mergers. Our current observational knowledge is, however, mainly limited to massive systems. Here we present observations of a sample of 14 mass-selected galaxy clusters, i.e. M⊙, in the Southern Hemisphere, aimed to study the occurrence of radio halos in low mass clusters and test the correlation between the radio halo power at 1.4 GHz and the cluster mass . Our observations were performed with the 7-element Karoo Array Telescope at 1.86 GHz. We found three candidates to host diffuse cluster-scale emission and derived upper limits at the level of Watt Hz-1 for of the clusters in the sample, significantly increasing the number of clusters with radio halo information in the considered mass range. Our results confirm that bright radio halos in less massive galaxy clusters are statistically rare.
keywords:
Radio continuum: galaxies – Galaxies: clusters: general, – Galaxies: clusters: intracluster medium – Radio continuum: general1 Introduction
In the hierarchical model of structure formation, galaxy clusters form through the merging of smaller substructures. A fraction of the energy dissipated during these merging events can be channelled into the amplification of magnetic fields and acceleration of relativistic particles (see Brunetti & Jones 2014 for a review on the topic). Giant radio halos (RHs) are potential probes of this process. They are Mpc-scale diffuse radio sources with steep spectrum and low surface brightness that are found in the central regions of a number of galaxy clusters (see Feretti et al. 2012 for a recent observational review). In this respect clusters are crossroads between cosmology and plasma astrophysics.
Giant RHs have no obvious optical counterpart, and rather show a remarkable connection with the intracluster medium: their extent and morphology are closely related to the thermal Bremsstrahlung X–ray emission. One recent observational milestone, based on the Extended GMRT Radio Halo Cluster Survey (EGRHS, Venturi et al. 2007, 2008, Kale et al. 2013, 2015) and complemented with results from the literature, is that RHs are hosted in only 20–30% of X–ray luminous clusters ( erg s-1). Furthermore, clusters branch into two populations in the plane: they either host a RH whose radio power shows a tight correlation with the cluster X–ray luminosity , or are “radio–quiet”, with upper limits to the radio power of the undetected RH well below the correlation (Brunetti et al. 2007).
Remarkably, there is a tight connection between these RHs and cluster mergers (Cassano et al. 2010, 2013): a detailed and quantitative radio/X–ray analysis of the clusters in the EGRHS shows that giant radio halos are found only in dynamically interacting (merging) systems, whereas relaxed clusters do not produce diffuse emission on the Mpc-scale at the sensitivity level of current observations.
The recent advent of cluster surveys through the detection of the Sunyaev–Zeldovich (SZ) effect (e.g. with the Planck satellite) has allowed the study of the –111where is the total cluster mass within the radius , defined as the radius corresponding to a total density contrast , where is the critical density of the Universe at the cluster redshift. correlation (Basu et al. 2012, Cassano et al. 2013) , which shows that massive ( M⊙) clusters have a bimodal behaviour also in the radio–SZ diagram.
The commonly adopted scenario to explain the origin of RHs and their
connection with mergers is based on the (re)acceleration of relativistic
electrons by turbulence generated during clusters mergers (i.e., Brunetti & Jones 2014).
According to this scenario the formation and evolution of RHs depends on the
cluster merging rate at the different cosmic epochs and on the mass of the
hosting clusters, which ultimately sets the energy budget that can be
dissipated and drained in the relativistic particles and magnetic fields.
One of the key expectations is that giant RHs should be found in
massive/energetic merger events, and become rarer in less massive clusters
and eventually absent in relaxed systems (Cassano & Brunetti 2005).
In line with this scenario, Cuciti et al. (2015) recently found some evidences for an increasing occurrence of radio halos with the cluster mass. However, present statistical studies are essentially limited to very X-ray luminous ( erg s-1) and massive () galaxy clusters.
Extending these constraints both in redshift and to lower
cluster masses is vital to understand the origin of cluster-scale radio
emission and to test the predictions of theoretical models. However, this
means to explore the faint end of the correlation between cluster mass (or
X–ray luminosity) and radio power, which is challenging from an observational
point of view as RHs are expected to become progressively fainter in less massive systems.
A new opportunity is offered by the improved imaging sensitivity and sampling of angular scales of the new generation of radio interferometers. In particular, the precursors of the Square Kilometre Array (SKA) such as ASKAP and MeerKAT in the GHz regime and LOFAR (van Haarlem et al. 2013) and MWA (Tingay et al. 2013) at frequencies below 300 MHz, allow to extend earlier studies to a preliminary exploration of low mass nearby clusters.
Here we present the result of a pilot observational study carried out with the 7-antenna Karoo Array Telescope (KAT–7) designed to extend our knowledge of the occurrence of RHs in galaxy clusters to a mass–limited sample ( M⊙) of nearby clusters in the Southern Hemisphere.
The paper is organized as follows: in Section 2 we present the sample of galaxy clusters selected for this study; in Section 3 we describe the observations and the data reduction; in Section 4 we discuss the – correlation in the light of our results, and we conclude in Section 5.
2 The cluster sample
In order to complement the results based on the EGRHS, and to increase the information on the presence of diffuse radio emission (in the form of giant RHs) to lower mass clusters in the nearby Universe, we selected all the galaxy clusters from the Planck SZ Cluster Catalogue (Planck Collaboration, 2014) with the following criteria:
-
mass, M⊙;
-
redshift range, 222Note that a linear size of 1 Mpc corresponds to arcmin at z and arcmin at z .;
-
.
The sample includes 21 clusters, listed in Table 1 in order of decreasing mass. Except for RXC J 1407.8–5100, all clusters have high quality X–ray images, from and/or XMM–Newton. For four of them the presence of diffuse radio emission is known from the literature, hence they were not observed. In particular, RXC J 1638.2–6420 (the Triangulum Australis, Scaife et al., 2015) and A 754 (Macario et al. 2011) host a RH, A 3667 (Röttgering et al. 1997) is well–known for the double relics, and A 85 (Slee et al. 2001) hosts a diffuse steep–spectrum relic. Only 843 MHz images with a 43 arcsec 43 arcsec angular resolution from the Sydney University Molonglo Sky Survey (SUMSS, Bock, Large & Sadler 1999) or 1.4 GHz images at the resolution of 45 arcsec 45 arcsec from the Northern VLA Sky Survey (NVSS, Condon et al., 1998) are available for the remaining 17 clusters, which were observed with KAT–7.
3 Observations and data reduction
Our observations were carried out in February and March 2014 with KAT–7, the MeerKAT precursor array that comprises seven antennas, each with a diameter of 12 m, distributed in a randomized configuration that maximizes the coverage in already 4 hours, with baseline lengths ranging from 26 m to 185 m. It is located near the SKA core site in the Karoo semi-desert area, about 80 km north-west of Carnarvon in the Northern Cape, South Africa. KAT–7 operates in the GHz frequency range with an instantaneous 256 MHz bandwith correlated for continuum observations. Our observations were conducted at the central frequency of 1.86 GHz, with an effective (i.e. after excision of bad channels) 156.64 MHz bandwidth and a 390.625 kHz channel width. As the Triangulum Australis cluster was already observed, we included it in our analysis by using archive data taken at the central frequency of 1.33 GHz.
Out of the 17 clusters selected, A 1651 was not observed, data for A 2420 were contaminated by the Sun at the edge of the primary beam and A 2384 was only observed for three hours due to technical problems, giving a very limited coverage compared to the remaining targets (see Table 2).
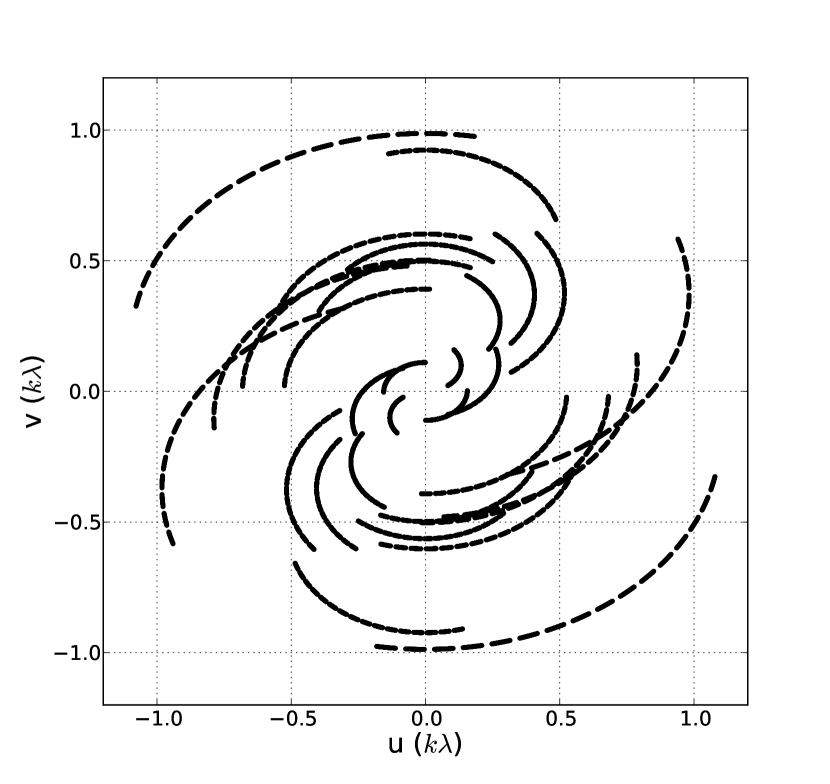
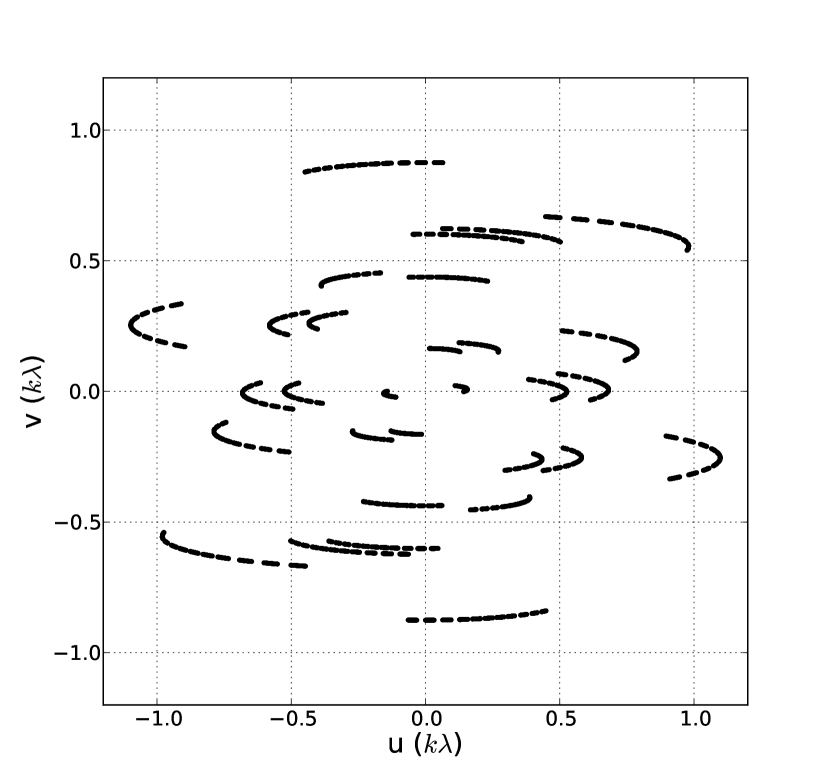
The cluster sample presented in this paper therefore contains 14 targets (although our analysis of the correlation will include A 754 and the Triangulum Australis clusters for which data were already available), each of them observed for 5 hours minimum in order to obtain a good coverage. Typical coverages are shown in Figure 1 for a high elevation (RXCJ 1358.9–4750, DEC) and for a low elevation (A 644, DEC) cluster respectively. Observation details are reported in Table 2.
The source PKS 1934–68 was used as bandpass and flux calibrator for each target and was observed several times throughout each observing run. PKS 1934–68 was modelled as a point source with flux density of 13.16 Jy at the central observing frequency according to the Perley & Butler (2013) flux scale.
| Cluster name | Other Name | RAJ2000 | DECJ2000 | z | kpc/” | M500 | Ref. |
|---|---|---|---|---|---|---|---|
| (1014M⊙) | |||||||
| RXCJ 1638.2–6420 | Triangulum | 16h 38m 18s.3 | –64∘ 21 07.0 | 0.051 | 1.00 | 7.91 | Scaife et al. (2015) |
| RXCJ 0431.4–6126 | A 3266 | 04h 31m 24s.1 | –61∘ 26 38.0 | 0.059 | 1.15 | 6.71 | This paper |
| RXCJ 0909.1–0939 | A 754 | 09h 09m 08s.4 | –09∘ 39 58.0 | 0.054 | 1.06 | 6.68 | Macario et al. (2011) |
| RCXJ 1407.8–5100 | 14h 07m 52s.5 | –51∘ 00 33.0 | 0.097 | 1.81 | 6.52 | This paper | |
| RXCJ 1631.6–7507 | A 3628 | 16h 31m 24s.0 | –75∘ 07 01.0 | 0.105 | 1.94 | 6.49 | This paper |
| RXCJ 2201.9–5956 | A 3827 | 22h 01m 56s.0 | –59∘ 56 58.0 | 0.098 | 1.82 | 5.93 | This paper |
| RXCJ 2012.5–5649 | A 3667 | 20h 12m 30s.5 | –56∘ 49 55.0 | 0.056 | 1.09 | 5.77 | Röttgering et al. (1997) |
| RXCJ 1358.9–4750 | 13h 59m 01s.6 | –47∘ 50 49.0 | 0.074 | 1.42 | 5.44 | This paper | |
| RXCJ 1259.3–0411 | A 1651 | 12h 59m 21s.5 | –04∘ 11 41.0 | 0.085 | 1.61 | 5.20 | – |
| RXCJ 041.8–0918 | A 85 | 22h 01m 56s.0 | –59∘ 56 58.0 | 0.056 | 1.09 | 4.90 | Slee et al. (2001) |
| RXCJ 0817.4-0730 | A 644 | 08h 17m 24s.5 | –07∘ 30 46.0 | 0.070 | 1.35 | 4.70 | This paper |
| RXCJ 2210.3–1210 | A 2420 | 22h 10m 19s.7 | –12∘ 10 34.6 | 0.085 | 1.61 | 4.48 | – |
| RXCJ 2249.9–6425 | A 3921 | 22h 49m 57s.0 | –64∘ 25 46.0 | 0.094 | 1.76 | 4.34 | This paper |
| RXCJ 2246.3–5243 | A 3911 | 22h 45m 28s.7 | –53∘ 02 08.0 | 0.097 | 1.81 | 4.31 | This paper |
| RXCJ 0552.8–2103 | A 550 | 05h 52m 52s.4 | –21∘ 03 25.0 | 0.099 | 1.84 | 4.23 | This paper |
| PSZ1G 018.75+23.57 | 17h 02m 22s.1 | –01∘ 00 16.0 | 0.089 | 1.67 | 4.21 | This paper | |
| RXCJ 0342.8–5338 | A 3158 | 03h 42m 53s.9 | –53∘ 38 07.0 | 0.059 | 1.15 | 4.20 | This paper |
| RXCJ 2154.1–5751 | A 3822 | 21h 54m 09s.2 | –57∘ 51 19.0 | 0.076 | 1.45 | 4.18 | This paper |
| RXCJ 2152.4–1933 | A 2384 | 21h 52m 14s.2 | –19∘ 42 20.0 | 0.094 | 1.76 | 4.11 | – |
| RXCJ 2034.7–3548 | A 3695 | 20h 34m 47s.9 | –35∘ 49 27.0 | 0.089 | 1.67 | 4.06 | This paper |
| RXCJ 1258.6–0145 | A 1650 | 12h 58m 41s.1 | –01∘ 45 25.0 | 0.085 | 1.61 | 4.00 | This paper |
The data reduction was carried out using the CASA333http://casa.nrao.edu software. The data were initially flagged to excise RFI and the bandpass, i.e. antenna complex gains as a function of frequency, was derived for PKS 1934–68 and then applied to the target visibilities. Calibrated visibilities were Fourier transformed to an image using the w-projection algorithm (Perley & Cornwell 1991) to account for the array non coplanarity. Briggs weights (Briggs 1995) with robust parameter 0.5 were used in imaging in order to achieve a tradeoff between angular resolution and sensitivity to diffuse emission. Images were deconvolved using the Cotton–Schwab algorithm until the first negative component was found. Such sky model was then used for a phase selfcalibration where antenna phase variations were solved for in a 5 minute interval. After selfcalibration, gain solutions were applied and visibility data Fourier transformed into an image that was deconvolved down to a 1 mJy threshold to obtain the final images. For selfcalibration and deconvolution purposes, a field of view was imaged, although we show here only the inner deconvolved images in Appendix A. We conservatively estimate that residual amplitude calibration errors are smaller than 5%.
Given the limited KAT–7 angular resolution, we expect the noise in the central portion of the images to be a combination of the thermal and confusion contributions respectively (calibration errors play a minor role as the dynamic range of the images is of the order of a few thousands to one at most). We estimated noise values (see Table 2) as the rms in areas that appear void of detectable sources, finding them at the mJy level across the whole target sample and steadily decreasing to Jy at the edge of the images, indeed indicating that confusion contributes to the noise budget at the image centre. An estimate of the confusion level can be obtained as (Condon 1987):
| (1) |
that gives a confusion noise at the 0.7 mJy level in the KAT–7 images. A similar value could be estimated from the independent measurements by Garrett et al. (2000), indicating that our observations are likely approaching the confusion level at the image centre.
| Cluster name | Obs. time | Noise rms | Angular | RH powers and UL |
|---|---|---|---|---|
| (hour) | (mJy beam-1) | resolution | (, Watt Hz-1) | |
| Triangulum | 12 | 0.73 | 2.9 | 23.73 |
| A 3266 | 7 | 0.72 | 2.7 | - |
| RCXJ 1407.8–5100 | 6 | 0.47 | 2.9 | - |
| A 3628 | 9 | 1.0 | 2.8 | - |
| A 3827 | 6 | 0.53 | 2.8 | - |
| RXCJ 1358.9–4750 | 6 | 0.50 | 2.5 | 24.00 |
| A 644 | 5 | 0.66 | 2.6 | 23.95 |
| A 3921 | 5 | 0.42 | 2.8 | 24.22 |
| A 3911 | 7 | 0.51 | 2.5 | - |
| A 550 | 6 | 0.77 | 2.5 | 24.27 |
| PSZ1G 018.75+23.57 | 6 | 0.39 | 2.8 | 24.15 |
| A 3158 | 8 | 0.30 | 2.4 | 23.79 |
| A 3822 | 5 | 0.48 | 2.8 | 24.02 |
| A 3695 | 7 | 0.90 | 2.6 | - |
| A 1650 | 5 | 0.52 | 2.7 | 24.12 |
4 Images and upper limits
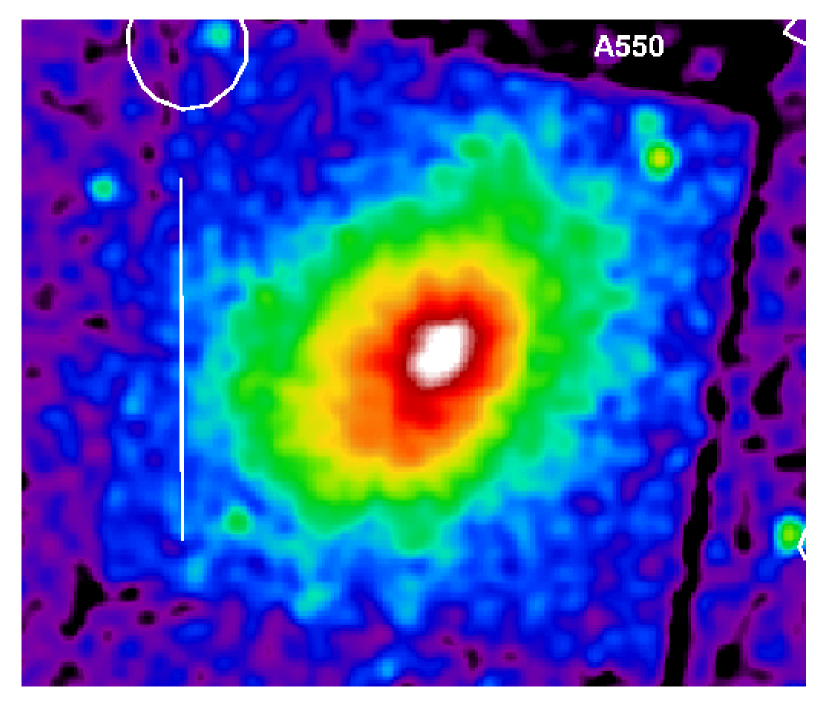
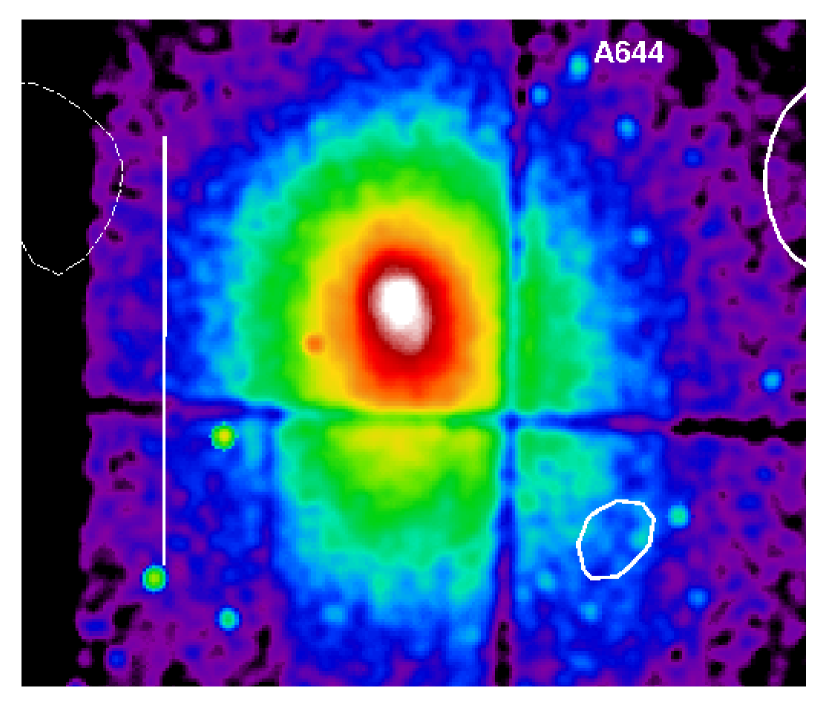
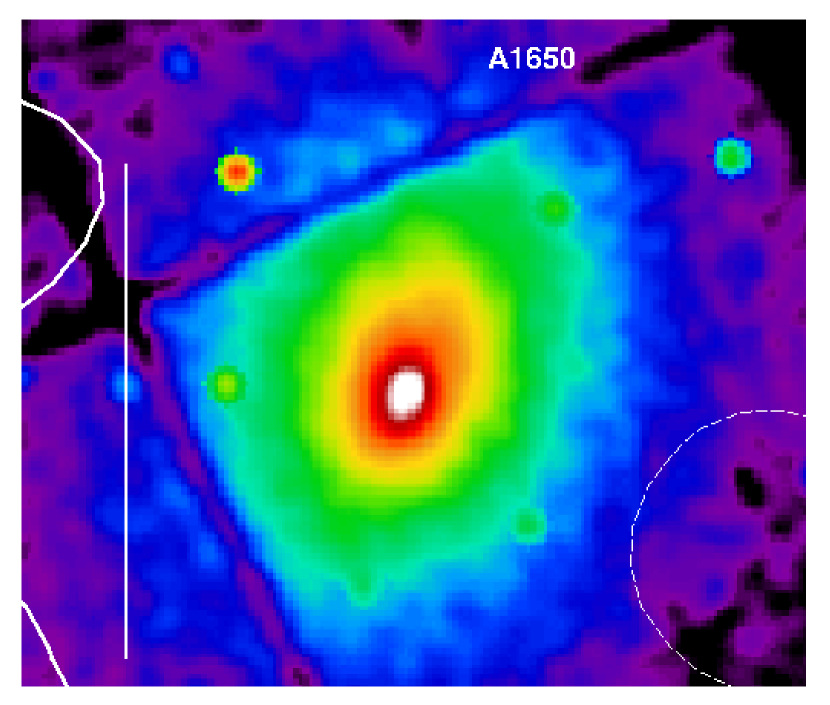
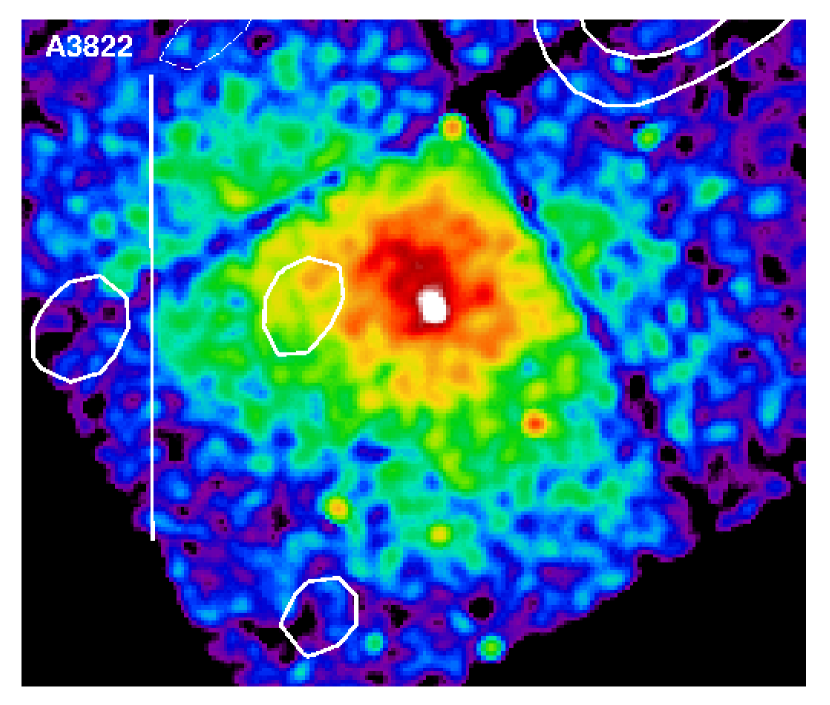
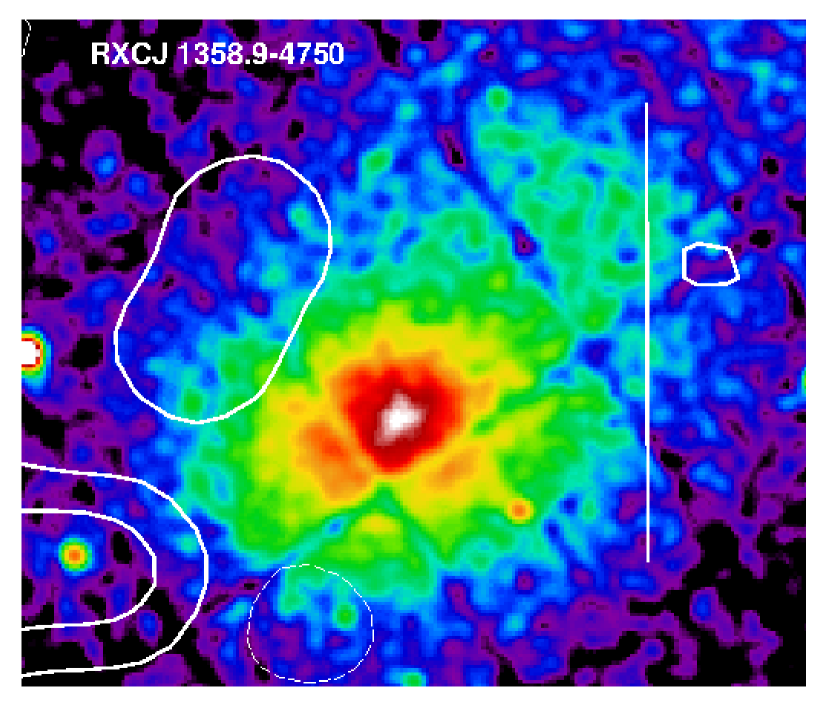
Figures 2, 4 and 5 display the KAT–7 radio emission from the central region of the 14 clusters in Table 2, overlaid on the best available smoothed X–ray images (see Figure captions). For all clusters the X–ray images presented have been obtained from the public archives, with no further analysis.
The KAT–7 angular resolution is of the order of 2.5 arcmin (see Table 2), which makes it difficult to disentangle the contribution of discrete and diffuse sources if radio emission is detected in the central region of the cluster, unless high resolution images at a similar frequency are available in the literature.
In the following sections we describe results for each individual target.
4.1 Clusters with no emission at their centre
In five clusters we could not detect radio emission above our sensitivity limits. These are A 1650, A 3822, A 550, A 644 and RXCJ 1358.9–4750 and their images are reported in Figure 2.
4.2 Clusters with blended central radio emission
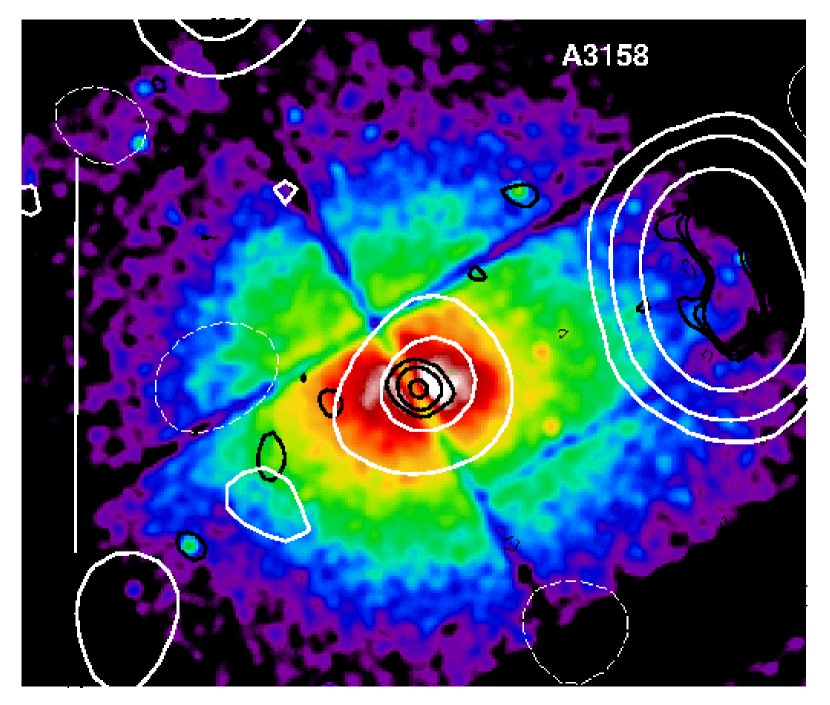
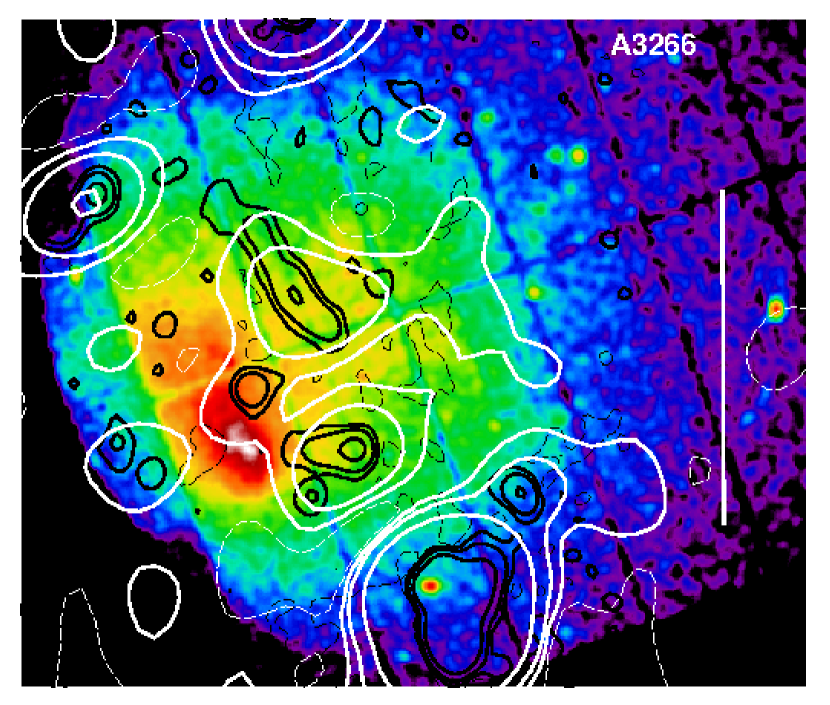
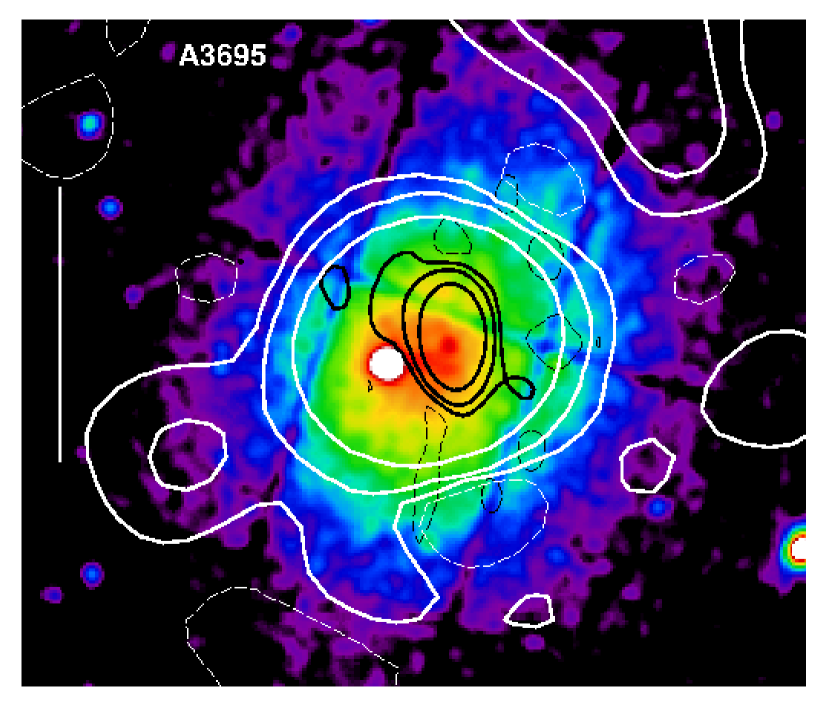
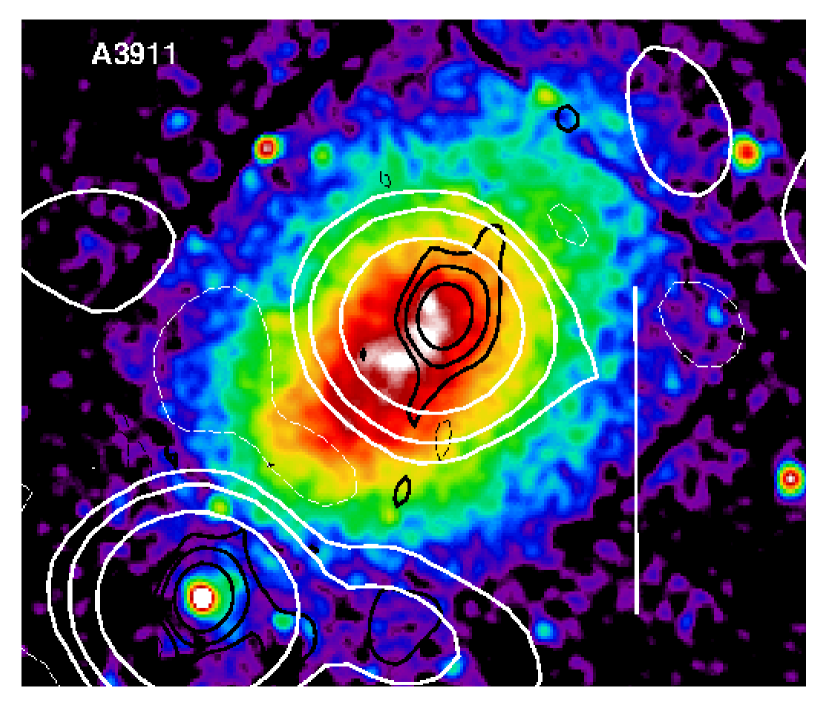
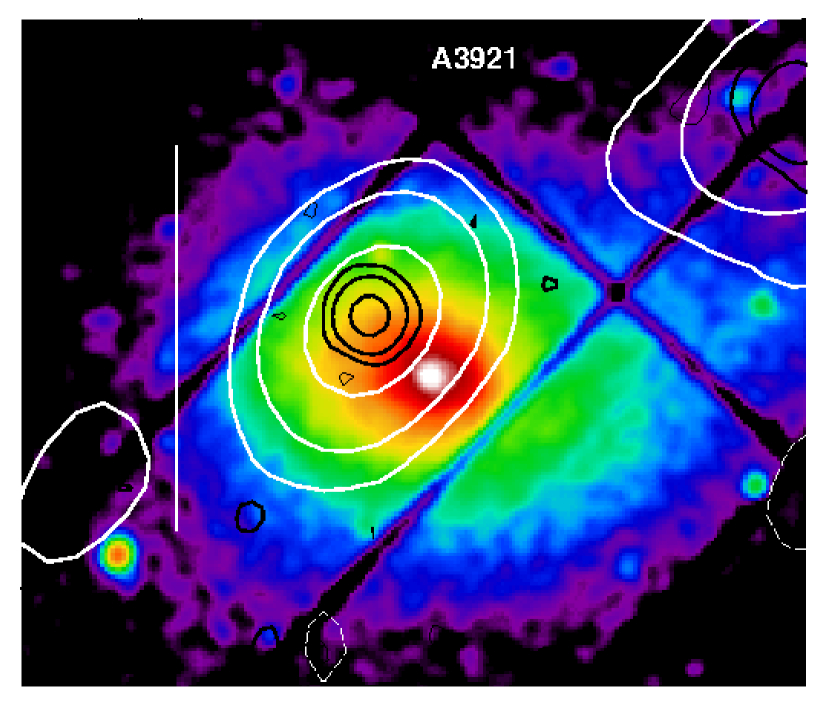
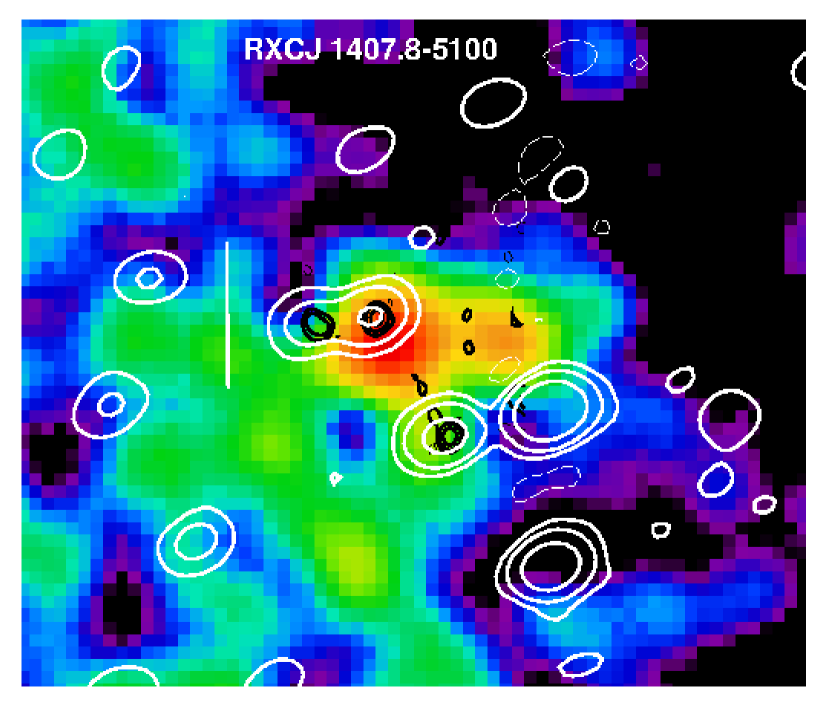
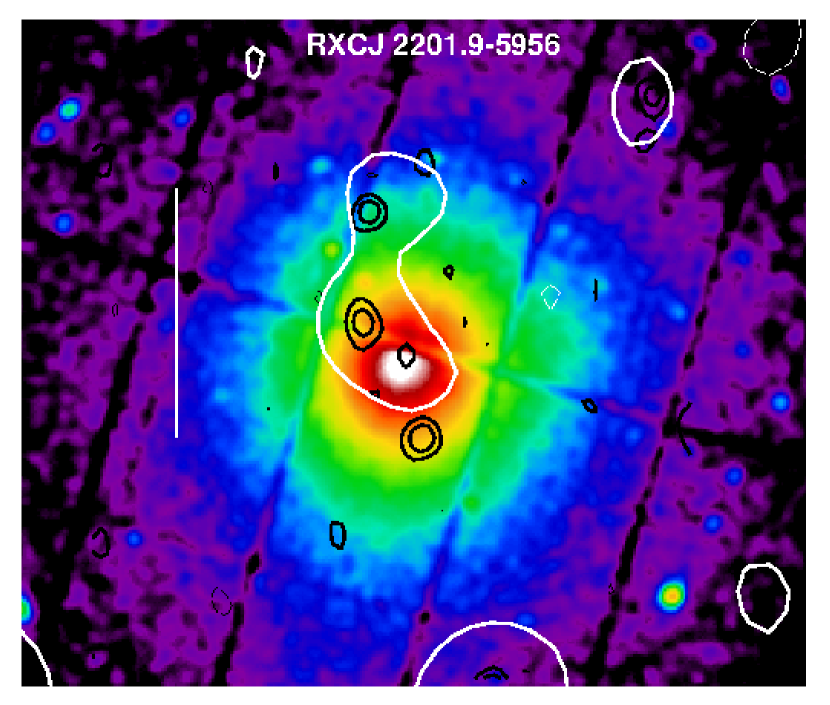
In seven clusters radio emission is detected at the centre, most likely blended emission from individual galaxies, as reported here below. The 1.86 GHz KAT–7 contours for these targets are shown in white in Figure 4, overlaid on the X–ray image and on the 843 MHz radio contours from SUMSS (black).
-
•
A 3158: We detect a barely resolved faint radio source at the cluster centre, whose flux density is S mJy. Johnston-Hollitt et al. (2008) present a radio–optical study of A 3158, where they identify all the compact radio sources brighter than 0.15 mJy, with an angular resolution of arcsec and arcsec at 1.4 and 2.5 GHz respectively. They identify an unresolved source at RAJ2000 = , DECJ2000 = with a S mJy flux density and spectral index (S). Scaled to 1.86 GHz, this source matches the flux density we detect with KAT–7 at the cluster centre.
-
•
A 3266: Two sources are located within a few arcminutes from the X-ray centre of the cluster. Their flux density is S mJy and S mJy respectively for the northern and the southern source. The spatial correlation between the KAT–7 and SUMSS peaks suggests that most of the KAT–7 emission is associated with discrete radio sources.
-
•
A 3695: A strong point source (S Jy) is located at the cluster centre. The source is point–like also in the NVSS, with a peak flux density of S Jy. The 843 MHz image shows an extension at about towards North–East, while the KAT–7 emission is marginally resolved, with a position angle of . Due to the lack of high resolution information, the nature of the central emission in this cluster remains unclear.
-
•
A 3911: The central point–like source has a flux density S mJy. A single point source is found in SUMSS, coincident with the northernmost part of the X–ray cluster emission. The lack of high resolution images either from public surveys or from the literature does not allow to properly classify the emission visible on the KAT–7 image.
-
•
A 3921: A single source is detected slightly offset from the cluster X–ray emission, with flux density S mJy. Ferrari et al. (2006) present 1.3 and 2.4 GHz observations of this cluster, with 12 and 8 arcsec resolution respectively, where this source (SUMSS J 225007-646239) appears unresolved. They measure a flux density of S1.34 = 63.8 mJy, and derive a spectral index = 0.72 between 1.3 and 2.4 GHz. Once the flux density is extrapolated at 1.86 GHz using this spectral index, and the source is subtracted from the KAT–7 -data, the residual image is virtually noise limited.
-
•
RXCJ 1407.8–5100: this cluster hosts a faint double source aligned in the east–west direction. Unfortunately, only a ROSAT All Sky Survey image (RA, DEC) is available for the X–ray emission of the cluster, whose peak is almost coincident with the radio peak. Comparison with the SUMSS image shows two compact sources at the location of the KAT–7 peaks, suggesting that the central radio emission is a blend of individual sources.
-
•
RXCJ 2201.9–5956 (A 3827): A faint and diffuse source is detected at the cluster centre at level, with flux density S mJy. From the overlay shown in Figure 4, it is clear that the 1.86 GHz KAT–7 emission follows the alignment of the individual sources in the SUMSS image, and it is most likely a blend.
4.3 Candidate cluster-scale diffuse emission
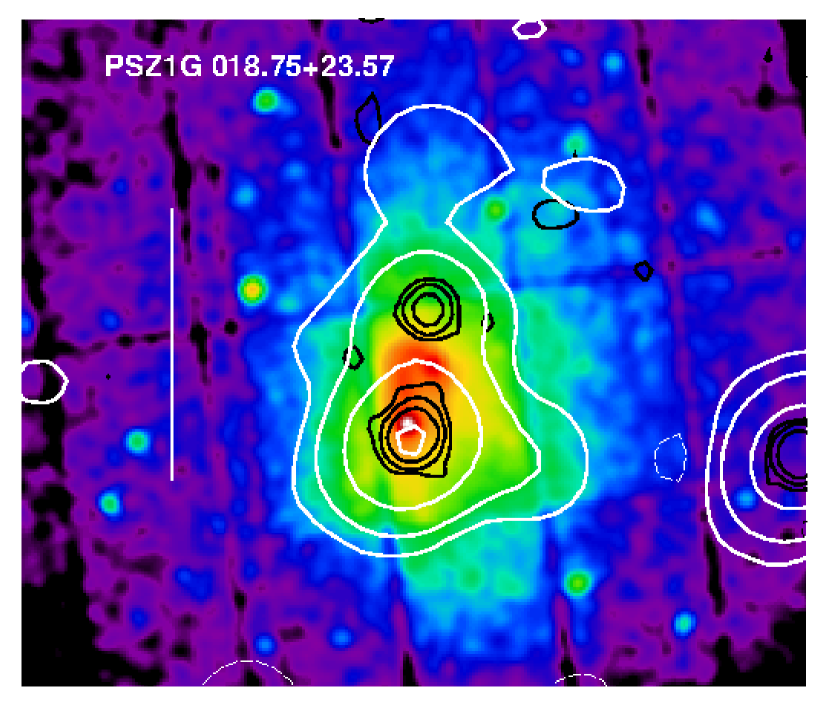
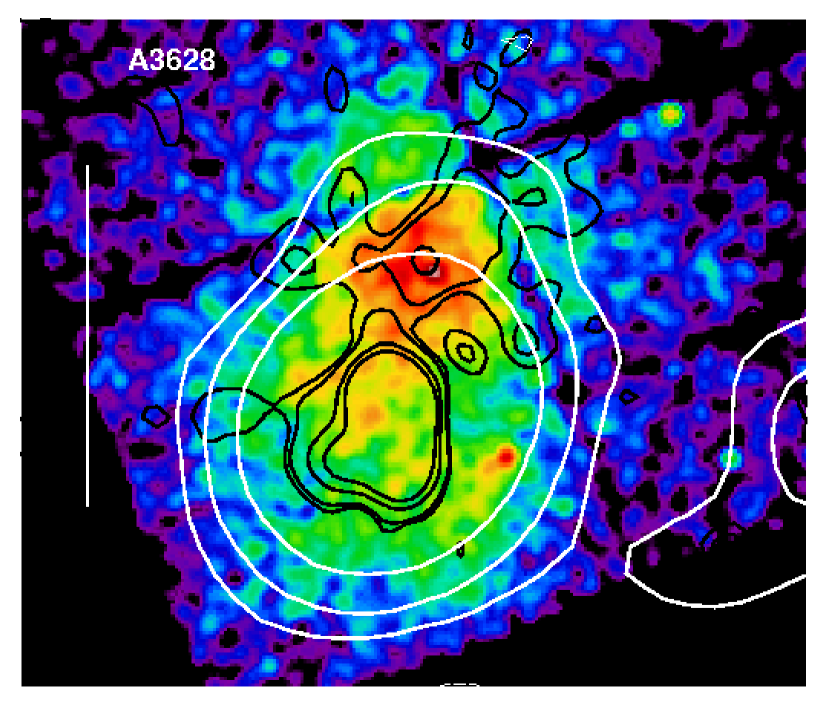
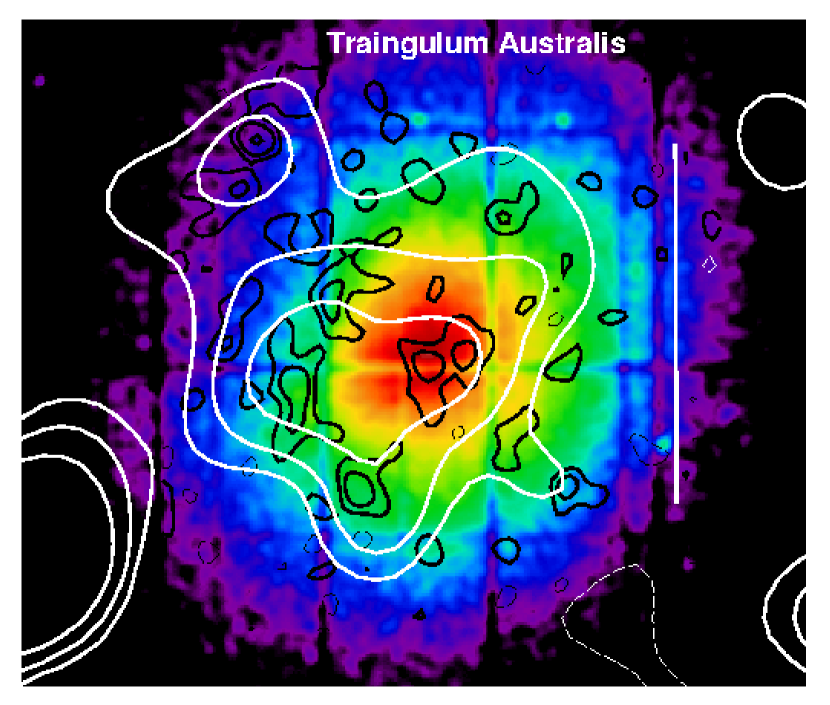
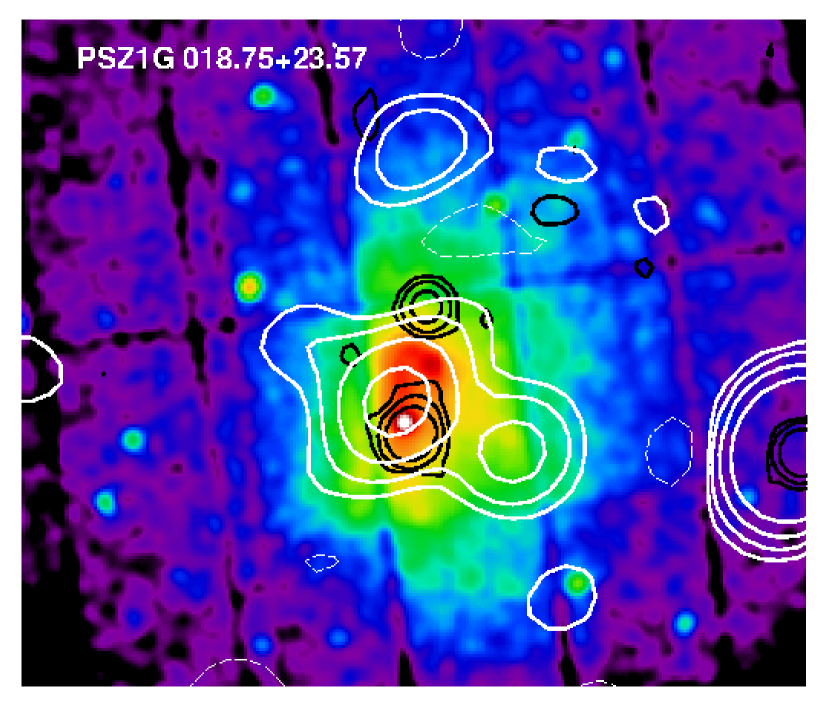
Three galaxy clusters show hints of extended emission at their centres, which makes them potential candidates to host giant RHs (see Figure 5).
-
•
PSZ1G018.7+23.57: Radio emission extends over more than 10 armin (Figure 5). At the cluster position, the NVSS image shows two compact sources aligned north–south, following the same elongation of the cluster X–ray emission. The flux density of the two sources was extrapolated at 1.86 GHz assuming a fiducial spectral index and subtracted from the KAT–7 data. The residual KAT–7 image (Figure 6) shows a feature aligned East–West and coincident with the X–ray emission, and a blob located north of this. The flux densities are S mJy, and S mJy respectively. The extension of the central residual emission is arcmin, i.e. 800 kpc. The image shows that the morphology of the cluster is highly disturbed.
-
•
A 3628: the radio emission is dominated by a strong source, S mJy, with a fainter northern extension, which coincides with the peak of the X–ray emission. The 843 MHz radio contours from the SUMSS show that the northern extension is diffuse, with an extension of 400 kpc. The image clearly indicates that the cluster is dinamycally disturbed.
-
•
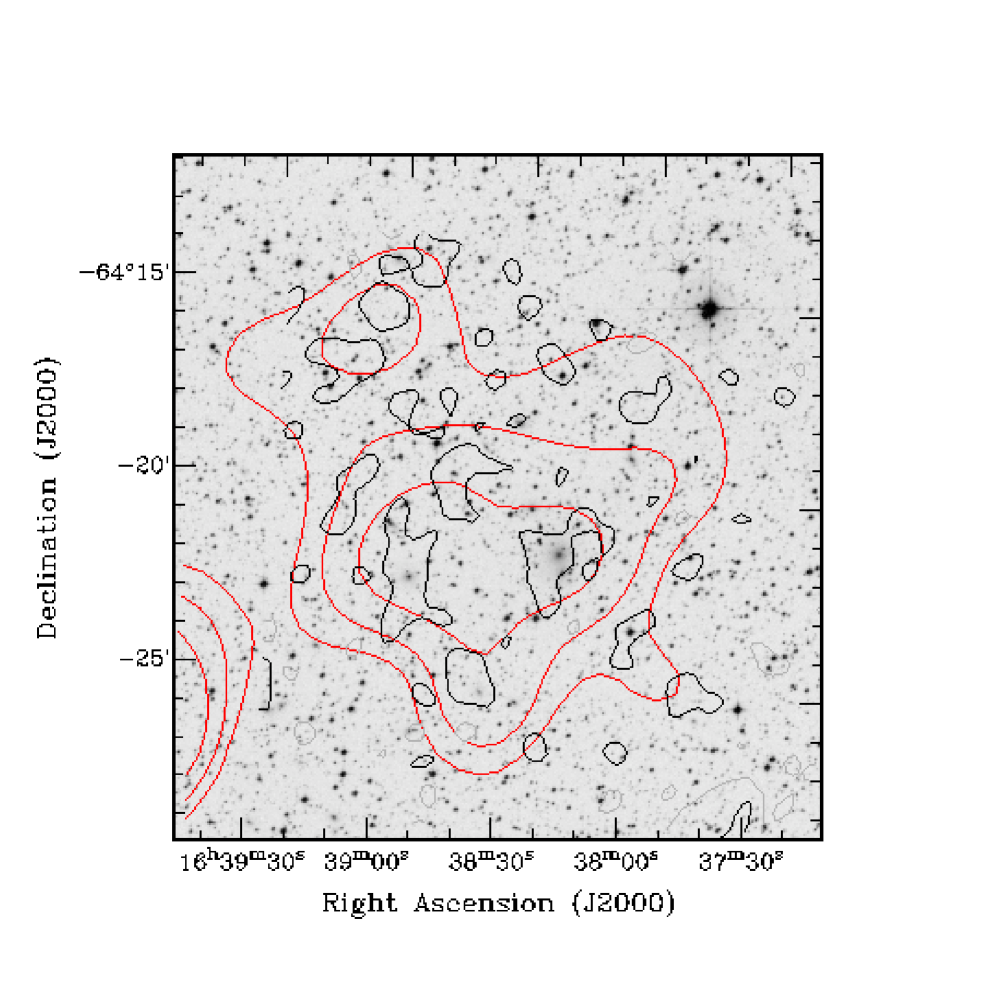
Triangulum Australis: Scaife et al. (2015) first reported the presence of a radio halo at the centre of the Triangulum Australis cluster. In Figure 5 our image of the KAT–7 emission is overlaid on the image. The largest angular size of the diffuse emission is arcmin, corresponding to kpc. Its morphology is double–peaked at the centre, consistent with Scaife et al. (2015), however the position angle of the emission shown here is slightly different. An overlay between our KAT–7 image and the red optical frame from the ESO Digitized Sky Survey (DSS–2, Figure 7) shows that our two peaks are coincident with two very bright galaxies (the western one most likely being the cluster brightest dominant galaxy), so the inner double morphology may be contaminated by individual emission, calling for higher angular resolution observations to isolate the contribution from individual galaxies. The emission detected at 843 MHz with SUMSS is patchy, as a result of inadequate coverage at the largest angular scales, and it is spread all over the KAT–7 emission. We measure a S mJy flux density for the KAT–7 diffuse emission that, albeit lower, is still compatible at the 3 confidence level with the value reported by Scaife et al. (2015).
4.4 Limits to the radio power of undetected giant RHs
With the aim to set an upper limit to the radio power in those clusters void of radio emission at their centres, we followed the approach presented in Venturi et al. (2008) and Kale et al. (2013), which we refer to as “injections”. In particular:
1) the typical radio brightness distribution of a Mpc–sized RH was modelled on the basis of well studied RHs (Cassano et al. 2007, Brunetti et al. 2007). The typical model we adopted is made of seven concentric spheres with increasing radius (from 43 to 720 arcsec) and increasing flux density (i.e. the largest components are also those with the highest flux density fraction). The angular size of 720 arcsec corresponds to a liner size of 1 Mpc at z . In order to appropriately span the redshift range of our cluster sample, the sizes were multiplied by a factor of either 0.8 or 1.2. The brightness profiles of our injected RH models as a function of radius are consistent with an exponential profile with kpc. This choice of is consistent with the e-folding radii measured in tyipical RHs (Murgia et al. 2009).
We explored the mJy range of total flux density for each model. The surface brightness of the various components in the same model ranges from 3 to 1.5 mJy arcsec-2, referred to a halo with a total flux density of 50 mJy.
2) each modelled brightness distribution was “injected” in the data () using the UVMOD task in AIPS (Astronomical Imaging Processing System);
3) each dataset was imaged and we measured the flux density integrated over the area corresponding to the Mpc region (Srec, recovered flux density), and compared it to the total injected flux density, Sinj.
In order to evaluate how the method of the injections performs with KAT–7 data, we chose an empty central area in two clusters with different coverage due to declination, namely RXCJ 1358.9–4750 and A 644 that is located at DEC (see Figure 1).
As expected, Srec/Sinj increases with increasing Sinj, going from for Sinj = 50 mJy to for Sinj = 300 mJy, up to 80% for Sinj = 1 Jy, the lower limits referring to those cases with both lower surface brightness and worse coverage (i.e A 644).
Based on those results we conclude that a RH should have a minimum flux density S = 50 mJy in order to be detectable in the KAT–7 images. For lower Sinj values, the central part of the resulting image appears just to be compatible with noise fluctuations, while for Sinj = 50 mJy we measure a residual flux density of the order of mJy, which is times the average integrated flux density at the centre of those clusters with no radio emission.
We applied our analysis to seven clusters (see Table 2), i.e. the five clusters void of emission at their centres (see Section 4.1) plus A 3158 and A 3921, as we could reliably subtract the point source contribution from the data (see Section 4.2). The RH upper limit was scaled from 1.86 GHz to 1.4 GHz using a spectral index = 1.3.
4.5 The radio halo power vs cluster mass correlation
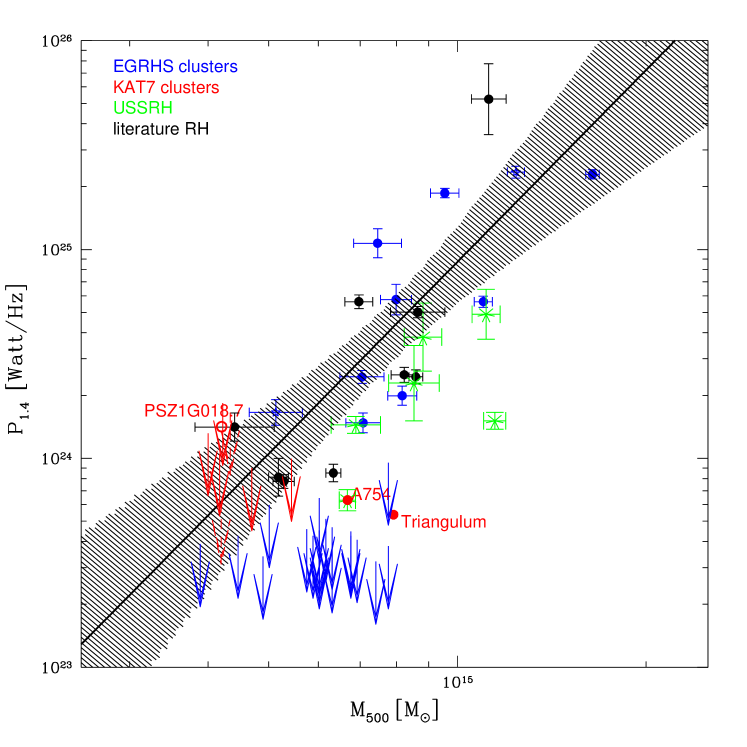
A clear correlation between the synchrotron power of RHs at 1.4 GHz, , and the mass of the hosting clusters, , was found by Basu et al. (2012) through the analysis of the early Planck catalogue. Cassano et al. (2013), using EGRHS data and the Planck SZ cluster catalogue (Planck Collaboration 2014), confirmed this relation and found a bimodal behaviour in the diagram for clusters with (similar to, although weaker than, that found in the radio/X-ray plane; e.g. Brunetti et al. 2007, 2009), where clusters with RHs follow a steep relation and clusters without RHs are all well below the 95% confidence region of the best-fit correlation. This is clear from Figure 8, that shows the correlation obtained using well studied giant RHs in the literature (see Table 1 in Cassano et al. 2013), together with upper limits on the radio power of clusters without giant RHs derived for the EGRHS sample (Venturi et al. 2007, 2008; Kale et al. 2013, 2015).
We used the KAT–7 results to extend this study to less massive clusters. A 754 and the Triangulum Australis (shown and labelled in red in Figure 8) are the only two clusters in our sample with a RH reported in the literature. The Triangulum Australis RH lies significantly below the correlation and its flux density measurement may still be affected by the unsubtracted compact sources as well as by limitations in the coverage as discussed in Section 4.3 and 4.4 respectively. Based on the results of the injection simulations and the magnitude of the measured RH flux density, it is unlikely that a large fraction of its real flux density is missing in our observations. We thus conclude that this RH lies indeed below the correlation, in the area where ultra steep spectrum RHs are found. The candidate RH in PSZ1G 018.75+23.57 lies instead within the 95% confidence region of the correlation.
All KAT–7 upper limits lie within the 95% confidence region of the best-fit correlation. This result does not allow to constrain a bi-modal distribution, but it statistically rules out the presence of powerful RHs in smaller mass systems ().
5 Discussion and conclusions
We have presented KAT–7 observations at 1.86 GHz of a mass-selected (M M⊙) sample of 14 galaxy clusters aimed at studying the occurrence of giant RHs. This sample was completed by the analysis of KAT–7 archive data for the Triangulum Australis cluster.
Three clusters host a candidate RH, as suggested by the comparison between our KAT–7 images, NVSS and SUMSS images and the X–ray emission from the hot intracluster gas. These are: the Triangulum Australis, where the presence of an almost Mpc size radio diffuse has been recently reported by Scaife et al. (2015), PSZ1G 018.75+23.57 and A 3628.
Seven clusters in the sample host emission at their centre. For A 3158 and A 3921 the combination of our images with radio information at higher angular resolution available in the literature suggests that the KAT–7 emission is from compact sources. For RXCJ1407.8-5100 and RXCJ2201.9-5956 the comparison between the KAT–7 and the SUMSS emission suggests that our 1.86 GHz radio images are most likely a blend of individual sources. For the remaining three clusters, i.e. A 3266, A 3695 and A 3911, our limited angular resolution and the lack of adequate high resolution imaging do not allow an unambiguous classification.
For seven clusters in our sample we could set an upper limit to the presence of a giant RH, which we report on the correlation together with the flux density measured for the candidate RHs in PSZ1G 018.75+23.57 and in the Triangulum Australis. As A 85 was the only cluster with available halo information in the M⊙, our data offer the first statistical information about cluster RHs in this mass range and confirm the lack of bright RHs in smaller systems, indicating that RHs more powerful than expected from the correlation must be rare. Under the assumption that the correlation can be extended to smaller systems, our results indicate that this correlation should show a steep slope, of the form , with .
Acknowledgments
We thank the referee for useful comments that helped improving the manuscript. This work is based on research supported by the National Research Foundation under grant 92725. Any opinion, finding and conclusion or recommendation expressed in this material is that of the author(s) and the NRF does not accept any liability in this regard. This work was also partly supported by the Executive Programme of Scientific and Technological Co-operation between the Italian Republic and the Republic of South Africa 2014–2016. The KAT–7 is supported by SKA South Africa and by the National Science Foundation of South Africa.
References
- [2012] Basu, K., 2012, MNRAS, 421L, 11
- [1999] Bock, D., Large, M.I. & Sadler, E.M., 1999, AJ, 117, 1578
- [1999] Briggs, D.S., 1995, PhD thesis
- [2007] Brunetti, G., Venturi, T., Dallacasa, D., et al., 2007, ApJ, 670L, 5
- [2011] Brunetti, G., Cassano, R., Dolag, K. et al., 2009, A&A, 507, 661
- [2014] Brunetti, G., & Jones, T.W., 2014, Intern. Journal of Modern Phys. D, Vol. 23, issue 4, id. 1430007-98
- [2005] Cassano, R. & Brunetti, G., 2005, MNRAS, 357, 1313
- [2005] Cassano, R., Brunetti, G., Setti, G., Govoni, F. & Dolag, K., 2007, MNRAS, 378, 1565
- [2010] Cassano, R., Ettori, S., Giacintucci, S., et al., 2010, ApJ, 721L, 82
- [2013] Cassano, R., Ettori, S., Brunetti, G., et al., 2013, ApJ, 777, 141
- [1987] Condon, J.J., 1987, in Proceedings of the Arecibo Upgrading Workshop, ed. J. H. Taylor & M. M. Davis (Arecibo:NAIC), 89
- [1998] Condon, J.J., Cotton, W.D., Greisen E.W. et al., 1998, AJ, 115, 1693
- [2015] Cuciti, V., Cassano, R., Brunetti, Dallacasa, D., G., Kale, R., Venturi, T. & Ettori, S., 2015, A&A, 580, 97
- [2012] Feretti, L., Giovannini, G., Govoni, F., et al., 2012, A&ARv, 20, 54
- [2006] Ferrari, C., Hunstead, R.W., Feretti, L., et al., 2006, A&A, 457, 21
- [2008] Johnston-Hollitt, M., Sato, M., Gill, J. A., et al., 2008, MNRAS, 390, 289
- [2013] Kale, R., Venturi, T., Giacintucci, S., et al., 2013, A&A, 557, 99
- [2015] Kale, R., Venturi, T., Giacintucci, S., et al., 2015, A&A, submitted
- [2011] Macario, G., Markevitch, M., Giacintucci, S., et al., 2011, ApJ, 728, 82
- [2009] Murgia, M., Govoni, F., Markevitch, M. et al., 2009, A&A, 499, 679
- [1991] Perley, R. A. & Cornwell, T. J., 1991, Astron. Soc. of the Pacific Conf. Vol. 19, 184
- [2013] Perley, R. A. & Butler, T. J., 2013, ApJS, 204, 19
- [2014] Planck Collaboration, Ade, P. A. R., Aghanim, N., et al. 2014, A&A, 571, AA29
- [1997] Röttgering, H. J. A., van Ojik, R.., Miley, G. K., et al., 1997, A&A, 326, 505
- [2007] Scaife, A.M.M., Oozeer N., de Gasperin, F., et al., 2015, MNRAS, 451, 4021
- [2007] Slee, O.B., Roy, A.L., Murgia, M., Andernach, H. & Ehle, M., 2001, AJ, 122, 1172
- [2007] Venturi, T., Giacintucci, S., Brunetti, G., et al., 2007, A&A, 463, 937
- [2008] Venturi, T., Giacintucci, S., Dallacasa, D., et al., 2008, A&A, 484, 327
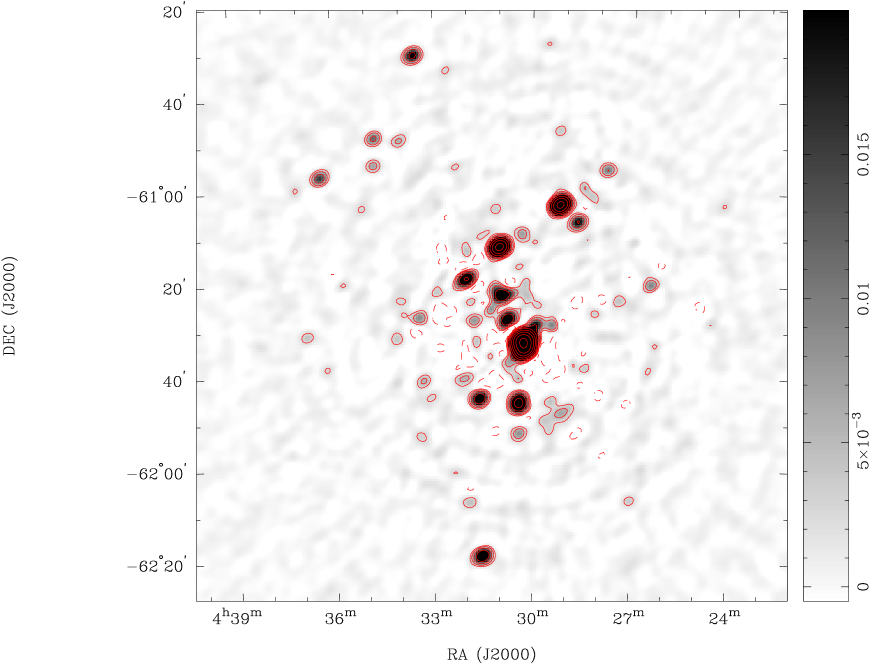
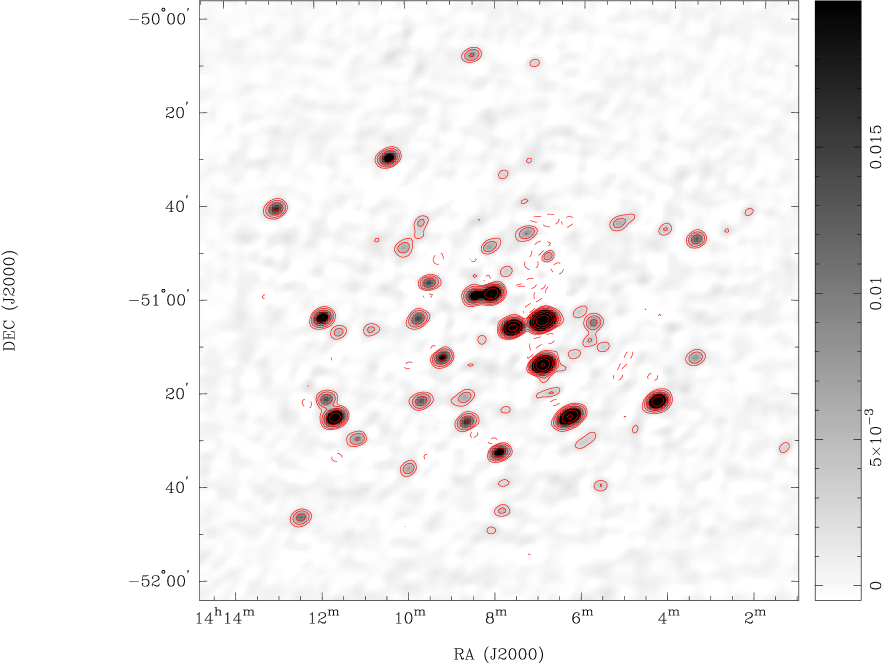
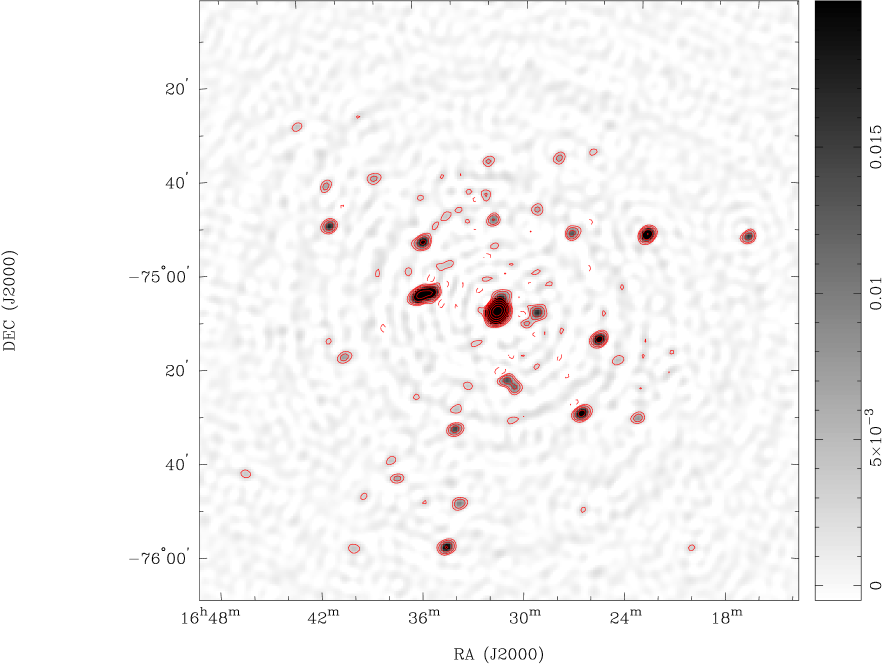
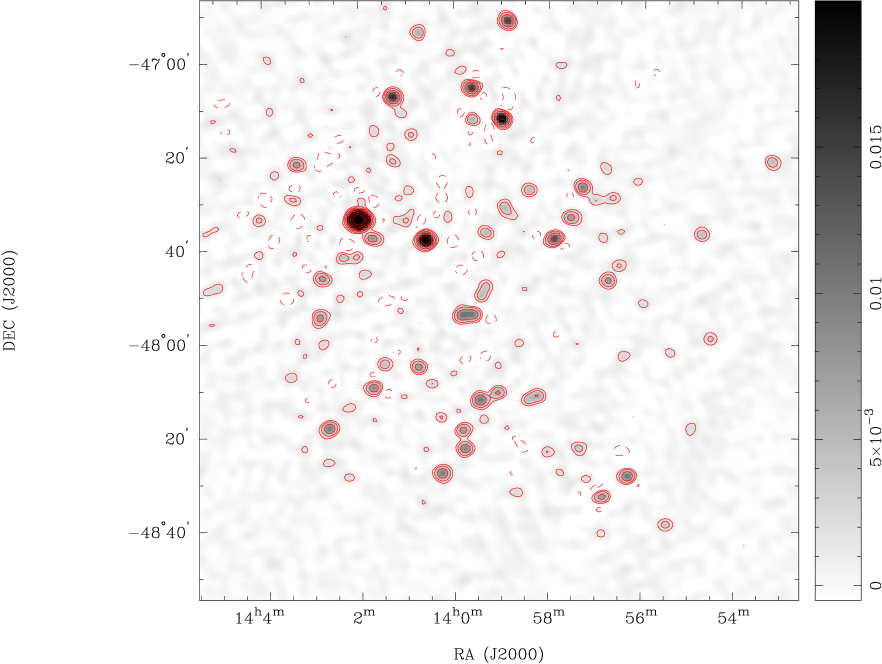
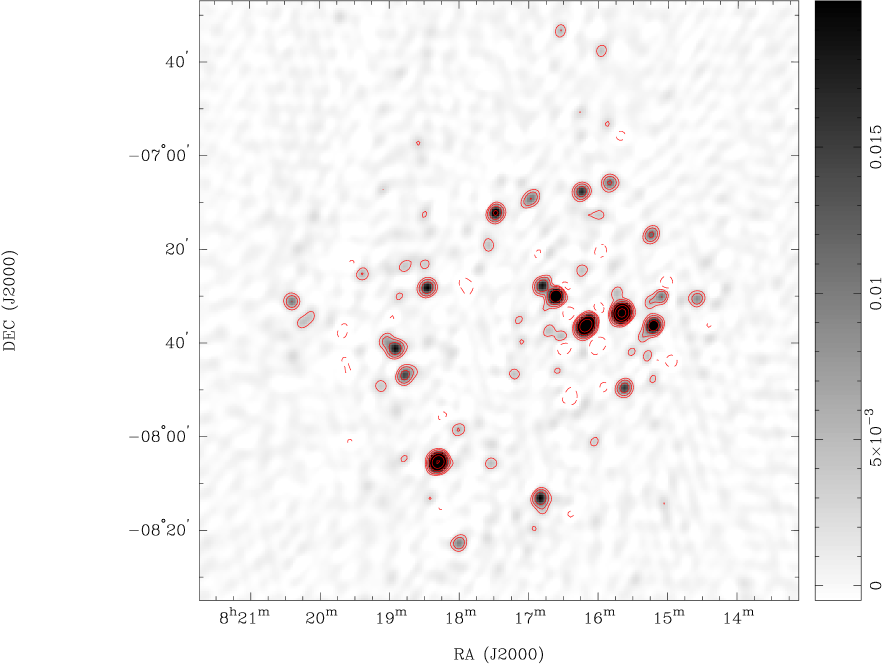
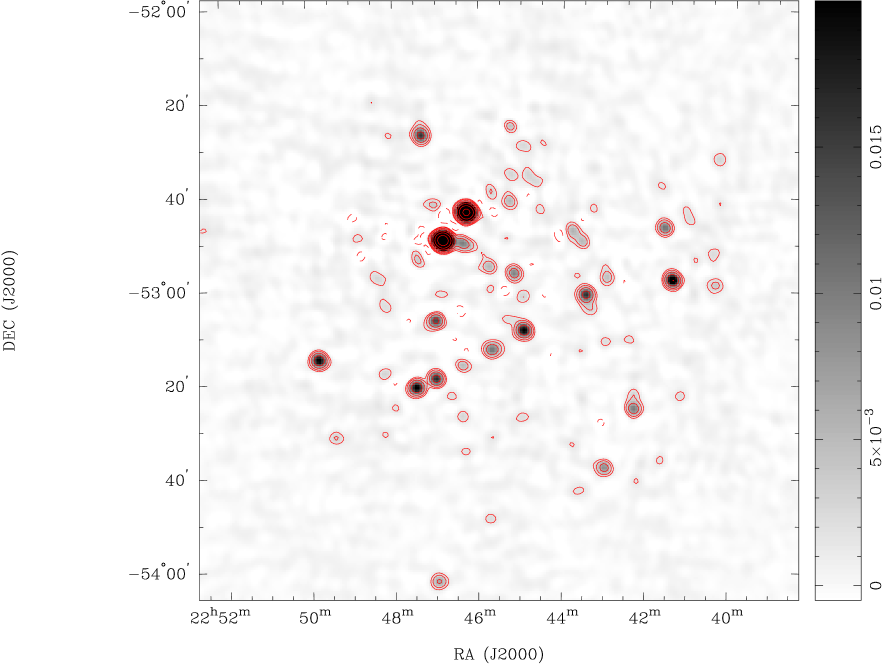
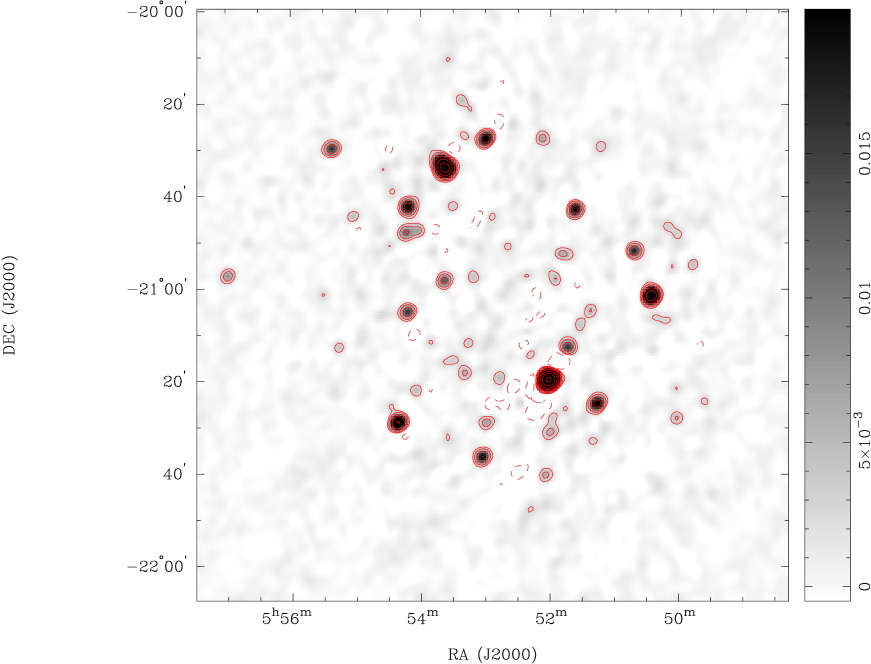
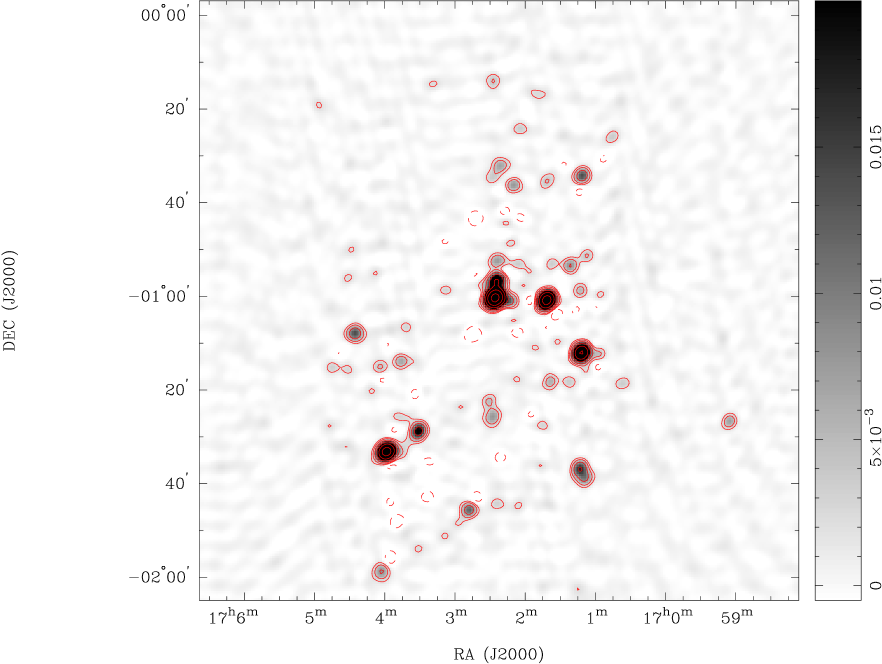
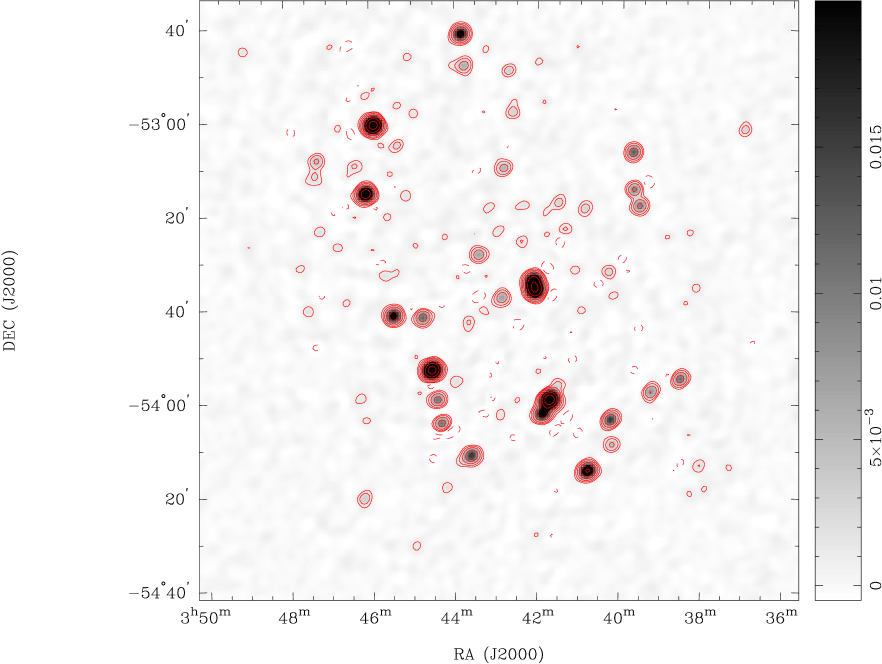
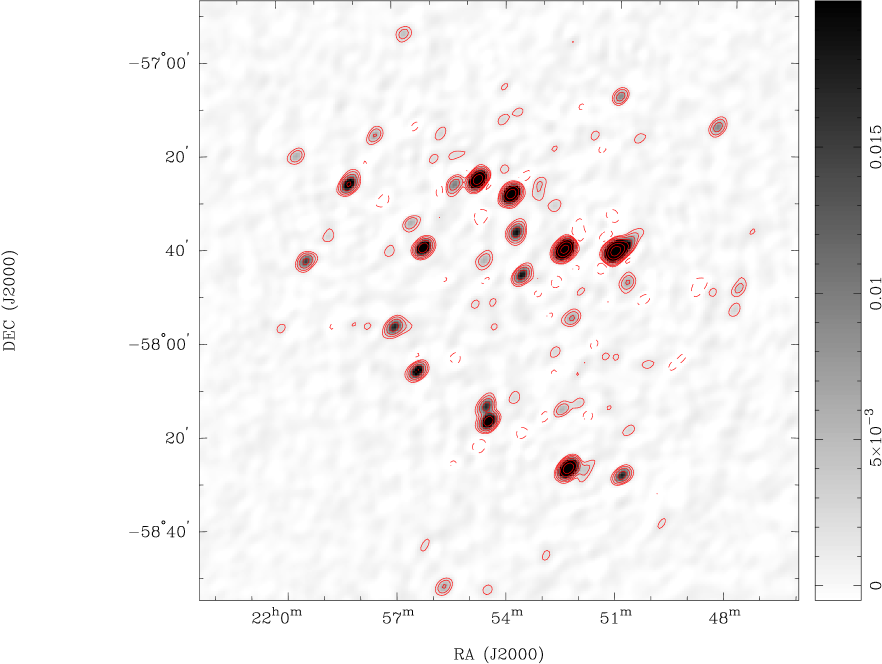
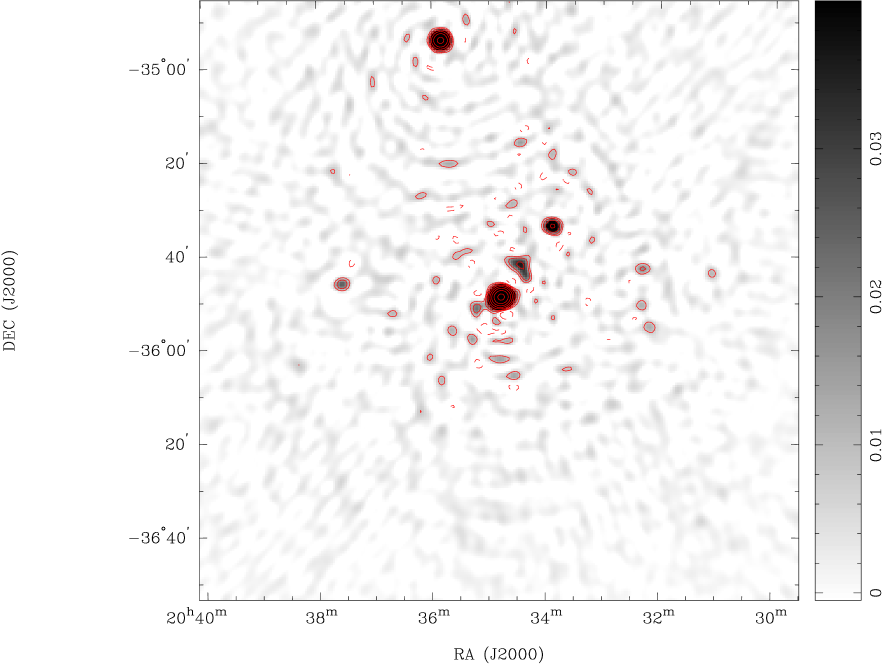
Appendix A KAT–7 cluster images
We display the , full primary beam KAT–7 image for the all the clusters in our sample. Images have not been corrected for the primary beam attenuation. Residual sidelobes around the strongest sources are likely related to residual errors in the amplitude calibration, as phase–only self–calibration has been applied (see Section 3).