11email: busch@ph1.uni-koeln.de 22institutetext: Max-Planck-Institut für Radioastronomie, Auf dem Hügel 69, 53121 Bonn, Germany 33institutetext: LERMA, Observatoire de Paris, PSL, CNRS, Sorbonne Universités, UPMC, F-75014, Paris, France 44institutetext: Niedersächsische Staats- und Universitätsbibliothek Göttingen, 37070 Göttingen, Germany 55institutetext: Deutsches Zentrum für Luft- und Raumfahrt (DLR), Königswinterer Str. 522-524, 53227 Bonn, Germany
A low-luminosity type-1 QSO sample
We present near-infrared (NIR) -band longslit spectra of eleven galaxies which are obtained with SOFI at the NTT (ESO). The galaxies are chosen from the low-luminosity type-1 quasi-stellar object (LLQSO) sample which comprises the 99 closest () QSOs from the Hamburg/ESO survey for bright UV-excess QSOs. These objects are ideal targets to study the gap between local Seyfert galaxies and high-redshift quasars, since they show much stronger AGN activity compared to local objects but are still close enough for a detailed structural analysis.
We fit hydrogen recombination, molecular hydrogen, and [Fe ii] lines after carefully subtracting the continuum emission. From the broad Pa components, we estimate black hole masses and enlarge the sample of LLQSOs that show a deviation from the relations of inactive galaxies from 12 to 16 objects.
All objects show emission from hot dust () as well as stellar contribution. However, the particular fractions vary a lot between the objects. More than half of the objects show H2 emission lines that are indicating a large reservoir of molecular gas which is needed to feed the AGN and star formation. In the NIR diagnostic diagram all objects lie in the location of AGN dominated objects. However, most of the objects show indications of star formation activity, suggesting that their offset location with respect to relations of inactive galaxies may be a consequence of overluminous bulges.
Key Words.:
galaxies: active — galaxies: starburst — galaxies: nuclei — galaxies: Seyfert — infrared: galaxies.1 Introduction
Numerous studies have shown that the mass of the supermassive black hole (BH), which is believed to be hosted in the center of every galaxy, correlates well with several properties of the host galaxy or at least its central spheroidal component (e.g., Kormendy & Richstone, 1995; Magorrian et al., 1998; Gebhardt et al., 2000; Ferrarese & Merritt, 2000; Marconi & Hunt, 2003; Häring & Rix, 2004; Graham & Driver, 2007; Graham, 2012; Kormendy & Ho, 2013; Savorgnan et al., 2013; Läsker et al., 2014). The role of active galactic nuclei (AGN) in this context is still unclear.
AGN feedback has been suggested as a possible regulating mechanism between BHs and their host galaxies, which could contribute to the formation of the local scaling relations through the quenching of star formation. Studies that help to understand the interplay of star formation, black hole accretion and outflows in AGN host galaxies are therefore of high importance. Over the last years, several studies using integral-field spectroscopy (IFS) in the near-infrared (NIR) have shown that many active galaxies show recent or on-going star formation in the central kiloparsec (e.g. Böker et al., 2008; Riffel et al., 2009b; Bedregal et al., 2009; Valencia-S. et al., 2012a; Falcón-Barroso et al., 2014; Busch et al., 2015; Smajić et al., 2015). Also, IFS has allowed to spatially resolve inflows and outflows in many galaxies (e.g. Riffel et al., 2008; Storchi-Bergmann et al., 2010; Müller-Sánchez et al., 2011; Davies et al., 2014; Riffel et al., 2015; Diniz et al., 2015).
From a sample of 10 galaxies, the AGNIFS team (Storchi-Bergmann, Riffel, and collaborators) find that the molecular gas is mostly situated in a disk-like structure and often shows inflow patterns (“feeding”) while the ionized gas is often more perturbed and more affected by outflows from the AGN (“feedback”).
It is still under debate whether outflows have positive or negative influence on star formation. Most probable is that outflows can be responsible for both: initiating and quenching star formation (e.g. Nesvadba et al., 2010; Maiolino et al., 2012; Silk, 2013; Rashed et al., 2013; Cresci et al., 2015a, b, and references therein). Furthermore, it has been shown that the presence of a powerful AGN can significantly boost the outflow rate (Cicone et al., 2014).
Most of these studies are based on nearby Seyfert galaxies or low-luminosity AGN (redshift ). However, these objects may not be representative of the higher-redshift AGN population, since the AGN power (and star formation rate) is expected to increase with redshift. With today’s instrumentation, it is not possible to resolve the centers of AGNs on sub-kpc scale at the peak of AGN and star formation activity (; e.g., Aird et al., 2015).
The low-luminosity type-1 QSO sample (LLQSO sample), was selected in order to fill the gap between the local Seyfert population and more powerful QSOs at higher cosmological distances. It is a subsample of the Hamburg/ESO survey (HES; Wisotzki et al., 2000) and contains only the closest 99 objects with which are still close enough to achieve a sub-kpc spatial resolution.
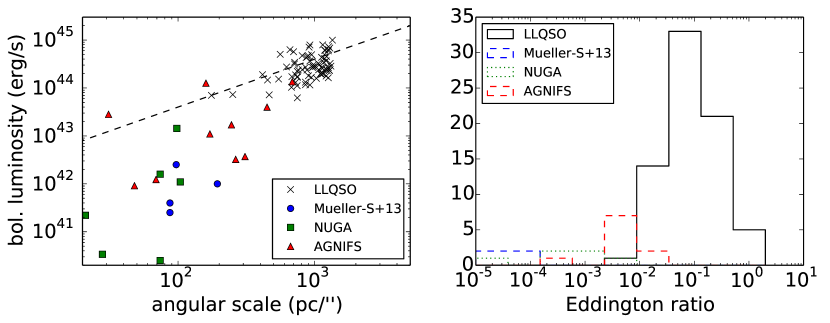
The bolometric luminosity of LLQSOs is systematically higher by at least a magnitude compared to other AGN samples at lower redshift which compensates the lower physical resolution due to the higher redshift. Furthermore, the Eddington ratio which traces the BH accretion rate, is higher by up to several magnitudes (Fig. 1). Therefore, the impact of the AGN on the surrounding interstellar medium (“feedback”) is expected to be much stronger than in local low-luminosity AGN. This makes LLQSOs the ideal targets to study the interplay between the central engine and the host galaxy (Moser et al., 2012). A more detailed description about the sample can be found in the previous near-infrared imaging study (Busch et al., 2014). Several sources have already been observed in molecular gas (Bertram et al., 2007), H i (König et al., 2009), and H2O-maser emission (König et al., 2012). A previous NIR spectroscopy study was done by Fischer et al. (2006), while single objects from the sample have been studied in Krips et al. (2007), Scharwächter et al. (2011), Busch et al. (2015), and Moser et al. (in press). A large fraction of the LLQSOs are included in the new Close AGN Reference Survey (CARS, B. Husemann in prep., http://www.cars-survey.org/).
In this paper, we present and analyse NIR spectroscopic observations of eleven sources from the LLQSO sample, for which imaging data were discussed in Busch et al. (2014). LLQSOs were found to lie below the relations of inactive galaxies, as a possible consequence of enhanced star formation (overluminous bulges) or undermassive BHs (deviations of active galaxies from the relations have been found in the optical by Nelson et al., 2004; Kim et al., 2008; Bennert et al., 2011; Urrutia et al., 2012). Recent NIR integral-field spectroscopy of the LLQSO HE 1029–1831 shows that, at least in this particular case, the deviation is caused by an overluminosity of the bulge due to young stellar populations (Busch et al., 2015).
Near-infrared spectroscopy is a useful tool to assess extinction, the dominating stellar populations, excitation mechanisms, and the contributions of stellar and non-stellar components to the emission of the galaxy (e.g. Zuther et al., 2007; Smajić et al., 2012; Valencia-S. et al., 2012a; Smajić et al., 2014; Busch et al., 2015, Fazeli et al., in prep.). The NIR -band contains several diagnostic lines: Hydrogen recombination lines (Pa and Br) can be excited by the AGN (in the broad and narrow line region) but are also tracers of young star formation. Shocks can be traced by molecular hydrogen (H2) rotational-vibrational lines and the forbidden [Fe ii] line. Stellar CO absorption bands (12CO(6-3) in the -band and 12CO(2-0) in the -band) give constraints on the stellar population, while the forbidden [Si vi] line is a clear AGN tracer (e.g. Riffel et al., 2006; Mason et al., 2015).
Molecular hydrogen H2 emission is either of thermal or non-thermal origin. The main thermal excitation mechanisms are: shocks, UV radiation in dense clouds, or X-rays (e.g., Brand et al., 1989; Sternberg & Dalgarno, 1989; Draine & Woods, 1990) while UV-pumping (Black & van Dishoeck, 1987) is a possible non-thermal excitation mechanism. The H2 line ratio 2-1 S(1)/1-0 S(1) can be used to distinguish between thermal and non-thermal excitation, while the [Fe ii]/Br ratio can be used to estimate the importance of X-ray excitation (e.g. Colina, 1993; Alonso-Herrero et al., 1997; Reunanen et al., 2002, 2003).
A number of studies have focussed on developing a diagnostic diagram in the NIR (comparable to the BPT-diagram in the optical) that distinguishes between excitation from star formation, AGN, and shocks. For this, line ratios between shock tracers (H2 or [Fe ii]) and star formation tracers (Pa, Pa, Br) are used (e.g., Larkin et al., 1998; Rodríguez-Ardila et al., 2004, 2005; Riffel et al., 2013). Using integral-field spectroscopy, Colina et al. (2015) could spatially separate line emitting regions with different ionization mechanisms (AGN/young stars/supernova dominated) and show that they occupy different regions in the diagram. The observed line ratios could be well reproduced with photoionization models by Dors et al. (2012). Furthermore, they find that X-ray emission from the AGN can be considered as most important excitation mechanisms of these lines.
Here, we use longslit spectra to study extinction, star formation activity, and black-hole masses via NIR diagnostic lines in a sample of 11 LLQSOs. This paper is structured as follows: In Sect. 2, we describe the observations as well as the data reduction and calibration. In Sect. 3.1, we explain our continuum subtraction, followed by a description of the emission line fits which are based on the continuum subtracted spectra from Sect. 3.1. Excitation mechanism are discussed in Sect. 4.1. In Sect. 4.2 we estimate black hole masses and discuss the positions of the galaxies in the black hole mass - bulge luminosity relation. In Sect. 4.3 we discuss the far-infrared (FIR) properties and finally draw conclusions in Sect. 5. Individual objects are discussed in the Appendix.
| source | RA (J2000) | DEC (J2000) | classification | redshift | [s] | seeing [″] | PA slit [∘] | tell./calibr. star |
|---|---|---|---|---|---|---|---|---|
| 05 HE0036–5133 | 00h39m15.8s | -51d17m01s | E | 0.0288 | 7200 | 0.9 | 56 | HD 1839 |
| 08 HE0045–2145 | 00h47m41.2s | -21d29m28s | SB | 0.0214 | 7200 | 1.5 | 25 | HD 224693 |
| 11 HE0103–5842 | 01h05m16.7s | -58d26m14s | Irr | 0.0257 | 7200 | 1.4 | 112 | HD 14474 |
| 16 HE0119–0118 | 01h21m59.8s | -01d02m24s | SB | 0.0547 | 7200 | 1.2 | 65 | HD 15760 |
| 31 HE0323–4204 | 03h25m02.2s | -41d54m18s | S | 0.0580 | 8400 | 1.7 | 136 | HD 1839 |
| 80 HE2112–5926 | 21h15m51.5s | -59d13m54s | E | 0.0317 | 7200 | 1.6 | 0 | HD 209552 |
| 81 HE2128–0221 | 21h30m49.9s | -02d08m15s | E | 0.0528 | 7200 | 1.3 | 0 | HD 198273 |
| 82 HE2129–3356 | 21h32m02.2s | -33d42m54s | E | 0.0293 | 7200 | 1.5 | 10 | HD 197612 |
| 83 HE2204–3249 | 22h07m44.7s | -32d34m56s | E | 0.0594 | 6300 | 1.0 | 110 | HD 197612 |
| 84 HE2211–3903 | 22h14m42.0s | -38d48m23s | SB | 0.0398 | 7200 | 1.0 | 44 | HD 221250 |
| 85 HE2221–0221 | 22h23m49.5s | -02d06m13s | E | 0.0570 | 7200 | 1.3 | 62 | HD 198273 |
2 Observation, reduction, and calibration
Eleven galaxies from the low-luminosity type-1 QSO sample have been observed in seeing limited mode with the Son of ISAAC (SofI) infrared spectrograph and imaging camera on the New Technology Telescope (NTT, ESO, Chile) during September 2009. The Hawaii HgCdTe array provides a pixel scale of with a field-of-view of arcmin2. NIR imaging data are presented in Busch et al. (2014). The data analysed in this work consist of -band low resolution longslit spectroscopy with a slit width of , resulting in a spectral resolution of about .
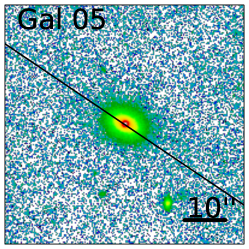
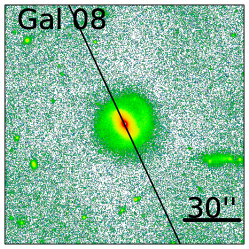
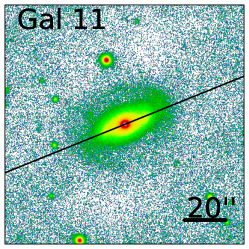
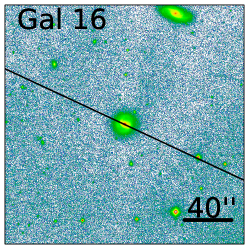
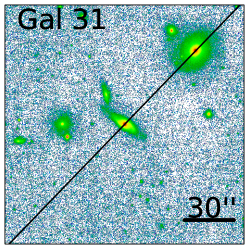
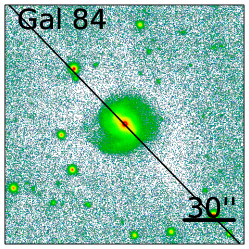
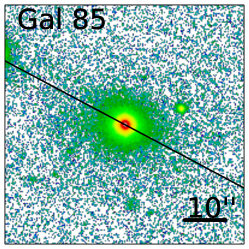
For host galaxies showing prominent structures like bars, the slit was preferably aligned along those structures. In some cases, the slit position was chosen to include neighbouring objects. The positions of the slit superimposed on the -band images from Busch et al. (2014) are shown in Fig. 2. Integration times, seeing conditions, and the position angles of the slit are presented in Table 1. The integration time was typically two hours and the seeing ranged from to .
The spectra were taken with a nodding technique. Sky-subtraction was done by subtracting consecutive frames from each other. Flat-fielding, and the correction for tilt and curvature were done by Iraf/Pyraf standard procedures. Subsequently, the frames were shifted on top of each other and a median frame was calculated.
Telluric correction was performed with G2V-stars which were observed before and after the science objects at similar airmass (Table 1). The G2V class was chosen since they have the same spectral type as the Sun whose spectral lines are well known. For the telluric correction, the science spectra were divided by the telluric spectra (taking into account the different exposure times) and then multiplied by a solar reference spectrum (Maiolino et al., 1996) in order to correct for the black body shape and lines inserted by the telluric spectrum. We shifted the spectra manually on subpixel-scale to match the absorption features and optimise the telluric correction. Since the solar reference spectrum was only available in the - and -band, we interpolated the region in between with a black body function with temperature . This means in the bandgap, we cannot correct for absorption lines of the G2V-type spectrum. Therefore, our telluric correction leaves residuals, especially in the bandgap between - and -band as well as in the region between which has particularly low transmission. Line detections and measurements in this region have therefore to be taken with caution (however, the Pa-line that is located in the bandgap is quite strong and therefore well detected in most galaxies).
Wavelength calibration was done using the lines of a Xenon lamp observed every night. Flux calibration was done by scaling the solar reference spectrum to the 2MASS flux (Skrutskie et al., 2006) of the telluric star. In three nights, two or three standard stars were observed during the same night. In order to estimate the reliability of the flux calibration, we calibrated the standard stars with each other. The resulting calibrations varied by a factor of likely caused by seeing variations during the night (for a discussion of slit-loss corrections see Rashed et al., 2015).
3 Analysis and results
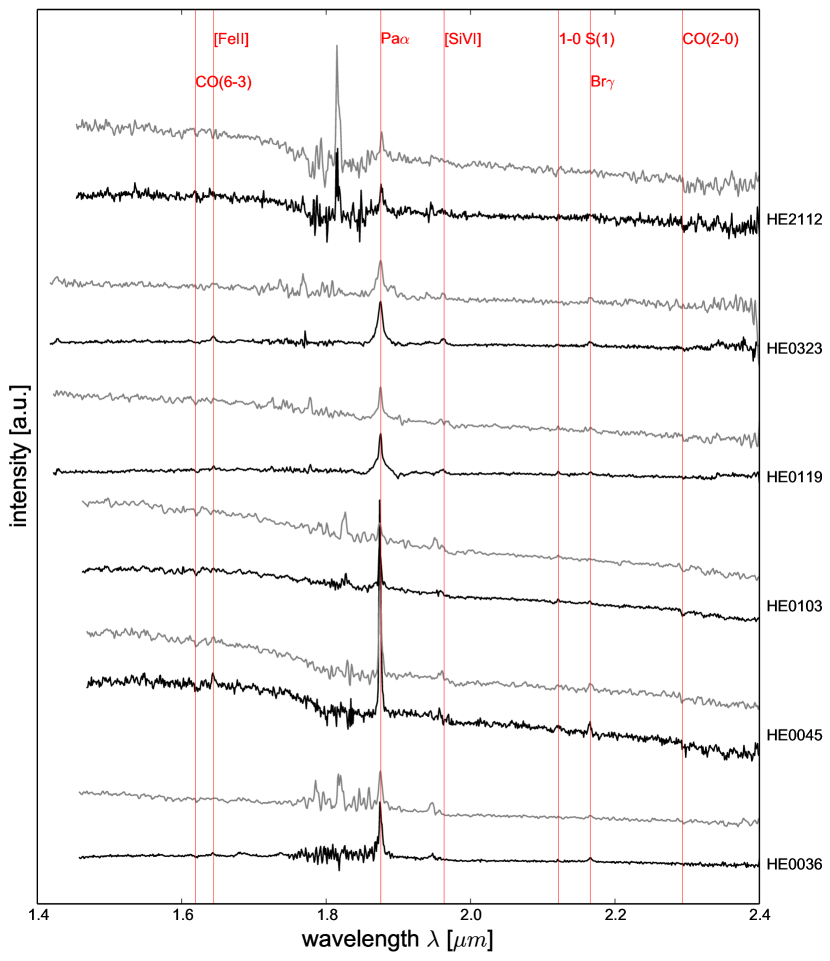
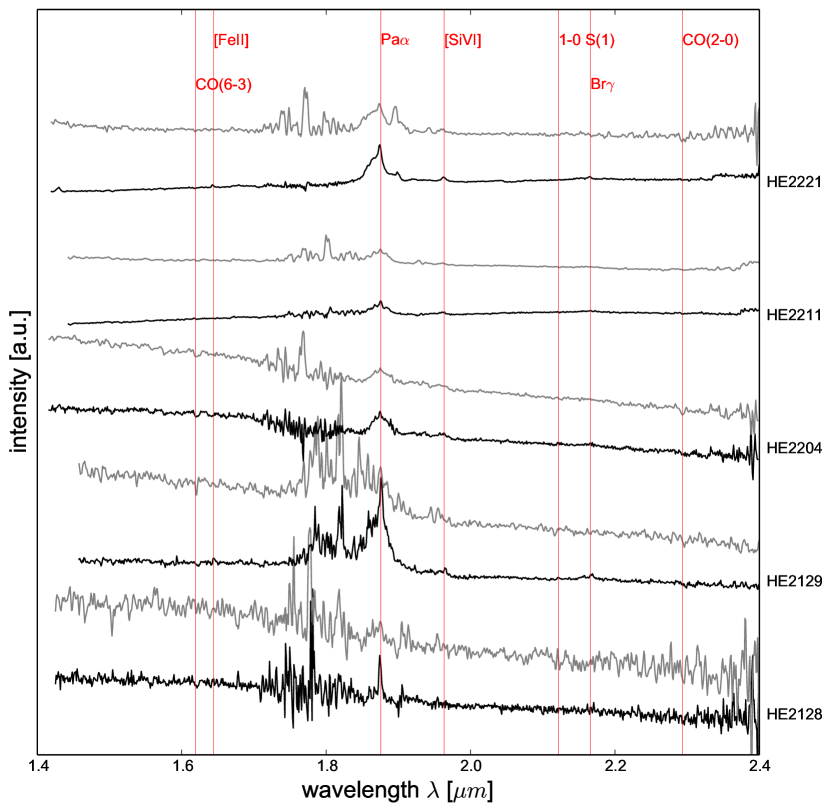
In Figure 3, we compare the central spectra which are extracted from an aperture with a diameter corresponding to the seeing FWHM (see Table 1) to off-nuclear spectra which are extracted using the same aperture size for regions centred at FWHM left and right from the nucleus.
As expected, the continuum shapes of the off-nuclear spectra are bluer than those of the nuclear spectra which are much more affected by the hot dust emission from the obscuring torus. However, the difference in continuum shape between the eleven galaxies is much higher than the difference in continuum shape between different apertures. This hints at different excitation mechanisms and/or different impact of the central AGN emission on the galaxies’ spectra that will be analysed in the following.
3.1 Continuum subtraction
The continuum emission of active galaxies is usually fitted by a multicomponent model, consisting of (1) an underlying power law, (2) thermal emission from hot dust, and (3) star light from the host galaxy. As pointed out in Barvainis (1987), the prominent bump in the NIR (peaking in the -band at ) can be produced by hot dust close to its sublimation temperature () that is predicted from the Unified Model (Antonucci, 1993; Urry & Padovani, 1995). The power law emission is believed to originate from the accretion disk (e.g. Malkan & Sargent, 1982; Malkan, 1983). While it is prominent in the optical/UV, it becomes negligible in the NIR for Seyfert-2s (Ramos Almeida et al., 2009). However, in type-1 sources there might still be a significant contribution (e.g. Riffel et al., 2009a; Landt et al., 2011). Glikman et al. (2006) construct a spectral template for quasars from observations of 27 sources. In this template, the continuum emission in the NIR is best fitted by a combination of a power law ( with power-law index ) and a black body with temperature .
In the following, we fit the continuum shape, using the method described in Smajić et al. (2012). The continuum subtracted spectra are then used for emission line fits. Furthermore, the different fractions of the fitted functions give indication which processes contribute to the emission of the galaxies.
In the continuum fit, we include three components: hot dust, star light and a power law. Additionally, we consider extinction (Cardelli et al., 1989)
| (1) |
with the standard value and in . The hot dust contribution is modelled as black body radiation with the Planck function
| (2) |
with a scale factor . The contribution of the accretion disk is modelled by a power law
| (3) |
with the power-law index and the scale factor . We fixed the power law index to the value from the quasar template of Glikman et al. (2006) (). To account for the stellar contribution, we used stellar templates from the NASA Infrared Telescope Facility (IRTF) spectral library for cool stars (Rayner et al., 2009). The library offers spectra of 210 cool stars (mainly F, G, K, M spectral type) at an resolving power of . The spectra are not normalized, i.e. the shape of the continuum is preserved.
The spectra had to be convolved with a Gaussian function in order to account for the lower resolution of our spectra and intrinsic effects such as broadening due to velocity dispersion or Doppler displacement:
| (4) |
In total, we use the following function and fit it to the spectra using a python implementation of the amoeba-routine (downhill simplex method, Press et al., 1992):
| (5) |
The function has six fitting parameters: visual extinction , temperature of the dust , width and displacement of the Gaussian function used to convolve the stellar templates, and the scale factors , and of the dust, power law, and stellar continuum.
One example of a continuum fit is displayed in Fig. 4. Table 2 shows the results of our continuum fits, i.e. the relative contributions of the contributing functions, as well as extinction, and dust temperature. The fits give a first estimation of the contributing components and moreover, they are used for continuum subtraction before fitting the emission lines. We point out that the fit might not always have a numerically unique solution since dust emission () and strong extinction will both produce a red shape, while stellar emission and power law will both produce a blue spectrum. As pointed out by e.g. Cid Fernandes et al. (2004) and Riffel et al. (2009a) young reddened starbursts are not distinguishable from a power law. Generally, for a more detailed analysis of the stellar content, a larger set of stellar populations is necessary. Using only one star as template often results in lower values for the stellar velocity dispersion (see e.g. Riffel et al., 2008; Valencia-S. et al., 2012a). However, stellar kinematics or stellar population synthesis is not the goal of this work. The only aim is to subtract the continuum emission and get first estimates on the contributions of the different components. Our methods serves this purpose despite the mentioned limitations and degeneracies.
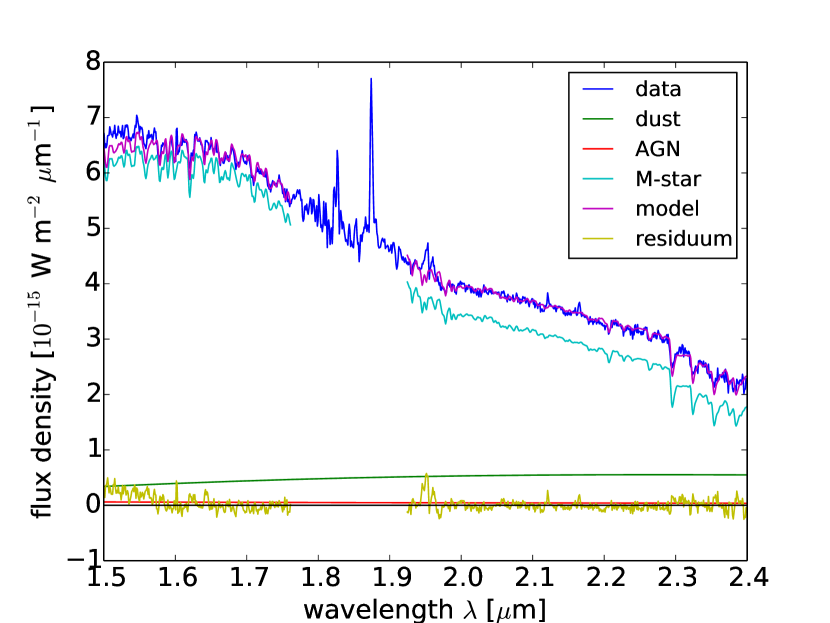
In all galaxies (with exception HE0045-2145, see discussion below), we fitted a black body function with temperatures that are typical for Seyfert-1 galaxies (Riffel et al., 2009a, 2010; Landt et al., 2011, and references therein). In some galaxies, also a power-law component was fitted. All spectra show stellar components which contribute from 30% up to almost 90%. This shows the diversity of objects in terms of dominance of the nuclear component in the LLQSO sample. We point out that the resulting stellar fractions are consistent with the AGN/host fractions derived from the decomposition of the NIR imaging data (Busch et al., 2014) and with the amount of dilution in the CO band heads (see e.g. Davies et al., 2007; Riffel et al., 2009a) observed in the -band spectra (i.e. galaxies with dominant stellar component show prominent CO band heads, while the band heads are completely diluted by the underlying black body and/or power law in galaxies which are dominated by the AGN).
| source | dust | AGN | stars | T(dust) | |
|---|---|---|---|---|---|
| 05 HE0036 | 31% | 33% | 36% | 0.8 mag | 1000 K |
| 08 HE0045 | 32% | 0% | 68% | 1.2 mag | 25000 K |
| 11 HE0103 | 13% | 7% | 80% | 0 mag | 1400 K |
| 16 HE0119 | 55% | 0% | 45% | 0 mag | 1300 K |
| 31 HE0323 | 45% | 20% | 35% | 0 mag | 1100 K |
| 80 HE2112 | 21% | 0% | 79% | 0.6 mag | 1300 K |
| 81 HE2128 | 18% | 0% | 82% | 1.4 mag | 1200 K |
| 82 HE2129 | 25% | 0% | 75% | 0 mag | 1000 K |
| 83 HE2204 | 10% | 3% | 87% | 0.9 mag | 1000 K |
| 84 HE2211 | 64% | 4% | 31% | 0 mag | 1100 K |
| 85 HE2221 | 59% | 8% | 33% | 1.6 mag | 1000 K |
3.2 Emission line analysis
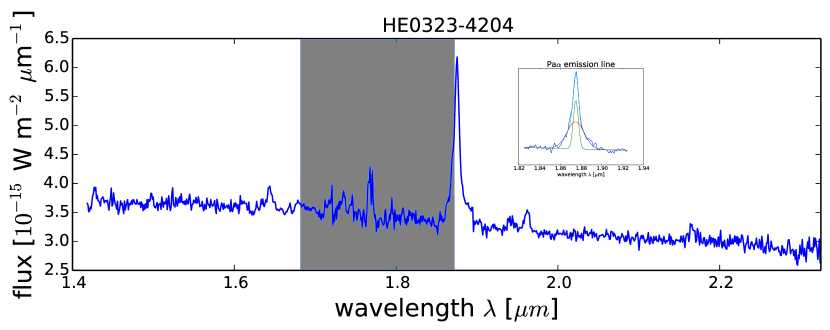
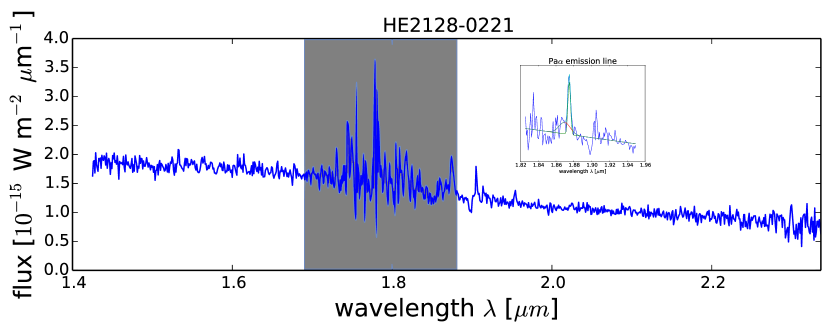
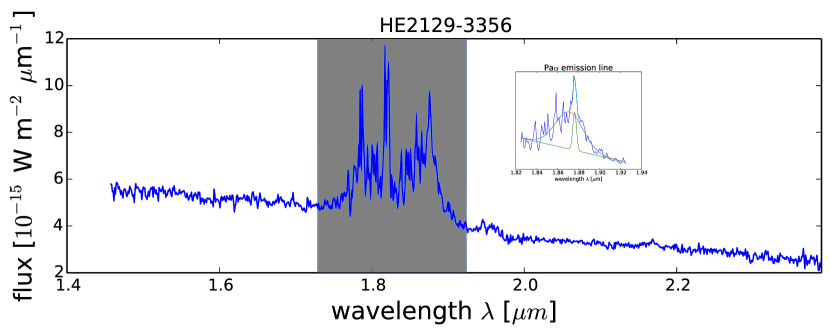
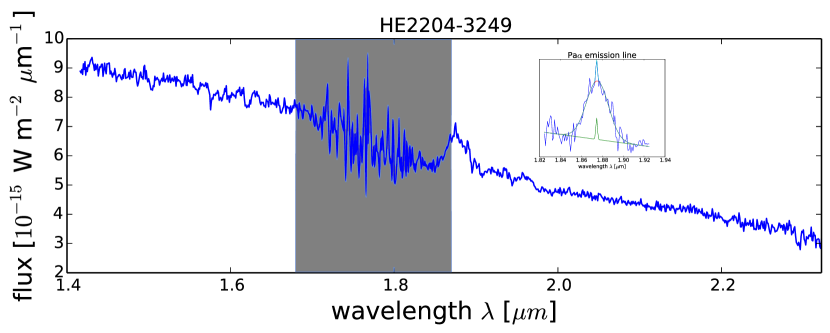
The strong Pa hydrogen recombination line () is located in the band gap between the and -band which is significantly affected by residuals from the telluric absorption. Due to the redshift of the LLQSO sample (), the emission line is shifted towards the -band in a region where it is still affected by the telluric absorption but already well detectable. In nine galaxies, the Pa line could be separated into two components, a broad one (with FWHM typically between and ) and a narrow component (FWHM below ).
A second strong hydrogen recombination line located in the -band is Br (). Since the Br line is usually weaker than Pa by a factor of more than 10, we constrained the widths of Br to the widths resulting from the Pa fits. This reduces the number of fit parameters and makes the fits more robust.
All emission line fits have been performed using the Python-version of Mpfitexpr (Markwardt, 2009). We perform a Monte Carlo simulation with 100 iterations to estimate the uncertainties of the fit. In each iteration, we add Gaussian noise to the spectrum. The width of the noise distribution corresponds to the root-mean-square of the residual spectrum that we obtain after subtracting the fitted line from the spectrum. This gives us the uncertainty at the position of the line, which is particularly useful in the case of the Pa emission line that is located in a very noisy region of the spectrum. In the following, we take the mean of the 100 fits as best fit and the standard deviation as uncertainty. The results of the line fits are presented in Table 3.
| source | Pa broad | Pa narrow | Br broad | Br narrow | ||
| flux | FWHM | flux | FWHM | flux | flux | |
| [] | [km s-1] | [] | [km s-1] | [] | [] | |
| 05 HE0036–5133 | 1300 | 260 | ||||
| 08 HE0045–2145 | — | — | 520 | — | ||
| 11 HE0103–5842 | — | — | 610 | — | ||
| 16 HE0119–0118 | 3200 | 560 | ||||
| 31 HE0323–4204 | 3200 | 900 | ||||
| 80 HE2112–5926 | 2900 | 470 | — | — | ||
| 81 HE2128–0221 | 1800 | 620 | — | — | ||
| 82 HE2129–3356 | 5000 | 720 | ||||
| 83 HE2204–3249 | 4000 | 250 | ||||
| 84 HE2211–3903 | 3900 | 420 | ||||
| 85 HE2221–0221 | 4300 | 730 | ||||
More than half of the galaxies in the sample show significant emission in molecular hydrogen. Particularly the transitions H2(1-0)S(3) (), H2(1-0)S(2) (), and H2(1-0)S(1) () are detected. This shows that LLQSOs are not only rich in cold molecular gas (see Bertram et al., 2007), but also contain warm, excited molecular gas. Ratios of molecular hydrogen lines can give valuable information on the excitation mechanisms (Davies et al., 2003, 2005). The observations analysed here are too shallow to investigate H2 excitation mechanisms in detail. Nevertheless, the detection of molecular hydrogen in this study helps to select candidates for follow-up studies on the hydrogen excitation mechanisms based on deeper observations. The results of the emission line fits are reported in Table 4.
Most of the galaxies show emission in the forbidden iron transition [Fe ii] at . This line can be excited by the AGN but is also known as shock tracer and particularly used as supernova rate estimator (e.g. Calzetti, 1997; Alonso-Herrero et al., 2003). Furthermore, some galaxies, particularly HE2129–3356 and HE2221-0221, show strong emission in the coronal line [Si vi] which is a common AGN tracer.
In their studies of Seyfert galaxies and quasars, Riffel et al. (2006) and Mason et al. (2015) detect the same set of lines. They report that [Fe ii], H2, and [Si vi] are detected more frequently in nearby AGN than in quasars. Our detection rates in low-luminosity QSOs ([Fe ii]: 7/11, H2(1-0)S(1): 6/11, see Table 4) lie between their detection rates for AGN and quasars, as expected for a “bridge” sample between these two populations.
| source | H2(1-0)S(3) | H2(1-0)S(2) | H2(1-0)S(1) | [Fe ii] |
| [] | [] | [] | [] | |
| 05 HE0036–5133 | — | |||
| 08 HE0045–2145 | — | |||
| 11 HE0103–5842 | — | |||
| 16 HE0119–0118 | ||||
| 31 HE0323–4204 | — | |||
| 80 HE2112–5926 | — | — | — | — |
| 81 HE2128–0221 | — | — | — | — |
| 82 HE2129–3356 | — | |||
| 83 HE2204–3249 | — | — | — | — |
| 84 HE2211–3903 | — | — | — | — |
| 85 HE2221–0221 | — | — | — |
4 Discussion
4.1 Excitation mechanisms
In the optical, emission line ratios are commonly used to distinguish between different excitation mechanisms (mainly star formation vs. AGN ionization) making use of different diagnostic diagrams (e.g. Baldwin et al., 1981; Kewley et al., 2001; Kauffmann et al., 2003; Schawinski et al., 2007; Bremer et al., 2013; Vitale et al., 2015).
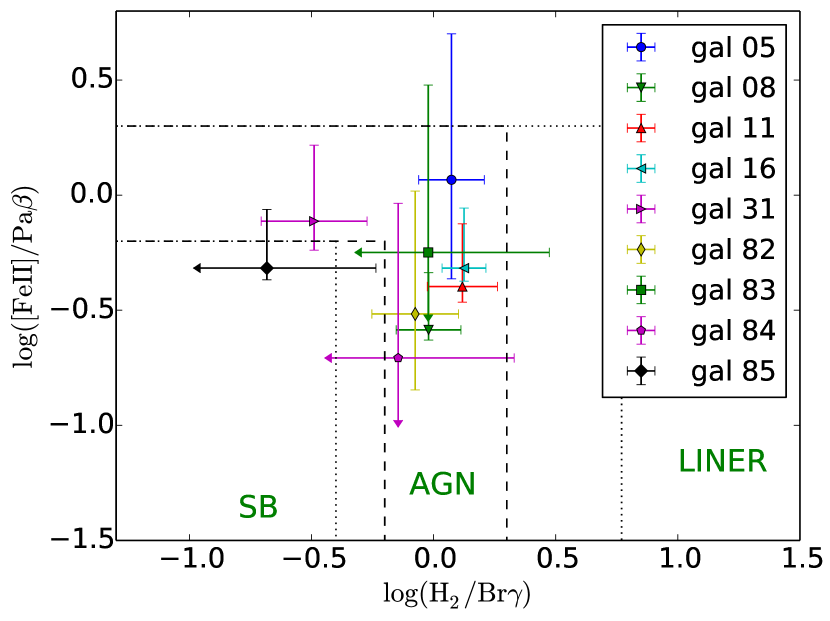
A diagnostic diagram in the NIR has been suggested by Larkin et al. (1998) and further developed by Rodríguez-Ardila et al. (2004, 2005); Riffel et al. (2013). It uses the line ratios and Fe ii to distinguish between excitation from pure photoionization and from pure shocks. It shows a transition from starburst galaxies to LINERs, passing AGNs where both excitation mechanisms are of importance (see also models by Dors et al., 2012). We use the conversion factors Fe iiFe ii (Nussbaumer & Storey, 1988) and (Osterbrock & Ferland, 2006) to convert the accessible Pa and Fe ii line fluxes to the needed -band line fluxes. In contrast to the -band ratio, the used lines Pa and Fe ii are seperated in wavelength by an amount where reddening effects become significant. The line ratio will change by a factor of which corresponds to for the Calzetti et al. (2000) extinction law ( and denote the extinction at the wavelength of [Fe ii] and Pa resp., while denotes visual extinction). This means that for a typical extinction of , we underestimate the line ratio by 10% and by 60% for an extreme extinction of . Since extinction could not be reliably determined from our data, we include this uncertainty in the error bars.
Nine out of eleven observed galaxies have the required line detections to be placed in the diagnostic diagram at least with upper limits. All of these galaxies are consistent with AGN photoionization. This confirms that LLQSOs already show a significant to dominating contribution of non-stellar emission from the central AGN. However, some galaxies are shifted towards the region where starburst dominated galaxies are located. This underlines the importance of both ionization mechanisms in the LLQSO sample. The more detailed analysis of individual objects (Appendix A) shows more indications for ongoing star formation in several objects.
With the present data, we can only probe the excitation mechanisms in a single aperture, corresponding to the central . With follow-up integral-field spectroscopy, we will be able to trace the ionization mechanisms in a spatially resolved way (see pilot study by Busch et al., 2015).
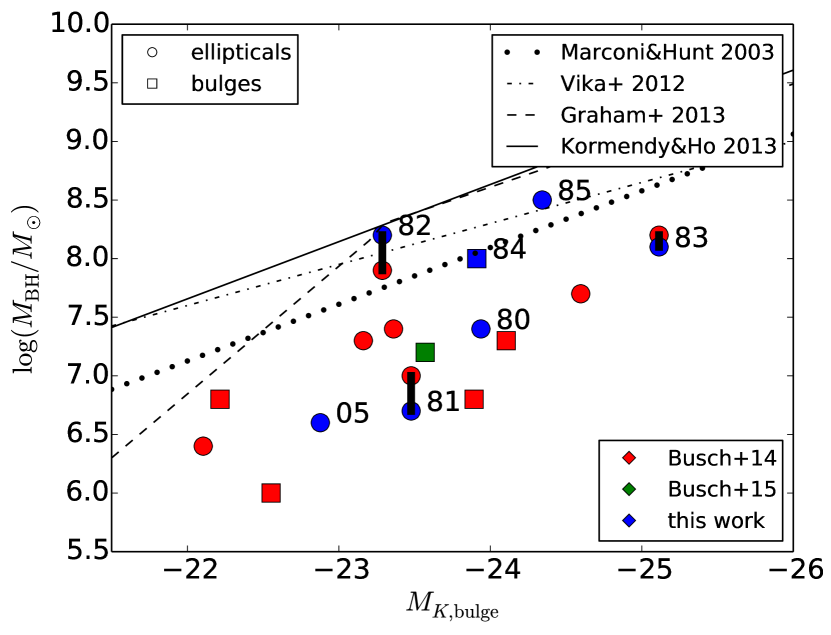
4.2 Black hole mass - bulge luminosity relation
We use the broad component of the Pa emission line that we detect in nine out of eleven galaxies to estimate the mass of the central supermassive black hole. According to Kim et al. (2010)
| (6) |
The calculated black hole masses are presented in Table 5. We compare them to black hole masses available from Schulze & Wisotzki (2010) and Schulze (priv. communication). They used optical spectra and computed BH masses using the scaling relation between broad line region (BLR) size and continuum luminosity by Bentz et al. (2009) and the scale factor from Netzer et al. (1990) which results in:
| (7) |
The mass estimates agree well with each other. The deviations are dex which is small given the uncertainties of BH mass estimates in general. The BH mass estimates from Pa in the NIR thus confirm Schulze’s masses from H that we used in Busch et al. (2014) to test the relation.
Furthermore, we get BH masses for four galaxies that we did not have BH masses of before (HE0036–5133, HE2112–5926, HE2211–3903, HE2221–0221). We use the -band bulge magnitudes derived in Busch et al. (2014) to plot them in the diagram (Fig. 6). The new data points confirm the results found in the previous studies (Busch et al., 2014, 2015). With the new data we enlarged the sample from 12 to 16 LLQSOs that systematically lie below published relations of inactive galaxies which makes the findings even more robust.
Recently, specific growth rates of the BH and the stellar host have been used to explore the time evolution (or “flow patterns”) in the relation. AGN that are offset from the relation mostly have evolutionary vectors which are anti-correlated with their positions. That means, that they are moving back towards the relation (Merloni et al., 2010; Sun et al., 2015). As discussed in Busch et al. (2014), possible explanations for a deviation of active galaxies from a near-linear relation are (a) bulges which contain young stellar populations (as opposed to the usual picture that bulges are mainly consisting of old stars) and are therefore brighter at given mass, or (b) undermassive black holes that are in a growing phase. Both scenarios fit into a framework of bulge and black hole coevolution that is not solely based on a “classical” merging of galaxies but includes interaction of the black hole and the surrounding host galaxy via AGN feeding and feedback. The offset of the LLQSOs in the BH - bulge relation might thus shed light on the sequence of star forming and BH fuelling/feedback phases which is an important component for understanding the BH - bulge coevolution.
According to the NIR diagnostic diagram (Sect. 4.1) the analysed galaxies are dominated by the AGN. However, some objects are shifted towards the location of star formation dominated sources. Furthermore, in the discussion of individual objects (see Appendix) we point out that many objects show indications for ongoing star formation. This could indicate overluminous bulges associated with lower mass-to-light ratios.
As pointed out in Bertram et al. (2007), LLQSOs are rich in cold molecular gas. Here, we find more than half of our objects to show molecular hydrogen emission in the near-infrared, which indicates that part of the molecular gas content is also excited. Furthermore, several of the objects can be classified as (ultra-)luminous infrared galaxies ((U)LIRGs). While the presence of molecular gas and star formation are related (e.g. see the famous Kennicutt-Schmidt law; Kennicutt, 1998) and molecular gas is therefore a prerequisite for star formation, the role of molecular gas in the context of AGN fueling is not fully understood. On the one hand, Riffel et al. (2015, and references therein) show that H2 is usually located in a disk in the plane of the galaxy and often shows inflows to the center (is a tracer of AGN fueling). On the other hand, cold molecular gas can also be found in outflows (feedback; García-Burillo et al., 2014).
Recently, an alternative explanation for the offset in the relation has been proposed (Graham, 2012; Graham & Scott, 2013; Scott et al., 2013; Graham & Scott, 2015). They suggest that the relation between BH mass and stellar mass (and luminosity) of the host spheroid is a “broken” relation, with a near-linear relation only for high BH masses (). Galaxies with lower BH masses are found to follow a different, steeper relation which indicates that the black hole is growing more rapidly than the surrounding spheroid. Graham (2015) states that the LLQSOs presented in Busch et al. (2014) follow the relation of lower-mass galaxies. We see that all eleven galaxies (plus the five galaxies added since then) are systematically shifted below the relation though. This indicates that LLQSOs are also offset from the new relation. However, reliable mass-to-light ratios are indispensable to decide on the validity of the offset of active galaxies. As discussed above, a lower mass-to-light ratio would be expected in the case of enhanced nuclear star formation.
By using integral-field spectroscopy, Busch et al. (2015) show that in the case of HE 1029–1831 circumnuclear star formation shifts the LLQSO away from the relation of inactive galaxies. Only by using spatially resolved data at highest angular resolution (using-adaptive optics assisted integral-field spectroscopy with e.g. SINFONI at the Very Large Telescope) as done in the mentioned pilot study, central AGN emission and circumnuclear star formation can be reliably disentangled.
| source | |||||||
|---|---|---|---|---|---|---|---|
| [] | [] | ||||||
| 05 HE0036–5133 | 1300 | 6.6 | — | — | — | 38.1a𝑎aa𝑎aHE0036 is an X-ray transient source (Grupe et al., 1995) and was at its peak luminosity during the ROSAT observations. | |
| 08 HE0045–2145 | — | — | — | 6.0 | — | ||
| 11 HE0103–5842 | — | — | — | 6.8 | 37.7 | ||
| 16 HE0119–0118 | 3200 | 7.9 | 7.9 | 38.0 | |||
| 31 HE0323–4204 | 3200 | 7.8 | 7.6 | 38.0 | |||
| 80 HE2112–5926 | 2900 | 7.4 | — | — | — | — | |
| 81 HE2128–0221 | 1800 | 6.7 | 7.0 | 37.7 | |||
| 82 HE2129–3356 | 5000 | 8.2 | 7.9 | 38.5 | |||
| 83 HE2204–3249 | 4000 | 8.1 | 8.2 | 38.7 | |||
| 84 HE2211–3903 | 3900 | 8.0 | — | — | — | 38.0 | |
| 85 HE2221–0221 | 4300 | 8.5 | — | — | — | — |
4.3 Far-infrared properties
Seven galaxies are listed in the IRAS Faint Source Catalog (Moshir, 1990). We present the fluxes measured at , , , and in Table 6. From these, infrared luminosities
| (8) |
and far-infrared luminosities
| (9) |
can be calculated (Sanders & Mirabel, 1996). With the calibration of Panuzzo et al. (2003), we can further calculate FIR-star formation rates:
| (10) |
One has to keep in mind that the far-infrared (FIR) luminosity traces the star formation rate on 100 Myr-timescales and can therefore not directly be compared to star formation rates from the often used estimators H and Br that trace recent star formation. Furthermore, the far-infrared luminosity , particularly if measured in galaxy-wide apertures, can be heavily affected by AGN emission and should therefore rather be seen as an upper limit.
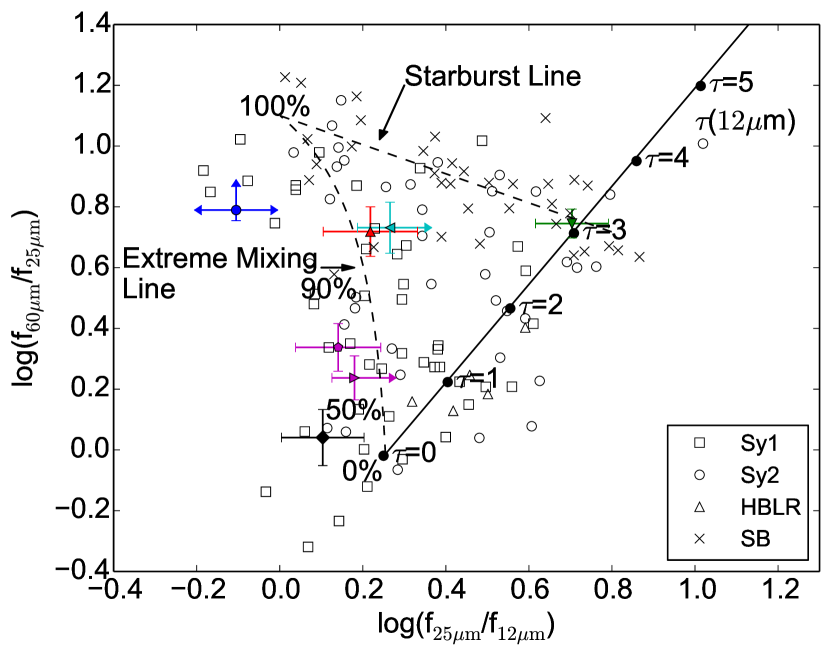
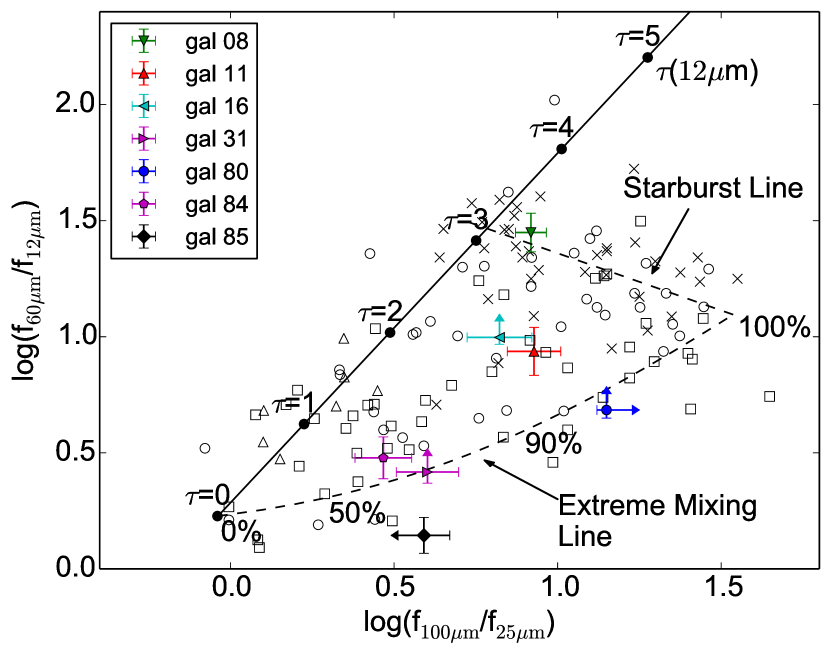
In an attempt to constrain the contribution of the AGN to the FIR luminosity, we place the galaxies in the FIR colour-colour diagrams, taken from Kewley et al. (2000) (see Fig. 7). In these, the typical area of starburst galaxies is indicated by a dashed line. Furthermore, a reddening line is marked by a solid line. The mixing line corresponds to the mixture of a typical unreddened Seyfert-1 spectrum with a “warm” starburst. Although the diagrams show an ambiguity between the mixing of AGN and starburst and reddening, we can make the following statements: HE0045 is completely dominated by the starburst which is fully consistent with the findings discussed notes on the individual object in the Appendix. All other galaxies have significant contributions from the AGN. For HE0103, HE0119, and HE2112, this contribution is less than 50% while it is higher than 50% for HE0323 and HE2211. HE2221 is completely dominated by the AGN which is consistent with the finding in the imaging study (Busch et al., 2014) where it is the galaxy with the highest AGN fraction in the sample of 20 galaxies.
| source | SFRFIR | ||||||
|---|---|---|---|---|---|---|---|
| [mJy] | [mJy] | [mJy] | [mJy] | [] | [] | [] | |
| 08 HE0045–2145 | 17 | ||||||
| 11 HE0103–5842 | 10 | ||||||
| 16 HE0119–0118 | 44 | ||||||
| 31 HE0323–4204 | 13 | ||||||
| 80 HE2112–5926 | 7 | ||||||
| 84 HE2211–3903 | 13 | ||||||
| 85 HE2221–0221 | — |
5 Conclusions
In this paper, we analysed near-infrared -band longslit spectra of eleven galaxies from the low-luminosity type-1 QSO sample. Low-resolution spectroscopy provides an insight into the gas reservoirs and possible excitation mechanisms. Our main results are the following:
-
1.
All galaxies show the hydrogen recombination line Pa and most galaxies also Br. In nine out of eleven galaxies, we detect broad components as expected for type-1 AGN. In two galaxies, only narrow components are visible. One of those, HE0045–2145, is clearly a misclassification and rather a starburst galaxy than an AGN. Therefore, it has to be removed from the LLQSO sample.
-
2.
From the broad components of the Pa emission line, we have estimated black hole masses. For those galaxies with previous black hole mass estimates, the masses agree well with our new masses. We can add four more data points in the black hole mass - bulge luminosity diagram which we discussed in Busch et al. (2014), supporting the finding that LLQSOs do not follow the black hole mass - bulge luminosity relations of inactive galaxies. We discuss that the nature of this offset is essential for the understanding of the BH - host galaxy evolution.
-
3.
From continuum fits, we derived estimates for the contributions of stars, hot dust (from obscuring torus) and power law. The stellar component is significant in all galaxies, ranging from (AGN dominated) to (dominated by stellar component). Dust temperatures are in the range of K which is typical for type-1 AGN.
-
4.
More than half of the galaxies show strong molecular hydrogen lines which is indicative for a large reservoir of warm, excited molecular gas. The detection of molecular hydrogen in this study motivates deeper follow-up observations in order to study the H2 excitation mechanisms in LLQSOs in more detail.
-
5.
We analyse the gas excitation mechanisms in the galaxies using a near-infrared diagnostic diagram ( vs. Fe ii). All galaxies fall in a region populated by AGN. However, several tend towards the region of star forming galaxies, emphasising the relevance of both, star formation and AGN, in LLQSOs.
To conclude, the here analysed spectra point at the importance of both, non-stellar continuum emission as well as stellar radiation, in the LLQSO sample. From our data, however, no clear trend can be seen which means some galaxies are clearly dominated by stellar radiation, others by non-stellar continuum emission while others are a mixture. The diversity of radiation mechanisms confirms the theory that the LLQSO sample constitutes a transition between the clearly AGN dominated QSOs at higher redshift and the probably mainly secularly evolving galaxies with - if at all - only very weak nuclear activity.
The analysed sources are all offset from the relation. At the same time, they show signs for ongoing or recent star formation, which may indicate overluminous bulges due to lower mass-to-light ratios.
Additional multi-wavelength data and spatially resolved integral-field spectroscopy will be analysed to further investigate the interplay between AGN activity and star formation in the observed LLQSOs.
Acknowledgements.
The authors thank the anonymous referee for comments that helped to improve the paper. This work was supported by the Deutsche Forschungsgemeinschaft (DFG) via SFB 956, subproject A2. G. Busch and N. Fazeli are members of the Bonn-Cologne Graduate School for Physics and Astronomy (BCGS). S. Smajić is member of the International Max Planck Research School for Astronomy and Astrophysics Bonn/Cologne (IMPRS). M. Valencia-S. received funding from the European Union Seventh Framework Programme (FP7/2007-2013) under grant agreement No. 312789. J. Scharwächter acknowledges the European Research Council for the Advanced Grant Program Number 267399-Momentum. This publication makes use of data products from the Two Micron All Sky Survey, which is a joint project of the University of Massachusetts and the Infrared Processing and Analysis Center/California Institute of Technology, funded by the National Aeronautics and Space Administration and the National Science Foundation. This research has made use of the NASA/IPAC Extragalactic Database (NED) which is operated by the Jet Propulsion Laboratory, California Institute of Technology, under contract with the National Aeronautics and Space Administration.References
- Aird et al. (2015) Aird, J., Coil, A. L., Georgakakis, A., et al. 2015, MNRAS, 451, 1892
- Alonso-Herrero et al. (2003) Alonso-Herrero, A., Rieke, G. H., Rieke, M. J., & Kelly, D. M. 2003, AJ, 125, 1210
- Alonso-Herrero et al. (1997) Alonso-Herrero, A., Rieke, M. J., Rieke, G. H., & Ruiz, M. 1997, ApJ, 482, 747
- Antonucci (1993) Antonucci, R. 1993, ARA&A, 31, 473
- Baldwin et al. (1981) Baldwin, J. A., Phillips, M. M., & Terlevich, R. 1981, PASP, 93, 5
- Barvainis (1987) Barvainis, R. 1987, ApJ, 320, 537
- Bedregal et al. (2009) Bedregal, A. G., Colina, L., Alonso-Herrero, A., & Arribas, S. 2009, ApJ, 698, 1852
- Bennert et al. (2011) Bennert, V. N., Auger, M. W., Treu, T., Woo, J.-H., & Malkan, M. A. 2011, ApJ, 726, 59
- Bentz et al. (2009) Bentz, M. C., Peterson, B. M., Netzer, H., Pogge, R. W., & Vestergaard, M. 2009, ApJ, 697, 160
- Bertram et al. (2007) Bertram, T., Eckart, A., Fischer, S., et al. 2007, A&A, 470, 571
- Black & van Dishoeck (1987) Black, J. H. & van Dishoeck, E. F. 1987, ApJ, 322, 412
- Böker et al. (2008) Böker, T., Falcón-Barroso, J., Schinnerer, E., Knapen, J. H., & Ryder, S. 2008, AJ, 135, 479
- Brand et al. (1989) Brand, P. W. J. L., Toner, M. P., Geballe, T. R., et al. 1989, MNRAS, 236, 929
- Bremer et al. (2013) Bremer, M., Scharwächter, J., Eckart, A., et al. 2013, A&A, 558, A34
- Busch et al. (2015) Busch, G., Smajić, S., Scharwächter, J., et al. 2015, A&A, 575, A128
- Busch et al. (2012) Busch, G., Zuther, J., Valencia-S., M., Moser, L., & Eckart, A. 2012, in Proceedings of Nuclei of Seyfert galaxies and QSOs - Central engine & conditions of star formation (Seyfert 2012). 6-8 November, 2012. Max-Planck-Insitut für Radioastronomie (MPIfR), Bonn, Germany. Online at http://pos.sissa.it/cgi-bin/reader/conf.cgi?confid=169, id.60, 60
- Busch et al. (2014) Busch, G., Zuther, J., Valencia-S., M., et al. 2014, A&A, 561, A140
- Calzetti (1997) Calzetti, D. 1997, AJ, 113, 162
- Calzetti et al. (2000) Calzetti, D., Armus, L., Bohlin, R. C., et al. 2000, ApJ, 533, 682
- Cardelli et al. (1989) Cardelli, J. A., Clayton, G. C., & Mathis, J. S. 1989, ApJ, 345, 245
- Cicone et al. (2014) Cicone, C., Maiolino, R., Sturm, E., et al. 2014, A&A, 562, A21
- Cid Fernandes et al. (2004) Cid Fernandes, R., Gu, Q., Melnick, J., et al. 2004, MNRAS, 355, 273
- Colina (1993) Colina, L. 1993, ApJ, 411, 565
- Colina et al. (2015) Colina, L., Piqueras López, J., Arribas, S., et al. 2015, A&A, 578, A48
- Cresci et al. (2015a) Cresci, G., Mainieri, V., Brusa, M., et al. 2015a, ApJ, 799, 82
- Cresci et al. (2015b) Cresci, G., Marconi, A., Zibetti, S., et al. 2015b, A&A, 582, A63
- Davies et al. (2014) Davies, R. I., Maciejewski, W., Hicks, E. K. S., et al. 2014, ApJ, 792, 101
- Davies et al. (2007) Davies, R. I., Müller Sánchez, F., Genzel, R., et al. 2007, ApJ, 671, 1388
- Davies et al. (2003) Davies, R. I., Sternberg, A., Lehnert, M., & Tacconi-Garman, L. E. 2003, ApJ, 597, 907
- Davies et al. (2005) Davies, R. I., Sternberg, A., Lehnert, M. D., & Tacconi-Garman, L. E. 2005, ApJ, 633, 105
- Diniz et al. (2015) Diniz, M. R., Riffel, R. A., Storchi-Bergmann, T., & Winge, C. 2015, MNRAS, 453, 1727
- Dopita et al. (1998) Dopita, M. A., Heisler, C., Lumsden, S., & Bailey, J. 1998, ApJ, 498, 570
- Dors et al. (2012) Dors, Jr., O. L., Riffel, R. A., Cardaci, M. V., et al. 2012, MNRAS, 422, 252
- Draine & Woods (1990) Draine, B. T. & Woods, D. T. 1990, ApJ, 363, 464
- Eckart et al. (1994) Eckart, A., van der Werf, P. P., Hofmann, R., & Harris, A. I. 1994, ApJ, 424, 627
- Falcón-Barroso et al. (2014) Falcón-Barroso, J., Ramos Almeida, C., Böker, T., et al. 2014, MNRAS, 438, 329
- Ferrarese & Merritt (2000) Ferrarese, L. & Merritt, D. 2000, ApJ, 539, L9
- Fischer et al. (2006) Fischer, S., Iserlohe, C., Zuther, J., et al. 2006, A&A, 452, 827
- García-Burillo et al. (2003) García-Burillo, S., Combes, F., Hunt, L. K., et al. 2003, A&A, 407, 485
- García-Burillo et al. (2014) García-Burillo, S., Combes, F., Usero, A., et al. 2014, A&A, 567, A125
- Gebhardt et al. (2000) Gebhardt, K., Bender, R., Bower, G., et al. 2000, ApJ, 539, L13
- Glikman et al. (2006) Glikman, E., Helfand, D. J., & White, R. L. 2006, ApJ, 640, 579
- Graham (2012) Graham, A. W. 2012, ApJ, 746, 113
- Graham (2015) Graham, A. W. 2015, To appear in ”Galactic Bulges”, E. Laurikainen, R.F. Peletier, and D.A. Gadotti (eds.), Springer Publishing [arXiv:1501.02937]
- Graham & Driver (2007) Graham, A. W. & Driver, S. P. 2007, ApJ, 655, 77
- Graham & Scott (2013) Graham, A. W. & Scott, N. 2013, ApJ, 764, 151
- Graham & Scott (2015) Graham, A. W. & Scott, N. 2015, ApJ, 798, 54
- Grupe et al. (1995) Grupe, D., Beuerman, K., Mannheim, K., et al. 1995, A&A, 300, L21
- Häring & Rix (2004) Häring, N. & Rix, H.-W. 2004, ApJ, 604, L89
- Helou (1986) Helou, G. 1986, ApJ, 311, L33
- Hopkins et al. (2007) Hopkins, P. F., Richards, G. T., & Hernquist, L. 2007, ApJ, 654, 731
- Kauffmann et al. (2003) Kauffmann, G., Heckman, T. M., Tremonti, C., et al. 2003, MNRAS, 346, 1055
- Kennicutt (1998) Kennicutt, Jr., R. C. 1998, ApJ, 498, 541
- Kewley et al. (2001) Kewley, L. J., Dopita, M. A., Sutherland, R. S., Heisler, C. A., & Trevena, J. 2001, ApJ, 556, 121
- Kewley et al. (2000) Kewley, L. J., Heisler, C. A., Dopita, M. A., et al. 2000, ApJ, 530, 704
- Kim et al. (2010) Kim, D., Im, M., & Kim, M. 2010, ApJ, 724, 386
- Kim et al. (2008) Kim, M., Ho, L. C., Peng, C. Y., et al. 2008, ApJ, 687, 767
- König et al. (2009) König, S., Eckart, A., García-Marín, M., & Huchtmeier, W. K. 2009, A&A, 507, 757
- König et al. (2012) König, S., Eckart, A., Henkel, C., & García-Marín, M. 2012, MNRAS, 420, 2263
- Kormendy & Ho (2013) Kormendy, J. & Ho, L. C. 2013, ARA&A, 51, 511
- Kormendy & Kennicutt (2004) Kormendy, J. & Kennicutt, Jr., R. C. 2004, ARA&A, 42, 603
- Kormendy & Richstone (1995) Kormendy, J. & Richstone, D. 1995, ARA&A, 33, 581
- Krips et al. (2007) Krips, M., Eckart, A., Neri, R., et al. 2007, A&A, 464, 187
- Landt et al. (2011) Landt, H., Elvis, M., Ward, M. J., et al. 2011, MNRAS, 414, 218
- Larkin et al. (1998) Larkin, J. E., Armus, L., Knop, R. A., Soifer, B. T., & Matthews, K. 1998, ApJS, 114, 59
- Läsker et al. (2014) Läsker, R., Ferrarese, L., van de Ven, G., & Shankar, F. 2014, ApJ, 780, 70
- Leighly et al. (2009) Leighly, K. M., Hamann, F., Casebeer, D. A., & Grupe, D. 2009, ApJ, 701, 176
- Magorrian et al. (1998) Magorrian, J., Tremaine, S., Richstone, D., et al. 1998, AJ, 115, 2285
- Mahony et al. (2010) Mahony, E. K., Croom, S. M., Boyle, B. J., et al. 2010, MNRAS, 401, 1151
- Maiolino et al. (2012) Maiolino, R., Gallerani, S., Neri, R., et al. 2012, MNRAS, 425, L66
- Maiolino et al. (1996) Maiolino, R., Rieke, G. H., & Rieke, M. J. 1996, AJ, 111, 537
- Malkan (1983) Malkan, M. A. 1983, ApJ, 268, 582
- Malkan & Sargent (1982) Malkan, M. A. & Sargent, W. L. W. 1982, ApJ, 254, 22
- Marconi & Hunt (2003) Marconi, A. & Hunt, L. K. 2003, ApJ, 589, L21
- Markwardt (2009) Markwardt, C. B. 2009, in Astronomical Society of the Pacific Conference Series, Vol. 411, Astronomical Data Analysis Software and Systems XVIII, ed. D. A. Bohlender, D. Durand, & P. Dowler, 251
- Mason et al. (2015) Mason, R. E., Rodríguez-Ardila, A., Martins, L., et al. 2015, ApJS, 217, 13
- Mehdipour et al. (2012) Mehdipour, M., Branduardi-Raymont, G., & Page, M. J. 2012, A&A, 542, A30
- Merloni et al. (2010) Merloni, A., Bongiorno, A., Bolzonella, M., et al. 2010, ApJ, 708, 137
- Moser et al. (2012) Moser, L., Zuther, J., Busch, G., Valencia-S., M., & Eckart, A. 2012, in Proceedings of Nuclei of Seyfert galaxies and QSOs - Central engine & conditions of star formation (Seyfert 2012). 6-8 November, 2012. Max-Planck-Insitut für Radioastronomie (MPIfR), Bonn, Germany. Online at http://pos.sissa.it/cgi-bin/reader/conf.cgi?confid=169, id.69, 69
- Moshir (1990) Moshir, M. e. 1990, in IRAS Faint Source Catalogue, version 2.0 (1990), 0
- Müller-Sánchez et al. (2011) Müller-Sánchez, F., Prieto, M. A., Hicks, E. K. S., et al. 2011, ApJ, 739, 69
- Müller-Sánchez et al. (2013) Müller-Sánchez, F., Prieto, M. A., Mezcua, M., et al. 2013, ApJ, 763, L1
- Nelson et al. (2004) Nelson, C. H., Green, R. F., Bower, G., Gebhardt, K., & Weistrop, D. 2004, ApJ, 615, 652
- Nesvadba et al. (2010) Nesvadba, N. P. H., Boulanger, F., Salomé, P., et al. 2010, A&A, 521, A65
- Netzer et al. (1990) Netzer, H., Maoz, D., Laor, A., et al. 1990, ApJ, 353, 108
- Nussbaumer & Storey (1988) Nussbaumer, H. & Storey, P. J. 1988, A&A, 193, 327
- Osterbrock & Ferland (2006) Osterbrock, D. E. & Ferland, G. J. 2006, Astrophysics of gaseous nebulae and active galactic nuclei
- Panuzzo et al. (2003) Panuzzo, P., Bressan, A., Granato, G. L., Silva, L., & Danese, L. 2003, A&A, 409, 99
- Press et al. (1992) Press, W. H., Teukolsky, S. A., Vetterling, W. T., & Flannery, B. P. 1992, Numerical recipes in FORTRAN. The art of scientific computing
- Ramos Almeida et al. (2009) Ramos Almeida, C., Pérez García, A. M., & Acosta-Pulido, J. A. 2009, ApJ, 694, 1379
- Rashed et al. (2015) Rashed, Y. E., Eckart, A., Valencia-S., M., et al. 2015, MNRAS, in press [arXiv:1509.01403]
- Rashed et al. (2013) Rashed, Y. E., Zuther, J., Eckart, A., et al. 2013, A&A, 558, A5
- Rayner et al. (2009) Rayner, J. T., Cushing, M. C., & Vacca, W. D. 2009, ApJS, 185, 289
- Reunanen et al. (2002) Reunanen, J., Kotilainen, J. K., & Prieto, M. A. 2002, MNRAS, 331, 154
- Reunanen et al. (2003) Reunanen, J., Kotilainen, J. K., & Prieto, M. A. 2003, MNRAS, 343, 192
- Riffel et al. (2009a) Riffel, R., Pastoriza, M. G., Rodríguez-Ardila, A., & Bonatto, C. 2009a, MNRAS, 400, 273
- Riffel et al. (2013) Riffel, R., Rodríguez-Ardila, A., Aleman, I., et al. 2013, MNRAS, 430, 2002
- Riffel et al. (2006) Riffel, R., Rodríguez-Ardila, A., & Pastoriza, M. G. 2006, A&A, 457, 61
- Riffel et al. (2009b) Riffel, R. A., Storchi-Bergmann, T., Dors, O. L., & Winge, C. 2009b, MNRAS, 393, 783
- Riffel et al. (2010) Riffel, R. A., Storchi-Bergmann, T., & Nagar, N. M. 2010, MNRAS, 404, 166
- Riffel et al. (2015) Riffel, R. A., Storchi-Bergmann, T., & Riffel, R. 2015, MNRAS, 451, 3587
- Riffel et al. (2008) Riffel, R. A., Storchi-Bergmann, T., Winge, C., et al. 2008, MNRAS, 385, 1129
- Rodríguez-Ardila et al. (2004) Rodríguez-Ardila, A., Pastoriza, M. G., Viegas, S., Sigut, T. A. A., & Pradhan, A. K. 2004, A&A, 425, 457
- Rodríguez-Ardila et al. (2005) Rodríguez-Ardila, A., Riffel, R., & Pastoriza, M. G. 2005, MNRAS, 364, 1041
- Rush et al. (1993) Rush, B., Malkan, M. A., & Spinoglio, L. 1993, ApJS, 89, 1
- Sanders & Mirabel (1996) Sanders, D. B. & Mirabel, I. F. 1996, ARA&A, 34, 749
- Savorgnan et al. (2013) Savorgnan, G., Graham, A. W., Marconi, A., et al. 2013, MNRAS, 434, 387
- Scharwächter et al. (2011) Scharwächter, J., Dopita, M. A., Zuther, J., et al. 2011, AJ, 142, 43
- Schawinski et al. (2007) Schawinski, K., Thomas, D., Sarzi, M., et al. 2007, MNRAS, 382, 1415
- Schoenmakers et al. (2000) Schoenmakers, A. P., de Bruyn, A. G., Röttgering, H. J. A., van der Laan, H., & Kaiser, C. R. 2000, MNRAS, 315, 371
- Schulze & Wisotzki (2010) Schulze, A. & Wisotzki, L. 2010, A&A, 516, A87
- Scott et al. (2013) Scott, N., Graham, A. W., & Schombert, J. 2013, ApJ, 768, 76
- Silk (2013) Silk, J. 2013, ApJ, 772, 112
- Skrutskie et al. (2006) Skrutskie, M. F., Cutri, R. M., Stiening, R., et al. 2006, AJ, 131, 1163
- Smajić et al. (2012) Smajić, S., Fischer, S., Zuther, J., & Eckart, A. 2012, A&A, 544, A105
- Smajić et al. (2015) Smajić, S., Moser, L., Eckart, A., et al. 2015, A&A, in press [arXiv:1508.02664]
- Smajić et al. (2014) Smajić, S., Moser, L., Eckart, A., et al. 2014, A&A, 567, A119
- Sternberg & Dalgarno (1989) Sternberg, A. & Dalgarno, A. 1989, ApJ, 338, 197
- Storchi-Bergmann et al. (2010) Storchi-Bergmann, T., Lopes, R. D. S., McGregor, P. J., et al. 2010, MNRAS, 402, 819
- Sun et al. (2015) Sun, M., Trump, J. R., Brandt, W. N., et al. 2015, ApJ, 802, 14
- Urrutia et al. (2012) Urrutia, T., Lacy, M., Spoon, H., et al. 2012, ApJ, 757, 125
- Urry & Padovani (1995) Urry, C. M. & Padovani, P. 1995, PASP, 107, 803
- Valencia-S. et al. (2012a) Valencia-S., M., Zuther, J., Eckart, A., et al. 2012a, A&A, 544, A129
- Valencia-S. et al. (2012b) Valencia-S., M., Zuther, J., Eckart, A., et al. 2012b, in Proceedings of Nuclei of Seyfert galaxies and QSOs - Central engine & conditions of star formation (Seyfert 2012). 6-8 November, 2012. Max-Planck-Insitut für Radioastronomie (MPIfR), Bonn, Germany. Online at http://pos.sissa.it/cgi-bin/reader/conf.cgi?confid=169, id.17, 17
- Véron-Cetty & Véron (2006) Véron-Cetty, M.-P. & Véron, P. 2006, A&A, 455, 773
- Vitale et al. (2015) Vitale, M., Fuhrmann, L., García-Marín, M., et al. 2015, A&A, 573, A93
- Wisotzki et al. (2000) Wisotzki, L., Christlieb, N., Bade, N., et al. 2000, A&A, 358, 77
- Xu et al. (2012) Xu, D., Komossa, S., Zhou, H., et al. 2012, AJ, 143, 83
- Zuther et al. (2007) Zuther, J., Iserlohe, C., Pott, J.-U., et al. 2007, A&A, 466, 451
Appendix A Discussion of individual objects
In the following section, we discuss individual objects. Spectra of all galaxies are shown in Fig. 9. All spectra have been extracted from an aperture with radius corresponding to FWHM of the seeing.
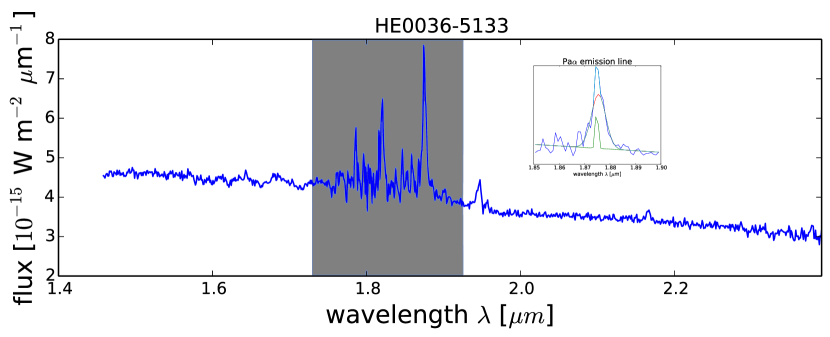
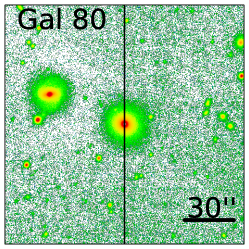
05 HE0036–5133
The galaxy HE0036–5133 (also known as WPVS7) at , corresponding to , has been classified as Narrow-line Seyfert-1 (NLS1 Véron-Cetty & Véron 2006) and found to be X-ray transient with a broad-absorption line outflow (Leighly et al. 2009). Fitting the hydrogen recombination line Pa yields a width of the broad component of around , confirming the classification as NLS1 (but see also discussion about NLS1 in Valencia-S. et al. 2012b).
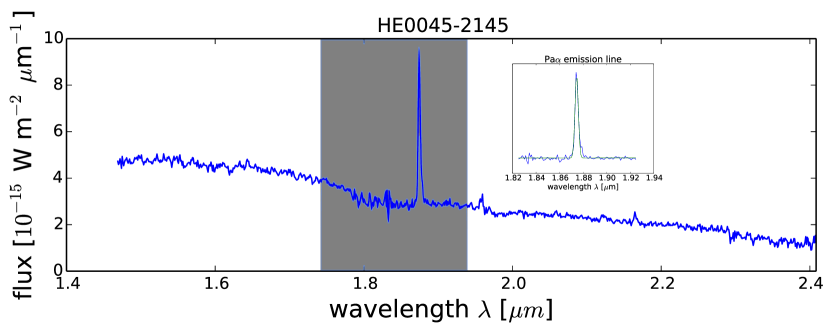
08 HE0045–2145
HE0045–2145 (also known as ESO 540-27) is a barred spiral galaxy at redshift , corresponding to , i.e. one of the closest objects in our sample. An elongated, patchy structure in the direct neighbourhood indicates tidal interaction with a possibly disrupted companion. However, more detailed information about this object is missing and the galaxy itself does not show further indications for interaction. The NIR colours suggest a low AGN contribution. Prominent stellar absorption features in the analysed nuclear spectrum support the importance of the stellar contribution also in the central region. We could not find broad components in the hydrogen recombination lines that should be visible in a type-1 galaxy.
The IRAS colours are and . In the IRAS colour-colour diagrams by Helou (1986), this lies in a region characteristic for starburst dominated galaxies. Also in the FIR colour-colour diagram of Kewley et al. (2000) (Fig. 7), this galaxy lies on the starburst line.
The galaxy has a H i gas mass of (König et al. 2009) and a gas mass of (Bertram et al. 2007). This means that stars are formed quite efficiently with a star formation efficiency (SFE) of (Eckart et al. 1994).
In the continuum fit (Sect. 3.1), the resulting black body temperature of is much higher than expected for a dusty torus with a temperature . This is the black body temperature of O and B stars, indicative for a recent starburst. All these arguments indicate that HE0045–2145 is rather dominated by its stellar components and ongoing star formation and that the classification as Seyfert 1 is invalid.
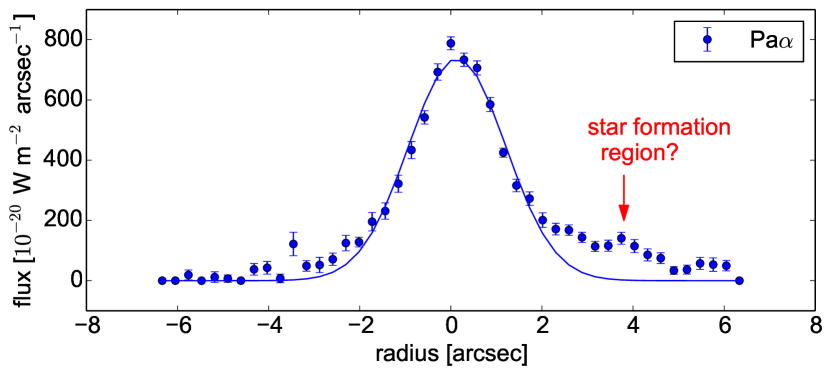
In Fig. 8 we show the radial distribution of the Pa emission which shows a bump at a distance of from the center, which could be attributed to a star formation region.
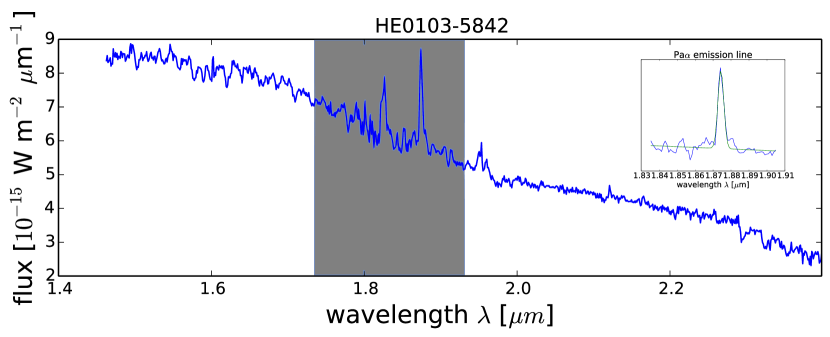
11 HE0103–5842
HE0103–5842 (also known as ESO 113-10) has a redshift of (). At first view, it looks like a barred galaxy. However, the morphological study (Busch et al. 2014) reveals a more complex underlying structure. The galaxy has been classified as Seyfert 1.8 by Véron-Cetty & Véron (2006). No broad components could be resolved in our NIR spectra. The blue continuum and deep stellar absorption features indicate that the nuclear non-stellar component is weak in comparison to the stellar component. In the continuum fit, the stellar component has indeed a fraction of .
Mehdipour et al. (2012) measure the Balmer decrement and find a significant amount of reddening in the line of sight. However, neither our NIR Pa/Br line ratios nor our continuum fit show a significant contribution from extinction.
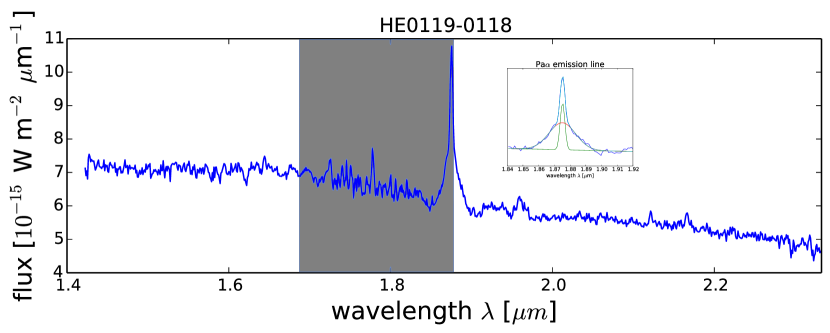
16 HE0119–0118
HE0119–0118 (also known as Mrk1503 or II Zw 1) is a barred spiral galaxy at , corresponding to and can be classified as luminous infrared galaxy (LIRG) based on the IRAS fluxes. The IRAS colours of and lie in the region of starburst dominated galaxies. In the FIR colour-colour diagrams of Kewley et al. (2000) (Fig. 7), the galaxy consistently shows a starburst contribution of at least 50%. The mass is (Bertram et al. 2007). This results in a star formation efficiency of , almost the maximum detected SFE found in Galactic star forming regions (; Eckart et al. 1994, and references therein).
The broad hydrogen recombination lines () and the position in the diagnostic diagram (Fig. 5) indicate black hole accretion and that the classification as Seyfert galaxy (Sy1.5, Véron-Cetty & Véron 2006) is correct. However, the mentioned arguments show that star formation is a significant factor.
In the imaging study (Busch et al. 2014), we found the central stellar component (bulge) to be very compact and we were not able to disentangle it from the nuclear non-stellar component. This could indicate the presence of a compact, disky pseudo-bulge. These objects are products of secular evolution and often star-forming, contrary to classical bulge components (see review of Kormendy & Kennicutt 2004). The coexistence of prominent non-stellar (e.g. broad lines) and stellar (CO absorption) features in the spectrum indicate that even in the nuclear region, star formation could be of importance, motivating more detailed investigation of this source, e.g. by integral field spectroscopy.
31 HE0323–4204
HE0323–4204 is classified as Seyfert 1.5 by Véron-Cetty & Véron (2006). The prominent broad emission line components of and , the significant power-law and hot dust contribution to the continuum flux, and the forbidden [Fe ii] line indicate strong nuclear activity.
The IRAS colours are and , i.e. between the typical colours of starburst galaxies and elliptical galaxies. In the FIR colour-colour diagrams (Fig. 7), they lie on the Extreme Mixing Line with a starburst contribution of . The continuum fit yields a stellar contribution of . Furthermore, stellar absorption lines and the position in the diagnostic diagram (Fig. 5) close to the location of starburst galaxies indicate an at least moderate contribution of star formation.
The galaxy at redshift () is very inclined and probably a spiral galaxy. In direct neighbourhood, there is a companion galaxy that shows signs of interaction. In some astronomical databases, the galaxy is sometimes confused with another spiral galaxy in the neighbourhood. This galaxy also falls into the slit but shows no signs for non-stellar contribution.
80 HE2112–5926
HE2112–5926 is part of the interacting galaxy pair ESO144-21. It has an elliptical shape, the interacting partner is a spiral galaxy. The source has redshift ().
The stellar contribution to the continuum emission is . This is in agreement with the low luminosity fraction of the non-stellar point source found in the imaging study (Busch et al. 2014).
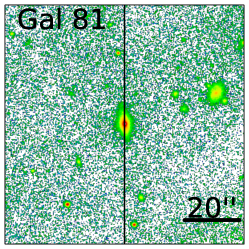
81 HE2128–0221
HE2128–0221 appears as an elongated elliptical at redshift () and is the least luminous object observed in this study. This explains the low signal-to-noise ratio. The continuum is blue and shows clear stellar absorption lines. The hydrogen recombination line is weak compared to the continuum emission. However, a broad component is clearly seen. The line almost vanishes in the noise and shows a strange (boxy) shape.
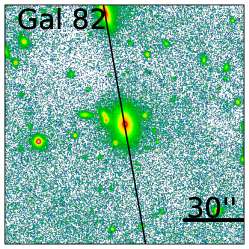
82 HE2129–3356
HE2129–3356 is an elliptically shaped galaxy at redshift (), classified as Seyfert 1.2 by Véron-Cetty & Véron (2006). The galaxy is surrounded by several objects it is most probably interacting with. Stellar absorption features are present and the stellar component contributes to the continuum emission. Nevertheless, the position in the diagnostic diagram (Fig. 5) is that of an AGN-dominated galaxy and the presence of the coronal line [Si vi] emission indicates a type-1 AGN. Also the hydrogen recombination lines are very strong and show the broadest line widths () in this study.
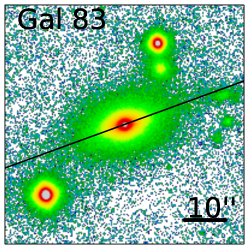
83 HE2204–3249
HE2204–3249, also known as ESO 404-29, has a redshift of () and is the most distant object observed in this study. In the imaging study (Busch et al. 2014), the decomposition revealed a non-axisymmetrical residuum which could be interpreted as dust lane. From the line ratio Pa/Br, we get a high extinction of mag. 333Assuming a case B recombination scenario, and the low-density limit with typical temperatures of K, we expect a line ratio of about Pa/Br (Osterbrock & Ferland 2006). Furthermore, assuming a dust-screen-model and the mean -dependent extinction law by Cardelli et al. (1989) with , and , by using hydrogen recombination lines we can estimate the extinction with observed fluxes and the expected line ratio . The continuum fit shows no sign of extinction (but see comment on reliability of this fit in Sect. 3.1).
Several objects located in direct neighbourhood are probably in a tidal interaction with the galaxy. The spectrum shows a very blue continuum shape and deep stellar absorption lines are seen. From the continuum fit we get a stellar contribution to the continuum of about . Additionally, the hydrogen recombination lines are rather weak compared to the continuum flux. Nevertheless, we detect broad components (), consistent with the classification as Seyfert 1.2 in Véron-Cetty & Véron (2006).
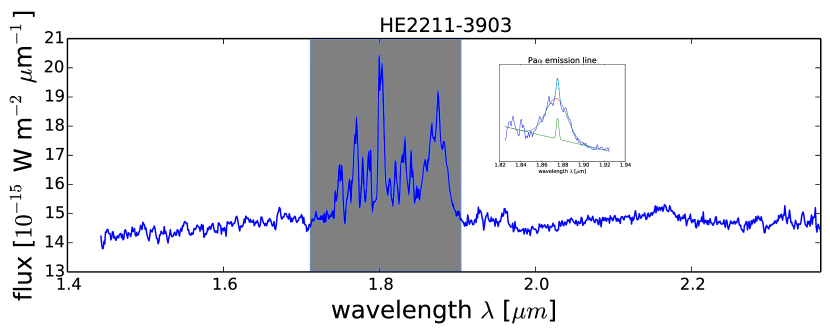
84 HE2211–3903
HE2211–3903 (also known as ESO 344-16) is a barred spiral galaxy, classified as Seyfert 1.5 galaxy by Véron-Cetty & Véron (2006). The redshift is , corresponding to . In the previous imaging study (Busch et al. 2014), we reveal an additional spiral arm and an inner ring that can also be found in emission line maps by Scharwächter et al. (2011).
Confirming the results from Fischer et al. (2006), the spectrum is very red, due to black body radiation coming from hot dust at a temperature of K which makes up about of the continuum radiation. Probably due to this high contribution of hot dust, the spectrum does not show any other features than the hydrogen recombination lines and Br.
Scharwächter et al. (2011) report that based on unresolved narrow-line ratios (N ii, O iii and S ii), the galaxy would be classified as “composite”. However, through spatially resolved spectroscopy, they find an extended narrow-line region on scales up to .
Based on IRAS fluxes, the galaxy is a LIRG. The mass is (Bertram et al. 2007), resulting in a SFE of . We see that the IRAS data suggest ongoing star formation activity. Since there is no evidence for any strong interaction, HE2211–3903 is likely to be an example for a secularly evolving galaxy.
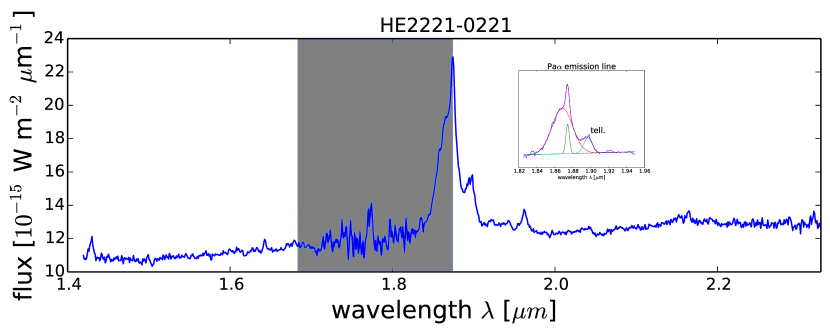
85 HE2221–0221
HE2221–0221 is also known as 3C 445 and classified as a “double double” radio galaxy (Schoenmakers et al. 2000). It has a redshift of (). In near-infrared images, it appears as round elliptical with very bright unresolved nucleus. Our imaging study (Busch et al. 2014) shows that the host is almost over-shone by the nucleus. The line is very broad and strong. However, the line is rather weak. This could be induced by reddening. Indeed, the shape and the NIR colours are extremely red and the continuum fit yields an extinction of mag. Nevertheless, the spectrum shows some stellar features, and the stellar contribution is around . The presence of strong [Si vi] emission is indicative of nuclear activity.