Large and small-scale structure of the Intermediate and High Velocity Clouds towards the LMC and SMC
Abstract
We employ Ca ii K and Na i D interstellar absorption-line spectroscopy of early-type stars in the Large and Small Magellanic Clouds to investigate the large- and small-scale structure in foreground Intermediate and High Velocity Clouds (I/HVCs). These data include FLAMES-GIRAFFE Ca ii K observations of 403 stars in four open clusters, plus FEROS or UVES spectra of 156 stars in the LMC and SMC. The FLAMES observations are amongst the most extensive probes to date of Ca ii structures on 20 arcsec scales in Magellanic I/HVCs.
From the FLAMES data within a 0.5∘ field-of-view, the Ca ii K equivalent width in the I/HVC components towards three clusters varies by factors of 10. There are no detections of molecular gas in absorption at intermediate or high velocities, although molecular absorption is present at LMC and Galactic velocities towards some sightlines. The sightlines show variations in EW exceeding a factor 7 in CH+ towards NGC 1761 over scales of less than 10 arcminutes.
The FEROS/UVES data show Ca ii K I/HVC absorption in 60 per cent of sightlines. No Na i D is found at non-Magellanic HVC velocities aside from a tentative detection towards the star LHA 120-S 93. The range in the Ca ii/Na i ratio in I/HVCs is from –0.45 to +1.5 dex, similar to previous measurements for I/HVCs. In ten sightlines we find Ca ii/O i ratios in I/HVC gas ranging from 0.2 to 1.5 dex below the solar value, indicating either dust or ionisation effects. In nine sightlines I/HVC gas is detected in both H i and Ca ii, and shows similar Ca ii/H i ratios to typical I/HVCs, and similar velocities, implying that in these sightlines the two elements form part of the same structure.
keywords:
ISM: general – ISM: clouds – ISM: abundances – ISM: structure – Galaxies: Magellanic Clouds – Open clusters and associations: Individual: NGC 330, NGC 346, NGC 1761, NGC 20041 Introduction
High velocity clouds (HVCs) were discovered over 50 years ago (Muller, Oort & Raimond 1963). Originally observed in H i, they consist of parcels of gas with velocities not compatible with Galactic rotation; in practice this means HVCs have 90–100 km s-1 if they lie at at high Galactic latitudes. Clouds with 40 90 km s-1 are referred to as Intermediate Velocity Clouds (IVCs). Recently it has become clear that at least some of the clouds lie within the halo of the Milky Way; for example Complex A (van Woerden et al. 1999), Complex WB (Thom et al. 2006), Complex C (Wakker et al. 2007, Thom et al. 2008), as well as the Cohen Stream, Complex GCP, and Complex g1 (Wakker et al. 2008).
Although some HVCs may be large clouds outside of the Milky Way halo (Blitz et al. 1999), the failure to detect HVCs far from their host galaxies (Pisano et al. 2004; Westmeier, Brüns & Kerp 2008) and the lack of stars in many HVCs (e.g. Simon & Blitz 2002; Siegel et al. 2005; Hopp, Schulte-Ladbeck & Kerp 2007) argues against this hypothysis. Likewise, comparison of the probability of detection of ionised HVCs in AGN and Galactic halo stellar sightlines by Lehner & Howk (2011) indicate that HVCs at velocities between 90 and 170 km s-1 likely reside within the halo of the Milky Way and are not further away structures within the local group. These clouds may have formed by the accretion of primordial gas, interaction of the Milky Way with its neighbouring galaxies via ram pressure and tidal stripping, or the Galactic Fountain (see Bregman 2004 for a review). Finally, Lehner & Howk show that HVCs at extreme velocities (170 km s-1) lie beyond the Galactic Halo and are not discussed further here.
I/HVCs are important to study as they may provide fuel for star formation in the Milky Way (see the review by Wakker & van Woerden 1997; Fox et al. 2014), and provide information on close encounters and/or winds from the SMC and LMC (Olano 2008; Lehner, Staveley-Smith & Howk 2009).
In the present paper we employ FLAMES Ca ii K archive spectra of four open clusters in the Large and Small Magellanic Clouds (LMC, SMC) to investigate the small-scale (11 arcseconds to 25 arcminutes) structure of the I/HVCs in the lines-of-sight to these galaxies. We also use FEROS and UVES observations of 156 LMC and SMC stellar targets in Ca ii K and Na i D to probe large- (degree-) scale variations in I/HVC column density. Observations of interstellar Ca and Na towards the Magellanic Clouds was first performed by Blades (1980), with subsequent observations in different wavelength bands and theoretical work by Savage & de Boer (1981), Songaila (1981), Songaila, Cowie & York (1981), Songaila et al. (1986), Andreani & Vidal-Madjar (1988), Blades et al. (1988a,b), Wayte (1990), Molaro et al. (1993), Welty et al. (1997, 1999), Richter et al. (1999), Bluhm et al. (2001), Staveley-Smith et al. (2003), André et al. (2004), Olano (2008), Lehner et al. (2009) and Welty, Xue and Wong (2012). These and other references indicate that some I/HVCs contain molecular gas and dust, often show multi-component velocity structure, and have abundance patterns sometimes consistent with those of the Magellanic Clouds and sometimes with the Milky Way. The velocity fields of Magellanic HVCs have been interpreted as being caused by spiral structure in the LMC (Blades 1980), winds from the LMC (Olano et al. 2004), or interaction of LMC/SMC and Milky Way gas (Olano et al. 2008). Background sources in the Magellanic Clouds have also been used to study the absorption-line structure within the Milky Way (e.g. André et al. 2004, Nasoudi-Shoar et al. 2010, van Loon et al. 2013; Smoker, Keenan & Fox 2015).
Our paper is laid out as follows. Section 2 describes the sample of stars towards the Magellanic Clouds and a description of the data reduction for the optical spectra. In Sect. 3 we provide the main results, including the FLAMES, FEROS and UVES spectra towards the Magellanic system. Section 4 presents the discussion which covers the velocity dependence on RA of LMC I/HVCs, abundance ratios using optical and previous UV data, and large- and small-scale structure variations in Ca ii K of the I/HVCs towards the LMC and SMC. Finally, Sect. 5 gives a summary of the main findings.
2 The sample, observations and data reduction
2.1 Archival FLAMES and FEROS data towards the LMC and SMC
FLAMES111FLAMES (Pasquini et al. 2002) is a multi-object, intermediate and high resolution spectrograph, mounted on the VLT/Unit Telescope 2 (Kueyen) at Cerro Paranal, Chile, operated by ESO. observations towards four open clusters in the LMC and SMC were retrieved from the ESO archive and are used to study the I/HVCs towards these galaxies and their variation on small scales. Table 1 presents the basic cluster data, and Fig. 1 shows the locations of the stellar sightlines.
The FLAMES spectra use the HR2 setting, providing a spectral resolution of 16 km s-1 and wavelength coverage from 3850Å to 4045Å, covering the Ca ii K line. Full details of the sample, data reduction and analysis are given in Smoker et al. (2015) where the structure of the low-velocity (Galactic) gas and its variation on small scales is investigated and all the spectra are presented. The S/N ratios of the spectra are 30 or 60 per pixel for the two SMC clusters, and 95 or 135 for the two LMC clusters. Minimum and maximum star-star separations are 11 arcsec to 27 arcmin, 14 arcsec to 20.7 arcmin, 14 arcsec to 22.2 arcmin, and 11 arcsec to 20 arcmin, respectively, for NGC 330, NGC 346, NGC 1761 and NGC 2004. These correspond to transverse separations of 3–500 pc at the distance of the Magellanic clouds.
| Cluster | Alternative | Location | () | Dist | Exp time | Median S/N | Stars | Scales | Mag. scales |
|---|---|---|---|---|---|---|---|---|---|
| name | (deg.) | (kpc) | (s) | at Ca ii K | used | probed () | probed (pc) | ||
| NGC 330 | Kron 35 | SMC | 302.42, –44.66 | 61 | 13650 | 30 | 110 | 0.2 – 27.4 | 3.6 – 486 |
| NGC 346 | Kron 39 | SMC | 302.14, –44.94 | 61 | 6825 | 60 | 109 | 0.3 – 20.7 | 5.3 – 367 |
| NGC 1761 | LH 09 | LMC | 277.23, –36.07 | 51 | 13650 | 135 | 109 | 0.2 – 22.3 | 3.0 – 331 |
| NGC 2004 | KMHK 991 | LMC | 277.45, –32.63 | 51 | 13650 | 95 | 75 | 0.2 – 20.0 | 3.0 – 297 |

Additionally, FEROS222FEROS (Kaufer et al. 1999) is a high-resolution echelle spectrograph, mounted on the 2.2 m Telescope at La Silla, Chile, operated by ESO. and UVES observations towards 71 early-type stars in the LMC and 85 from the SMC were downloaded from the ESO archive. These observations have a spectral resolution of 6.3 km s-1 with a median S/N ratio of 35 per pixel in Ca ii and 75 in Na i D. The stars observed are listed in Smoker et al. (2015), with Fig. 2 showing the location of the stars in () coordinates. The species considered in this paper are shown in Table 2.

| Trans. | -value | IP | |
|---|---|---|---|
| (Å) | (eV) | ||
| Ca ii K | 3933.661 | 0.627 | 11.87 |
| Na i D1 | 5889.951 | 0.641 | 5.14 |
| Na i D2 | 5895.924 | 0.320 | 5.14 |
The data were reduced using the FEROS pipeline (in MIDAS) or the reduced spectra downloaded from the ESO archive in the case of UVES. For FEROS the reduction was undertaken using both standard and optimum extraction, with and without cosmic ray removal, respectively. Agreement was found to be good between the two methods. To check the quality of the results, the equivalent widths and velocities of a handful of lines were compared with previous UVES333UVES (Dekker et al. 2000) is a high resolution echelle spectrograph, mounted on the VLT/Unit Telescope 2 (Kueyen) at Cerro Paranal, Chile, operated by ESO. observations of a few B-type stars taken from the on-line version of the Paranal Observatory Project (POP) survey (Bagnulo et al. 2003). Agreement was found to be within 1 km s-1 for velocities and within 5 per cent for equivalent widths for strong lines.
The individual FEROS or UVES spectra were co-added using scombine within iraf444iraf is distributed by the National Optical Astronomy Observatories, U.S.A., converted into ascii format and then read into the spectral analysis software dipso for further analysis. Initially this included shifting to the Kinematical Local Standard of Rest (LSR) using corrections generated by the program rv (Wallace & Clayton 1996), then normalising the spectra by fitting polynomials to the stellar continuum in the region of interest. The RMS of the normalisation procedure gives the S/N ratio in the final spectra. For the region around Na i D, telluric spectra were removed as described in Hunter et al. (2006).
Equivalent widths, velocity centroids and full width half maximum (FWHM) velocity values of the optical transitions were obtained by fitting Gaussians to the normalised spectra using the elf package within dipso (Howarth et al. 2003). These results were used as initial inputs to the vapid code (Howarth et al. 2002) which provide the final values of the column densities and -values by curve-of-growth analysis. Errors were derived as described in Hunter et al. (2006).
2.1.1 21 cm data from the GASS and LAB surveys
For the H i 21 cm spectra, we adopt measurements from the Parkes Galactic All-Sky Survey (GASS) and LABS survey (Kalberla et al. 2005; McClure-Griffiths et al. 2009). Both surveys have spectral resolutions of 1 km s-1, with spatial resolutions of 0.5∘ and and 16 arcmin, respectively. The vast majority of these spectra show no I/HVC detection, hence an H i map is not shown. We note that H i in I/HVCs is clumpy, with structures visible in H i emission down to the observational limit of 1 arcmin in objects such as Complex C (Smoker et al. 2001), compact HVCs (de Heij, Braun & Burton 2002), and miscellaneous IVCs (Ben Bekhti et al. 2009), and additionally in absorption down to scales of arcseconds or less for low-velocity gas (Diamond et al. 1989). Similarly, comparison of LMC hydrogen column densities derived from 21-cm H i observations compared with Ly show variations of a factor of 2–3 in some sightlines, indicating small-scale H i structure (Welty et al. 2012). Hence there are large systematic uncertainties in the derived H i to optical line ratios derived in the current work (see Wakker 2001 for a discussion).
3 Results
3.1 FLAMES-GIRAFFE Magellanic Cloud spectra in Ca ii
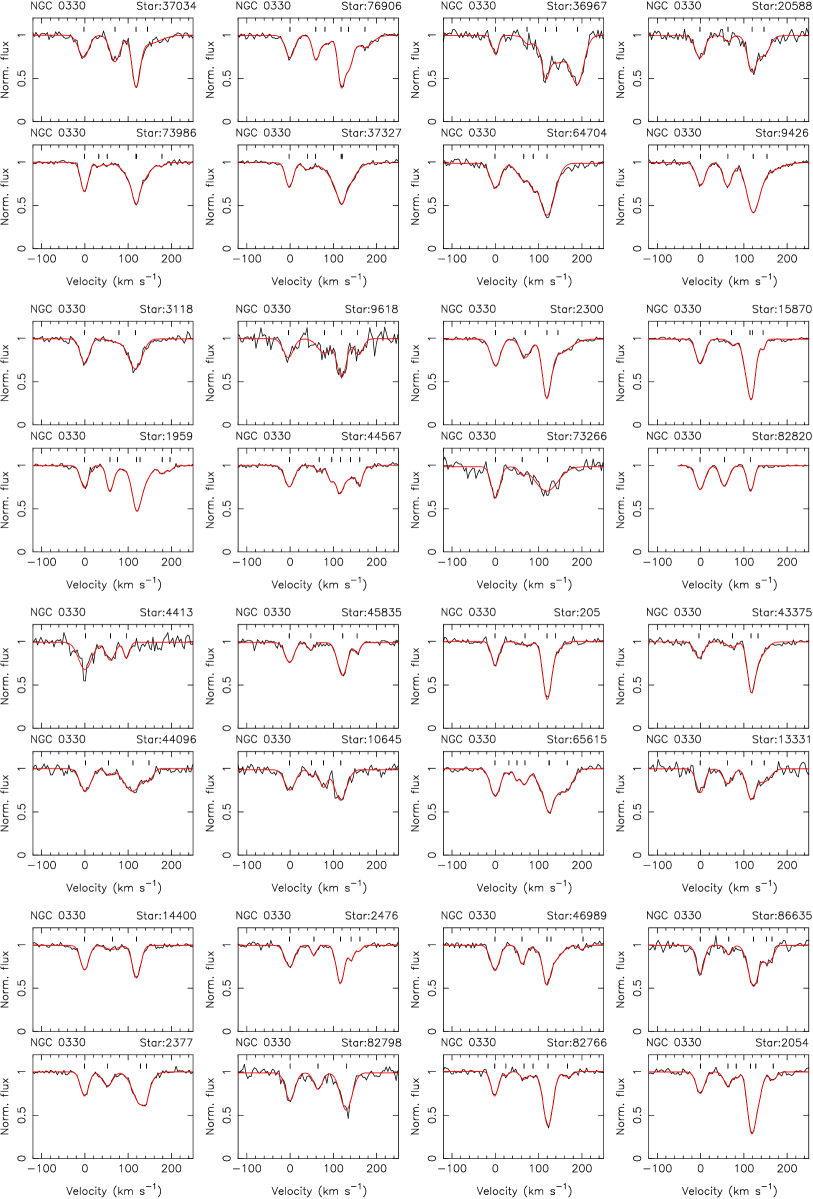
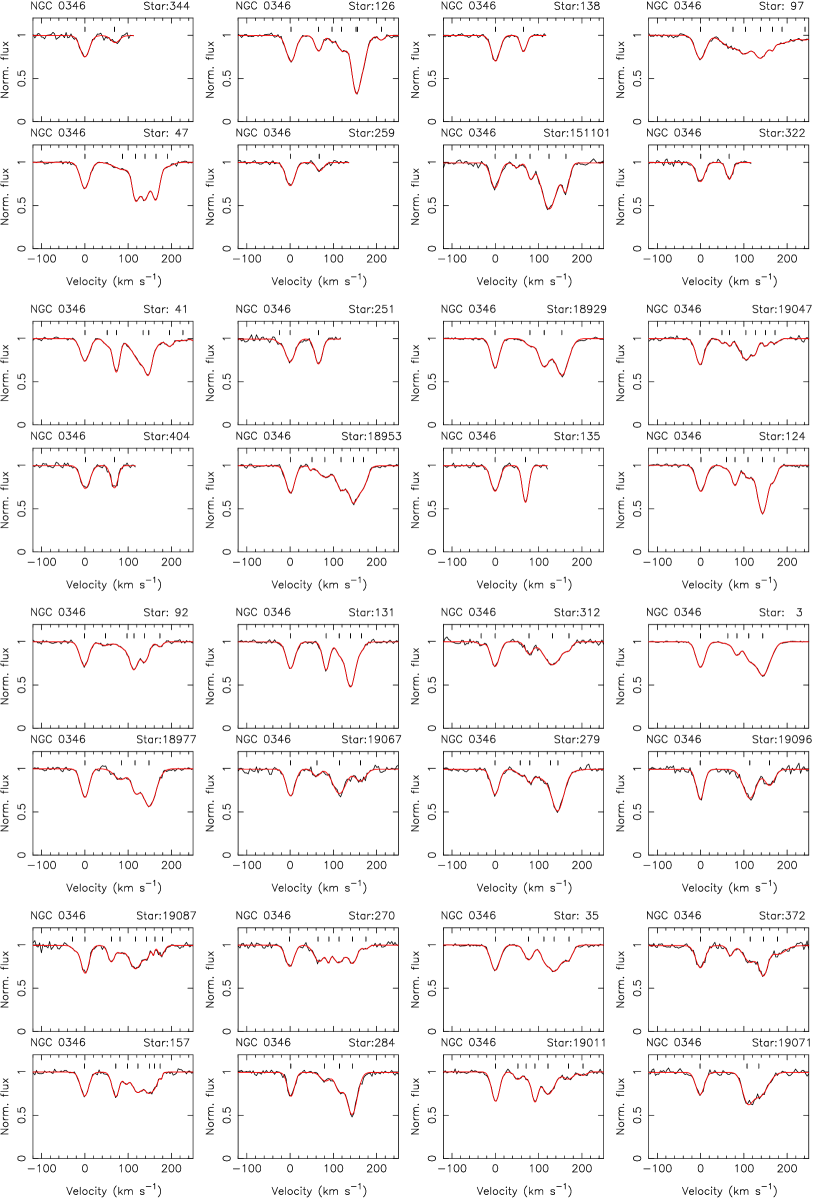
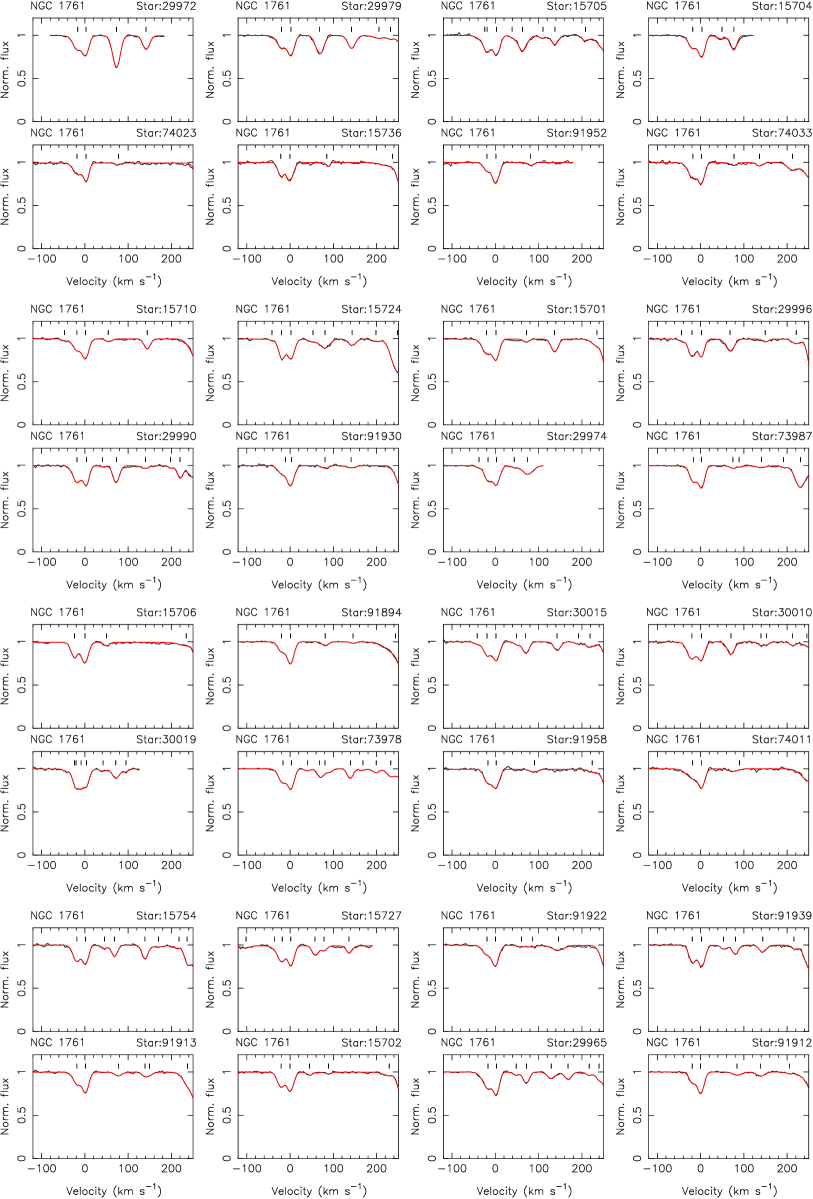
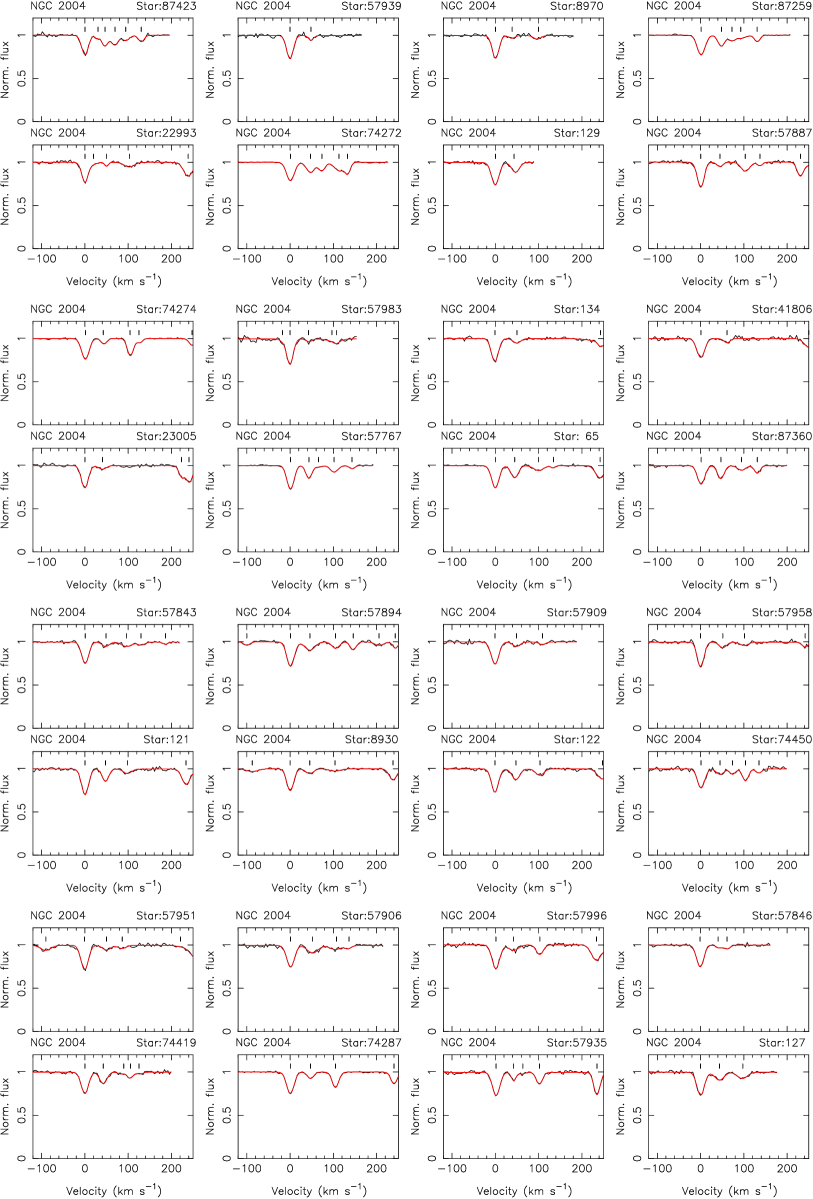
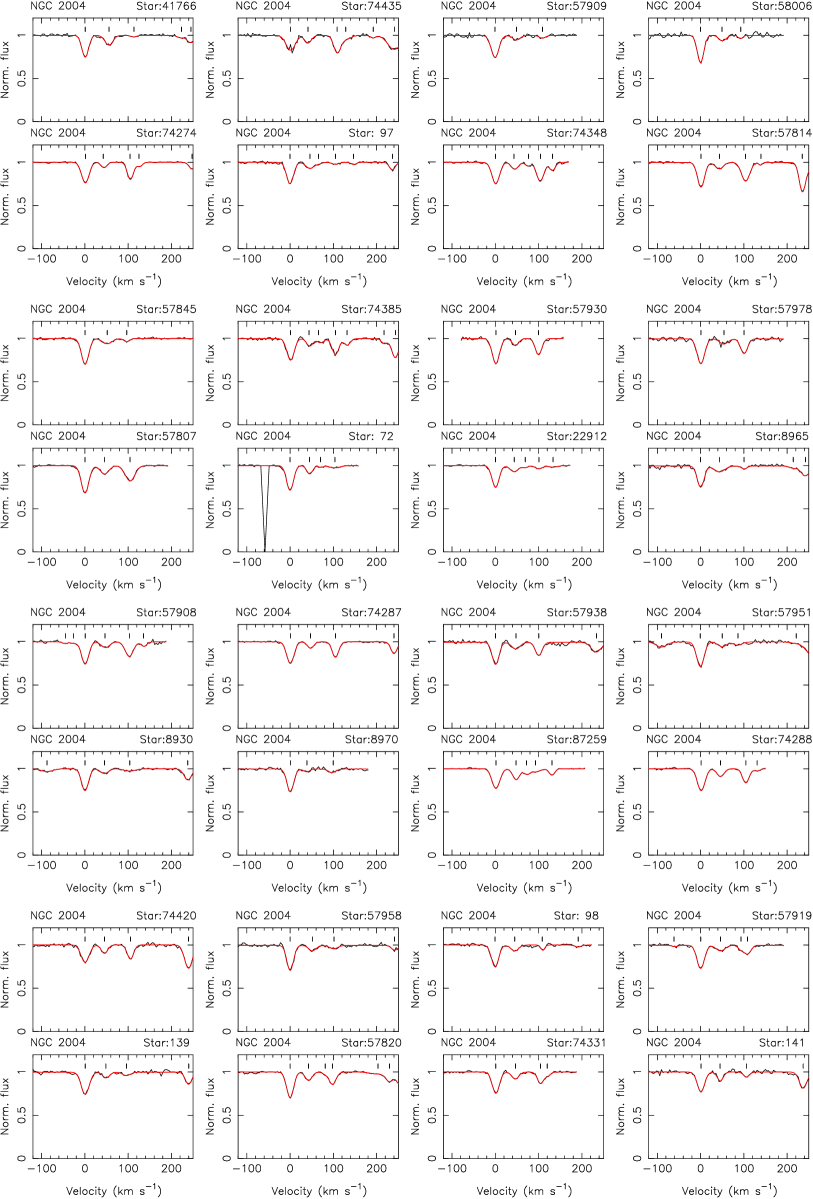
Figures A1 to A5 (available online) show, for each cluster, the spectra of the 16 star-to-star pairs with the maximum difference in equivalent width of the intermediate- or high- velocity component, to show the variation in Ca ii K I/HVC absorption-line strength. Figure 3 shows the corresponding plots for two or three objects with the strongest and weakest I/HVC component per cluster observed in Ca ii K with FLAMES. All of the spectra are shown in Smoker et al. (2015), in which the low-velocity component only is discussed and where tables of the equivalent width measurements at all velocities are given.

3.2 FEROS and UVES Magellanic Cloud spectra in Ca ii/Na i
Smoker et al. (2015) present FEROS and UVES Ca ii K and Na i D1 spectra and Voigt profile fits of stars towards the Magellanic Clouds used in our analysis as well as the nearest GASS and LAB Survey H i 21 cm spectra.
4 Discussion
4.1 Large-scale structure of I/HVCs toward the LMC
In this section we use the FEROS and UVES results to discuss the velocity field towards the LMC IVCs, component structure observed in Ca ii, variation with Ca ii column density with position, and finally elemental abundances using the current optical observations and previous UV data taken from Lehner et al. (2009).
4.1.1 Velocity dependence on RA for LMC I/HVCs
Due to its higher radial velocity, discriminating between HVC and Magellanic velocity components is easier for the LMC than for the SMC. Spectra for a total of 73 LMC stars exist in either Ca ii or Na i D, and HV components are present in many of them. In the LMC spectra there are I/HVC components present in Ca ii K at a range of velocities from +40 km s-1 up to the LMC velocity of +280 km s-1. Lehner et al. (2009) find that the velocity of the HV components in the LMC standard of rest (LMCSR) correlates with Right Ascension, which they ascribe to the clouds being formed by an energetic outflow from the LMC. On the other hand, Richter et al. (2014) also find UV absorption-line profiles at high velocities some degrees away from the LMC, which is inconsitent with the outflow scenario and implies a separate origin.
The idea that some HVCs are in some way connected to the Magellanic system is not new (Giovanelli 1981; Mirabel 1981; Olano 2004 amongst others), although what fraction of them and the exact formation mechanism is still unclear (Nidever et al. 2008). Following Lehner et al., Fig. 4 shows the velocity, plotted against their RA, of all detected components in Ca ii K from –50 to –200 km s-1 in the LMCSR, which is defined as:
| (1) |
where = + sincos is the velocity in the Galactic standard of rest frame, and is the solar circular rotation velocity around the Galactic centre. The solid line is the best-fit relationship of Lehner et al. (2009), and the current observations generally are offset by about +20 km s-1 from this. The scatter in the two datasets is similar. At RA=05h30m the range in (LMCSR) is from –100 to –170 km s-1, rising to –40 to –130 km s-1 at RA5h. A few stars (SK-66 5 and SK-70 78 marked in Fig. 4) at RA5h show absorption features in their spectra that would be expected at higher values of RA. Figure 5 shows spectra that have LMC LSR velocities of less than –130 km s-1. The features here are often close to the noise level.


4.1.2 Velocity component structure in Ca ii for LMC I/HVCs from FEROS observations
I/HVC component structure is observed in some sightlines. For the IVCs these include SK-67 206, SK-67 173, SK-68 111, LHA 120-S 116 and SK-70 120, while for the HVCs include SK-67 199 (although at low S/N), SK-68 111, SK-69 43 and AzV 490 (although there is possible stellar contamination). In only one case are there corresponding UV data from Lehner et al. (2009), specifically towards SK-68 111 where these authors only find a single component with velocities of +109.63.8 km s-1 (O i), +102.41.4 km s-1 (Fe ii) and +114.53.8 km s-1 (H i), compared with our Ca ii K velocities for HVC components of +96.11.1 and +114.61.2 km s-1. The velocity resolution for the UV data is either 7 km s-1 (STIS) or 20 km s-1 (FUSE) and with typical S/N ratios of 5–40 in the FUSE spectra, with the velocity resolution in the Parkes data being 1.6 km s-1 although with a much larger beam than the optical observations. In any case, we note that no component structure is listed in Table 1 of Lehner et al. (2009) in either the UV or H i data. However, an inspection of Fig. 1 of Lehner et al. (2009) indicates that at least for some sightlines such structure may be difficult to determine due to low S/N ratios.
Multi-component velocity profiles have been detected in other I/HVCs observed in absorption, including the Magellanic Bridge (Misawa et al. 2009), the Magellanic Stream (Fox et al. 2005, 2010), the M 15 IVC (Meyer & Lauroesch 1999; Welsh, Wheatley & Lallement 2009) and SN 1987A in the LMC (Adreani & Vidal-Madjar 1988; Blades et al 1988a,b; Welty et al. 1999). This component structure indicates that several physical regions of absorbing gas exist along the line-of-sight, and suggests but does not prove the fragmentation of initially-larger clouds. Fragmentation is also observed in deep 21 cm images of the tip of the Magellanic Stream (Stanimirović et al. 2008), and is predicted by hydrodynamic simulations of HVCs streaming through a hot corona (e.g. Bland-Hawthorn 2009). Such fragmentation may be the precursor to eventual evaporation of the I/HVCs before they reach the disk of the Milky Way (e.g. Heitsch & Putman 2009; Fox et al. 2010). A mix of fragmentation, cooling and mixing with other gas may change the ionisation structure of I/HVCs and their metalicities (Gritton et al. 2014), with non-equilibrium chemistry in diffuse interstellar gas increasing cooling (Richings, Schaye & Oppenheimer 2010) and perhaps explain the detection of Na i in some I/HVCs. If I/HVCs do evaporate before reaching the disk, then they must re-condense if they are to form the fuel needed to sustain star formation in the disk and to reproduce stellar abundance patterns (Kennicutt 1998, Chiappini 2008).
Finally, in eight of nine sightlines where we have measured the velocity of the main HVC component in Ca ii and H i, the values for both elements agree within the errors, providing evidence that at least in these cases the Ca ii and H ii sample the same phase of the interstellar medium. The discrepant case is towards SK-69 214 where the velocities are different by 5.4 km s-1, although low S/N ratio in the H i observations.
4.1.3 Variation of LMC I/HVC Ca ii column density with position
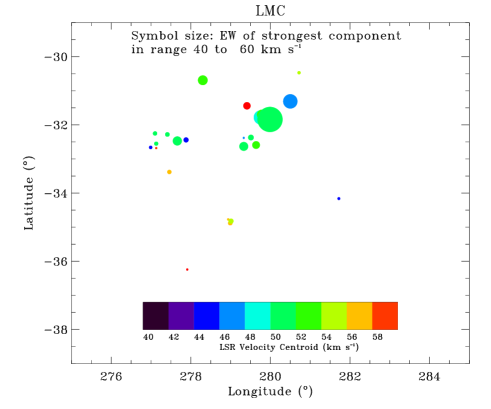
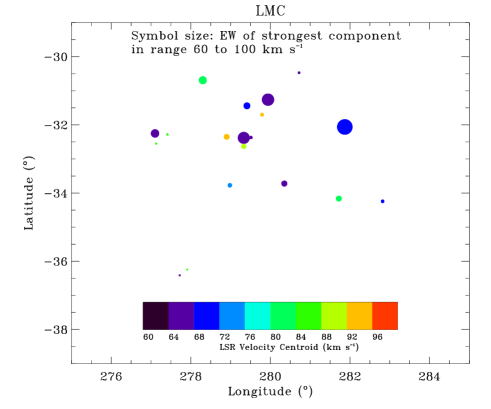
Figures A6 and A7 show maps of the Ca ii column density as a function of position for the I/HVCs observed towards the LMC, using the column densities derived from FEROS and UVES archival data. The log of the column density ranges from 10.7 cm-2 (a 3 upper limit for SK-67 14 at =278.27∘,–36.05∘) to 12.50 cm-2 (SK-69 214 at =277.99∘,–31.84∘) for the integrated flux between +40 and +60 km s-1, and from 10.7 cm-2 (a 3 upper limit for SK-67 2 at =278.36∘,–36.79∘) to 12.16 cm-2 (SK-68 114 at =278.90∘,–32.35∘) for the integrated flux between +60 and +100 km s-1.
Fig. 6 shows a histogram of the Ca ii column densities observed towards the FEROS and UVES targets. For intermediate-velocity gas with LSR velocities between +40 and +100 km s-1 the column density ranges from 10.94 to 12.50 dex with median value of 11.25 dex (N=50), compared with 11.0 to 12.4 (median=11.5 dex, N=18) in Ben Bekhti et al. (2008). For gas with velocities between +100 and +150 km s-1 the range is from 11.01 to 12.31 dex (median=11.51 dex), compared with 11.0 to 12.4 dex (median=11.5 dex, N=18) in Ben Bekhti et al. This compares with low-velocity Galactic gas in the current sample that has column densities ranging from 10.93 to 12.58 dex with median value of 11.82 dex (N=97), compared with 10.9 to 12.6 (median=11.8 dex, N=16) for the corresponding velocities in Ben Bekhti et al., and median of 11.63 dex (N=362) towards low-velocity gas observed by Smoker et al. (2003).

4.1.4 The Ca ii/H i, Ca ii/Ca i, Ca ii/O i, Ca ii/Na i and Na i/H i ratios for LMC I/HVCs
Table 3 shows 21 stars for which more than one species was detected in Ca ii, Na i, O i, Fe ii or H i. In only six of the sightlines are both Ca ii and 21-cm H i detected, with values of log [(Ca ii)/(H i)] ranging from –6.81 to –7.46. Five of the points lie on the best fit of I/HVCs studied by Wakker & Mathis (2000). However, in the IVC toward SK-69 59, which has log (H i)=18.89, the observed value of log [(Ca ii)/(H i)] of –6.89 is +0.39 dex higher than predicted by Wakker & Mathis, who found that generally halo gas has larger (Ca ii)/(H i) ratios than disc gas. In any event, the nine data points shown in Fig. 7 follow the well-known trend that the gas-phase abundance of Ca ii decreases with increasing H i column density, as ions are removed from the gas phase and onto dust grains. In their sightline towards SN1987A, Welty et al. find slightly lower ratios of log(Ca ii/Htot) = –7.2 to –7.8 for clouds with +100 to +225 km s-1, with LMC features having corresponding ratios from –7.8 to –9.1. In our current sample we did not detect Ca i in any of our FEROS sightlines, with S/N ratios of typically 50 to 90, with corresponding 5 column density upper limits of 10.5 to 10.2 dex. The ratio of Ca ii to Ca i therefore exceeds 1.5 dex towards the HVC SK-69 59 and 2.1 towards IVC SK-69 214. Finally, we note that Lehner et al. (2009) find an average metallicity in their 139 LMC sightlines of [O i/H i]=–0.51, indicating a sub-solar metallicity for the HV gas and similar to that of the LMC which has Fe/H of 0.5 dex (e.g. Bertelli et al. 1992, Carrera et al 2008).

The Ca ii/O i ratio can be used to estimate the amount of dust present in the LMC HVCs. By studying two halo sightlines, Richter et al. (2009) found HVCs with (Ca ii)/(O i) similar to the solar Ca/O abundance ratios, indicating that those clouds do not contain significant amounts of dust. However, in the diffuse ISM, depletion onto dust grains causes the value of Ca/O to be frequently more than 1.5 dex lower than the solar value. Comparing the current dataset to that of Lehner et al. (2009), we find values of N(Ca ii)/N(O i) of –3.39 for SK-67 256, –3.38 or –3.64 (depending on whether we count one or both Ca ii components) for SK-68 111, –3.66 for HD 269599, –3.06 for SK-69 50, –3.37 for SK-66 100, –3.46 for SK-67 168, –3.88 for SK-67 38, –3.09 for SK-70 60, –3.76 for SK-70 69 and –2.57 or –2.90 (depending on whether we count one or both Ca ii components) for SK-70 78. Given the solar abundances (O/H)⊙=–3.31 (Asplund et al. 2004) and (Ca/H)⊙=–5.65 (Morton 2003, 2004), the solar Ca/O ratio is –2.34, hence one of the current sightlines appears to be lightly depleted, with the other nine showing depletions of 1 dex. This suggests the presence of dust grains, although we have made no ionisation corrections, and in the diffuse ISM Ca ii is a trace species with the majority of the calcium being in the form of Ca iii (Sembach et al. 2000). Nonetheless, the presence of dust is also indicated in some of the sightlines studied by Lehner et al. (2009) that have sub-solar Si ii/S ii ratios, in agreement with the current result.
In common with earlier work (Routly & Spitzer 1952, Siluk & Silk 1974, Vallerga et al. 1993), the ratio of Ca ii/Na i D is found to increase markedly as one moves to high velocities, with the vast majority of sightlines only showing HVC absorption in Ca ii K and not in Na i D, although with some exceptions (e.g. Richter et al. 2009). In extragalactic sightlines the effect is less clear, with Richter et al. (2011) finding a range from –0.66 to 1.36, again typical of the diffuse warm interstellar medium. They note that in these conditions where the electron densities are less than 0.05 cm-3, in dust-free gas the Ca ii/Na i ratio is roughly constant at +1.6 (c.f. Crawford 1992). In the current sightlines the velocities of the two species are similar, which may be taken as evidence that the two species originate within the same physical region. The same appears to be the case for the very few sightlines in the current sample that show both species in absorption, as displayed in Fig. 8. In the current sample, the only detections of Na i D at LSR velocities exceeding +40 km s-1 (excluding the LMC and SMC) are: at +68 km s-1 with column density ratio log [(Ca ii)/(Na i)]= –0.440.05 dex) and +110 km s-1 with column density ratio log [(Ca ii)/(Na i)]=+0.410.20 dex) towards LHA 120-S 93; a borderline detection at +68 km s-1 towards SK-69 214 with log (Na I)=10.38 cm-2 but with no Ca ii detected at the same velocity; at +45 km s-1 towards SK-70 111 with log (Ca ii)=12.11 cm-2 and log (Na i)=10.98 cm-2 (a ratio of 1.130.07 dex); and finally at +135 km s-1 towards AzV 483 in the LMC. For high velocity gas, the maximum observed lower limit to the Ca ii/Na i ratio is towards SK-67 112, where log [(Ca ii)/(Na i)]1.45 dex in the feature at 101.8 km s-1. For intermediate velocity gas, the maximum ratio is toward SK-69 237 where log [(Ca ii)/(Na i)]1.58 dex.

For gas with absolute LSR velocities exceeding 40 km s-1, Ben Bekhti et al. (2008) have five detections of both Ca ii and Na i D, which have Ca ii/Na i ratios of –0.2 (complex L), 0.4, 0.4 (Magellanic Stream), 0.5 and 1.4 dex (other gas). In extra-planar gas van Loon et al. (2009) find a ratio of +0.4 dex with a range from 0.23 to 0.56 dex, which is typical of low-velocity components measured by Welsh et al. (2009) and Smoker et al. (2015). We note that for IVCs with a Ca ii/Na i ratio exceeding 5 the gas is characterised as having a temperature of 10,000 K and at least partially ionised (e.g Hobbs 1975, Welsh et al. 2009). Lower values of this ratio are found in denser and cooler clouds.
We only have upper limits to the Na i/H i ratios in the current sample. These are 8.3 dex at an H i column density of 19.0 dex, compared with the best-fit line from Wakker & Mathis that predicts an abundance ratio of 8.1 dex at this H i column density. This may be related to beam-smearing for the H i observations that we use. Higher S/N observations would likely detect Na i in these sightlines.
We have decided not to include Cloudy because the Ca ii and Na i may not be physically associated with the H i (a fact that Cloudy assumes is the case), and hence the derived ionisation correction using a Cloudy model will likely be incorrect. See Fox et al. (2013) for a discussion.
| Star | (O i) | log(O i) | (Fe ii) | log(Fe ii) | (H i) | log(H i) | (Ca ii) | log(Ca ii) | log(Na i) |
|---|---|---|---|---|---|---|---|---|---|
| (km s-1) | (cm-2) | (km s-1) | (cm-2) | (km s-1) | (cm-2) | (km s-1) | (cm-2) | (cm-2 ) | |
| SK-69 43 | – | – | – | – | 143.61.3 | 19.020.06 | 142.70.3 | 11.670.11 | 10.66 |
| SK-67 28 | – | 14.28 | – | 13.19 | – | 18.47 | – | 11.32 | 10.26 |
| SK-68 26 | – | – | – | 13.62 | – | 18.47 | – | 11.32 | 10.36 |
| SK-69 59 | 175.90.6 | 15.060.02 | 173.41.3 | 13.790.03 | 172.42.5 | 18.890.11 | 170.40.4 | 12.000.02 | 10.56 |
| SK-68 41 | – | 13.92 | – | – | – | 18.47 | – | 11.56 | 10.48 |
| SK-66 106 | – | 14.63 | – | – | – | 18.47 | – | 11.38 | 10.36 |
| SK-67 150 | – | 14.39 | – | – | – | 18.47 | – | 11.16 | 10.38 |
| SK-67 169 | – | 14.11 | – | – | – | 18.47 | 83.51.0 | 11.01 | (stellar) |
| ” | – | – | – | – | 117.41.8 | 18.930.08 | – | 10.89 | 10.24 |
| SK-70 78 | 97.24.4 | 14.270.15 | – | – | – | 18.44 | 78.54.9 | 11.43 | 10.38 |
| ” | – | – | – | – | – | ” | 91.40.5 | 11.37 | 10.38 |
| HD 269599 | 119.73.4 | 15.200.08 | 110.61.6 | 13.990.05 | 119.35.2 | 19.070.09 | 117.40.7 | 11.540.03 | 10.56 |
| SK-71 42 | – | – | – | – | 66.82.3 | 18.720.14 | 66.00.2 | 12.050.04 | 10.45 |
| LHA-120 116 | – | – | – | – | 114.91.2 | 19.110.07 | 115.91.1 | 11.660.18 | 10.49 |
| SK-68 111 | 109.63.8 | 15.150.11 | 102.41.4 | 14.350.05 | – | – | 96.11.1 | 11.410.03 | 10.48 |
| ” | – | – | – | – | 114.543.8 | 19.010.06 | 114.61.2 | 11.510.03 | 10.48 |
| SK-69 214 | – | – | – | – | 43.92.0 | 18.900.09 | 49.30.2 | 12.500.06 | 11.600.02 |
| SK-69 274 | – | – | – | – | 100.13.2 | 18.560.20 | 102.30.8 | 11.120.08 | 10.36 |
| SK-70 111 | – | – | – | – | 103.11.9 | 18.720.11 | 104.60.4 | 11.620.06 | 10.36 |
| – | – | – | – | – | – | 116.51.9 | 11.100.29 | 10.36 | |
| SK-67 256 | 144.71.7 | 14.950.03 | 138.61.4 | 13.670.04 | 141.06.0 | 18.640.13 | – | 11.56 | (stellar) |
| SK-68 171 | – | 14.46 | – | – | – | 18.47 | 79.30.4 | 11.66 | 10.56 |
| SK-70 120 | – | – | – | 13.36 | – | 18.47 | – | 11.32 | 10.56 |
| SK-68 63 | – | – | – | – | – | – | 100.40.1 | 11.170.17 | 10.19 |
| ” | – | – | – | – | – | – | 136.10.7 | 10.380.18 | 10.19 |
| ” | – | – | – | – | – | – | 152.10.2 | 11.100.17 | 10.19 |
| SK-65 47 | – | – | – | 12.80 | – | 18.47 | 47.90.6 | 11.390.17 | 10.36 |
| SK-65 47 | 144.14.9 | 14.040.10 | – | 12.80 | – | 18.47 | 145.70.4 | 10.940.17 | 10.36 |
| BI 128 | – | 14.49 | 130.82.5 | 14.040.05 | – | 18.61 | 132.10.8 | 11.060.30 | 10.66 |
| ” | – | 14.49 | – | – | – | 178.71.7 | 11.060.30 | 10.66 | |
| SK-66 18 | – | – | – | 13.29 | – | 18.47 | 165.60.0 | 11.510.17 | 10.34 |
| SK-66 100 | 107.33.1 | 14.590.06 | 109.61.4 | 13.740.04 | – | 18.48 | 109.21.7 | 11.220.18 | 10.34 |
| – | – | – | – | – | 120.40.4 | 10.870.18 | 10.34 | ||
| SK-67 168 | 110.52.6 | 15.000.06 | 114.51.3 | 14.130.03 | – | 18.55 | 108.90.5 | 11.540.17 | 10.870.18 |
| ” | – | – | – | – | – | – | 119.30.6 | 10.740.17 | 10.49 |
| – | – | – | – | – | – | 132.30.3 | 11.360.18 | 10.49 | |
| BI 237 | – | – | 109.63.0 | 14.010.05 | – | 18.62 | 103.60.8 | 11.290.17 | 10.58 |
| – | – | – | – | – | – | 131.10.6 | 11.210.17 | 10.58 | |
| SK-67 38 | 125.22.9 | 14.230.10 | 128.12.0 | 13.470.08 | – | 18.44 | 126.41.0 | 10.350.30 | 10.58 |
| SK-67 05 | – | – | 112.33.6 | 13.790.06 | – | 18.63 | 119.20.9 | 10.250.17 | – |
| ” | – | – | – | – | – | – | 132.51.0 | 10.890.17 | – |
| BI 253 | – | – | – | 13.36 | – | 18.47 | 107.11.0 | 11.051.07 | 10.49 |
| SK-68 52 | – | 14.26 | – | 13.12 | – | 18.47 | – | – | – |
| SK-69 50 | 147.90.9 | 15.420.02 | 145.31.2 | 14.390.03 | 146.93.8 | 19.230.10 | 142.10.9 | 11.620.18 | 10.55 |
| – | – | – | – | – | – | 148.10.0 | 11.380.17 | 10.55 | |
| SK-70 60 | 123.31.1 | 14.640.07 | 128.71.7 | 13.790.06 | – | 18.45 | 122.70.3 | 11.550.17 | – |
| SK-70 69 | 120.52.9 | 14.710.07 | 108.71.7 | 13.630.07 | – | 18.48 | 111.90.6 | 10.950.18 | 10.49 |
4.1.5 FEROS and UVES SMC sightlines
Eighty seven sightlines are present in the current sample towards the SMC. As the SMC has a recessional LSR velocity of +160 km s-1, the separation of the HVC and SMC components is not as marked as in the LMC. The Ca ii column density ranges from 10.7 cm-2 to 11.6 cm-2 for the integrated flux between +60 and +100 km s-1.
4.2 Small-scale spatial structure of I/HVCs towards the LMC and SMC from FLAMES-GIRAFFE observations
Non-Magellanic Ca ii K absorption is detected at intermediate- or high-velocities in many sightlines. The minimum star-star distance is 11 arcsec and the maximum is 27 arcminutes. Figure 9 shows the composite Ca ii K spectra towards the four clusters, formed by median-combining the individual normalised spectra. The spectra have been boxcar smoothed using a box of three pixels, which retains the full spectral resolution as the FWHM of emission features measured from the arc frames is four pixels. For NGC 330 the composite spectrum S/N ratio in the boxcar smoothed spectrum is 500, being 1100 for NGC 346, 1200 for NGC 1761 and 1200 for NGC 2004. Also shown in Fig. 9 are the GASS and LABS survey 21 cm H i spectrum towards both clusters. These data are presented simply to confirm the weakness in H i of the I/HVC emission – in the GASS and LAB spectra no such emission is seen.

An immediate question to ask is whether the observed absorption at I/HVC velocities could be stellar in nature. Figure 10 shows an example of a star in NGC 2004 where strong I/HVC Ca ii absorption is detected at observed (raw) velocities of +63 and +116 km s-1. The FWHM of these lines is 17 km s-1 (most or all of which is caused by instrumental broadening of 16 km s-1), compared to the width of the N ii stellar line at 3995Å of 60 km s-1. The narrowness of these I/HVC components implies they are circumstellar or interstellar rather than stellar. Furthermore, the fact that I/HVC features are observed at similar LSR velocities in both the Ca K and H i lines where the latter is detected (Figs. 11 and 12) toward many different stars is very difficult to explain if these lines are circumstellar, since in that case the velocities would vary with the velocity of the star.

We now briefly discuss the Ca ii K absorption line components toward the four individual Magellanic Cloud clusters observed with FLAMES-GIRAFFE.
4.2.1 NGC 330 (SMC)
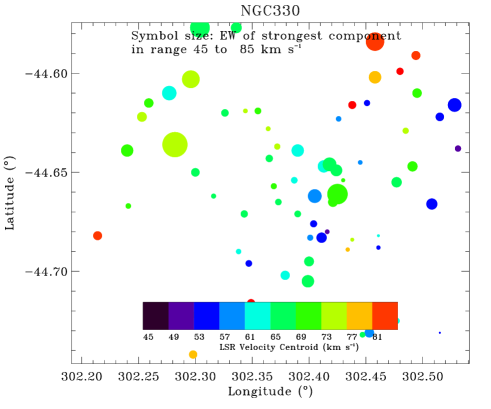
The sightlines toward NGC 330 (Figs. 3a and A8) in the SMC show Ca ii absorption at intermediate velocities between +60–80 km s-1, well separated from both the low velocity and SMC gas. Peak Ca ii equivalent widths at IVC velocities are 80 mÅ, with many sightlines having values of 60 mÅ. A number of sightlines show no corresponding Ca ii absorption with a S/N ratio of 60, which following Eqn. 2 gives a 3 upper limit on the equivalent width of 10 mÅ, given that the instrumental resolution () is 0.21Å for the GIRAFFE HR2 setting and assuming an unresolved component, viz:
| (2) |
Hence the variation in the Ca ii equivalent width for IVC components exceeds a factor of 8 (0.9 dex) over the face of the cluster. The velocity map in Fig. A8 shows no obvious large-scale structure or gradients, although clumps of gas at higher central velocities are for example present at ()(302.5∘,–44.6∘) with central velocities some 20 km s-1 higher than towards the cluster core at ()(302.4∘,–44.7∘) which is a transverse distance of 150 pc at the distance of the SMC.
4.2.2 NGC 346 (SMC)
Although I/HVC absorption is visible in many of the FLAMES NGC 346 sightlines (Fig. 3b), the gas merges into the SMC material. Hence we do not comment on the variation in these components. The highest velocity gas (presumably tracing the SMC itself) shows a huge variation in absorption-line strength and number of components. This is likely explained by the cluster having a finite depth within the SMC.
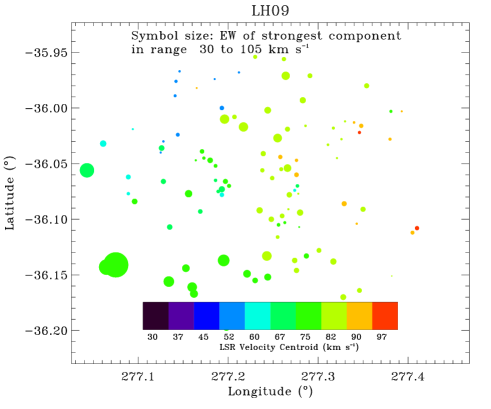
4.2.3 NGC 1761 (LMC)
NGC 1761 (LH09) is an LMC cluster that displays two apparently discrete Ca ii absorption-line components in its interstellar spectra, well-separated in velocity, which are not at Milky Way or LMC velocities (Figs. 3c, A9 and A10). One is an IVC at +90 km s-1 with a maximum equivalent width of 100 mÅ, and the other is an HVC at +160 km s-1 with a maximum equivalent width of 40 mÅ. One sightline shows no Ca ii absorption at either of these two velocities, in data with a S/N ratio of 90, corresponding to a 3 equivalent width upper limit of 7 mÅ. Thus the Ca ii equivalent widths vary across the cluster by factors of 14 (IVC gas) and 6 (HVC gas). NGC 1761 is hence the cluster in which the biggest variation in Ca ii absorption-line strength is seen in the current sample. As in the FEROS and UVES data, there are hints of two-component velocity structure towards a handful of sightlines, examples being shown in Fig. 11. The velocities of the gas in Fig. LABEL:f_FLAMES_LH09_v_p30_p105_I/HVCs_EW_Vel for the IVC between +30 and +105 km s-1 show a transverse gradient of 20 km s-1 moving from east to west in Galactic longitude. Between +125 and +200 km s-1, two clumps of gas are present (c.f. Fig. 11, with the lower velocity clump to the East centred on 277.1∘,–36.05∘) having velocities from +140–150 km s-1 and the structure to the west showing a larger variation in velocity.

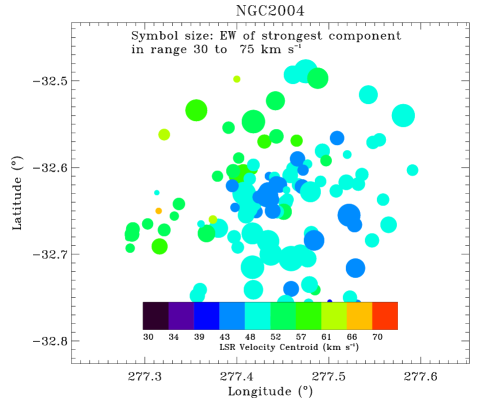
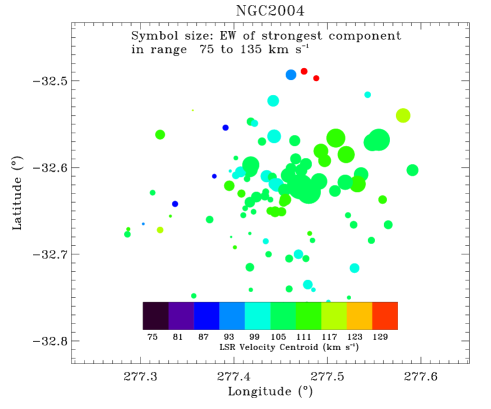
4.2.4 NGC 2004 (LMC)
NGC 2004 in the LMC shows the most complexity in intermediate- and high-velocity gas among the four clusters studied, with at least three I/HVC components visible in Ca ii, at +60, +120 and +150 km s-1, the latter two components sometimes being merged at the FLAMES resolution (Figs. 3d, 3e, A11 and A12). The peak equivalent widths in the first two components are 36 and 63 mÅ, which are 5 and 9 times stronger than the 3 upper limits in the cases where no I/HVC gas is detected in Ca ii absorption. As in the FEROS and UVES data, there are hints of two-component velocity structure towards a few sightlines, an examples being shown in Fig. 12.
4.2.5 Summary of observed I/HVC EW variations
EW variations in Ca ii for Magellanic Cloud I/HVCs exceed a factor of 10 (or 1 dex in column density) on transverse scales as small as 5 pc, assuming that the clouds lie at a distance of 55 kpc. If the clouds are in the halo of the Milky Way then the transverse scales would be reduced accordingly. These variations are large but not compared to previous work on the M 15 IVC by Meyer & Lauroesch (1999) and Welsh et al. (2009), who found column density variations of a factor exceeding 10 in IVC gas on scales of 0.1 pc. In the Galactic ISM, variations of up to 2 dex are also present on AU to pc scales in Na i (Welty & Fitzpatrick 2001; Points, Lauroesch & Meyer 2004; Lauroesch 2007 and references therein; van Loon et al. 2009; Welsh et al. 2009 amongst others). Similarly, Appendix 15 of Wakker (2001) assumes a factor 2 in variation caused by H i small-scale structure, factors of 1.5 (Ca ii) and 2.5 (Na i) to account for variations in depletion and further factors of 2 (Ca ii) and 6 (Na i) for ionisation variations. Typically, then, pc-scale variations in Ca ii and Na i are of the order 0.8 dex and 1.5 dex, respectively, which is in line with the current work. The fact that in Milky Way extra planar gas, these variations exist in material far away from supernova remnants, has been taken to imply that this small-scale structure is either continuously regenerated or persists for long periods of time (e.g. van Loon et al. 2009, although see Marasco & Fraternali 2011).
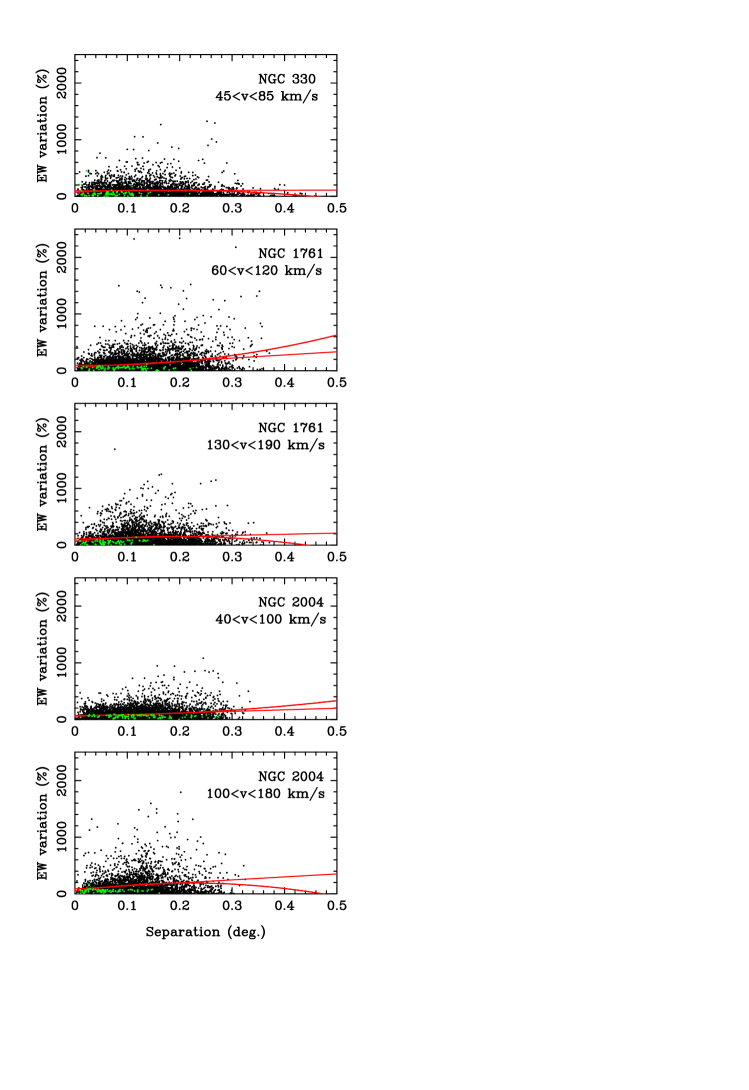
We have analysed the variations in Ca ii equivalent width towards three clusters observed with FLAMES/GIRAFFE in a total of five velocity ranges. Figure A13 shows the percentage difference in equivalent width plotted against the distance between the stellar sighlines, with the derived upper limits shown in open circles with the measurements being filled circles. Table 4 shows the derived mean, median and standard deviation of the variaion in the equivalent width values at a range of velocities. Towards NGC 2004 the variation in the high velocity component is typically a 50 to 100 percent larger than to the intermediate velocity component. This is naturally explained by the HVC being further away than the IVC and hence only the larger scales being sampled in the HVC. However, the same behaviour is not seen towards the I/HVC components towards NGC 1761. Likewise, there is no clear increase in scatter in the equivalent width for any of the clusters as the scales sampled increase from 0.05 to 0.4 degrees.
FLAMES-GIRAFFE observations of the Tarantula nebula have been presented in Na i by van Loon et al. 2013, who find that the standard deviation in equivalent width in the LMC gas is of the order of 25 percent, being 7 per cent for the Milky Way gas. The relative variation in Na i absorption as a function of angular sky separation increases from 0.50 at 10 arcsecond separation to 0.65 at 100 arcseconds, although with correlation coefficient of only 0.27.
Similarly, Van Loon et al. (2009) and Smoker et al (2015) found variations in the Ca ii equivalent width in low velocity gas of 10 per cent on scales of 0.1, a factor of 10 smaller than seen in the current I/HVC sightlines. These fluctuations were explained by a simple model of the ISM comprised of spherical clouds of radii between 1 AU and 10-pc with filling factor of 0.2 (van Loon et al. 2009 Appendix B). Due to the limited spatial resolution of our study (scales probed from around 5-pc to 500-pc assuming the clouds are at the distance of the Magellanic Clouds) we cannot use these observations to say much about the size of the clouds although from the lack of detection of I/HVC in adjacent FLAMES-GIRAFFE fibres it is clear that the filling factor is somewhat less than unity.
| Cluster | velocity range | Separation | EWMed | EWAve | EWsigma |
|---|---|---|---|---|---|
| (km s-1) | (arcmin) | variation | variation | variation | |
| (percent) | (percent) | (percent) | |||
| NGC 330 | 45 to 85 | 0.05 to 0.10 | 64.2 | 98.0 | 104.4 |
| NGC 1761 | 60 to 120 | ” | 63.2 | 101.4 | 118.5 |
| NGC 1761 | 130 to 190 | ” | 69.6 | 127.6 | 156.5 |
| NGC 2004 | 40 to 100 | ” | 51.6 | 78.0 | 83.0 |
| NGC 2004 | 100 to 180 | ” | 108.4 | 174.8 | 193.9 |
| NGC 330 | 45 to 85 | 0.10 to 0.15 | 63.4 | 103.9 | 121.4 |
| NGC 1761 | 60 to 120 | ” | 73.1 | 121.8 | 158.2 |
| NGC 1761 | 130 to 190 | ” | 97.4 | 148.7 | 161.7 |
| NGC 2004 | 40 to 100 | ” | 60.5 | 90.6 | 94.4 |
| NGC 2004 | 100 to 180 | ” | 56.7 | 108.4 | 193.0 |
| NGC 330 | 45 to 85 | 0.15 to 0.20 | 71.7 | 113.5 | 133.6 |
| NGC 1761 | 60 to 120 | ” | 76.8 | 139.4 | 189.2 |
| NGC 1761 | 130 to 190 | ” | 98.6 | 146.9 | 165.1 |
| NGC 2004 | 40 to 100 | ” | 64.7 | 100.1 | 136.7 |
| NGC 2004 | 100 to 180 | ” | 110.2 | 179.7 | 216.0 |
| NGC 330 | 45 to 85 | 0.20 to 0.25 | 75.4 | 102.4 | 100.7 |
| NGC 1761 | 60 to 120 | ” | 112.0 | 172.6 | 199.1 |
| NGC 1761 | 130 to 190 | ” | 88.7 | 144.3 | 148.7 |
| NGC 2004 | 40 to 100 | ” | 64.2 | 111.2 | 136.7 |
| NGC 2004 | 100 to 180 | ” | 112.3 | 183.2 | 236.7 |
| NGC 330 | 45 to 85 | 0.25 to 0.30 | 49.1 | 102.2 | 190.4 |
| NGC 1761 | 60 to 120 | ” | 124.7 | 211.2 | 240.6 |
| NGC 1761 | 130 to 190 | ” | 95.3 | 156.6 | 182.1 |
| NGC 2004 | 40 to 100 | ” | 109.8 | 151.1 | 159.0 |
| NGC 2004 | 100 to 180 | ” | 104.7 | 157.5 | 176.5 |
| NGC 330 | 45 to 85 | 0.30 to 0.35 | 42.2 | 72.1 | 78.1 |
| NGC 1761 | 60 to 120 | ” | 236.2 | 348.2 | 148.7 |
| NGC 1761 | 130 to 190 | ” | 92.0 | 123.5 | 98.3 |
| NGC 2004 | 40 to 100 | ” | 163.5 | 224.0 | 182.0 |
| NGC 2004 | 100 to 180 | ” | 315.6 | 259.0 | 168.7 |
| NGC 330 | 45 to 85 | 0.35 to 0.40 | 52.5 | 69.3 | 65.0 |
| NGC 1761 | 60 to 120 | ” | 571.8 | 537.8 | 463.0 |
| NGC 1761 | 130 to 190 | ” | 55.3 | 72.4 | 82.1 |
| NGC 2004 | 40 to 100 | ” | – | – | – |
| NGC 2004 | 100 to 180 | ” | – | – | – |
| NGC 330 | 45 to 85 | 0.40 to 0.45 | 47.3 | 38.2 | 22.4 |
| NGC 1761 | 60 to 120 | ” | – | – | – |
| NGC 1761 | 130 to 190 | ” | – | – | – |
| NGC 2004 | 40 to 100 | ” | – | – | – |
| NGC 2004 | 100 to 180 | ” | – | – | – |

4.3 Search for molecular gas towards and in the LMC in FLAMES spectra
Claims of molecular hydrogen detections in I/HVCs towards the LMC have been put forward by Richter et al. (1999) and Bluhm et al. (2001) using ORFEUS (Orbiting Retrievable Far and Extreme Ultraviolet Spectrometer) data. Additionally, Richter et al. (2003) obtained FUSE observations towards the LMC star Sk -68 80 and found IVC absorption at +50 km s-1 for 30 transitions and hints of molecular Hydrogen at HVC velocities of +120 km s-1, although being ”too weak to claim a firm detection”. Additionally, towards the LMC star Sk -68 82, Richter et al. (2003) co-added 15 H2 transitions and found molecular gas at IVC and HVC velocities, although noting that the stellar continuum is very irregular which complicates the interpretation of the lines observed. Re-ananalysis of this star by Lehner et al. (2009) found no HVC detection in H2. Likewise, although observations by André et al. (2004) towards the Magellanic clouds using FUSE, HST and VLT observations have also shown the presence of H2, HD and CO molecules, these detections were only at IVC, Milky Way or LMC/SMC velocities, with nothing seen corresponding to HVC gas. Searches for CO in emission towards HVCs have generally only given upper limits, (e.g. Dessauges-Zavadsky, Combes & Pfenniger 2007), possibly due to the fact that small filaments of gas are unable to provide sufficient shielding from the ambient UV field (Richter et al. 2003). Overall, the presence of molecular gas in Magellanic HVCs is still a subject of debate.
Figures 13 and 14 show GIRAFFE spectra towards NGC 1761 and NGC 2004 in the molecular lines CH+ (4232Å) and CH (4300Å). Tentative absorption in one or both of these species is detected in only three sightlines towards NGC 1761 and one towards NGC 2004 at the LMC velocity, with no absorption detected at Galactic or I/HVC velocities. We note that due to the relatively low gas density in HVCs, the detection of CH and CH+ (although not H2) is a-priori unlikely in equilibrium conditions. Na i is rarely seen in absorption in HVCs, and CH is very well correlated with Na i in the range log((Na i) cm-2)12.2-14.2 (Smoker et al. 2014).
The maximum equivalent widths measured in CH+ (4232Å) are 12.4 mÅ for NGC 1761 and 6.3 mÅ for NGC 2004, respectively. For CH (4300Å), the corresponding values was 4.7 mÅ for NGC 1761 with no obvious CH detection towards NGC 2004. Towards NGC 1761 a few of our sightlines have S/N ratios exceeding 400, which leads to a 3 detection limit of 1.7 mÅ or a EW variation exceeding 7 on scales of 10 arcminutes.
Our detection rate is much lower than in the UVES spectra of Welty et al. (2006), who found either CH and/or CH+ in 9 out of 13 LMC stars observed with UVES, likely due to the lower S/N ratio in many of our sightlines. However, the observed equivalent widths in the two samples are similar, with Welty et al. finding EWs from 0.5 to 13.0 mÅ for CH+ (4232Å) and 0.8 to 10.5 mÅ for CH (4300Å).
Finally we note that the absence of a strong molecular component in the LMC HVCs is consistent with the clouds being predominantly ionised and of a similar type to those studied by Lehner et al. (2009) using FUSE UV spectra. They found a lack of H2 and a high ionisation level (average hydrogen ionization fraction 50%), with 90% of their sightlines also showing O vi, indicating a diffuse, high-temperature component.


5 Summary
We have presented FEROS and FLAMES optical absorption line observations of intermediate and high velocity clouds toward target stars within clusters in the LMC and SMC. IVC or HVC absorption in Ca ii K is detected in 60 per cent of the FEROS and UVES sightlines and in many of the LMC FLAMES-GIRAFFE sightlines. In the I/HVCs we find a variation in the observed Ca ii equivalent width of a factor of 10 over 10 arcminutes or 150 pc at the distance of the LMC. Na i D is only tentatively detected at high velocities in one sightline, indicating the Routly-Spitzer effect. The HV gas towards NGC 2004 displays 50 to 100 percent more small-scale variation than the IV gas, indicating a structural difference between the two types of cloud. However, this is likely caused by the fact that the HV gas is further away and in any case the same difference is not seen towards our other LMC sightline NGC 1761.
In the few sightlines with good H i data the velocities of Ca ii and H i are the same within the errors, indicating that the two species are co-spatial. The Ca ii/H i ratios are higher in gas with velocities less than 70 km s-1 than in HV gas, likewise the sightine with lowest Ca/O ratio is the one with the lowest velocity. These results are consistent with previous work indicating the the metalicities of IVCs tend to be closer to solar than for HVCs. Combining these Ca ii observations with O i measurements from the literature, we conclude that dust is present at HVC velocities in the LMC sightlines.
Finally, we detect CH or CH+ molecular gas in only four sightlines (and only at Magellanic velocities and not in the Milky Way or I/HVC components).
acknowledgements
Data from ESO FEROS programme ID 078.C-0493(A) and FLAMES programme 171.D-0237(B) were taken from the ESO archive. This research has made use of the simbad Database, operated at CDS, Strasbourg, France and the ESO Archive. JVS thanks the ESO Director General Discretionary Fund and Queen’s University Belfast Visiting Scientist Fund for financial support. We would like to thank two anonymous referees whose comments significantly improved the paper.
References
- [2004] André M. K., et al., 2004, A&A, 422, 483
- [1988] Andreani P., Vidal-Madjar A., 1988, Nature, 333, 432
- [2009] Asplund M., Grevesse N., Sauva, A. J., Allende Prieto C., Kiselman D., 2004, A&A, 47, 751
- [2003] Bagnulo S., Jehin E., Ledoux C., Cabanac R., Melo C., Gilmozzi R., 2003, ESO Messenger no. 114, Page 10
- [2008] Ben Bekhti N., Richter P., Westmeier T., Murphy, M. T., 2008, A&A, 487, 583
- [2009] Ben Bekhti N., Richter P., Winkel B., Kenn F., Westmeier T., 2009, A&A, 503, 483
- [1992] Bertelli G., Mateo M., Chiosi C., Bressan A., 1992, ApJ, 388, 400
- [1980] Blades J. C., 1980, MNRAS, 190, 33
- [1988] Blades J. C., Wheatley J. M., Panagia N., Grewing M., Pettini M., Wamsteker W., 1988a, ApJ, 332, 75
- [1988] Blades J. C., Wheatley J. M., Panagia N., Grewing M., Pettini M., Wamsteker W., 1988b, ApJ, 334, 308
- [2009] Bland-Hawthorn J., 2009, IAUS, 254, 241
- [1999] Blitz L., Spergel D. N., Teuben P. J., Hartmann D., Burton W. B., 1999, ApJ, 514, 818
- [2001] Bluhm H., de Boer K. S., Marggraf O., Richter P., 2001, A&A, 367, 299
- [2004] Bregman J. N. 2004, in High Velocity Clouds, eds. H. van Woerden, B. P. Wakker, U. J. Schwarz, K. S. de Boer, Astrophys. Space Sci. Lib., 312, 341
- [2008] Carrera R., Gallart C., Hardy E., Aparicio A., Zinn R., 2008, AJ, 135, 836
- [2008] Chiappini C., in Fumes J. G. S. J., Corsini E.M., Eds, ASP Conf. Ser. 2008, Vol. 396, Formation and Evolution of Galaxy Disks, Astron. Soc. Pac., San Francisco, p. 113
- [1992] Crawford I. A., 1992, MNRAS, 259, 47
- [2000] Dekker H., D’Odorico S., Kaufer A., Delabre B., & Kotzlowski H., 2000, SPIE, 4008, 534
- [2007] Dessauges-Zavadsky M., Combes F., Pfenniger D., 2007, A&A, 473, 863
- [1989] Diamond P. J., Goss W. M., Romney J. D., Booth R. S., Kalberla P. M. W., Mebold U., 1989, ApJ, 347, 302
- [2002] de Heij V., Braun R., Burton W. B., 2002, A&A, 391, 67
- [2005] Fox A. J., Wakker B. P., Savage B. D., Sembach K. R., Tripp T. M., & Bland-Hawthorn J. 2005, ApJ, 630, 332
- [2010] Fox A. J., Wakker B. P., Smoker J. V., Richter P., Savage B. D., Sembach K. R., 2010, ApJ, 718, 1046
- [2013] Fox A. J., Richter P., Wakker B. P., Lehner N., Howk C. J., Ben Bekhti N., Bland Hawthorn J., Lucas S., 2013, ApJ, 722, 110
- [2014] Fox A. J., Wakker B. P., Barger K. A., et al., 2014, ApJ, 787, 147
- [1981] Giovanelli R., 1981, AJ, 86, 1468
- [2014] Gritton J. A., Shelton R. L., Kwak K., 2014, 795, 99
- [2009] Heitsch, F., Putman, M. E. 2009, ApJ, 698, 1485
- [1975] Hobbs L. M., 1975, ApJ, 202, 628
- [2007] Hopp U., Schulte-Ladbeck R. E., Kerp J., 2007, MNRAS, 374, 1164
- [2002] Howarth I. D., Price R. J., Crawford I. A., Hawkins I., 2002, MNRAS, 335, 267
- [2003] Howarth I. D., Murray J., Mills D., Berry D. S., 2003, Starlink User Note SUN 50, Rutherford Appleton Laboratory/CCLRC
- [2006] Hunter I., Smoker J. V., Keenan F. P., Ledoux C., Jehin E., Cabanac R., Melo C., Bagnulo S., 2006, MNRAS, 367, 1478
- [2005] Kalberla P. M. W., Burton W. B., Hartmann D., Arnal E. M., Bajaja E., Morras R., Pöppel, W. G. L. 2005, A&A, 440, 775
- [1999] Kaufer A., Stahl O., Tubbesing S., N rregaard P., Avila G., Francois P., Pasquini L., Pizzella A., 1999, The Messenger 95, 8
- [2006] Keller S. C., Wood P. R., 2006, ApJ, 642, 834
- [1998] Kennicut R. C., 1998, ApJ, 498, 541
- [2007] Lauroesch J. T., 2007, in Haverkorn M., Goss W. M., eds, ASP Conf. Ser. Vol. 365, Small Ionized and Neutral Structures in the Diffuse Interstellar Medium, Astron. Soc. Pac., San Francisco, p. 40
- [2009] Lehner N., Staveley-Smith L., Howk J. C., 2009, ApJ, 702, 940
- [2011] Lehner N., Howk J. C., 2011, Science, 334, 955
- [2011] Marasco A., Fraternali F., 2011, A&A, 525, 134
- [2009] McClure-Griffiths N. M., et al., 2009, ApJS, 181, 398
- [1999] Meyer D. M., Lauroesch J. T., 1999, 520, 103
- [1981] Mirabel I. F., 1981, ApJ, 250, 528
- [2009] Misawa T., Charlton J. C., Kobulnicky H. A., Wakker, B. P., Bland-Hawthorn J., 2009, ApJ, 695, 1382
- [mol93] Molaro P., Vladilo G., Monai S., d’Odorico S., Ferlet R., Vidal-Madjar A., Dennefeld M., 1993, A&A, 274, 505
- [2003] Morton D. C., 2003, ApJS, 149, 205
- [2004] Morton D. C., 2004, ApJS, 151, 403
- [1963] Muller C. A., Oort J. H., Raimond E., 1963, CR Acad. Sci. Paris, 257, 1661
- [2010] Nasoudi-Shoar S., Richter P., de Boer K. S., Wakker B. P., 2010, A&A, 520, 26
- [2008] Nidever D. L., Majewski S. R., Burton W. B., 2008, ApJ, 679, 432
- [2004] Olano C. A., 2004, A&A, 423, 895
- [2008] Olano C. A., 2008, A&A, 485, 457
- [2002] Pasquini, L. et al. 2002, The Messenger 110, 1
- [2004] Pisano D. J., Barnes D. G., Gibson B. K., Staveley-Smith L., Freeman K. C., Kilborn V. A., 2004, ApJ, 610, L17
- [2004] Points S. D., Lauroesch J. T., Meyer D. M., 2004, PASP, 116, 801
- [2010] Richings A. J., Schaye J, Oppenheimer B. D., 2010, MNRAS, 440, 3349
- [1999] Richter P., de Boer K. S., Widmann H., Kappelmann N., Gringel W., Grewing M., Barnstedt J., 1999, Nature, 402, 386
- [2003] Richter P., Sembach K. R., Howk J. C., 2003, A&A, 405, 1013
- [2009] Richter P., Charlton J. C., Fangano A. P. M., Bekhti N. B., Masiero J. R., 2009, ApJ, 695, 1631
- [2011] Richter P., Krause F., Fechner C., Charlton J. C., Murphy M. T., 2011, A&A, 528, 12
- [2014] Richter P., Fox A. J., Ben Bekhti N., Murphy M. T., Bomans D., Frank S., AN, 335, 92
- [1952] Routly P. M., Spitzer L., 1952, ApJ, 115, 227
- [1981] Savage B. D., de Boer K. S., 1981, ApJ, 243, 460
- [2000] Sembach K. R., Howk C. J., Ryans R. S. I., Keenan F. P., 2000, ApJ, 528, 310
- [2005] Siegel M. H., Majewski S. R., Gallart C., Sohn S. T., Kunkel W. E., Bran R., 2005, ApJ, 623, 181
- [1974] Siluk R. S., Silk J., 1974, ApJ, 192, 51
- [2002] Simon J. D., Blitz L., 2002, ApJ, 574, 726
- [2001] Smoker J. V., Roger R. S., Keenan F. P., Davies R. D., Lang R. H., Bates B., 2001, A&A, 380, 683
- [2003] Smoker J. V., et al., 2003, MNRAS, 346, 119
- [2011] Smoker J. V., Bagnulo S., Cabanac R., Ledoux C., Jehin E., Melo S., Keenan F. P., 2011, MNRAS, 414, 59
- [2014] Smoker J. V., Ledoux, C. Jehin E. Keenan F. P., Kennedy M., Cabanac R., Melo, C., 2014, MNRAS, 438, 1127
- [2015] Smoker J. V., Keenan F. P., Fox A., 2015, 582, 59
- [1981] Songaila A., 1981, ApJ, 243, L19
- [1981] Songaila A., Cowie L. L., York D. G., 1981, ApJ, 248, 956
- [1986] Songaila A., Blades J. C., Hu E. M., Cowie L. L., 1986, ApJ, 303, 198
- [2008] Stanimirović S., Hoffman S., Heiles C., Douglas K. A., Putman, M., Peek J. E. G., 2008, ApJ, 680, 276
- [2003] Staveley-Smith L., Kim S., Calabretta M. R., Haynes R. F., Kesteven M., 2003, MNRAS, 339, 87
- [2006] Thom C., Putman M. E., Gibson B. K., Christlieb N., Flynn C., Beers T. C., Wilhelm R., Lee Y. S., 2006, ApJ, 638, L97
- [2008] Thom C., Peek J. E. G., Putman M. E., Heiles Carl., Peek K. M. G., Wilhelm R., 2008, ApJ, 684, 364
- [1993] Vallerga J. V., Vedder P. W., Craig N., Welsh B. Y., 1993, ApJ, 411, 729
- [1999] van Loon J. Th., Smith K. T., McDonald I., Sarre P. J., Fossey S. J., Sharp R. G., 2009, MNRAS, 399, 195
- [2013] van Loon J. Th., Bailey M., Tatton B. L., et al., 2013, A&A, 550, 108
- [1999] van Woerden H., Schwarz U. J., Peletier R. F., Wakker B. P., Kalberla P. M. W., 1999, Nat., 400, 138
- [1997] Wakker B. P., van Woerden H., 1997, ARA&A, 35, 217
- [2000] Wakker B. P., Mathis J. S., 2000, ApJ, 544, 107
- [2001] Wakker B. P., 2001, ApJS, 136, 463
- [2007] Wakker B. P., et al., 2007, ApJ, 670, 113
- [2008] Wakker B. P., York D. G., Wilhelm R., Barentine J. C., Richter P., Beers T. C., Ivezic Z., Howk J. C., 2008, ApJ, 672, 298
- [1996] Wallace P., Clayton C., 1996, rv, Starlink User Note SUN 78, Rutherford Appleton Laboratory/CCLRC
- [1990] Wayte S. R., 1990, ApJ, 355, 473
- [2000] Wegner et al., 2000, A&AS, 143, 9
- [1999] Welsh B. Y., Wheatley J., Lallement R., 2009, PASP, 121, 606
- [1997] Welty D. E., Lauroesch J. T., Blades J. C., Hobbs L. M., York D. G., 1997, ApJ, 489, 672
- [1999] Welty D. E., Frisch P. C., Sonneborn G., York D. G., 1999, ApJ, 512, 636
- [2001] Welty D., Fitzpatrick E. L., 2001, ApJ, 551, 175
- [2006] Welty D. E., Federman S. R., Gredel R., Thorburn J. A., Lambert D. L., 2006, ApJS, 165, 138
- [2012] Welty D. E., Xue R., Wong T., 2012, ApJ, 745, 173
- [2008] Westmeier T., Brüns C., Kerp J., 2008, MNRAS, 390, 1691
Appendix A Online material
| Name | Alt name | R.A. | Dec. | mv | mb | Spect. | S/N | S/N | Inst. | ||
|---|---|---|---|---|---|---|---|---|---|---|---|
| (J2000) | (J2000) | (deg.) | (deg.) | (mag) | (mag) | type | CaK | NaD | |||
| HV 1328 | SMC V0172 | 00 32 54.90 | -73 49 19.1 | 304.70 | -43.24 | 14.17 | 14.116 | – | – | 55 | U |
| HV 1333 | SMC V0189 | 00 36 03.46 | -73 55 58.8 | 304.39 | -43.15 | 15.87 | 14.702 | – | – | 35 | U |
| HV 1335 | SMC V0193 | 00 36 55.70 | -73 56 27.9 | 304.31 | -43.15 | 15.399 | 14.746 | – | – | 50 | U |
| HV 817 | – | 00 39 16.55 | -72 01 58.4 | 304.26 | -45.06 | 14.44 | 13.77 | – | – | 50 | U |
| HV 1345 | SMC V0214 | 00 40 38.60 | -73 13 14.2 | 304.01 | -43.88 | 15.428 | 14.779 | – | – | 15 | U |
| HV 822 | – | 00 41 55.48 | -73 32 23.7 | 303.86 | -43.57 | 14.39 | 13.95 | – | – | 30 | U |
| HV 1365 | – | 00 42 00.00 | -73 44 00.0 | 303.84 | -43.38 | 15.55 | 14.94 | – | – | 30 | U |
| SV* HV 823 | – | 00 43 48.50 | -73 36 50.0 | 303.67 | -43.50 | 13.99 | 13.39 | – | – | 60 | U |
| AzV 014 | Sk 9 | 00 46 32.63 | -73 06 05.7 | 303.43 | -44.02 | 13.59 | 13.77 | O3-4V+neb | 60 | – | U |
| AzV 015 | Sk 10 | 00 46 42.14 | -73 24 55.7 | 303.40 | -43.71 | 12.984 | 13.176 | O6.5II(f) | 60 | – | U |
| AzV 018 | Sk 13 | 00 47 12.22 | -73 06 33.2 | 303.36 | -44.01 | 12.52 | 12.48 | OB | 120 | 100 | U |
| AzV 022 | Sk 15 | 00 47 38.70 | -73 07 48.8 | 303.31 | -44.00 | 12.15 | 12.25 | B2I | 70 | – | U |
| AzV 023 | Sk 17 | 00 47 38.91 | -73 22 53.9 | 303.31 | -43.74 | 12.324 | 12.236 | B2I | 120 | 200 | U |
| SMC 9251 | – | 00 47 47.60 | -73 17 28.0 | 303.30 | -43.83 | 14.90 | 14.76 | – | 70 | – | U |
| AzV 026 | Sk 18 | 00 47 50.04 | -73 08 21.0 | 303.30 | -43.99 | 12.35 | 12.55 | O7III+neb | 250 | – | U |
| AzV 047 | SMC 11925 | 00 48 51.48 | -73 25 58.5 | 303.19 | -43.69 | 13.314 | 13.496 | O8III((f)) | 60 | 60 | U |
| AzV 065 | Sk 33 | 00 50 06.08 | -73 07 45.2 | 303.07 | -44.00 | 11.12 | 11.00 | B5I | 100 | 200 | U |
| AzV 070 | Sk 35 | 00 50 18.11 | -72 38 10.0 | 303.05 | -44.49 | 10.96 | 12.40 | O9.5Iw | 130 | 130 | U |
| AzV 075 | Sk 38 | 00 50 32.39 | -72 52 36.5 | 303.02 | -44.25 | 12.604 | 12.756 | O5III(f+) | 75 | – | U |
| AzV 80 | SMC 17457 | 00 50 43.80 | -72 47 41.5 | 303.01 | -44.33 | 13.24 | 13.376 | O4-6n(f)p | 100 | 80 | U |
| DZ Tuc | SMC 17504 | 00 50 44.70 | -73 16 05.4 | 303.00 | -43.86 | 15.37 | 15.44 | B0-B0.5V | 25 | 30 | U |
| AzV 95 | SMC 19650 | 00 51 21.65 | -72 44 14.4 | 302.94 | -44.39 | 13.64 | 13.83 | O7III((f)) | 100 | 60 | U |
| AzV 104 | SMC 20656 | 00 51 38.43 | -72 48 06.1 | 302.91 | -44.33 | 13.064 | 13.226 | B0.5Ia | 70 | – | U |
| LIN 200 | Bruck 60 14 | 00 51 57.74 | -73 14 22.0 | 302.88 | -43.89 | 17.493 | 17.20 | – | 10 | 50 | U |
| AzV 120 | SMC 23151 | 00 52 15.24 | -72 09 15.8 | 302.84 | -44.97 | 14.14 | 14.43 | O9.5III | 120 | 60 | U |
| ESHC 05 | – | 00 52 06.43 | -73 06 29.4 | 302.86 | -44.02 | 14.2 | 13.983 | – | – | 100 | U |
| ESHC 03 | – | 00 52 21.50 | -73 13 33.0 | 302.84 | -43.90 | – | – | – | 30 | 25 | U |
| ESHC 02 | – | 00 52 32.60 | -73 17 08.0 | 302.82 | -43.84 | 16.957 | 17.012 | B2IV-V | 20 | 35 | U |
| ESHC 07 | – | 00 52 52.60 | -73 18 34.0 | 302.79 | -43.82 | 15.417 | 15.254 | – | 120 | 250 | U |
| ESHC 01 | LIN 232 | 00 53 02.80 | -73 17 59.4 | 302.77 | -43.83 | 15.072 | 15.079 | B4III | 20 | – | U |
| ESHC 04 | – | 00 53 56.75 | -73 10 29.4 | 302.68 | -43.95 | 14.901 | 15.049 | – | 40 | 40 | U |
| OGLE 13487 | – | 00 54 33.22 | -73 10 39.0 | 302.62 | -43.95 | 15.51 | 15.69 | – | 200 | – | U |
| ESHC 06 | LIN 264 | 00 54 37.60 | -73 04 56.0 | 302.61 | -44.04 | 15.128 | 15.177 | – | 60 | 30 | U |
| HV 1645 | – | 00 55 19.76 | -73 14 42.2 | 302.54 | -43.88 | 20.10 | 16.84 | Mira | – | 20 | U |
| LHA 115-S 23 | AzV 172 | 00 55 53.81 | -72 08 59.0 | 302.45 | -44.97 | 13.29 | 13.25 | B8[e]Ib | 10 | 30 | F |
| N330 ROB B18 | SMC 35727 | 00 56 03.70 | -72 27 12.8 | 302.44 | -44.67 | 15.57 | 15.79 | O9.5V | 30 | – | U |
| N330 ROB B28 | N330 BAL 254 | 00 56 06.80 | -72 28 34.9 | 302.44 | -44.65 | 15.52 | 15.71 | B0Ve | 30 | – | U |
| N330 ROB B32 | N330 ELS 36 | 00 56 10.65 | -72 28 10.1 | 302.43 | -44.65 | 14.74 | 14.85 | B2II | 35 | – | U |
| N330 ROB B16 | – | 00 56 18.56 | -72 26 45.4 | 302.42 | -44.68 | 13.92 | 13.98 | A2II | 60 | 40 | U |
| N330 ROB B13 | N330 ELS 125 | 00 56 20.11 | -72 27 02.3 | 302.41 | -44.67 | 15.58 | 15.78 | B2III/IVe | 20 | – | U |
| N330 ROB B38 | N330 ELS 121 | 00 56 22.56 | -72 28 35.9 | 302.41 | -44.65 | 12.474 | 12.366 | A5I | – | 70 | U |
| N330 ROB B04 | – | 00 56 30.90 | -72 28 19.0 | 302.39 | -44.65 | 15.41 | 15.58 | B1.5IVe | 25 | – | U |
| AzV 187 | Sk 68 | 00 57 31.73 | -71 19 59.3 | 302.23 | -45.79 | 11.96 | 12.09 | OB | 55 | 85 | F |
| N346 ELS 26 | SMC 42719 | 00 58 14.24 | -72 10 45.0 | 302.20 | -44.94 | 19.15 | 17.98 | B0IV(Nstr) | – | 65 | U |
| N346 ELS 12 | AzV 202 | 00 58 14.48 | -72 07 29.8 | 302.19 | -44.99 | 14.18 | 14.34 | B1Ib | – | 60 | U |
| N346 ELS 28 | – | 00 58 17.35 | -72 10 50.8 | 302.19 | -44.94 | 14.73 | 14.94 | OC6Vz | – | 70 | U |
| AzV 207 | SMC 43724 | 00 58 33.17 | -71 55 47.0 | 302.15 | -45.19 | 14.13 | 14.35 | O7V | 40 | 60 | U |
| AzV 210 | Sk 73 | 00 58 35.79 | -72 16 25.0 | 302.16 | -44.84 | 12.63 | 12.66 | OB | 50 | – | U |
| N346 ELS 18 | N346 ELS 18 | 00 58 47.03 | -72 13 01.6 | 302.14 | -44.90 | 14.66 | 14.78 | O9.5IIIe | – | 40 | U |
| AzV 214 | SMC 44784 | 00 58 54.76 | -72 13 17.2 | 302.13 | -44.90 | 13.40 | 13.39 | B1Ia | 100 | 90 | U |
| AzV 215 | Sk 76 | 00 58 55.62 | -72 32 08.5 | 302.14 | -44.58 | 12.65 | 12.75 | OB | 60 | – | U |
| N346 ELS 07 | SMC 44908 | 00 58 57.40 | -72 10 33.5 | 302.12 | -44.94 | 13.82 | 14.13 | O4V((f)) | – | 110 | U |
| AzV 216 | – | 00 58 59.13 | -72 44 34.0 | 302.15 | -44.37 | 14.15 | 14.32 | B1-3II: | 40 | – | U |
| N346 MPG 355 | SMC 45068 | 00 59 00.75 | -72 10 28.2 | 302.11 | -44.94 | 12.61 | 12.80 | O2III(f) | – | 100 | U |
| N346 MPG 368 | – | 00 59 01.80 | -72 10 31.2 | 302.11 | -44.94 | 13.95 | 14.18 | O6:V | – | 120 | U |
| N346 MPG 487 | – | 00 59 06.71 | -72 10 41.3 | 302.10 | -44.94 | 14.19 | 14.33 | O8V | – | 70 | U |
| Name | Alt name | R.A. | Dec. | mv | mb | Spect. | S/N | S/N | Inst. | ||
|---|---|---|---|---|---|---|---|---|---|---|---|
| (J2000) | (J2000) | (deg.) | (deg.) | (mag) | (mag) | type | CaK | NaD | |||
| N346 ELS 51 | SMC 45459 | 00 59 08.68 | -72 10 14.1 | 302.10 | -44.95 | 15.17 | 15.40 | O7Vz | – | 30 | U |
| N346 ELS 33 | N346 SSN 37 | 00 59 11.64 | -72 09 57.6 | 302.09 | -44.95 | 14.82 | 15.07 | O8V | – | 30 | U |
| N346 ELS 22 | SMC 45935 | 00 59 18.58 | -72 11 10.1 | 302.08 | -44.93 | 14.65 | 14.91 | O9V | – | 40 | U |
| N346 ELS 10 | AzV 226 | 00 59 20.73 | -72 17 10.7 | 302.08 | -44.83 | 14.12 | 14.19 | O7IIIn((f)) | – | 80 | U |
| HD 5980 | AzV 229 | 00 59 26.57 | -72 09 53.9 | 302.07 | -44.95 | 11.13 | 11.31 | WN3+OB | – | 60 | U |
| N346 ELS 46 | – | 00 59 31.88 | -72 13 35.2 | 302.06 | -44.89 | 15.16 | 15.44 | O7Vn | – | 40 | U |
| AzV 232 | Sk 80 | 00 59 31.96 | -72 10 46.3 | 302.06 | -44.93 | 12.12 | 12.31 | O7Iaf+ | 120 | 150 | U |
| AzV 235 | Sk 82 | 00 59 45.75 | -72 44 56.5 | 302.07 | -44.37 | 12.02 | 12.20 | B0Iaw | 100 | – | U |
| N346 ELS 31 | SMC 47478 | 00 59 54.08 | -72 04 31.0 | 302.01 | -45.04 | 14.81 | 15.05 | O8Vz | – | 60 | U |
| AzV 243 | Sk 84 | 01 00 06.71 | -72 47 19.0 | 302.03 | -44.32 | 13.71 | 13.91 | O6V | 80 | – | U |
| AzV 242 | Sk 85 | 01 00 06.86 | -72 13 57.5 | 301.10 | -44.88 | 11.7 | 11.5 | B0.7Iaw | 250 | 200 | U |
| AzV 304 | SMC 53474 | 01 02 21.47 | -72 39 14.7 | 301.79 | -44.45 | 14.66 | 14.77 | B0.5V | 70 | – | U |
| AzV 321 | SMC 54958 | 01 02 57.07 | -72 08 09.1 | 301.68 | -44.96 | 13.66 | 13.82 | O9Ib | 110 | 70 | U |
| AzV 372 | Sk 116 | 01 04 55.74 | -72 46 48.1 | 301.54 | -44.31 | 12.494 | 12.646 | O9.5Iabw | 90 | – | U |
| AzV 388 | SMC 62400 | 01 05 39.52 | -72 29 27.1 | 301.43 | -44.60 | 13.86 | 14.12 | O4V | 50 | – | U |
| AzV 398 | SMC 63413 | 01 06 09.81 | -71 56 00.8 | 301.31 | -45.15 | 13.94 | 13.98 | O9Ia: | 80 | 65 | U |
| MA93 1589 | – | 01 06 28.85 | -71 52 04.9 | 301.27 | -45.21 | 15.411 | 15.135 | A5 | 100 | – | U |
| AzV 404 | Sk 128 | 01 06 29.27 | -72 22 08.4 | 301.33 | -44.71 | 11.7 | 11.8 | OB | 200 | 120 | U |
| LHA 115-S 52 | HD 6884 | 01 07 18.22 | -72 28 03.7 | 301.25 | -44.61 | 10.32 | 10.23 | B9Iae | 45 | 125 | F |
| AzV 440 | SMC 68756 | 01 08 56.01 | -71 52 46.8 | 301.00 | -45.18 | 14.44 | 14.58 | O7V | 60 | 35 | U |
| AzV 456 | Sk 143 | 01 10 55.77 | -72 42 56.3 | 300.91 | -44.34 | 12.98 | 12.89 | OB | 70 | 200 | U |
| AzV 462 | Sk 145 | 01 11 25.92 | -72 31 20.9 | 300.83 | -44.52 | 12.464 | 12.596 | OB | 30 | 65 | F |
| AzV 469 | Sk 148 | 01 12 29.00 | -72 29 29.1 | 300.71 | -44.55 | 13.014 | 13.176 | O8II | 100 | – | U |
| HV 2195 | – | 01 14 28.05 | -72 39 53.5 | 300.54 | -44.36 | 12.99 | 12.51 | F5Ib | – | 50 | U |
| AzV 488 | Sk 159 | 01 15 08.88 | -73 21 24.3 | 300.51 | -43.66 | 11.77 | 11.90 | B0.5Iaw | 130 | 130 | U |
| AzV 483 | Sk 156 | 01 15 28.63 | -73 19 50.1 | 300.55 | -43.69 | 11.85 | 11.93 | OB | 50 | 70 | F |
| SK 160 | AzV 190 | 01 17 05.15 | -73 26 36.0 | 300.41 | -43.56 | 13.12 | 13.30 | OB: | 120 | 150 | U |
| SK 190 | – | 01 31 27.96 | -73 22 14.3 | 299.00 | -43.45 | 13.37 | 13.59 | O7.5(f)np | 90 | 65 | U |
| SK-67 2 | RMC 51 | 04 47 04.45 | -67 06 53.1 | 278.36 | -36.79 | 11.219 | 11.26 | B1.5Ia | 50 | 130 | F |
| SK -67 05 | RMC 53 | 04 50 18.92 | -67 39 38.1 | 278.89 | -36.32 | 11.2 | 11.377 | O9.7Ib | 220 | – | U |
| SK-66 1 | RMC 56 | 04 52 19.09 | -66 43 53.3 | 277.72 | -36.41 | 11.603 | 11.635 | B2Ia | 30 | 60 | F |
| SK-66 5 | RMC 57 | 04 53 30.03 | -66 55 28.3 | 277.90 | -36.24 | 10.68 | 10.76 | B3Iab | 30 | 130 | F |
| SK-67 14 | Sk -67 14 | 04 54 31.89 | -67 15 24.7 | 278.27 | -36.05 | 11.376 | 11.541 | B1.5Ia | 40 | 80 | F |
| SK -66 18 | – | 04 55 59.80 | -65 58 29.8 | 276.69 | -36.25 | 13.294 | 13.467 | O6V((f)) | 100 | 80 | U |
| SK -69 43 | HD 268809 | 04 56 10.46 | -69 15 38.2 | 280.58 | -35.33 | 11.866 | 11.964 | OB | 30 | 70 | F |
| LH 10-3061 | – | 04 56 42.46 | -66 25 18.1 | 277.20 | -36.07 | 13.595 | 13.491 | ON2III(f*) | 90 | 75 | U |
| SK -66 35 | HD 268732 | 04 57 04.47 | -66 34 38.5 | 277.38 | -35.99 | 11.494 | 11.587 | OB | 50 | 80 | F |
| SK -69 50 | LMC 33053 | 04 57 15.09 | -69 20 19.9 | 280.64 | -35.22 | 13.204 | 13.366 | O7(f)(n)p | 100 | 80 | U |
| SK -67 22 | Brey 10a | 04 57 27.44 | -67 39 02.9 | 278.64 | -35.67 | 13.314 | 13.496 | Of | 110 | – | U |
| LHA 120-S 12 | SK -67 23 | 04 57 36.80 | -67 47 37.5 | 278.80 | -35.62 | 12.66 | 12.526 | B0.5Ie | 35 | 70 | F |
| SK -69 52 | HD 268867 | 04 57 48.90 | -69 52 22.3 | 281.24 | -35.02 | 11.392 | 11.399 | OB | 50 | – | U |
| SK -67 28 | GV 135 | 04 58 39.24 | -67 11 18.7 | 278.05 | -35.69 | 12.082 | 12.269 | B0.7Ia | 35 | 85 | F |
| SK -68 26 | GV 167 | 05 01 32.24 | -68 10 42.9 | 279.14 | -35.17 | 11.728 | 11.85 | BC2Ia | 35 | 70 | F |
| LHA 120-S 155 | RMC 71 | 05 02 07.39 | -71 20 13.1 | 282.82 | -34.25 | 10.60 | 10.55 | OB | 35 | 70 | F |
| SK -69 59 | HD 268960 | 05 03 12.70 | -69 01 37.0 | 280.09 | -34.80 | 12.01 | 12.166 | B0Ia | 25 | 45 | F |
| SK -67 38 | LMC 59721 | 05 03 29.73 | -67 52 25.1 | 278.72 | -35.07 | 13.494 | 13.716 | OB | 100 | 80 | U |
| SK -70 50 | HD 269009 | 05 03 45.85 | -70 11 57.5 | 281.45 | -34.44 | 11.0 | 11.1 | OB | 50 | 105 | F |
| SK -70 60 | LMC 64006 | 05 04 40.78 | -70 15 34.6 | 281.49 | -34.35 | 13.646 | 13.914 | O4-O5V:n | 110 | – | U |
| SK -68 39 | – | 05 04 50.17 | -68 07 52.4 | 278.99 | -34.88 | 11.988 | 12.039 | B2.5Ia | 50 | 115 | F |
| SK -70 69 | LMC 65981 | 05 05 18.70 | -70 25 49.8 | 281.68 | -34.25 | 13.616 | 13.854 | O3V(f) | 75 | 50 | U |
| SK -68 41 | GV 195 | 05 05 27.11 | -68 10 02.6 | 279.02 | -34.82 | 11.868 | 12.01 | B0.5Ia | 40 | 100 | F |
| SK -68 45 | – | 05 06 07.28 | -68 07 06.2 | 278.94 | -34.77 | 11.92 | 12.007 | OB | 30 | 70 | F |
| SK -70 78 | HD 269074 | 05 06 16.04 | -70 29 35.7 | 281.72 | -34.16 | 11.0 | 11.1 | OB | 50 | 70 | F |
| SK -68 52 | HD 269050 | 05 07 20.41 | -68 32 08.6 | 279.40 | -34.56 | 11.581 | 11.54 | B0Ia | 50 | – | U |
| OGLE J050724 | – | 05 07 24.62 | -68 29 32.7 | 279.35 | -34.56 | – | 16.76 | Ecl. Bin | 45 | – | U |
| SK -68 63 | HIP 24080 | 05 10 22.79 | -68 46 23.8 | 279.60 | -34.23 | 10.52 | 10.52 | B1.5eq | 200 | – | U |
| Name | Alt name | R.A. | Dec. | mv | mb | Spect. | S/N | S/N | Inst. | ||
|---|---|---|---|---|---|---|---|---|---|---|---|
| (J2000) | (J2000) | (deg.) | (deg.) | (mag) | (mag) | type | CaK | NaD | |||
| BI 108 | LMC 94226 | 05 13 43.05 | -69 18 36.9 | 280.15 | -33.82 | 13.222 | 13.332 | B1:II: | 130 | – | U |
| SK -69 83 | HD 269244 | 05 14 29.64 | -69 29 43.4 | 280.35 | -33.72 | 11.435 | 11.612 | OB | 30 | 70 | F |
| LHA 120-S 93 | GV 566 | 05 16 31.80 | -68 22 09.1 | 278.98 | -33.77 | 12.81 | 12.69 | A0:I: | 25 | 45 | F |
| SK -69 89 | HD 269311 | 05 17 17.57 | -69 46 44.2 | 280.62 | -33.42 | 11.999 | 11.428 | OB | 40 | 80 | F |
| LHA 120-S 96 | SK -69 94 | 05 18 14.35 | -69 15 01.1 | 279.98 | -33.44 | 9.635 | 9.565 | A5Iaeq | 50 | 165 | F |
| BI 128 | – | 05 18 19.77 | -65 49 14.6 | 275.92 | -34.06 | 13.447 | 13.745 | O… | 80 | 40 | U |
| SK -67 78 | HD 269371 | 05 20 19.08 | -67 18 05.7 | 277.64 | -33.62 | 11.3 | 11.0 | OB | 30 | 95 | F |
| LHA 120-S 30 | SK -68 73 | 05 22 59.73 | -68 01 46.3 | 278.45 | -33.24 | 11.71 | 11.46 | Bep | 35 | 95 | F |
| SK -67 90 | HD 269440 | 05 23 00.66 | -67 11 22.1 | 277.46 | -33.38 | 11.282 | 11.378 | B1Ia | 55 | 120 | F |
| SK -67 112 | HD 269545 | 05 26 56.48 | -67 39 35.0 | 277.94 | -32.93 | 11.77 | 11.90 | OB | 30 | 80 | F |
| SK -66 100 | – | 05 27 45.47 | -66 55 15.2 | 277.06 | -32.96 | 12.976 | 13.204 | O6II(f) | 110 | 70 | U |
| SK -68 92 | GV 315 | 05 28 16.17 | -68 51 45.6 | 279.33 | -32.63 | 11.64 | 11.71 | OB | 45 | 80 | F |
| HD 269599 | RMC 105 | 05 28 22.73 | -69 08 31.7 | 279.66 | -32.60 | 10.24 | 10.03 | – | 35 | 30 | F |
| SK -66 106 | – | 05 29 00.99 | -66 38 27.8 | 276.71 | -32.87 | 12.64 | 12.72 | OB | 55 | 120 | F |
| LHA 120-S 116 | RMC 110 | 05 30 51.48 | -69 02 58.6 | 279.51 | -32.37 | 10.52 | 10.28 | F0Iae | 30 | 70 | F |
| SK -66 118 | GV 341 | 05 30 51.91 | -66 54 09.1 | 276.99 | -32.66 | 11.674 | 11.776 | OB | 45 | 55 | F |
| SK -67 150 | – | 05 30 01.71 | -67 00 53.4 | 277.13 | -32.68 | 12.034 | 12.24 | OB | 50 | 110 | F |
| SK -71 42 | HD 269660 | 05 30 47.78 | -71 04 02.3 | 281.87 | -32.06 | 11.15 | 11.19 | B1Ia | 55 | 95 | F |
| SK -68 111 | HD 269668 | 05 31 00.84 | -68 53 57.1 | 279.33 | -32.38 | 10.161 | 12.01 | OB | 45 | 75 | F |
| SK -67 169 | – | 05 31 51.59 | -67 02 22.3 | 277.14 | -32.55 | 12.06 | 12.18 | B1Ia | 45 | 90 | F |
| HDE 269702 | SK -67 168 | 05 31 52.12 | -67 34 20.8 | 277.76 | -32.48 | 11.69 | 11.99 | O8I(f)p | 125 | 70 | U |
| SK -68 114 | HD 269700 | 05 31 52.28 | -68 32 38.9 | 278.90 | -32.35 | 10.56 | 10.54 | BN?2Ia+ | 25 | 45 | F |
| SK -67 172 | HD 269713 | 05 32 07.32 | -67 29 14.0 | 277.66 | -32.47 | 11.81 | 11.88 | OB | 30 | 70 | F |
| SK -67 173 | LH 76-51 | 05 32 10.75 | -67 40 25.0 | 277.88 | -32.44 | 11.92 | 12.04 | OB | 30 | 45 | F |
| SK -67 199 | HD 269777 | 05 34 18.45 | -67 18 13.7 | 277.41 | -32.28 | 11.05 | 11.06 | B3Ia | 40 | 80 | F |
| SK -67 206 | – | 05 34 55.11 | -67 02 37.5 | 277.10 | -32.25 | 9.862 | 12.00 | OB | 45 | 80 | F |
| BI 237 | LMC 164942 | 05 36 14.63 | -67 39 19.2 | 277.80 | -32.06 | 13.790 | 13.830 | O2V(f*) | 90 | 60 | U |
| SK -69 214 | CPD-69 419 | 05 36 16.42 | -69 31 27.0 | 279.99 | -31.83 | 12.279 | 12.19 | B0.7Ia | 30 | 70 | F |
| HD 37974 | SK -69 216 | 05 36 25.87 | -69 22 55.9 | 279.82 | -31.84 | 11.10 | 10.959 | Be | 25 | 90 | F |
| SK -66 171 | HD 269889 | 05 37 02.42 | -66 38 36.9 | 276.61 | -32.08 | 10.246 | 12.19 | OB | 95 | 50 | U |
| SK -69 228 | CPD-69 436 | 05 37 09.18 | -69 20 19.5 | 279.76 | -31.78 | 12.19 | 12.12 | BC1.5Ia | 40 | 105 | F |
| BI 253 | LMC 168644 | 05 37 34.46 | -69 01 10.2 | 279.38 | -31.78 | 13.56 | 13.70 | O2V(f*) | 105 | 90 | U |
| SK -69 237 | SK -69 237 | 05 38 01.31 | -69 22 14.1 | 279.79 | -31.70 | 12.05 | 12.08 | B1Ia | 30 | 90 | F |
| LHA 120-S 134 | HD 38489 | 05 40 13.33 | -69 22 46.5 | 279.79 | -31.70 | 12.296 | 12.215 | B[e] | 30 | 70 | F |
| SK-69 270 | HD 269997 | 05 41 21.19 | -69 04 38.6 | 279.41 | -31.44 | 11.36 | 11.20 | B2.5Ia | 40 | 110 | F |
| SK-69 274 | HD 269992 | 05 41 27.68 | -69 48 03.7 | 280.25 | -31.35 | 11.27 | 11.22 | B2.5Ia | 45 | 120 | F |
| SK-70 111 | HD 269993 | 05 41 36.79 | -70 00 52.6 | 280.50 | -31.32 | 11.78 | 11.516 | OB | 35 | 80 | F |
| LHA 120-S 137 | – | 05 41 48.00 | -69 37 00.0 | 280.03 | -31.34 | 14.198 | 14.107 | BIaePCyg | 5 | 15 | F |
| SK-69 289 | CPD-69 514 | 05 42 49.22 | -69 32 52.2 | 279.94 | -31.26 | 11.4 | 11.3 | OB | 35 | 65 | F |
| SK-67 256 | CPD-67 500 | 05 44 25.02 | -67 13 49.6 | 277.22 | -31.32 | 11.76 | 11.751 | OB | 20 | 85 | F |
| SK-68 171 | HD 270220 | 05 50 22.99 | -68 11 24.7 | 278.30 | -30.69 | 11.960 | 12.001 | B1Ia | 20 | 55 | F |
| SK-70 120 | HD 270196 | 05 51 20.78 | -70 17 09.3 | 280.72 | -30.47 | 11.490 | 11.6 | B1Ia | 35 | 60 | F |