Partially Nondestructive Continuous Detection of Individual Traveling Optical Photons
Abstract
We report the continuous and partially nondestructive measurement of optical photons. For a weak light pulse traveling through a slow-light optical medium (signal), the associated atomic-excitation component is detected by another light beam (probe) with the aid of an optical cavity. We observe strong correlations of between the transmitted signal and probe photons. The observed (intrinsic) conditional nondestructive quantum efficiency ranges between 13% and 1% (65% and 5%) for a signal transmission range of 2% to 35%, at a typical time resolution of 2.5 s. The maximal observed (intrinsic) device nondestructive quantum efficiency, defined as the product of the conditional nondestructive quantum efficiency and the signal transmission, is 0.5% (2.4%). The normalized cross-correlation function violates the Cauchy-Schwarz inequality, confirming the non-classical character of the correlations.
Photons are unique carriers of quantum information that can be strongly interfaced with atoms for quantum state generation and processing Dudin and Kuzmich (2012); Peyronel et al. (2012); Lang et al. (2011); Fushman et al. (2008); Chen et al. (2013); Gorniaczyk et al. (2014); Tiarks et al. (2014); Michler et al. (2000); Tanji et al. (2009). Quantum state detection, a particular type of processing, is at the heart of quantum mechanics and has profound implications for quantum information technologies. Photons are standardly detected by converting a photon’s energy into a measurable signal, thereby destroying the photon. Nondestructive photon detection, which is of interest for many quantum optical technologies Sperling et al. (2014); Nemoto and Munro (2004); Imoto et al. (1985), is possible through strong non-linear interactions Imoto et al. (1985) that ideally form a quantum non-demolition (QND) measurement Grangier et al. (1998). To date, QND measurement of single microwave photons bound to cooled cavities has been demonstrated with high fidelity using Rydberg atoms Nogues et al. (1999); Gleyzes et al. (2007); Guerlin et al. (2007), and in a circuit cavity quantum electrodynamics system using a superconducting qubit Johnson et al. (2010).
For quantum communication and many other photonics quantum information applications Knill et al. (2001); Gisin and Thew (2007), it is desirable to detect traveling optical photons instead of photons bound to cavities. Previously, a single-photon transistor was realized using an atomic ensemble inside a high finesse cavity where one stored photon blocked the transmission of more than one cavity photon and could still be retrieved Chen et al. (2013). Such strong cross-modulation Beck et al. (2014) can be used for all-optical destructive detection of the stored optical photon, but the parameters in that experiment did not allow nondestructive detection with any appreciable efficiency. High-efficiency pulsed nondestructive optical detection has recently been achieved using a single atom in a cavity Reiserer et al. (2013). In that implementation, the atomic state is prepared in 250 s, altered by the interaction with an optical pulse reflected from the cavity, and read out in 25 s.
In this Letter, we realize partially nondestructive, continuous detection of traveling optical photons with micro-second time resolution. The signal photons to be detected propagate through an atomic ensemble as slow-light polaritons Fleischhauer and Lukin M.D. (2000) under conditions of electromagnetically induced transparency (EIT) Harris (1997). The signal polariton’s atomic-excitation component is nondestructively detected via the polarization change on another light field (probe), enhanced by an optical cavity. We observe positive correlations between the signal and probe photons of , and use the measured correlation function to calculate the conditional nondestructive quantum efficiency Q. We achieve efficiencies Q between 13% and 1% at a signal transmission between 2% and 35%, with a maximum device nondestructive quantum efficiency of 0.47% at a maximum signal input rate of 300 kHz.
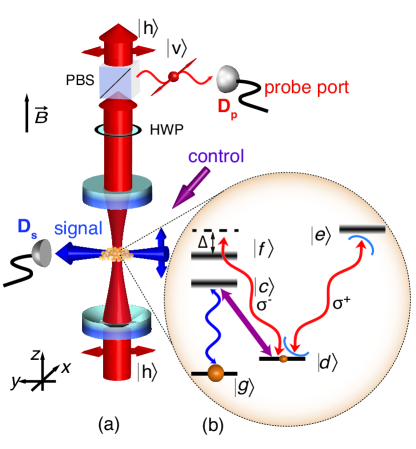
The nondestructive measurement scheme and atomic level structure are shown in Fig. 1. A laser-cooled atomic ensemble of 133Cs atoms is held in a cigar-shaped dipole trap that partly overlaps with the fundamental mode of the optical cavity. A signal light resonant with the transition propagates orthogonal to the cavity axis through the ensemble. A control laser induces an EIT transmission window that slows down the signal light to a typical group velocity of and reversibly maps it onto a collective atomic excitation in state Fleischhauer and Lukin M.D. (2000). This atomic population couples strongly to the polarized light which is simultaneously resonant with the optical cavity and the transition, blocking its transmission through the cavity Beck et al. (2014); Imamolu et al. (1997); Soljačić et al. (2005). To generate a useful positive detection signal in transmission, we add reference light and probe the cavity continuously with horizontally polarized light. The reference light interacts only weakly with the atoms: the atomic coupling strength on the transition is 45 times smaller than the strength of the transition and is also detuned from resonance by MHz by the G magnetic field along the cavity axis (). Light transmitted through the cavity is then analyzed in a horizontal/vertical basis. Vertically polarized light (probe port) corresponds to detection, as the probe port is dark in the absence of signal photons.
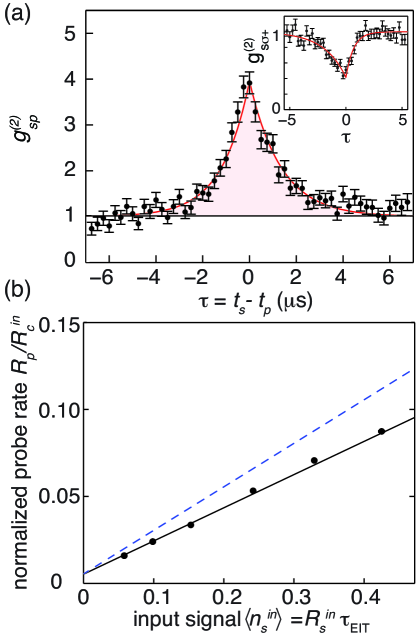
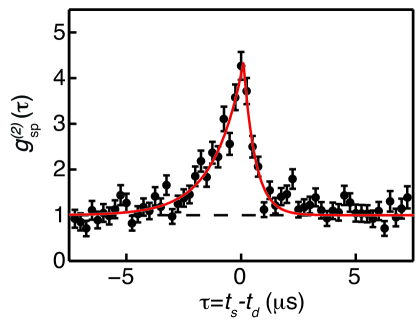
Quantum correlations between detected outgoing signal and probe photons are the signature of nondestructive detection. The cross-correlation function can be understood as the likelihood of measuring the signal twice: first measuring it nondestructively with our cavity QED system, which results in a detected probe photon (), and then checking the first measurement by measuring the signal photon again destructively (). The cross-correlation function in Fig. 2a with zero-time value demonstrates that simultaneous nondestructive and destructive measurements of the signal photon occur four times more often than randomly. This value also agrees well with the directly observed blocking of -polarized cavity photons by a signal photon (inset to Fig. 2a), and with the theoretical expectations for our system’s cooperativity and relevant optical depth (see S.M.). The increased accounts for the improvement over previously published results with the same apparatus Beck et al. (2014).
To confirm the linearity of the system, we plot the probe rate normalized to the empty cavity output rate, , against the average input signal photon number per EIT lifetime in Fig. 2b. Here, is measured input rate corrected for the finite detection efficiency . Under ideal circumstances, an incident cavity photon emerges in the probe port with probability in the presence of a signal photon, indicated in the figure as a dashed line. Achieving this limit requires a strong single-atom-cavity coupling (cooperativity ) Tanji-Suzuki et al. (2011), large ensemble optical depth inside the cavity region , and sufficiently slowly traveling signal photons , where is the cavity lifetime. Even with finite cooperativity and optical depth, we measure . This number is the detection probability per input cavity photon and includes both nondestructive and destructive detection of the signal photon. The nonzero offset in Fig. 2b at corresponds to the background noise in the average measurement. The observed linear increase in probe rate for also confirms the sensitivity of our experiment at the single photon level. However, unlike output correlations, this average signal neither distinguishes between destructive and nondestructive detection events nor does it reveal the time resolution of the detector. Destructive detection events correspond to decohered polaritons, i.e. atomic population in state , and hence have the same effect on the cavity light as traveling signal photons.
To study only those events when we preserve the signal photon, we define the conditional nondestructive quantum efficiency, Q, to be the conditional probability for a correlated photon to be detected in the probe port when a signal photon is present: for . (Note that the second term is necessary to remove uncorrelated (random) coincidences between signal and probe photons.) The time scale for this conditioning is defined by the typical correlation time: this conditional nondestructive quantum efficiency Q is precisely the area under (the shaded area in Fig. 2a) multiplied by the average rate of detected photons at the probe port, : . Q evaluates to 10% for the cross-correlation function plotted in Fig. 2a. The time resolution is the sum of the positive- and negative- correlation times, s Beck et al. (2014). Since Q scales with the detected rate at the probe port, finite probe photon detection efficiency directly reduces Q. The total detection efficiency for probe photons, , is the product of detector efficiency (0.45), fiber coupling and filter losses (0.7) and cavity outcoupling losses (0.66). Correcting for these linear losses gives the intrinsic conditional nondestructive quantum efficiency . Single photon detectors with better than 0.99 efficiency exist at our wavelength, so only improving the optics and detectors outside of our vacuum chamber would already allow us to achieve a Q of 30%.
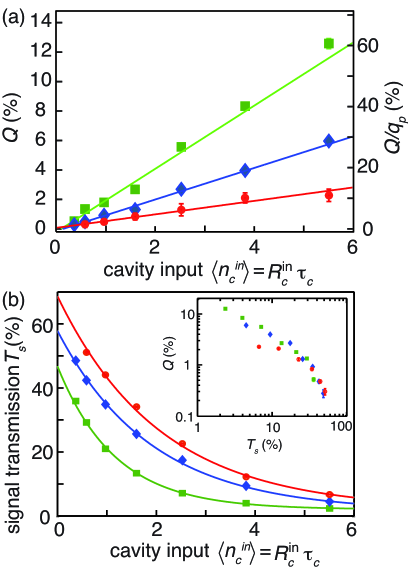
We define the device nondestructive quantum efficiency as the probability for an input photon to be nondestructively detected. It is equal to , the product of the conditional nondestructive quantum efficiency and the signal transmission. Fig. 3 explores the tradeoff between these two factors. Q scales linearly with the input cavity photon number (Fig. 3a), as with increasing cavity input rate it becomes more likely for a randomly arriving cavity photon to “hit” a signal photon and perform the detection. At the same time, the signal transmission, , degrades exponentially with input cavity rate due to cavity-induced decoherence of the signal polariton, as seen in Fig. 3b. Slower signal polaritons (smaller control Rabi frequency ) are more likely to be “hit” by a cavity photon, and thus have a larger nondestructive quantum efficiency but also have a lower transmission due to greater decoherence for a given cavity photon number. The choice of Rabi frequency changes the detector speed but does not improve the tradeoff between efficiency and transmission; the inset of Fig. 3b shows that observed quantum efficiency as a function of signal transmission collapses to a single curve for all measured Rabi frequencies.
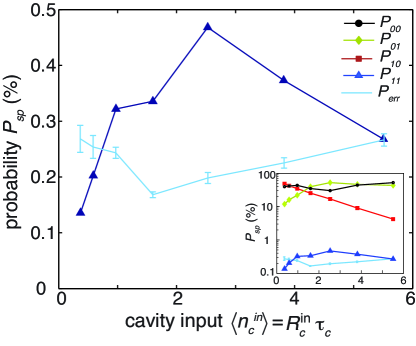
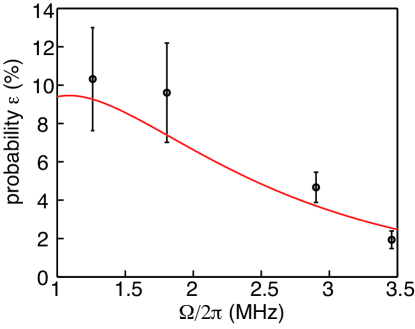
Fig. 4 plots the device nondestructive quantum efficiency and the error probability, as a function of input photon number. The maximal observed (intrinsic) device nondestructive quantum efficiency is 0.47% (2.4%). is the probability of having a false detection event when no signal photon is present. Considering these together, the detector achieves a nondestructive signal to noise ratio of 2.4. We further characterize the performance for single input photons by calculating by the four probabilities, , to detect signal and probe photons given one input signal photon. These probabilities can be obtained from measured quantities in the limit using the relations , , and . These probabilities describe different aspects of the nondestructive detection. In particular, the device nondestructive quantum efficiency is and the state preparation probability, , represents the probability of having an outgoing signal photon if a photon is present at the probe port.
In our system, the transmission of detected signal photons is limited to about 70% by the standing wave nature of our cavity probe, which imprints a grating onto the detected polariton and reduces its readout efficiency in the original mode. In addition, since the atomic medium extends outside the cavity mode, the detection localizes the signal polariton in a finite region of the ensemble, and the corresponding spectral broadening outside the EIT transmission window reduces the signal transmission by 30% (see S.M.). Finally, cavity photon scattering into free-space, which destroys the signal polariton, occurs with a finite probability . The combination of these effects explains the observed transmission reduction for the signal.
To further enhance the effective optical density of the medium, we also carried out an experiment where the signal propagates twice through the medium (see S.M.). In this case, we observed slightly stronger correlations of due to the larger effective optical depth. To remove classical correlations from the observed cross-correlation, we normalize the cross-correlation function to the auto-correlations measured at the signal and probe ports of and . The resulting normalized quantum correlation at violates the Cauchy-Schwarz inequality Clauser (1974), , and confirms that our interactions are non-classical.
Key to the nondestructive photon measurement scheme demonstrated here is the strong interaction between one atom and a cavity photon McKeever et al. (2003); Volz et al. (2011); Shomroni et al. (2014) (large single-atom cooperativity ), in combination with the strong collective interaction of atoms with signal photons (large optical depth inside the cavity). Both quantities can be further improved in our experiment. For realistic values and , we expect a device nondestructive quantum efficiency exceeding 55% with a conditional nondestructive quantum efficiency of about 80% and a signal transmission of about 70%. An interaction of this kind enables many quantum applications such as the projection of a coherent state of a light pulse into a photon number state Guerlin et al. (2007), the implementation of nearly deterministic photonic quantum gates through nondestructive measurement and conditional phase shift Nemoto and Munro (2004), engineering exotic quantum states of light Wang and Duan (2005) or non-deterministic noiseless amplification for entanglement distillation Zhang et al. (2012).
The authors would like to thank Arno Rauschenbeutel for insightful discussions. This work was supported by NSF and the Air Force Office of Scientific Research. K.M.B. acknowledges support from NSF IGERT under grant 0801525.
References
- Dudin and Kuzmich (2012) Y. O. Dudin and A. Kuzmich, Science 336, 887 (2012).
- Peyronel et al. (2012) T. Peyronel, O. Firstenberg, Q.-Y. Liang, S. Hofferberth, A. V. Gorshkov, T. Pohl, M. D. Lukin, and V. Vuletić, Nature 488, 57 (2012).
- Lang et al. (2011) C. Lang, D. Bozyigit, C. Eichler, L. Steffen, J. M. Fink, A. A. Abdumalikov, Jr., M. Baur, S. Filipp, M. P. da Silva, A. Blais, and A. Wallraff, Phys. Rev. Lett. 106, 243601 (2011).
- Fushman et al. (2008) I. Fushman, D. Englund, A. Faraon, N. Stoltz, P. Petroff, and J. Vučković, Science 320, 769 (2008).
- Chen et al. (2013) W. Chen, K. M. Beck, R. Bücker, M. Gullans, M. D. Lukin, H. Tanji-Suzuki, and V. Vuletić, Science 341, 768 (2013).
- Gorniaczyk et al. (2014) H. Gorniaczyk, C. Tresp, J. Schmidt, H. Fedder, and S. Hofferberth, Phys. Rev. Lett. 113, 053601 (2014).
- Tiarks et al. (2014) D. Tiarks, S. Baur, K. Schneider, S. Dürr, and G. Rempe, Phys. Rev. Lett. 113, 053602 (2014).
- Michler et al. (2000) P. Michler, A. Kiraz, C. Becher, W. V. Schoenfeld, P. M. Petroff, L. Zhang, E. Hu, and A. Imamoglu, Science 290, 2282 (2000).
- Tanji et al. (2009) H. Tanji, S. Ghosh, J. Simon, B. Bloom, and V. Vuletić, Phys. Rev. Lett. 103, 043601 (2009).
- Sperling et al. (2014) J. Sperling, W. Vogel, and G. S. Agarwal, Phys. Rev. A 89, 043829 (2014).
- Nemoto and Munro (2004) K. Nemoto and W. J. Munro, Phys. Rev. Lett. 93, 250502 (2004).
- Imoto et al. (1985) N. Imoto, H. A. Haus, and Y. Yamamoto, Phys. Rev. A 32, 2287 (1985).
- Grangier et al. (1998) P. Grangier, J. A. Levenson, and J.-P. Poizat, Nature 396, 537 (1998).
- Nogues et al. (1999) G. Nogues, A. Rauschenbeutel, S. Osnaghi, M. Brune, J. M. Raimond, and S. Haroche, Nature 400, 239 (1999).
- Gleyzes et al. (2007) S. Gleyzes, S. Kuhr, C. Guerlin, J. Bernu, S. Deléglise, U. B. Hoff, M. Brune, J.-M. Raimond, and S. Haroche, Nature 446, 297 (2007).
- Guerlin et al. (2007) C. Guerlin, J. Bernu, S. Deléglise, C. Sayrin, S. Gleyzes, S. Kuhr, M. Brune, J.-M. Raimond, and S. Haroche, Nature 448, 889 (2007).
- Johnson et al. (2010) B. R. Johnson, M. D. Reed, A. A. Houck, D. I. Schuster, L. S. Bishop, E. Ginossar, J. M. Gambetta, L. DiCarlo, L. Frunzio, S. M. Girvin, and R. J. Schoelkopf, Nat. Phys. 6, 663 (2010).
- Knill et al. (2001) E. Knill, R. Laflamme, and G. J. Milburn, Nature 409, 46 (2001).
- Gisin and Thew (2007) N. Gisin and R. Thew, Nature Photon. 1, 165 (2007).
- Beck et al. (2014) K. M. Beck, W. Chen, Q. Lin, M. Gullans, M. D. Lukin, and V. Vuletić, Phys. Rev. Lett. 113, 113603 (2014).
- Reiserer et al. (2013) A. Reiserer, S. Ritter, and G. Rempe, Science 342, 1349 (2013).
- Fleischhauer and Lukin M.D. (2000) M. Fleischhauer and Lukin M.D., Phys. Rev. Lett. 84, 5094 (2000).
- Harris (1997) S. E. Harris, Phys. Today 50, 36 (1997).
- Imamolu et al. (1997) A. Imamolu, H. Schmidt, G. Woods, and M. Deutsch, Phys. Rev. Lett. 79, 1467 (1997).
- Soljačić et al. (2005) M. Soljačić, E. Lidorikis, J. Joannopoulos, and L. Hau, Appl. Phys. Lett. 86, 171101 (2005).
- Tanji-Suzuki et al. (2011) H. Tanji-Suzuki, I. D. Leroux, M. H. Schleier-Smith, M. Cetina, A. Grier, J. Simon, and V. Vuletić, Adv. At. Mol. Opt. 60, 201 (2011).
- Clauser (1974) J. F. Clauser, Phys. Rev. D 9, 853 (1974).
- McKeever et al. (2003) J. McKeever, A. Boca, A. D. Boozer, J. R. Buck, and H. J. Kimble, Nature 425, 268 (2003).
- Volz et al. (2011) J. Volz, R. Gehr, G. Dubois, J. Estève, and J. Reichel, Nature 475, 210 (2011).
- Shomroni et al. (2014) I. Shomroni, S. Rosenblum, Y. Lovsky, O. Bechler, G. Guendelman, and B. Dayan, Science 345, 903 (2014).
- Wang and Duan (2005) B. Wang and L.-M. Duan, Phys. Rev. A 72, 022320 (2005).
- Zhang et al. (2012) S. Zhang, S. Yang, X. Zou, B. Shi, and G. Guo, Phys. Rev. A 86, 034302 (2012).
Supplemental Material
Methods Each second-long experimental cycle has a 12 ms detection period, which consists of 20 s measurement times, a time window arbitrarily chosen to be much longer than the EIT lifetime to allow the continuous measurement of signal photons, interleaved with 20 s preparation times that ensure the atoms are optically pumped to the state. For cross correlation measurements such as Fig.2(a) an average of approximately 8000 experimental cycles were used.
The temperature of the cloud in the dipole trap is about 120 K corresponding to a measured atomic decoherence rate of kHz, dominated by the Doppler broadening. The signal path detection efficiency is including the fiber coupling efficiency and photodetector quantum efficiency. The optical cavity has a waist size of m, length of 13.7 mm, and out-coupling efficiency of 66%.
The single-photon Rabi frequency for polarized light is MHz. Thus, the single-atom cooperativity for an atom on the cavity axis (along ) at an antinode of the cavity standing wave is given by , i.e. the system operates in the strong coupling regime of cavity quantum electrodynamics. The cavity resonance frequency matches the atomic frequency
Detection and transmission probabilities. The probability to observe a probe photon when a cavity photon is present and a signal photon is propagating through the EIT window at is given by Beck et al. (2014)
| (1) |
where
| (2) |
Here, is the spatially-averaged cavity cooperativity, is the effective optical density that overlaps with the cavity mode, is the control Rabi frequency, kHz is the decay rate of the cavity, , kHz is atomic decoherence rate in the absence of cavity photons, is cavity-induced decoherence, and is the Cs excited-state decay rate. The decoherence rate, , caused by cavity light scattering manifests itself as: (1) loss of atomic coherence given by where is the mean -polarized input cavity photon number, (2) reduction of signal transmission as a result of inhomogenous coupling of cavity light to atoms (see below). For the anti-correlation data shown in the inset of Fig. 2a, when we take into account the cavity blocking due to an atom in state , we obtain and a blocking probability for light of . This is in good agreement with the measured probability of . A detailed theoretical treatment of the cavity interaction with atomic ensemble is given in Ref. [25].
In the nondestructive detection where horizontally-polarized cavity light is used, the detection probability is defined as the field amplitude of the transmitted light, which interacts with atoms in state as described in Ref. [23], combined with the field amplitude of light on the output polarization beamsplitter. The field amplitude addition results in the factor 1/4 in Eq. 1. In principle, this reduction can be avoided by impinging only light onto an impedance-matched cavity and measuring the reflected photons. In our present lossy cavity, the reflection in the absence of signal photons causes a large background for the probe light.
Cavity-induced decoherence reduces the transmission probability of the signal photon and the EIT coherence time Beck et al. (2014). The signal transmission in the presence of cavity photons is given by:
| (3) |
where is the EIT transmission corresponding to atoms outside the cavity waist and is the corresponding optical density.
An additional limit to the signal transmission is caused by the standing-wave nature of the cavity light in combination with the uniform distribution of atoms between nodes and antinodes of the cavity. Once the signal is detected, the spatial mode of the polation is projected onto the cavity mode resembling a grating imprinted onto the polariton structure. This effect leads to reduction in transmission of the signal. The overlap between the polariton before and after detection of a probe photon can be calculated as
| (4) |
where , is the wave-number of cavity light and is the position along the cavity axis. At large cooperativity, , the expected maximum transmission approaches 100%. For our system parameters this evaluates to about 70%.
Also, the atomic cloud extended beyond the cavity region introduces additional signal transmission loss. This is because the signal photon wave-packet is localized inside the cavity region upon detection of a probe photon and therefore its spectral bandwidth exceeds the EIT bandwidth. Hence, after detection via the cavity, the signal photon propagating through the EIT window experiences dispersion and loss. Our numerical simulations predicts a loss of 30% in signal transmission given the experimental parameters. In principle, this loss can be eliminated by removing atoms outside the cavity region.
Quantum correlation between probe and signal photons. The mean photon rate entering the cavity can be calculated from the total detected photon rate exiting the cavity, , in absence of signal photons as
| (5) |
where accounts for detection losses including fiber coupling, filter losses and photodetector quantum efficiency and is the cavity out-coupling efficiency with and being mirror loss and transmissivity, respectively. In the following, we combine and the cavity out-coupling efficiency into a single parameter . The mean cavity photon number in absence of signal photons is then where . The mean signal photon number in the relevant time window, i.e. the EIT life time , is given by where is the signal photon rate entering the medium and accounts for detection losses. In absence of population in state , the linearly polarized cavity light is rotated by atoms in state due to the differences in the coupling strengths for and polarized light interacting with state and excited states. Ideally, this rotation is constant and we compensate for it with a waveplate at the output of the cavity. However, the shot-to-shot atom number fluctuation during loading provides a varying background, , that dominates the probe port at low signal photon rates. We typically measure a maximum fractional background of of the total detected cavity photons. The detection events consists of a background given by , where denotes the dark counts of the probe detector . We define the detected mean signal photon number , true detection events and total detected mean probe photon number as
| (6) | |||||
| (7) | |||||
| (8) | |||||
where denotes the dark-counts of the signal detector and is the probability of detecting a probe photon for a decohered atoms in state , , multiplied by the fraction of signal photons, , incoherently mapped to state via absorption. The coincidence counts are
| (10) | |||||
Here, we assume that the conditional signal transmission is approximately equal to the mean signal transmission, . Note that all terms, except the first, are caused by background sources. The cross-correlation function, neglecting the detectors’ dark counts, can be approximated as
| (11) |
where . When background processes are negligible (), the maximum cross-correlation function at is simply approximated by for . Note that in the regime where , the correlation function is independent of the cavity photon number as both the detection probability and background scale linearly with it. However, the measured drops at low cavity photon numbers where probe-part dark counts, , are not negligible compared to the detected cavity mean photon number.
To further increase the photon-photon interaction, we carried out an experiment to increase the effective optical density by transmitting the signal through the atomic ensemble twice. The retro-reflected signal is collected by a 90/10 fiber-beam splitter used at the signal input. We simultaneously measure auto-correlations of , and the cross-correlation as plotted in Fig. S1.
Quantum efficiency. The conditional nondestructive quantum efficiency of detecting a signal photon with mean input photon number can be written as
| Q | (12) |
where is the total probability of having a probe photon given a signal photon traveling through the medium. It can be obtained from the asymptotic quantum efficiency and integrating the area under the function as
| (13) | |||||
The probability is calculated from the slope of the fitted lines in Fig. 4c and is plotted for different control Rabi frequencies in Fig. S2. These extracted probabilities agree with theoretical predictions.
Detection probabilities and QND requirements. The QND requirements can be quantified using the measurement error, , the transfer coefficient of input signal to meter (probe), , and transfer coefficient of input signal to output signal, Grangier et al. (1998). Using the formalism provided by Ralph et al. [Phys. Rev. A 73, 012113 (2006)], one can link the measurement probabilities in the discrete variable (DV) regime and and in continuous variable (CV) regime through different fidelity measures. The transfer coefficients in terms of measurement fidelity, , and QND fidelity, , can be written as
where
To estimate the measurement error in the CV regime, the conditional variance of the signal is measured and is compared to the shot-noise limit. In the DV regime, however, as the particle aspect of photons are detected and not the wave aspect, the conditional correlation function, (signal auto-correlation function conditioned on detecting a meter photon), can be used instead to quantify the measurement error. In particular, a QND measurement satisfies (quantum state preparation)and .