22email: sbarnes,jweingrill,tgranzer,fspada,kstrassmeier@aip.de
A color-period diagram for the open cluster M 48 (NGC 2548),
and its rotational age††thanks: Based on data obtained with the STELLA robotic telescopes in Tenerife, an AIP facility jointly operated by AIP and IAC; this paper presents results for the STELLA Open Cluster Survey (SOCS); Appendix A is only available in electronic form via http://www.edpsciences.org; the cluster photometry table is only available in electronic form at the CDS via anonymous ftp to cdsarc.u-strasbg.fr (130.79.128.5) or via http://cdsweb.u-strasbg.fr/cgi-bin/qcat?J/A+A/
Rotation periods are increasingly being used to derive ages for cool single field stars. Such ages are based on an empirical understanding of how cool stars spin down, acquired by constructing color-period diagrams (CPDs) for a series of open clusters. Our main aims here are to construct a CPD for M 48, to compare this with other clusters of similar age to check for consistency, and to derive a rotational age for M 48 using gyrochronology. We monitored M 48 photometrically for over 2 months with AIP’s STELLA I 1.2 m telescope and the WiFSIP 4K imager in Tenerife. Light curves with 3 mmag precision for bright (V14 mag) stars were produced and then analysed to provide rotation periods. A cluster CPD has then been constructed. We report 62 rotation periods for cool stars in M 48. The CPD displays a clear slow/I-sequence of rotating stars, similar to those seen in the 625 Myr-old Hyades and 590 Myr-old Praesepe clusters, and below both, confirming that M 48 is younger. A similar comparison with the 250 Myr-old M 34 cluster shows that M 48 is older and does not possess any fast/C-sequence G or early K stars like those in M 34, although relatively fast rotators do seem to be present among the late-K and M stars. A more detailed comparison of the CPD with rotational evolution models shows that the cluster stars have a mean age of 450 Myr, and its (rotating) stars can be individually dated to Myr (26%). Much of this uncertainty stems from intrinsic astrophysical spread in initial periods, and almost all stars are consistent with a single age of Myr. The gyro-age of M 48 as a whole is 45050 Myr, in agreement with the previously determined isochrone age of 400100 Myr.
Key Words.:
Stars: rotation — Stars: solar-type — Stars: variables: general — starspots — open clusters and associations: individual: M 48, NGC 25481 Introduction
The study of stellar rotation, both among field stars and in open clusters, was synonymous with measurements for several decades. See Kraft (1970), and references therein, for a review of developments until 1970. Good starting points for developments into the 1980s and 1990s, especially those relating to open clusters, are Stauffer & Hartmann (1987), Soderblom et al. (1993), and Queloz et al. (1998). More recently the emphasis has shifted to photometric rotation period measurements, partly because they avoid the ambiguity inherent to spectroscopic measurements.
Such measurements began with the pioneering work of Van Leeuwen, Alphenaar & Meys (1987)111See also Van Leeuwen & Alphenaar (1982)., who measured rotation periods photometrically for 11 cool stars in the Pleiades open cluster, and were soon followed by the remarkable Hyades rotation-period measurements222No older cluster was measured successfully until Meibom et al. (2011b) studied the 1 Gyr-old cluster NGC 6811 using the Kepler Space Telescope. of Radick et al. (1987). The Mt. Wilson sample of stars, with periods measured from variability in chromospheric emission (Baliunas et al. 1996) and rooted in earlier spectroscopic work, including the discovery of stellar chromospheric activity cycles (Wilson 1978), is also noteworthy.
A large body of subsequent work by the astronomical community [e.g., Bouvier et al. 1993 (T Tauri stars), Barnes et al. 1999 (IC 2602), Irwin et al. 2007 (NGC 2516), Meibom et al. 2009 (M35), Hartman et al. 2010 (Pleiades)] has shown that rotation period measurements constitute a distinct new probe of stellar evolution that provides both similar and new information, as compared with ‘classical’ methods, such as isochrone fitting of color-magnitude diagrams (CMDs), from which it is steadily becoming independent. Such independence is valuable because young clusters contain few (or sometimes even no) bona fide giant members, making isochrone fitting particularly challenging.
Indeed, it is now recognized that color-period diagrams (CPDs) of open clusters are similar to CMDs, and provide a useful complementary means of characterizing open clusters, particularly in terms of ranking them by age (e.g., Barnes 2003, Meibom et al. 2015). Making the reasonable assumption that stars in both open clusters and the field spin down in similar ways because spindown is governed by processes internal to stars allows field star ages and those of any accompanying planets to be derived using gyrochronology (e.g., Barnes 2007), a valuable ability in the Kepler (and soon PLATO) era.
Another notable aspect of open cluster CPDs is that they often display sequences of rotating stars (Barnes 2003). Clusters like the Hyades (Radick et al. 1987; Delorme et al. 2011) and NGC 6811 (Meibom et al. 2011b) display a clear slow or I-sequence (consisting of relatively slowly-rotating stars whose periods increase steadily as cool star spectral types change from F- to G- to K-type). These stars have converged onto this sequence over the several-100 Myr ages of these clusters. Zero-age main sequence clusters, such as IC 2391 (Patten & Simon 1996) and IC 2602 (Barnes et al. 1999), display only weak evidence for such a sequence. (However, the paucity of available stars could play a role in the difficulty of recognizing it in such cases.)
Certain young clusters, such as M 35 (Meibom et al. 2009), and the Pleiades (Hartman et al. 2010), display evident fast/C-sequences of rotating stars (consisting of many G-, K-, and M-type stars with rotation periods, 1 d), in addition to the slow/I-sequence that characterizes older clusters. This fast sequence appears to dissipate rapidly on a timescale that depends on stellar mass, because these stars spin down to populate the cluster’s slow sequence instead. This is still a subject of active research. For recent ideas, see Matt et al. (2015), Gallet & Bouvier (2015), Brown (2014), Epstein & Pinsonneault (2014), and references therein. Earlier ideas concerning slow- and fast-rotating stars (with varying emphasis on the mass dependence of rotation suggested by rotational sequences) can be found in, e.g., MacGregor & Brenner (1991), Chaboyer et al. (1995), Collier-Cameron et al. (1995), Barnes & Sofia (1996), Bouvier et al. (1997), and Sills et al. (2000).
A significant part of the difficulty in understanding the morphological changes that occur between the Pleiades-type (200 Myr) clusters and the Hyades-type (600 Myr) clusters is the lack of appropriate published rotation-period observations for clusters of intermediate age. The only one available to date is the M 37 cluster (Hartman et al. 2009), whose rotational age has been claimed to be younger than its 540 Myr isochrone age. With an isochrone age of 400 Myr (Balaguer-Nunez et al. 2005), M 48 lies squarely in this intermediate age range and could help in elucidating the transitional rotational behavior. It is therefore desirable to construct a reliable CPD to characterize the M 48 cluster and to explore its properties empirically in the context of other well-studied clusters. In particular, a CPD would allow a comparison between the age determined from rotation and the age determined from classical isochrone fitting.
More generally, such studies also increase our basic knowledge (e.g., photometry and membership) of the often unknown lower main sequence populations of these clusters, a difficult task in the pre-CCD era. We have studied the open cluster M 48 (NGC 2548) in this context. An additional context is provided by the STELLA Open Cluster Survey, which aims to provide rotation periods for a series of open clusters. For a related study of the IC 4756 cluster, see Strassmeier et al. (2015).
Despite being a Messier (1781) object333The cluster apparently lies south of Messier’s position, and was identified with NGC 2548 by Oswalt Thomas in 1934., M 48 ( = 08 13 43, = –05 45 00) has not been the subject of many prior studies, a fact that may be related to its being located in the southern sky. Ebbighausen (1939) performed a proper motion study of the upper main sequence (B and A spectral types) and giants of the cluster within a radius, and identified 74 of these stars as probable members. Another dedicated cluster study was not published for more than 60 years, until Wu et al. (2002) performed another proper motion study of a region around the cluster and identified 165 stars as probable cluster members. This particular paper did not provide any photometric information. However, a related study by Balaguer-Nunez, Jordi & Galadi-Enriquez (2005; hereafter BJG05) has revealed that the Wu et al. (2002) astrometric cluster members were brighter than . BJG05 focused on providing multicolor Stromgren photometry for a cluster-centered region to a depth of , and using this photometry they constructed a candidate member list to a depth of . They also (re-)determined the cluster’s basic parameters, including the age, 400100 Myr.
Almost contemporaneously, Rider et al. (2004) provided photometry in the Sloan filter system for the cluster region to a depth of and found that a 400 Myr isochrone matched their photometry reasonably well. Finally, the most recent work on this cluster by Wu et al. (2006) provided 13-band photometry in a specialized (BATC) filter set over a field, and identified 323 stars as (SED-based) photometric candidate cluster members. An agreement level of 80% was claimed between this membership criterion and earlier proper motion studies. Curiously, no photometry in Johnson colors is currently available for this cluster beyond the bright stars studied photoelectrically by Pesch (1961) and the () study of Sharma et al. (2006), the latter restricted to stars within an radius of the cluster center. The study presented here builds on these prior ones with an emphasis on the rotational properties of the cluster’s stars.
The rest of this paper is organized as follows. The observations are discussed in Section 2. We present the cluster color-magnitude diagram in Johnson B and V colors to a depth of V20 in Section 3. The variability analysis is presented in Section 4, leading to the construction of the cluster color-period diagram, followed by relevant comparisons. Finally, the conclusions are presented in Section 5.
2 The Observations
The M 48 open cluster was observed with the WiFSIP 4K CCD imager mounted on the AIP’s STELLA I robotic 1.2 m telescope, located at the IAC in Tenerife, Spain (Longitude: West, Latitude: ). The STELLA robotic observatory (also containing a 1.2m spectroscopic telescope, STELLA II) opens and closes automatically every usable night, guided by measurements of a number of weather and meteorological parameters. During this interval, it observes a set of targets that are chosen by a scheduling program on the basis of user-defined priorities. Details about the facility and its operation may be found in Strassmeier et al. (2004), Granzer (2004), and Strassmeier, Granzer & Weber (2010).
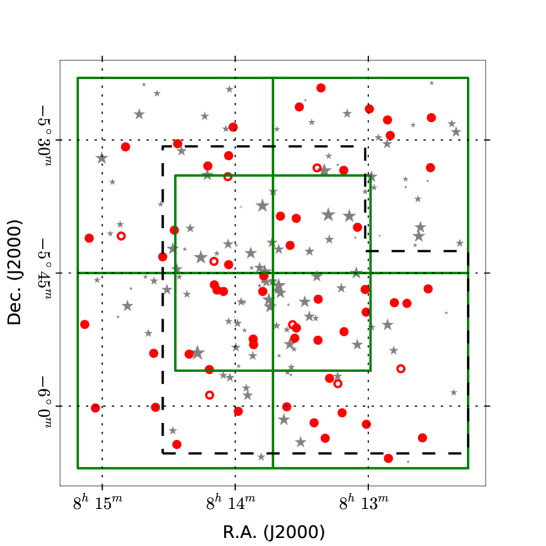
The cluster was observed nightly (as allowed by weather) over a two-month baseline from 4 March 2014 to 7 May 2014. A field, consisting of a mosaic of CCD fields (NW, NE, SW, SE) centered on the cluster, was monitored. Our field is significantly larger than the region covered by BJG05, as can be seen in Fig. 1. Having this large a field was fortuitous, because cluster stars and rotators extend across the entire region monitored. In fact, the cluster very likely extends significantly beyond even our study field444For instance, the rotators we have identified below extend to the edges of the observed field.. Generally, the telescope cycled sequentially through the four subfields. The time-series exposures were acquired in the Johnson V band with exposure times of 30 s (short) and 300 s (long). The number of visits (either exposure time) per night per field ranged from zero to 7, as permitted by other scheduled programs, weather, and telescope performance.
Over the observing period, we acquired a total of 1481 short- and long-exposure frames for the four fields. Of these, we (conservatively) discarded 992 because of tracking errors, lunar proximity, bad seeing, or conditions deemed too far from photometric for our purposes, leaving us with 489 high-quality visits to the four cluster fields (average = 122/field) for the time series observations. Small differences in the numbers of images for each sub-field arise from variations in observing conditions, and because our observing program did not modify individual field observing priorities after the acquisition of incomplete nightly observing cycles.
In addition, sets of Johnson B and V exposures were obtained for each of the cluster sub-fields on multiple nights, together with standard star observations of Landolt (2009) standard fields. This allowed us to obtain colors for the CPD, and of course, to construct a CMD for the cluster in Johnson colors. However, because the number of standard stars observed was small, we decided to place our final photometry on the photoelectric system of Pesch (1961). We also specifically acquired photometry for a separate field bore-sighted on the cluster center, to verify and ensure that the mosaic of cluster sub-fields are placed on a common photometric system.
As part of the robotic observations, bias and flat field frames are obtained before and after science observations. Two bracketing master bias frames, each consisting of 25 individual frames, are used for bias subtraction on the science frames. No dark current subtraction is performed as the dark current is below 1e-/h at the nominal operation temperature. With the limited time available for twilight sky flats, it is impossible to flat field all of the 21 filters of WiFSIP on a single night. Instead, each twilight phase is used to calibrate 2-3 filters with 10 individual flat exposures each, grouped in two five-exposure sequences at opposite derotator settings to level-out first order illumination gradients remaining in twilight sky flats for imaging instruments with large fields of view (Chromey & Hasselbacher, 1996). The master flat field for individual science frames is then constructed by averaging at least ten such flat field blocks, but allowing for up to 100 blocks as long as a maximum time difference between flat block and science frame of less than 25 days is not exceeded. The small variations in image scale across the field of view lead to each pixel receiving light from differing solid angles, in turn leading to differing light levels even on perfectly flat-illuminated fields. The average master flat field is corrected for this geometrical effect before usage on the science image.
For multi-amplifier readout modes like ours, crosstalk between the amplifiers can lead to ghost signals on corresponding pixel positions. Although it is a minor effect of a few tenths of a per cent, raw images are corrected for crosstalk. Subtle gain variations between the different amplifiers are compensated for by adjusting the amplifier gain to allow for a steady transition in illumination level across the amplifier read-out edges. Again, these variations are a few tenths of a per cent, compared to the nominal gain factors of and , for the two amplifiers used; however, the precision desirable for our time-series analysis makes such compensation advisable. Before performing the final photometry, the astrometric world-coordinate solution is obtained using a modified version of WCSTools (Mink 2002). The final solution follows the FITS conventions (Calabretta & Greisen 2002) for a zenithal polynomial projection (ZPN) to third degree, with the remaining root-mean square (rms) error in the position on the order of arcsec.
2.1 Photometry
Photometry for each frame was performed with SExtractor (Bertin & Arnouts, 1996) using the isocorr aperture. This choice was preferable to others such as fixed aperture or isoauto because it worked better than those choices in this work, principally because our point spread function (PSF) is sometimes distorted by tracking errors and/or less-than-perfect seeing conditions. Using an adaptive aperture preserves the most frames for photometry, with minimal impact on the photometric quality.
For each field, the frame with the highest ratio of matched to identified sources in the PPMXL catalog was selected as the reference frame. This selection was also verified manually and showed that only photometric nights were chosen. The reference frames for all five fields (22 mosaic + central field) ended up being selected from only a few photometric nights (28 Feb 2014 to 7 Mar 2014). The particular fields standardized on each night are listed in Table 1.
| Field | Date | Number of stars |
|---|---|---|
| M 48 BVI NE | 2014-02-28 | 184 |
| M 48 BVI NE | 2014-03-01 | 184 |
| M 48 BVI NW | 2014-03-03 | 192 |
| M 48 BVI C | 2014-03-06 | 211 |
| M 48 BVI SE | 2014-03-05 | 209 |
| M 48 BVI SE | 2014-03-02 | 208 |
| M 48 BVI SW | 2014-03-07 | 205 |
Up to five frames having the smallest offsets with respect to the reference frame for stars in the range between 10 to 16 magnitudes were then selected. These offsets calculated from the mean differences between the stars in the reference frame and the cross-identified ones in the selected frames were typically less than 4 millimag, with an rms below 1 millimag. The mean magnitude for each star was calculated from the five selected frames. The nightly offset of the reference frame to the Landolt standard fields was finally added to the derived magnitudes. Only stars within a 0.15” matching radius were identified as cross-matched. The whole procedure was performed separately for the B and V frames.
3 Color-magnitude diagram
B and V frames from the best photometric nights were manually selected for the CMD. For these frames the successive magnitude determinations for the best-exposed stars were repeatable at the 3 mmag level. We decided simply to place the frames on the (photoelectric) photometric standard system of Pesch (1961).
We matched 36 stars from Pesch (1961) listed on Simbad and Webda with our dataset. Webda lists 37 stars from Pesch and 14 stars from Oja (1976, priv. comm.). Since the Oja sample included fainter stars, and proved to be of similar photometric quality, we included them in our calibration sample. Four stars out of the initially 40 cross-identified ones were omitted for calibration due to large differences in magnitude or color (TYC 4859-28-1, HD 68779, BD-05 2451, BD-05 2452). This might arise from coordinate mismatching or bad photometry. Eventually 30 stars from Pesch and 6 stars from Oja were retained for calibration. None of our calibration stars showed saturated pixels in the PSF. The magnitude of the calibration stars covered a range from 8.184 mag to 14.272 mag and in color. For these 36 stars we achieved an rms of 0.032 mag in - and 0.020 mag in – .
The CMD in Johnson color for the entire survey area of our study is displayed in the upper panel of Fig. 2. The cluster’s main sequence is obvious, and is reasonably distinguishable visually from the background stars in this direction of the Galaxy. The cluster sequence begins somewhat brighter than , which is where the A-type cluster stars are located, and extends diagonally downward to , where the cluster’s M-type stars become indistinguishable from the field population. A binary sequence, while undoubtedly present, is not visually prominent. A hint of a white dwarf sequence is visible. Our scientific interests center on the fainter (V ¿ 13) cool FGK stars. Photometric information for all stars and cross-identifications with BJG05 are provided in an accompanying table555This table is only available in electronic form at the CDS via anonymous ftp to cdsarc.u-strasbg.fr (130.79.128.5) or via http://cdsweb.u-strasbg.fr/cgi-bin/qcat?J/A+A/ .

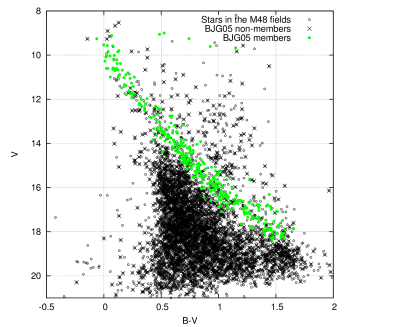
It is desirable to understand which of these stars have been determined to be cluster members by prior studies, and to use this information where possible. The deepest of these studies is that by BJG05. Beginning with the Wu et al. (2006) astrometric members, which run out at a depth of , they extended the candidate member list downward to using multi-color Stromgren photometry to select cluster members. We have cross-identified the cluster members selected by Balaguer-Nunez et al. (2005) against our photometry, and have marked these stars in the color-magnitude diagram displayed in the lower panel of Fig. 2. (As an aside, we note that BJG05 defined the cluster sequence using an empirical ZAMS constructed by Crawford (1975) and succeeding authors as referenced in BJG05.) We observe that the vast majority of the members identified by BJG05 indeed lie on the cluster’s sequence in our () photometry. It therefore appears that the BJG05 selection is an inclusive, rather than an exclusive one.
While we are fortunate that this prior membership information from BJG05 is available for a significant fraction of the stars of interest in our study, our study area is somewhat larger than theirs (see Fig. 1), so it will not be a surprise that we are able to propose additional candidate cluster members, some of them even with determined periods. Accordingly, a number of our rotational candidate cluster members (see Table 2 below) are classified as “–”, indicating that they do not have a BJG05 designation. However, these stars are both on the cluster’s photometric sequence in our () color-magnitude diagram, and have measured rotation periods consistent with cluster membership. (In Table 2, M = BJG05 member, and N = BJG05 non-member.) Ultimately, the BJG05 cluster member selection and ours are both photometric below , the primary region of interest for this work, and therefore neither can be considered definitive in this region.
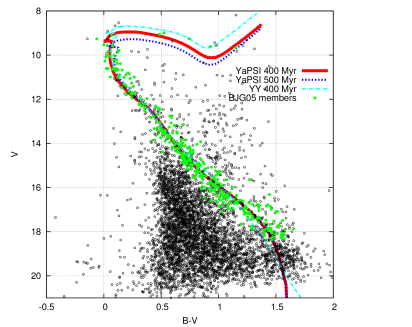
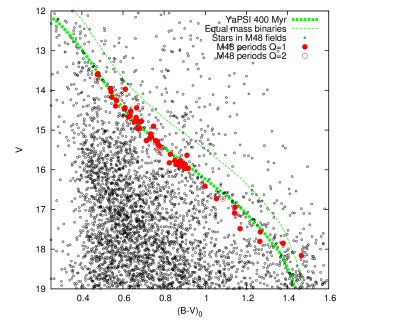
The relative absence of giant cluster members makes the photometry sub-optimal for an isochrone fit. However, it is certainly useful to compare the observed cluster main sequence with a modern theoretical isochrone. Accordingly, we have calculated (and display in Fig. 3) three suitable isochrones, based on the models of Spada et al. (2013) and of Yi et al. (2001).
One of the goals of Spada et al. (2013) was to update the Yale-Yonsei () database of stellar models (Yi et al., 2001), with particular attention to the input physics relevant for the lower mass regime (i.e., ; ). Most notably, the atmospheric boundary conditions are based on the PHOENIX model atmospheres (Hauschildt et al., 1999; Allard et al., 2011). For more details on the micro-physics used in the models, see Spada et al. (2013).
The isochrones have been calculated for solar metallicity, with ages of 400 Myr (the nominal cluster age), and 500 Myr. These are displayed in Fig. 3, assuming a distance modulus of 9.3 ( pc), and a reddening of , as determined by BJG05. We see, unsurprisingly, that the 400 Myr and 500 Myr isochrones are essentially identical redward of the A-type stars. It is also evident from Fig. 3 that the newer isochrones indeed arguably follow the cluster’s main sequence somewhat better for redder colors than the earlier one (YY; Yi et al. 2001).
4 Variability
The rotational variability and associated periods of the cluster stars provide the principal motivation for our study. This goal requires the sustained acquisition of high-quality imaging data over a sufficiently long time baseline. We are particularly fortunate with respect to the baseline because ours is 2 months long. This is four times longer than our conservative expectation of 15 d for the longest periods in our color range for a Hyades-aged cluster, allowing multiple phases to be detected for all rotation periods.
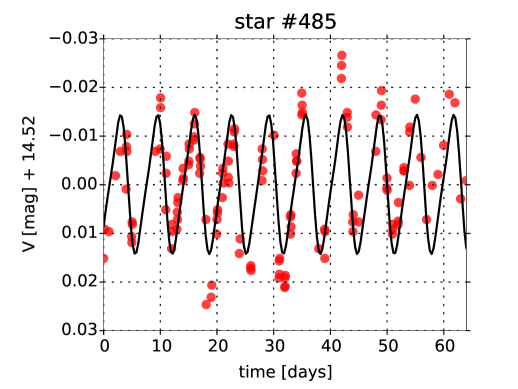
Because our robotic STELLA telescopes are able to acquire data during both good and suboptimal conditions at no additional cost, it is correspondingly necessary for us to discard the latter from among the images acquired by the telescope. We have therefore rejected images with bad seeing, those with very elongated PSFs (usually caused by tracking errors), those affected by lunar proximity, and finally any frames where fewer than 80% of the stars on our reference images were detected. Frames with mean deviations greater than 0.2 mag from these best exposures were also discarded. Most of the last category consist of images acquired under non-photometric conditions, as revealed by our weather monitors and standard star observations. For this particular observing campaign, the final usable high-quality images constituted 40% of the total acquired. Fortunately, this selection does not introduce any significant gaps in the time series beyond a lunar proximity issue centered on 11 Mar 2014, and minor weather-related interruptions, mostly in April 2014. (The light curve for one of our solar-mass stars, displayed in Fig. 4, demonstrates this continuity in our observations.)
The aperture photometry from the individual exposures was corrected to a common system defined using the best images by cross-identifying 1000 well-measured stars with over all four fields and across all the exposures. These stars were used as photometric references for making the frame-to-frame corrections relative to the best exposures, allowing the construction of individual light curves, which were then constructed for all cross-identified stars in the field of view of the cluster. We decided to concentrate our efforts on candidate photometric cluster members. Consequently, we then extracted the light curves of 1300 stars along the cluster sequence for careful analysis. This is a superset of the cluster members of BJG05 with , which is the color range of interest in this work.
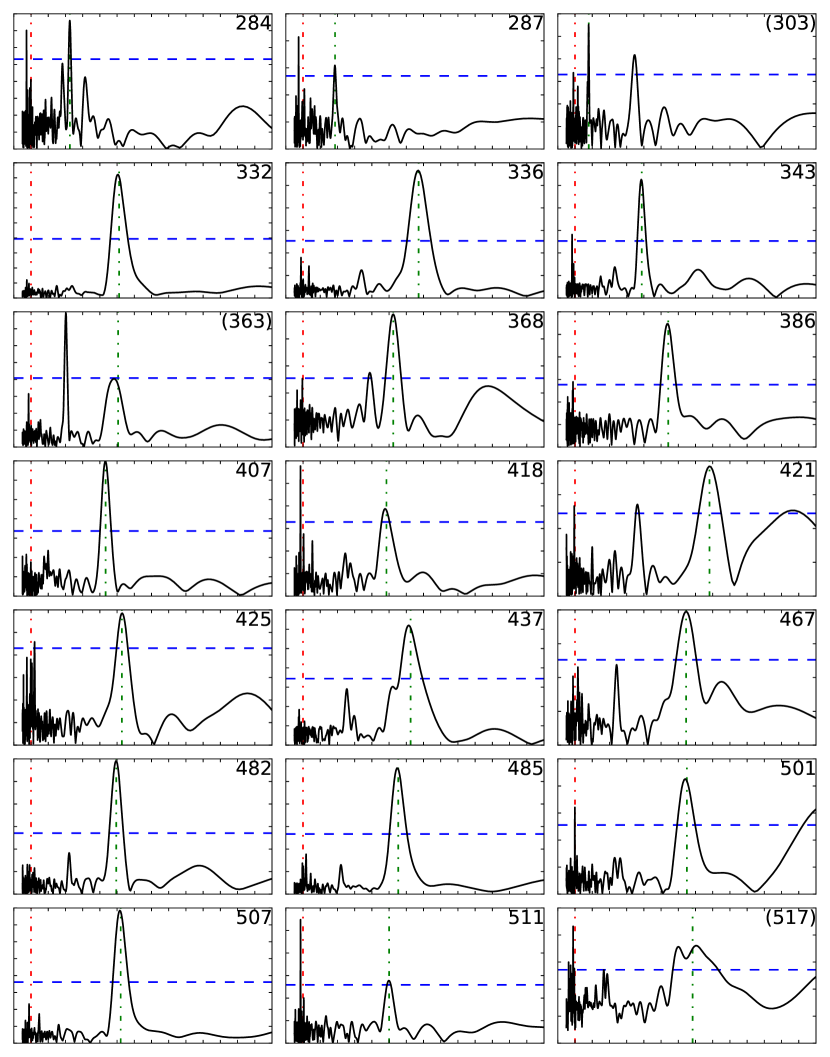
All light curves were subjected to multiple methods of frequency analysis to identify periodicity – phase dispersion minimization (PDM; Stellingwerf, 1978), cleaned Fourier analysis (Roberts et al. 1987), and generalized Lomb-Scargle periodogram (Zechmeister & Kurster, 2011). While none of these is completely satisfactory in all cases, we have found that for our dataset the clean algorithm appears to be the best one overall. Lomb-Scargle and PDM are affected more often by the 1 d or multiple period alias. We believe that this behaviour partly comes from our long baseline, during which there is sometimes significant spot evolution, the onset/decline of spot activity, and in certain cases multiple spot groups. clean seems to be less sensitive than the other methods to these problems, piles up power at the rotational frequency, and also allows the window function to be taken into account.
However, there seems to be no substitute for manual inspection of the candidate rotators, taking the raw light curve into account, the results from all three periodicity indicators discussed above and, finally, the phased curves. We found 5 of the noise level in the clean spectra to be a good threshold for accepting periodicity and have generally adopted this as the criterion for a high-quality period (Quality flag = 1). However, it cannot be an automatically adopted criterion, so we made the ultimate decision manually, and on this basis also listed certain lower quality periods (Quality flag = 2), where there might be some chance of the listed period being an alias. There are therefore some stars with higher peaks that are assigned Quality flag = 2, while the rest are considered high quality. On this basis, we have presented 62 rotation periods, of which 8 are listed with Quality flag = 2. Experiments show that even our Q = 2 periods have a Scargle false alarm probability, FAP ¡ 0.01, i.e., a confidence level greater than 99%.
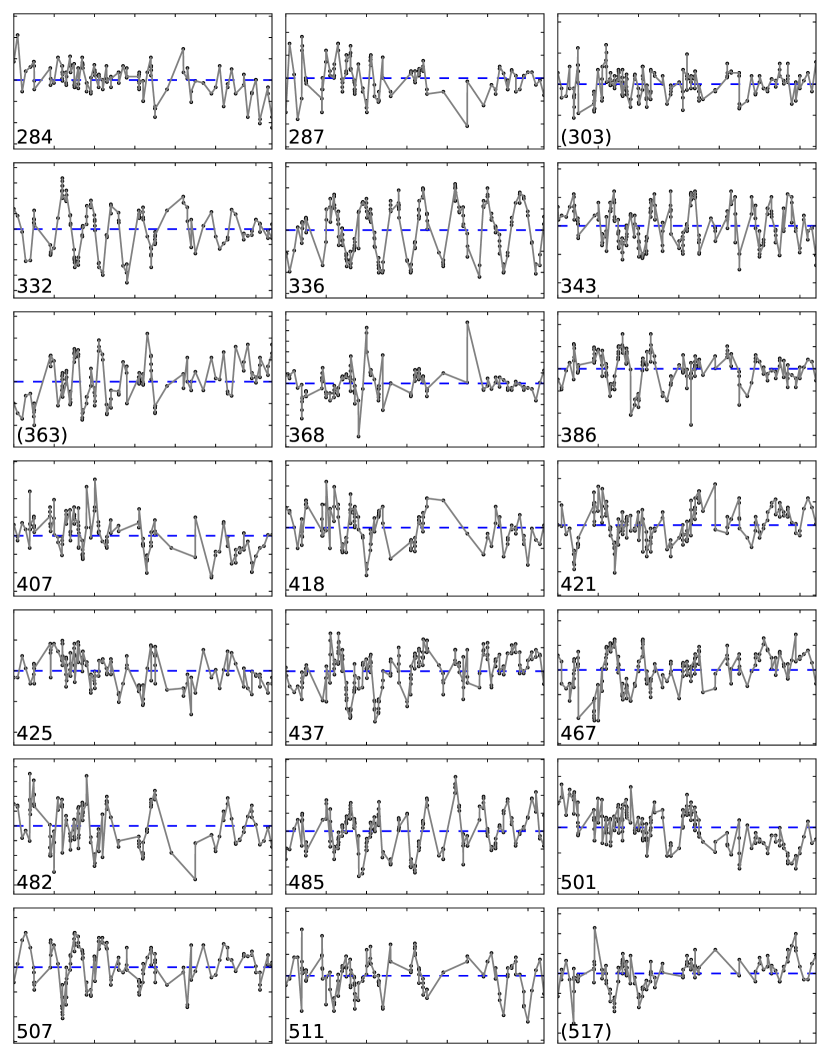
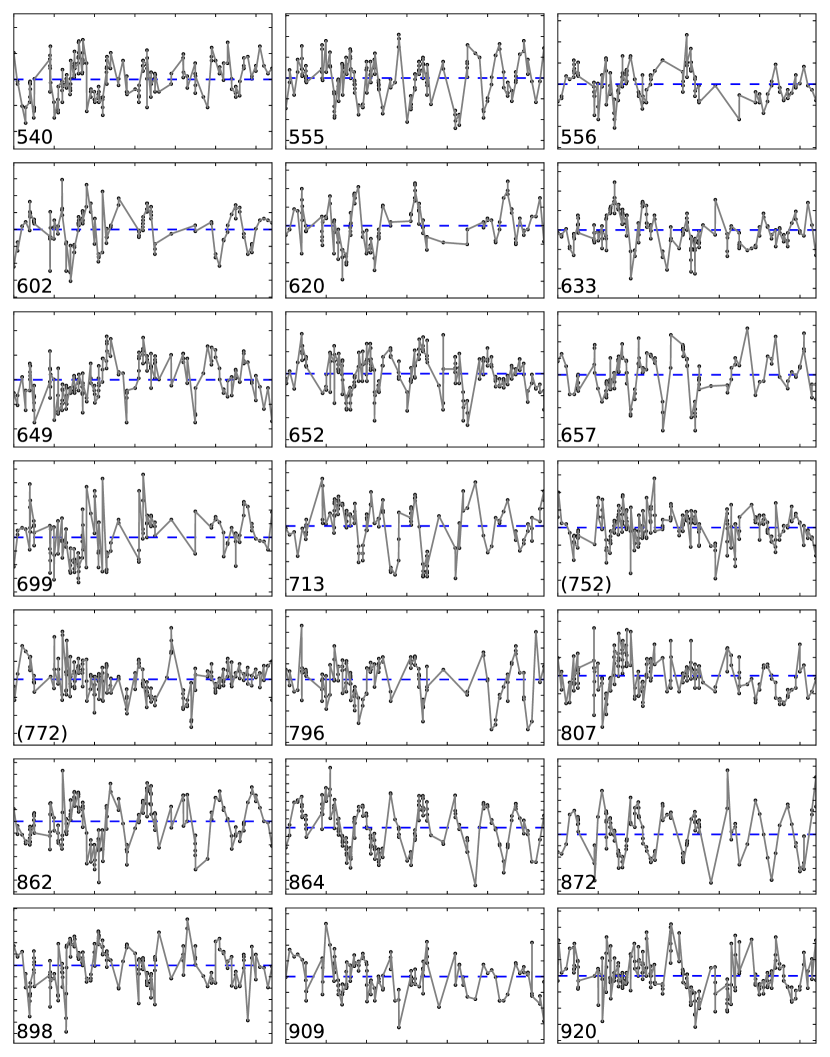
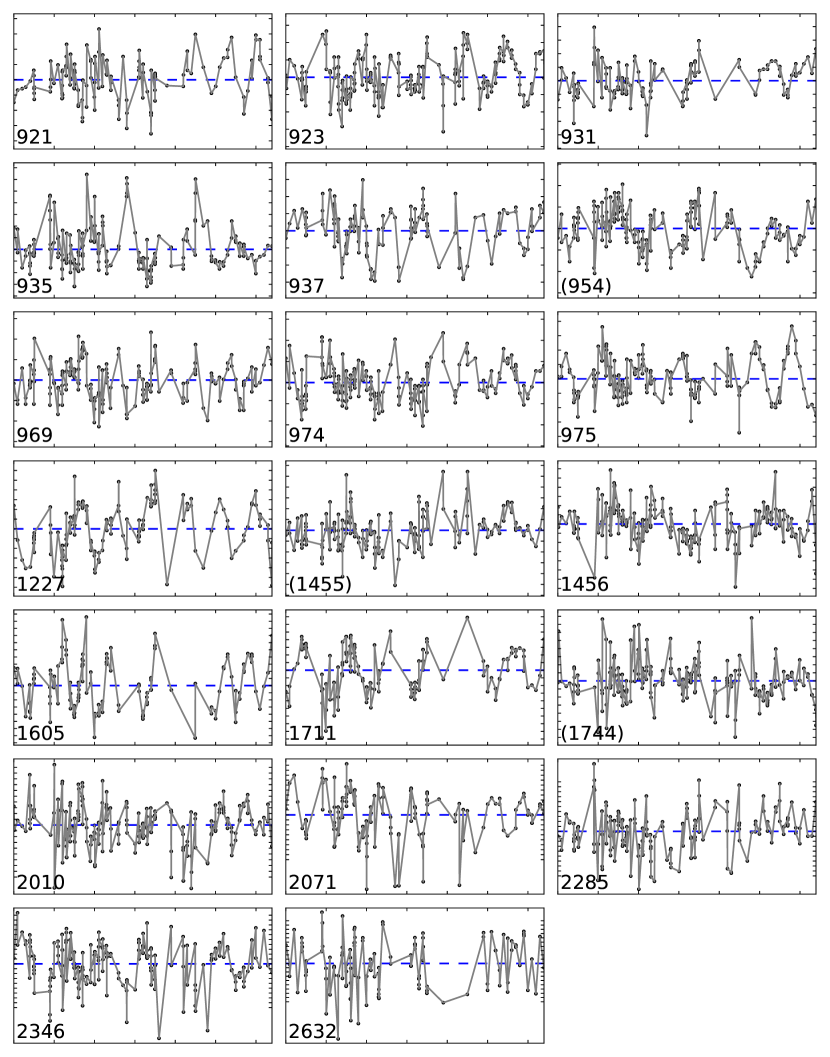
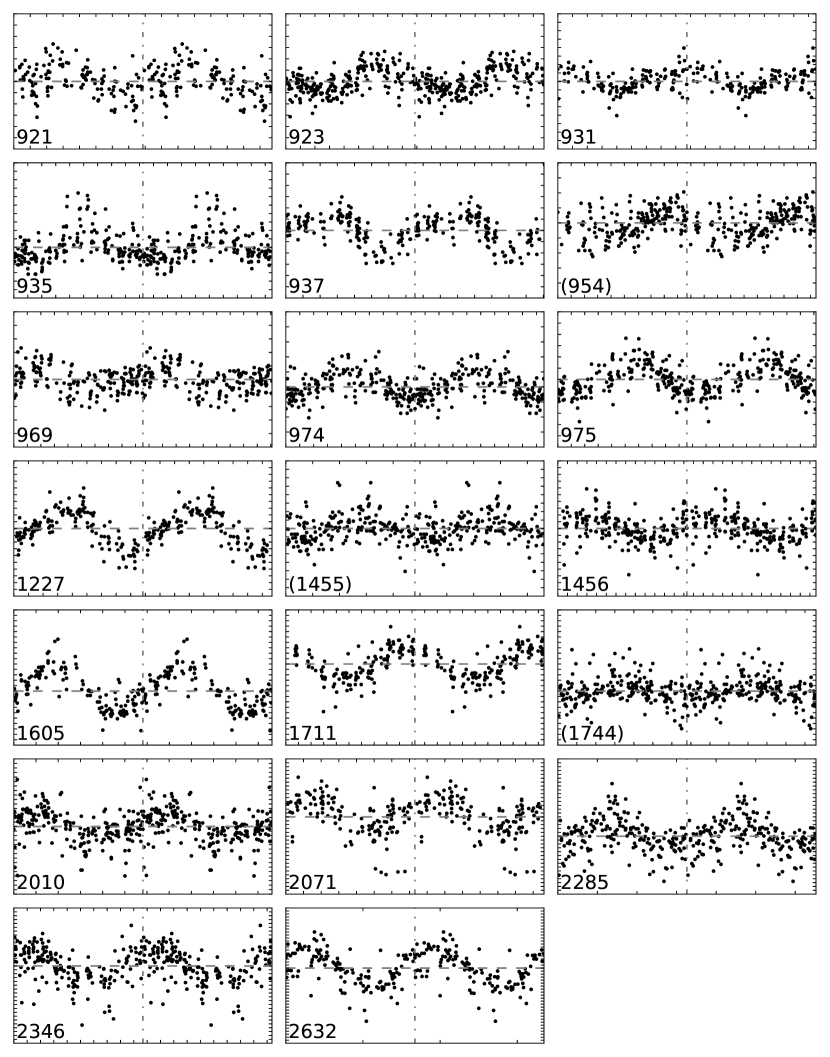
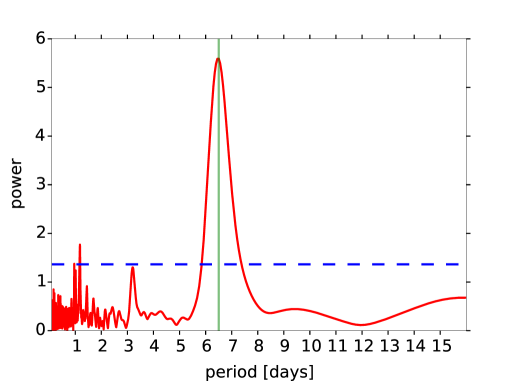
The light curve for a good example of a solar-mass periodic variable is displayed in the upper panel of Fig. 4. The locations of successive data points in the light curve show that the photometry for this particular star is clearly repeatable to a level better than 0.01 mag. A periodicity of d is obvious in Fig. 4. Thanks to the density of our observations, simply plotting the unphased light curve usually allows us to verify the approximate periodicity by visual inspection, as the upper panel of Fig. 4 shows.
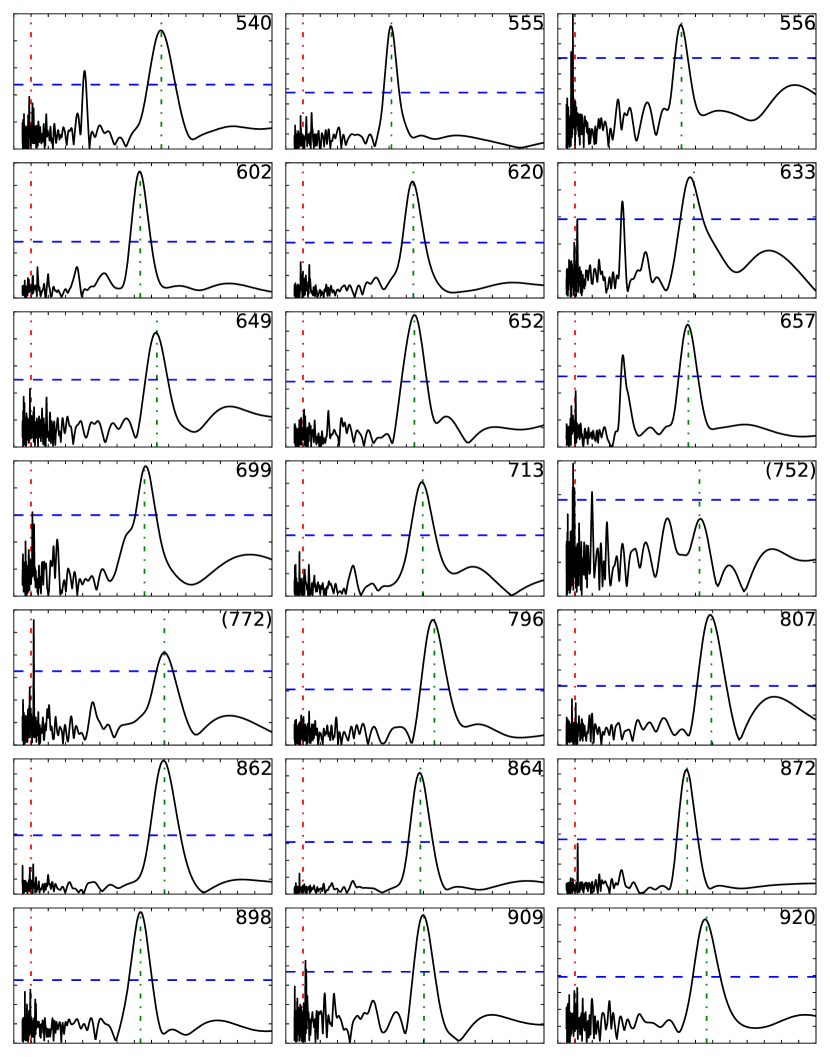
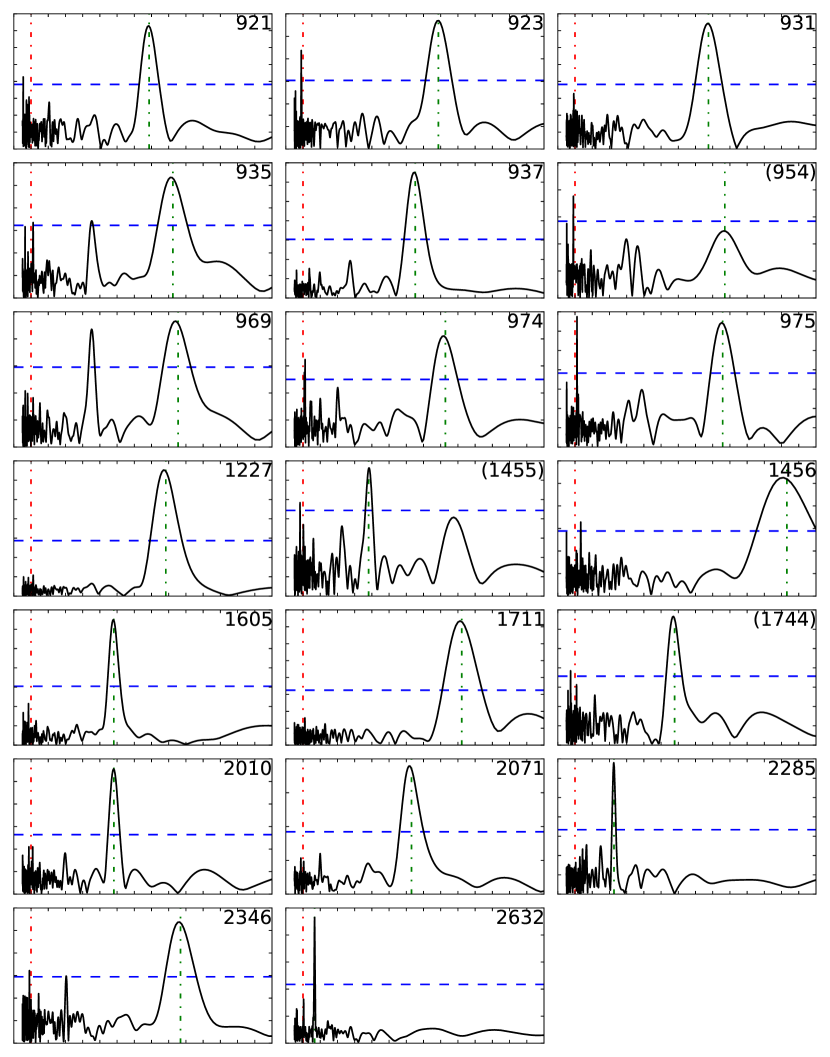
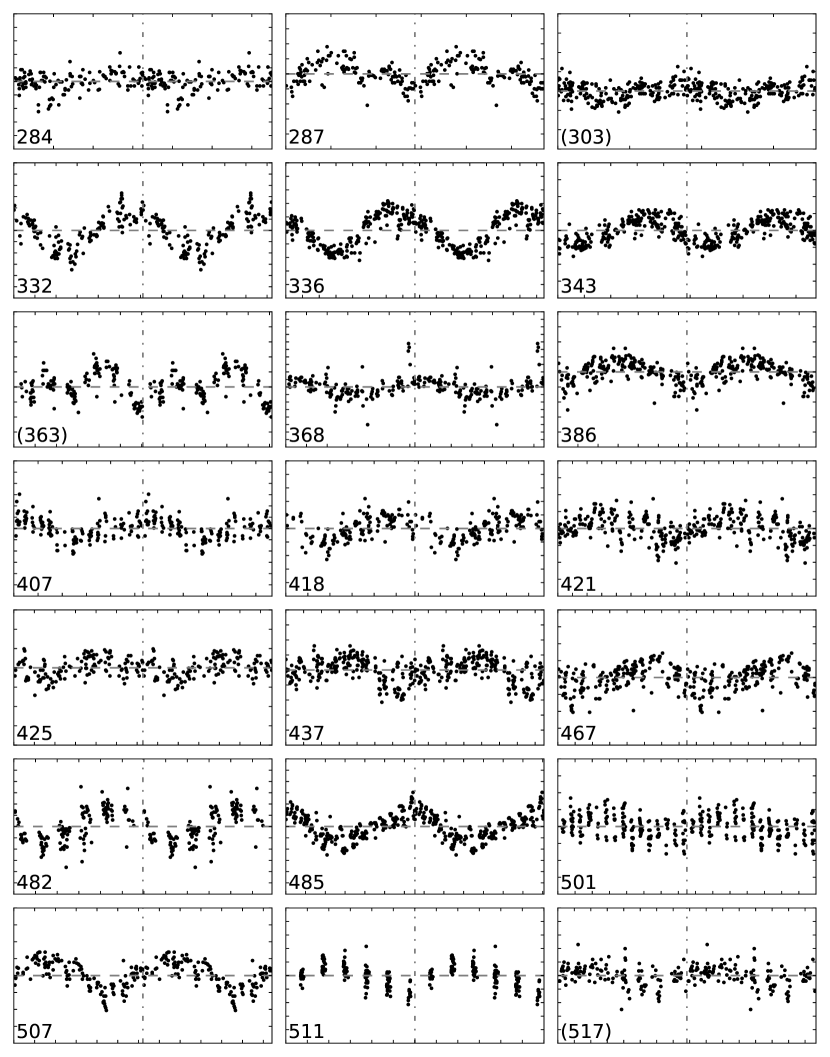
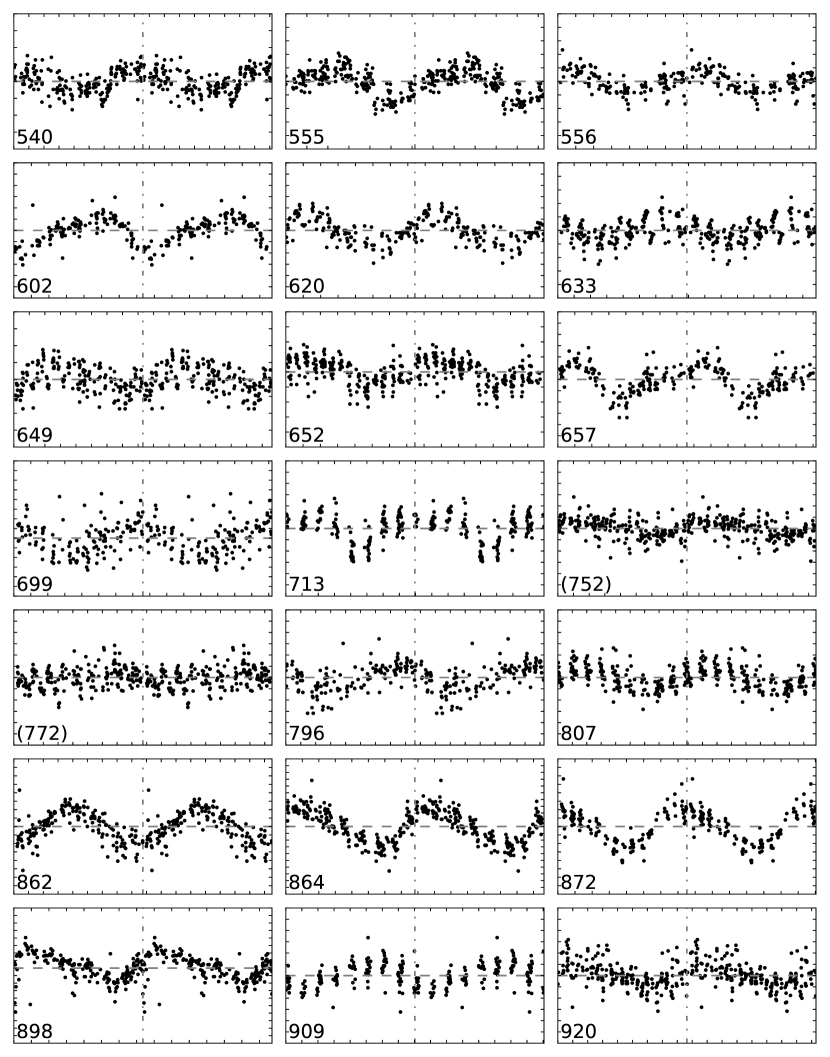
The corresponding Fourier power spectrum for this star, constructed using the clean algorithm of Roberts et al. (1987) is displayed in the lower panel of Fig. 4. The peak is at d, which is consequently listed as the rotation period of the star. (Light curves, power spectra, and phased light curves for all the periodic candidate cluster rotational variables identified in this study are displayed in the online Appendix to this paper in Figs. A1-A9.666The online appendix is available at http://www.edpsciences.org.) We note that few stars actually need to be phased before their periodicity becomes obvious777Our time baseline is long enough for significant spot evolution. Correspondingly, our phased light curves would look significantly better “cosmetically” had we suppressed epochs of low stellar variability. They would also look better had we rephased the light curves to the PDM values, within the error envelope of the clean values.. The periods derived range from d to d, the latter well within the sensitivity of our observational window of 2 months. These 62 periods are listed in Table 2, along with other relevant information for each star. This includes the rotation period, its error (the HWHM of the clean peak), the variability amplitude (from sinusoidal fits to the phased light curves), cross-identification with BJG05, the relevant membership indicator, and relevant notes. The periodic stars considered to be cluster members are indicated in the CMD displayed in Fig. 5.
4.1 Empirical comparisons of the color-period diagram
The rotation periods derived by the methods described above have then been associated with the photometry discussed earlier in the paper, and the corresponding CPD has been constructed for the cluster stars, as displayed in Fig. 6. This diagram is populated by 62 stars with color range 0.47 mag–1.47 mag, and the period range 1.67 d–13.1 d. The field contamination from the background, as seen in the CMD in Fig. 2 suggests that only a couple of these could possibly be non-members.
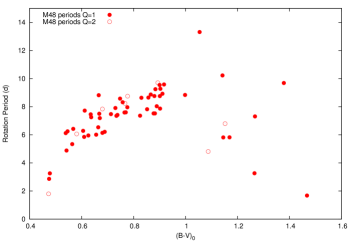
The bluer (warmer) half of the M 48 CPD displays a clear sequence of stars ranging from short-period d stars at to d periods at . This is reminiscent of the situation in the 625 Myr-old Hyades cluster, as discussed below. There is no evidence of the C/fast sequence of stars with 1 d across the entire color range, characteristically seen in younger open clusters such as the Pleiades (Hartman et al. 2010) or M 35 (Meibom et al. 2009). This morphology immediately tells us that M 48 is older than M 35 and the Pleiades, without even having to perform a detailed comparison.
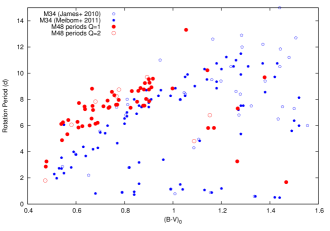
A more detailed empirical idea of how the M 48 cluster fits in with other cluster observations can be obtained by comparing the constructed M 48 CPD directly with other open cluster CPDs. Our first empirical comparison is made with the open cluster M 34, as displayed in the top panel of Fig. 7. The filled and unfilled symbols for M 34 represent the rotation periods determined by Meibom et al. (2011a) and James et al. (2010). Following the original publications, the M 34 data have been de-reddened by (Canterna et al. 1979). We see that M 48 does not possess the fast G- and K-type rotators blueward of that collectively form an (admittedly ill-defined) fast/C sequence in M 34.
The M 48 slow/I sequence is clearly above that of M 34, indicating that M 48 is older than 250 Myr, the nominal age of M 34 (Ianna & Schlemmer, 1993). The I sequences of the two clusters almost overlap at , suggesting that it is already time to move beyond models where the dependence of rotation period, , on age and mass is separable [e.g., Barnes (2003), Barnes (2007), Mamajek & Hillenbrand (2008), Meibom et al. (2011a), Angus et al. (2015)].
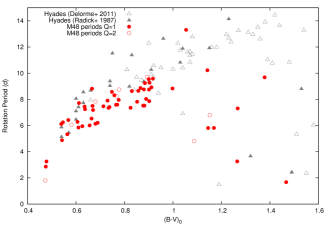
The corresponding comparison for the Hyades open cluster is displayed in the middle panel of Fig. 7, using the rotation period measurements (filled symbols) of Radick et al. (1987), and the more recent measurements (unfilled symbols) of Delorme et al. (2011). Taylor (2006) has determined that the Hyades reddening is mag, and consequently the values from neither of these studies have been dereddened.
We see that the rotation periods of similar-mass stars in M 48 and in the Hyades are comparable, indicating that the ages of the two clusters are roughly comparable. (In their comprehensive study of the Hyades, Perryman et al. (1998) derived an age of 625 Myr.) Closer inspection shows that the average M 48 rotational sequence in the CPD is clearly below the average of the Hyades sequence, telling us that M 48 is somewhat younger. The average difference between the two sequences in the well-sampled interval is 0.99 d.
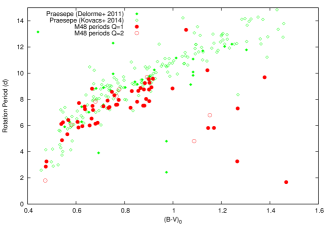
An empirical confirmation of this result is available using the rotation period determinations for the Praesepe cluster by Delorme et al. (2011) and Kovacs et al. (2014). These are plotted in the bottom panel of Fig. 7 using filled and unfilled symbols respectively. In accordance with the determination of Taylor (2006), the color values for Praesepe have been de-reddened by . Praesepe is known to be of very similar age ( Myr; Fossati et al. 2008) to the Hyades. Our comparison of the M 48 and Praesepe CPDs is consonant with this result. In fact, after comparing the Praesepe and Hyades CPDs, Delorme et al. (2011) concluded that Praesepe is slightly younger than the Hyades, perhaps by about 50 Myr. Our comparison in Fig. 7 seems to confirm this conclusion in that the Praesepe sequence is indeed slightly closer to the M 48 sequence than that of the Hyades. The average difference between the two sequences in the interval is 0.44 d, smaller than the Hyades-M48 difference of 0.99 d. These empirical comparisons tell us that the rotational age of M 48 is almost certainly in the (250, 590) Myr interval.
4.2 Comparison against models with separable (t, M) dependencies
These new M 48 rotation periods also permit a useful comparison with prior predictions for the locations of stars of its age in the CPD. Fig. 8 shows how these data compare with a number of empirical studies that relied on the rotation period having separable dependencies on age, , and stellar mass (or a suitable mass proxy such as color) – the original gyrochronology formulation of Barnes (2003), the update in Barnes (2007), the modification to that formulation proposed by Mamajek & Hillenbrand (2008), one based largely on the M 34 cluster data of Meibom et al. (2011a), and the recent one of Angus et al. (2015), the last based on a very limited cluster dataset, and a small number of field stars with ages determined from asteroseismology. The displayed comparisons all use the prior published age for M 48 of 400 Myr. Moderate changes to the age used make moderate changes to the displayed curves, but do not change the overall behavior.
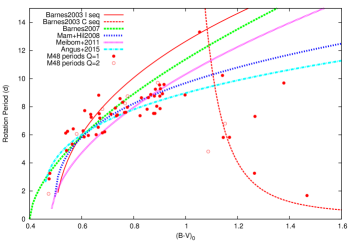
We observe that all the models displayed here capture, to a certain extent, the overall behavior of the M 48 data blueward of . However, there is a potentially serious problem redward of this color value. The measured rotation periods seem to decline for redder (lower-mass) stars. To a certain extent, this behavior is not unexpected, because these empirical formulations of gyrochronology explicitly ignored the fast rotators (with the exception of Barnes (2003), which treated them separately as shown in Fig. 8), electing to concentrate attention on the slow/I sequence stars, which are the only ones seen in M 48 blueward of .
There are also certain differences, obvious in Fig. 8, with respect to the point where these models intersect the color axis, and with the color range over which each of these provides a good fit (or not) to the periods. (We will show a detailed comparison with a subsequent preferred model below.) Finally, it should be noted that the separable empirical models have slightly differing dependencies on the age, a fact that is imperceptible in such a comparison, being overwhelmed by the mass dependence.
We have not been able to identify any red stars (say ) that are very slow rotators (10 d). While our observations do possess the time baseline to identify such stars, any such stars are fainter than (see Fig. 5), where the precision of our photometry declines, affecting our sensitivity to such periods if their variability amplitudes are small. Our data therefore do not allow us to state conclusively whether such stars actually exist or not in M 48.
4.3 Comparison with the B2010 model
Our preferred way of interpreting these M 48 rotation period data is with the gyrochronology formulation of Barnes (2010), hereafter B10, based on the rotational evolution ideas described in Barnes & Kim (2010). A significant part of this preference arises from the simplicity of this model, where only two dimensionless constants, and , are required to specify the two relevant spindown timescales for all fast and slow cool stars, and hence of the entire main sequence rotational evolution of cool stars. The B10 formulation describes the behaviors of both the slow/I-type stars and the fast/C-type stars in a single model, treating them symmetrically888Brown (2014) has called this the ‘Symmetric Empirical Model.’. Furthermore, the rotational isochrones constructed using this model are better than those from other models in matching the measured color-period diagram of the 2.5 Gyr-old cluster NGC 6819, studied by Meibom et al. (2015). And we show below that this model describes the morphology of the M 48 CPD in considerable detail.
This B10 model provides the age of an individual star as an explicit function of its rotation period (and a mass variable), albeit with more complexity than the separable empirical models discussed above. One can then take a suitable average over the cluster stars to derive the corresponding cluster age. The procedure first requires the calculation of the (global) convective turnover timescale, , for each star from its de-reddened color. This is simply accomplished by interpolation from Table 1 in Barnes & Kim (2010). Then one applies equation (32) from B10,
| (1) |
This is an explicit expression for the age of the star, in terms of its measured rotation period , and , the latter a proxy for its mass or color. Here, Myr/d and d/Myr are two dimensionless constants whose values are decided by the totality of the open cluster rotation period data, and the solar datum; we have simply adopted unchanged the values proposed in B10, particularly in view of the model’s ability to reproduce well the CPD of the 2.5 Gyr-old cluster NGC 6819, as discussed in Meibom et al. (2015). is the initial rotation period, set to d, following B10, but we will also allow it to vary within certain bounds below, as allowed by observations, and as described in B10. (It is also possible to use other turnover timescales, but then one must be careful to recalibrate the constants and to match the totality of the open cluster and solar rotational data, as discussed in B10.)
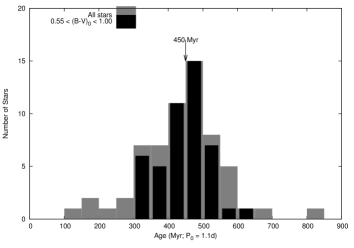
Provided that the measured period is greater than , each measured rotation period results in a corresponding gyro-age , which is plotted in the histograms in Fig. 9 for d. The gray histogram shows the distribution for all 62 stars with measured rotation periods. We obtain a distribution that is sharply peaked at a median value of 451 Myr, and mean value of 441 Myr but with relatively wide wings, giving a standard deviation of 117 Myr (= 26%).
A significant portion of this relatively large dispersion can be traced to a number of outliers. For instance, the outlier at Myr is No.1456, the one above all the other stars in the CPD, with d, ). Because it lies on the cluster sequence in the CMD, there is no good reason to discard it at the present time. The other outliers are mostly either very blue or very red stars (defined for this study as lying outside the color range.)
The black histogram in Fig. 9 shows the distribution for the 46 stars in this restricted color range, where the I sequence is particularly well-defined. This color region contains the Sun and many well-studied open clusters, and is known from the rotation period observations for NGC 6819 ( Gyr) by Meibom et al. (2015) to be well-calibrated. In the corresponding histogram, many of the outliers disappear to reveal a distribution where % of the stars are confined to the Myr region. An M 48 cluster gyro-age outside this range is essentially ruled out. The formal mean age for this restricted distribution is Myr (median = 457 Myr), but with a smaller standard deviation 70 Myr (= 16%). These results enable us to confirm the Myr isochrone age of this cluster, and to propose a mean rotational (gyrochronology) age of Myr for M 48.
We now show that much of the above scatter arises from intrinsic astrophysical variations in the initial rotation periods, so that it is likely that the uncertainty on the gyro-age of M 48 is actually significantly smaller than the 70 Myr standard deviation for the best-measured stars. For open clusters that are significantly younger than the Hyades, it is well-known, and expected, that the rotation periods of cool stars will not necessarily have converged to a single sequence. Indeed, in ZAMS clusters, two distinct sequences are sometimes observed, as discussed earlier, and as is visible in the CPD for M 34 (see Fig. 7). In the M 48 CPD, stars with masses greater than () have essentially converged to a single sequence, while lower mass stars most certainly have not.
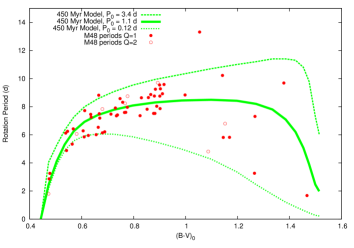
There is a simple way to understand the dispersion in the age distribution derived above. Given an age , and using a given initial period , one can solve equation (1) numerically999For a given , and age , one can also obtain a solution for analytically, as shown in Barnes (2010), by simply solving a quadratic equation. to associate a value to every value of interest, or equivalently the value of . Such a curve is the isochrone for that initial period, since it is the locus of all such equal-age points. The 450 Myr isochrone for d is displayed in Fig. 10 with the thick central line (solid green). Barnes (2010) found that the lower- and upper envelopes of the initial period distribution could be reasonably set at 0.12 d and 3.4 d respectively. Carrying out the corresponding calculations for d and d with the same age of 450 Myr yields the lower (dotted green) and upper lines (dashed green) respectively. (Other intermediate initial period values in this range would provide curves that are bounded by these.)
This collection of curves can be viewed as representing the total rotational isochrone for M 48, providing a narrow sequence at the blue/solar-like end, and a wider sequence for lower mass stars. We observe that this range of initial conditions explains almost all the scatter in the rotation period measurements as a function of mass, because only one of our 62 rotation periods lies significantly outside the range of these isochrones. Consequently, with allowed to vary within the astrophysical limits permitted by ZAMS observations, almost all our stars are consistent with a single age of 450 Myr. This fact is consistent with the current belief that open clusters are simple stellar populations, and that they are describable as single-age populations.
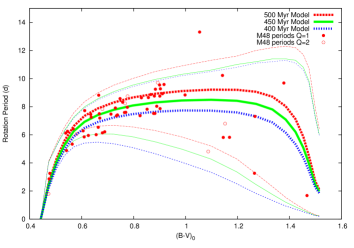
We now ask how well we know the gyro-age of the cluster as a whole. The histogram of ages (displayed in Fig. 9) shows that moving Myr off the mean age halves the bin occupancies. Bins beyond these ages are occupied by stars for which 1.1 d is not a good estimate for the initial period, as Fig. 10 shows. We therefore construct 400 Myr and 500 Myr rotational isochrones, and display them in Fig. 11 (dotted blue and dashed red, respectively), in an analogy with classical isochrones. Neither of these can be considered a reasonable fit to the M 48 CPD. In particular, the 400 Myr and 500 Myr isochrones for d pass below and above the core of the rotation period distribution with . The d isochrones are not particularly informative. However, the d isochrones for and Myr also pass respectively below and above the group of the fastest cluster rotators at near-Solar color (and maybe even redder values), making them significantly worse fits to the fast edge of the rotation period distribution. We therefore consider 50 Myr to be a reasonable estimate of the uncertainty on the gyro-age of M 48, which we suggest is Myr.
Another approach is the following. Ignoring their individual membership of M 48 and treating all the 62 measured stars independently gives the histogram displayed in Fig. 9, with its standard deviation of 117 Myr. Clearly, the uncertainty on the mean age of the cluster must be much lower than the uncertainty of an individual star. The standard error (S.E.) of the mean is formally Myr. But taking this to represent the error in cluster age seems unjustified, in view of the possibility of residual systematic age errors arising from our incomplete understanding of rotational stellar evolution.
To estimate possible systematic errors, we constructed equivalent age distributions for the comparison clusters displayed in Fig. 7, again using the interval. These give mean ages of 260, 522, and 584 Myr for M 34, Praesepe, and the Hyades, respectively, which suggest that if the corresponding isochrone ages of 250, 590, and 625 Myr, are taken as absolute truth, then systematic errors in the B10 version of gyrochronology could contribute at the level of Myr to the M 48 age uncertainty. Then adding, in quadrature, the Myr internal error of the mean for M 48 gives Myr. This suggests that the Myr value quoted above is not unreasonable.
In closing, it is worth noting that an analysis like the one above might not be as easily accomplished for a much younger cluster, where the lower-mass stars are still on the pre-main sequence (and the demands on rotational evolution models are more severe). Indeed Cargile et al. (2014) appear to have experienced some difficulties in adapting the Barnes (2010) formulation for the Myr-old Blanco 1 open cluster, and resorted to the separable formulations for to interpret that cluster’s CPD.
5 Conclusions
We have performed a two-month-long photometric time series campaign on the southern open cluster M 48 (NGC 2548) using the AIP’s STELLA I robotic imaging telescope and associated WiFSIP 4K imager, located in Tenerife. We also acquired photometry in the Johnson B and V bands to a depth of for the region centered on the cluster. A relatively clear cluster sequence is visible in our photometry and largely coincides with the astrometric and photometric candidate members identified by prior work on the cluster. This sequence in the CMD is followed closely by a theoretical isochrone and is also closely matched by the rotational variables.
We constructed light curves populated with 120 data points each and with no serious data gaps over the two-month observing baseline. Our time-series photometry is repeatable at the 3 mmag level for F-G stars, with the uncertainty increasing as expected for fainter stars. We successfully derived rotation periods for 62 cool photometric cluster member stars, 54 of which are classified as higher-quality, and 8 are lower-quality. These rotation periods and the associated colors of the stars define the M 48 cluster’s CPD, the rotational equivalent of the CMD. In the CPD, these periods delineate a clear sequence blueward of ; redward of this point, the rotation period distribution has a significantly larger scatter that is likely astrophysical.
While comparable with the rotational sequences in the 625 Myr-old Hyades open cluster and the 590 Myr-old Praesepe cluster, this sequence lies below both, empirically demonstrating that M 48 is younger. Likewise, direct comparison with the CPD for the 250 Myr-old M 34 open cluster shows that M 48 is older.
We constructed the distribution of gyro-ages for the cluster stars, finding one that is sharply peaked at Myr, but with relatively wide wings, giving a standard deviation of Myr (= 26%), and suggesting that this precision for comparable field star rotators is reasonable and attainable.
We showed that the known (astrophysical) contribution from initial period variations on the ZAMS accounts for much of the scatter in the rotational ages, so that almost all the measured rotation periods are actually consistent with a single cluster age of Myr. For the cluster as a whole, the age uncertainty is about 50 Myr. We therefore propose a mean cluster age from gyrochronology for M 48 of Myr.
In sum, this study has added another open cluster of intermediate age to the canonical literature.
Acknowledgements.
This work was supported by the German Deutsche Forschungsgemeinschaft, DFG project number DFG STR645/7-1. This work is based on data obtained with the STELLA robotic telescopes in Tenerife, an AIP facility jointly operated by AIP and IAC. Detailed comments from an anonymous referee are also appreciated.References
- (1) Allard, F., Homeier, D., & Freytag, B. 2011 in 16th Cambridge Workshop on Cool Stars, Stellar Systems, and the Sun, ed. C. Johns-Krull, M. Browning, A. West, ASP, 448, 91
- (2) Angus, R., Aigrain, S., Foreman-Mackey, D., McQuillan, A., 2015, MNRAS, 450, 1787
- (3) Balaguer-Nunez, L., Jordi, C., & Galadi-Enriquez, D., 2005 (BJG05), A&A, 437, 457
- (4) Baliunas, S. L., Sokoloff, D. & Soon, W. H., 1996, ApJL, 457, 99
- (5) Barnes, S. A., 2003, ApJ, 586, 464
- (6) Barnes, S. A., 2007, ApJ, 669, 1167
- (7) Barnes, S. A., 2010 (B10), ApJ, 722, 222
- (8) Barnes, S. A. & Kim, Y.-C., 2010, ApJ, 721, 675
- (9) Barnes, S. A. & Sofia, S., 1996, ApJ, 462, 746
- (10) Barnes, S. A., Sofia, S., Stauffer, J. & Prosser, C. P. 1999, ApJ, 516, 263
- (11) Bertin, E. & Arnouts, S., 1996, A&A, 117, 393
- (12) Bouvier, J., Cabrit, S., Fernandez, M., Martin, E.L., Matthews, J.M., 1993, A&A, 272, 176
- (13) Bouvier, J., Forestini, M. & Allain, S., 1997, A&A, 326, 1023
- (14) Brown, T. M. 2014, ApJ, 789, 101
- (15) Calabretta, M. R. & Greisen, E. W., 2002, A&A, 395, 1077
- (16) Canterna, R., Perry, C. L., & Crawford, D. L. 1979, PASP, 91, 263
- (17) Cargile, P., James, D. J., Pepper, J. et al. 2014, ApJ, 782, 29
- (18) Chaboyer, B., Demarque, P., & Pinsonneault, M. H., 1995, ApJ, 441, 876
- (19) Collier Cameron, A., Campbell, C. G., Quaintrell, H., 1995, A&A, 298, 133
- (20) Chromey, F. R. & Hasselbacher, D. A., 1996, PASP, 108, 944
- (21) Crawford, D. L. 1975, AJ, 80, 955
- (22) Delorme, P., Cameron, A. C., Hebb, L., et al. 2011, MNRAS, 413, 2218
- (23) Ebbighausen, E. G. 1939, ApJ, 90, 689
- (24) Epstein, C. & Pinsonneault, M., 2014, ApJ, 780, 159
- (25) Fossati, L., Bagnulo, S., Landstreet, J., Wade, G., Kochukov, O., Monier, R., Weiss, W., & Gebran M., 2008, A&A, 483, 891
- (26) Gallet, F. & Bouvier, J., 2015, A&A, 577, 98
- (27) Granzer, T. 2004, AN, 325, 513
- (28) Hartman, J. D., Bakos, G. A., Kovacs, G. & Noyes, R. W. 2010, MNRAS, 408, 475
- (29) Hartman, J.D., Gaudi, B.S., Pinsonneault, M.H. et al., 2009, ApJ, 691, 342
- (30) Hauschildt, P. H., Allard, F., & Baron, E. 1999, ApJ, 512, 377
- (31) Ianna, P. A., & Schlemmer, D. M. 1993, AJ, 105, 209
- (32) Irwin, J., Hodgkin, S., Aigrain, S. et al., 2007, MNRAS, 377, 741
- (33) James, D. J., Barnes, S. A., Meibom, S. et al. 2010, A&A, 515, 100
- (34) Kovacs, G, Hartman, J. D., Bakos, G. A. et al. 2014, MNRAS, 442, 2081
- (35) Kraft, R., 1970, in Spectroscopic Astrophysics, An Assessment of the Contributions of Otto Struve. Edited by G.H. Herbig. Berkeley: University of California Press, p.385
- (36) Landolt, A. 2009, AJ, 137, 4186
- (37) MacGregor, K. B. & Brenner, M., 1991, ApJ, 376, 204
- (38) Mamajek, E. & Hillenbrand, L. A., 2008, ApJ, 687, 1264
- (39) Matt, S., Brun, A. S., Baraffe, I. et al. 2015, ApJL, 799, 23
- (40) Meibom, S., Mathieu, R. D. & Stassun, K. G. 2009, ApJ, 653, 621
- (41) Meibom, S., Mathieu, R. D., Stassun, K. G., Liebesny, P. & Saar, S. H. 2011a, ApJ, 733, 115
- (42) Meibom, S., Barnes, S. A., Latham, D. W. et al. 2011b, ApJL, 733, 9
- (43) Meibom, S., Barnes, S. A., Platais, I. et al., 2015, Nature, 517, 589
- (44) Mink, D. J., 2002, in Astronomical Data Analysis Software and Systems XI, ASP Conference Proceedings, Vol. 281. Edited by David A. Bohlender, Daniel Durand, and Thomas H. Handley. ISBN: 1-58381-124-9. ISSN: 1080-7926. San Francisco: Astronomical Society of the Pacific, 2002, p. 169.
- (45) Patten, B. M. & Simon, T. 1996, ApJS, 106, 489
- (46) Pesch, P. 1961, ApJ, 134, 602
- (47) Perryman, M. A. C., Brown, A. G. A., Lebreton, Y. et al. 1998, A&A, 331, 81
- (48) Queloz, D., Allain, S., Mermilliod, J.-C., Bouvier, J., & Mayor, M., 1998, A&A, 335, 183
- (49) Radick, R. R., Thompson, D. T., Lockwood, G. W., Duncan, D. K. & Baggett, W. E., 1987, ApJ, 321, 459
- (50) Rider, C. J., Tucker, D. L., Smith, J. A. et al. 2004, AJ, 127, 2210
- (51) Roberts, D. H., Lehar, J. & Dreher, J. W., 1987, 93, 968
- (52) Sharma, S., Pandey, A. K., Ogura, K. et al. 2006, AJ, 132, 1669
- (53) Sills, A., Pinsonneault, M. H., & Terndrup, D. M., 2000, ApJ, 534, 335
- (54) Soderblom, D.R., Stauffer, J.R., Hudon, J.D., & Jones, B.F., 1993, ApJS, 85, 315
- (55) Spada, F., Demarque, P., Kim, Y.-C. & Sills, A. 2013, ApJ, 776, 87
- (56) Stauffer, J.R. & Hartmann, L.W., 1987, ApJ, 318, 337
- (57) Stellingwerf, R. F. 1978, ApJ, 224, 953
- (58) Strassmeier, K. G., Granzer, T., Weber, M. et al., 2004, AN, 325, 527
- (59) Strassmeier, K. G., Granzer, T., & Weber, M., 2010, Adv. in Astr., 2010, p.19
- (60) Strassmeier, K. G., Weingrill, J., Granzer, T. et al. 2015, A&A, 580, 66
- (61) Taylor, B. J. 2006, AJ, 132, 2453
- (62) van Leeuwen, F. & Alphenaar, P., 1982, Messenger, 28, 15
- (63) van Leeuwen, F., Alphenaar, P. & Meys, J.J.M., 1987, A&AS, 67, 483
- (64) Wilson, O. C., 1978, ApJ, 226, 379
- (65) Wu, Z. Y., Tian, K. P., Balaguer-Nunez, L. et al. 2002, A&A, 381, 464
- (66) Wu, Z.-Y., Zhou, X., Ma, J., Jiang, Z.-J., & Chen, J.-S. 2006, PASP, 118, 1104
- (67) Yi, S., Demarque, P., Kim, Y.-C. et al., 2001, ApJS, 136, 417
- (68) Zechmeister, M. & Kurster, M., 2009, A&A, 496, 577
longtablerccccccccll
Rotation periods of the M 48 stars.
Id V B–V P Perr amp mem Q BJG # Notes
mag mag days days mag
\endfirsthead
continued.
Id V B–V P Perr amp mem Q BJG # Notes
mag mag days days mag
\endhead\endfoot284 13.577 0.56 3.25 0.08 0.013 – 1 Variable in 2nd half
287 13.597 0.56 2.86 0.10 0.018 M 1 BJG 3157
303 13.726 0.55 1.80 0.02 0.007 M 2 BJG 841 Low Amplitude
332 13.951 0.62 6.12 0.41 0.037 – 1
336 13.970 0.69 7.72 0.56 0.030 – 1
343 14.034 0.62 4.88 0.22 0.015 M 1 BJG 3584
363 14.146 0.66 6.06 0.42 0.017 M 2 BJG 2049 2 spot groups, PDM period
368 14.172 0.63 6.24 0.35 0.022 – 1
386 14.255 0.65 6.42 0.35 0.014 M 1 BJG 2109
407 14.395 0.64 5.33 0.26 0.020 M 1 BJG 3680
418 14.439 0.69 5.85 0.36 0.019 – 1
421 14.440 0.75 8.82 0.64 0.012 M 1 BJG 2037
425 14.459 0.69 6.28 0.44 0.009 M 1 BJG 1614
437 14.525 0.72 7.25 0.72 0.019 M 1 BJG 3583
467 14.640 0.71 7.45 0.57 0.014 – 1
482 14.671 0.71 5.95 0.32 0.029 M 1 BJG 2975
485 14.683 0.74 6.53 0.42 0.028 M 1 BJG 4781
501 14.762 0.75 7.50 0.52 0.018 M 1 BJG 521
507 14.781 0.77 6.21 0.36 0.018 – 1
511 14.792 0.74 6.00 0.23 0.020 M 1 BJG 3846
517 14.812 0.76 7.83 1.73 0.011 M 2 BJG 3927 P d possible, DR?
540 14.904 0.83 8.57 0.72 0.012 M 1 BJG 2600
555 14.955 0.76 6.14 0.37 0.023 M 1 BJG 1608
556 14.956 0.75 7.19 0.38 0.018 M 1 BJG 4335
602 15.098 0.81 7.35 0.44 0.032 M 1 BJG 3935
620 15.172 0.82 7.41 0.57 0.026 M 1 BJG 3168
633 15.201 0.81 7.90 0.80 0.019 M 1 BJG 1641
649 15.264 0.84 8.31 0.57 0.012 M 1 BJG 1917
652 15.266 0.79 7.47 0.58 0.016 M 1 BJG 3964
657 15.279 0.85 7.59 0.48 0.036 – 1
699 15.365 0.85 7.60 0.79 0.029 M 1 BJG 2997
713 15.399 0.86 7.96 0.64 0.032 M 1 BJG 2704
752 15.496 0.85 8.23 0.51 0.014 M 2 BJG 3852 PDM breaks ambiguity
772 15.552 0.86 8.75 0.79 0.011 M 2 BJG 3597 LS ambiguous
796 15.609 0.91 8.63 0.61 0.022 – 1
807 15.637 0.99 8.92 0.63 0.018 M 1 BJG 915 2 spot groups
862 15.771 0.96 8.75 0.72 0.040 – 1
864 15.771 0.93 7.82 0.54 0.065 – 1
872 15.782 0.96 7.52 0.45 0.049 – 1
898 15.826 0.90 7.36 0.54 0.036 M 1 BJG 1828
909 15.838 0.97 8.03 0.55 0.019 – 1
920 15.866 0.94 8.65 0.67 0.017 – 1
921 15.868 0.98 7.86 0.47 0.022 – 1
923 15.869 0.95 8.87 0.69 0.022 – 1
931 15.889 0.98 8.75 0.68 0.025 – 1
935 15.897 0.96 9.24 0.75 0.037 – 1
937 15.902 0.96 7.52 0.50 0.035 M 1 BJG 2546
954 15.922 0.97 9.70 0.79 0.013 M 2 BJG 1703 Low Amplitude
969 15.956 0.98 9.55 0.90 0.021 N 1 BJG 2435
974 15.966 0.98 9.27 0.68 0.016 M 1 BJG 2033
975 15.967 1.00 9.58 0.62 0.028 M 1 BJG 578
1227 16.409 1.08 8.83 0.72 0.064 M 1 BJG 1362
1455 16.730 1.17 4.81 0.24 0.021 M 2 BJG 2505 Noisy, PDM picks d
1456 16.730 1.13 13.31 1.58 0.026 M 1 BJG 4598
1605 16.946 1.22 5.81 0.30 0.083 M 1 BJG 4556
1711 17.091 1.22 10.22 0.84 0.063 M 1 BJG 3794
1744 17.130 1.23 6.79 0.44 0.026 – 2 Noisy, PDM picks d
2010 17.483 1.25 5.82 0.26 0.056 – 1
2071 17.568 1.35 7.30 0.57 0.088 M 1 BJG 2439
2285 17.805 1.35 3.26 0.10 0.075 N 1 BJG 2458
2346 17.852 1.46 9.68 0.72 0.073 M 1 BJG 771
2632 18.161 1.55 1.67 0.03 0.117 M 1 BJG 3428
101010Mem = M, N, – respectively indicate BJG05 members, non-members, and stars without BJG05 membership information.
Q = 1, 2 respectively indicate high quality and lower quality periods.
Appendix A Online appendix