Luminescence of photochromic centers in calcium fluoride crystals doped with Lu3+ ions
Abstract
We report data on the luminescence spectra associated with photochromic centers in X-ray irradiated calcium fluoride crystals doped with Lu ions. Irradiation in low energy photochromic centers absorption band excites emission, which can be identify with transitions into photochromic centers. Ab initio calculation of absorption spectrum of photochromic center agrees rather well with experimental data.
keywords:
photochromic center , rare earth , luminescence , ab initio , F-center , TD-DFT1 Introduction
Calcium fluoride crystals doped with certain rare earth ions (CaF2:, =La3+, Ce3+, Gd3+, Tb3+, Lu3+, Y3+) demonstrate the photochromic behavior under x-ray or gamma irradiation and additive coloration. Photochromic centers are responsible for the intense absorption bands in visible wavelength range. On basis of an extensive study of optical and EPR behavior (Anderson and Sabisky, 1971; Alig, 1971; Staebler and Schnatterly, 1971; Bugaenko et al., 2008; Sizova and Radzhabov, 2012) of this centers the two models of photochromic centers were proposed.
In the first model photochromic effect occurs under thermally or optically stimulated electron transition from the divalent rare earth ion to the nearest neighboring anion vacancy. Thus, PC center is F-center disturbed by the nearest-neighbor trivalent rare earth ion, but ionized PC center (PC+) is charged anion vacancy near the divalent rare earth ion (Staebler et al., 1968; Bernhardt et al., 1971; Egranov et al., 2015).
In the second and the widely accepted model thermally stable photochromic centers in CaF2 crystals consist of one PC+(RE) or two electrons PC(RE) bound at the anion vacancy adjacent to the trivalent rare earth ion RE (Anderson and Sabisky, 1971; Alig, 1971). Otherwise, PC(RE) center is F′-center, F-center having two electrons in the ground state, and PC+(RE)-center is F-center disturbed by nearest-neighboring RE3+ ion. This model is also confirmed by ENDOR for the Ce3+ photochromic center in CaF2 (Aldous and Baker, 1976). Colored crystals exhibit a photochromic effect, i.e. they change color under exposure to light. This process is accompanied by a reversible transformation of PC(RE) center (Staebler and Schnatterly, 1971; Bugaenko et al., 2008; Sizova and Radzhabov, 2012).
The data on the PC center luminescence could clarify the model of the photochromic center and explain the mechanism of its formation. However, no luminescence of F-like centers in alkaline earth fluorides has been observed yet. Furthermore, according to Bartram and Stoneham excited F-centers in fluoride crystals decay non-radiatively (Bartram and Stoneham, 1975). Nevertheless, Görlich et al. (1968) and Kötitz et al. (1975) observed partially polarized broad band luminescence corresponding to PC(Y) and PC(La) centers in additively colored CaF2-Y and CaF2-La crystals.
Attempts of theoretical calculations of photochromic centers were made to clarify mechanism of its formation and structure. Alig (1971) showed in semiempirical calculation that bands in optical absorption spectra of PC+(Ce) center were associated with transitions in a lowering of symmetry of F-center by neighbor rare earth ion. Overlap of 5d orbitals of rare earth ion with orbitals of F-center formed excited states of photochromic center. Ab initio calculations of PC(Y) and PC+(Y) centers were performed by Mysovsky et al. (2008). The authors calculated position of absorption bands of PC(Y) and PC+(Y) centers. Unfortunately, the agreement of calculated optical absorption bands with experimental was worse than they expected. In the article by (Mysovsky et al., 2011) optical absorption and luminescence spectra of perturbed F-center were calculated using ab initio method. Authors predicted luminescence of this centers in near infrared wavelength range. We employed a similar calculation method of hybrid embedded cluster.
In this article, we observe near infrared broadband luminescence associated with photochromic centers in the irradiated CaF2 crystals doped with Lu ions. Our optical spectroscopy and theoretical calculation data give further information about electronic states of PC(Lu) centers.
2 Methodology
2.1 Experimental technique
Crystals of CaF2 were grown from the melt by the Bridgman-Stockbarger method in graphite crucibles in vacuum and were doped with 0.1 mol.% of LuF3. In alkaline earth fluoride single crystal growth a small amount of CdF2 was generally used as a scavenger in order to remove oxides contained in the raw materials. The crystals were irradiated at 300 K by x-rays from a Pd tube operating at 35 kV and 20 mA for one hour. After irradiation, the crystals acquired a golden-yellow color. Undoped crystals had no color after irradiation.
The optical absorption spectra were obtained on a Perkin-Elmer Lambda 950 UV/VIS/NIR spectrophotometer at 80 and 300 K at the Baikal Analytical Center for Collective Use, Siberian Branch, Russian Academy of Sciences. Photoluminescence (PL) measurements were conducted using a 700 W xenon arc lamp at 80 and 300 K in vacuum cold-finger cryostat. The spectra were detected with a MDR2 grating monochromator, a photomultiplier FEU-83 with Ag-O-Cs photocathode, and a photon-counter unit. The luminescence spectra were corrected for spectral response of detection channel. The photoluminescence excitation (PLE) spectra were measured with a grating monochromator MDR12 and Xe arc lamp. Excitation spectra were corrected for the varying intensity of exciting light due.
2.2 Calculation details
The ab initio calculations were performed using a hybrid embedded cluster method which allowed to combine quantum mechanical (QM) cluster calculation and classically atoms described with shell model. The QM cluster with defect was surrounded by a large number (700) of atoms which were described classically with the pair potentials. We used the pair potential parameters of Bukingem form which were the same as by Myasnikova et al. (2010). About 50 cations between QM cluster and classical region were replaced with interface atoms with LANL1 ECP pseudopotentials specially optimized to minimize distortion of edge of QM cluster. All atoms of the QM, interface and classical region were allowed to relax during geometry optimization step. The described method allowed to represent the lattice distortion around defect with taking into account deformation and polarization of lattice. About 6000 fixed atoms surrounded classical region for the representation the correct Madelung potential inside classical region. For the density functional theory (DFT) calculations we used the modified B3LYP functional containing 40% of Hartree-Fock and 60% of DFT exchange energies which showed most adequate electron state localization and was successfully employed for DFT calculations of defects in fluoride crystals. Optical energies and dipole matrix elements of transitions were calculated with the time-dependent DFT (TD-DFT) method applied.
We used the GUESS computer code by Sushko et al. (2000) for geometry optimization step and Gaussian 2003 code (Frisch et al., 2007) for TD DFT calculations. The applicability of the embedded cluster calculation method for point defects in ionic crystals was described by Mysovsky et al. (2011) and Myasnikova et al. (2012) in more details.
The calculations were performed in a cluster Ca16F33. The central fluorine atom was deleted for modeling vacancy and one nearest cation was replaced by lutetium ion. We used SDD basis setted on Lu3+ ion and 6-311+G∗ basis on fluorine and calcium ions. Moreover for correct representation of the F-center density we added the diffuse d-shell to calcium basis.
3 Results and discussion
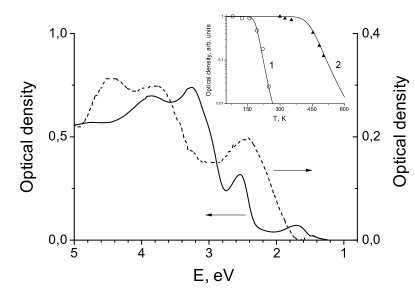
If colorless CaF2-Lu crystal is irradiated at room temperature it acquires golden-yellow. Its optical absorption spectrum is given in Fig. 1, solid curve. The color of crystals is due to an intense absorption in visible wavelength range. The absorption bands at 2.54; 3.25 and 3.83 eV are resolved. The bands do not resolved well at low temperatures down to 7.5 K. This bands are attributed to transition in photochromic PC(Lu) center. The ones are thermally bleached at about 600 K (see curve 2 of inset to the fig. 1).
The crystals irradiated at 80 K demonstrate other bands in optical absorption spectrum. The intense absorption bands at 2.44; 3.8 and 4.5 eV correspond to transition in ionized photochromic PC+(Lu) center (Fig. 1, dashed curve). The spectrum of the PC(Lu) center at 80 K is identified by then photo-ionizing the aligned PC+(Lu) center with visible (VIS) light and vise versa by photo-ionizing with ultraviolet (UV) light. Ionized photochromic centers become unstable at temperatures higher than 250 K (curve 1 of inset to the fig. 1). That is why only PC centers are observed in irradiated at room temperature crystals. Photochromic effect is observed only at low temperatures. The similar results were observed by Staebler and Schnatterly (1971) in the additively colored crystals.
We should also mention a band with energy 1.7 eV in the optical absorption spectra of PC(Lu) centers (see fig. 1, solid curve). In additively colored crystals in this band linear dichroism due to orientation of the PC(Lu) center was not observed by Staebler and Schnatterly (1971). Also, this band is not involved in the reversible transformation of PC(Lu) center (photochromic effect) at low temperature. Therefore, we, as before Staebler and Schnatterly (1971), do not attribute this band for transition into the PC(Lu) center.
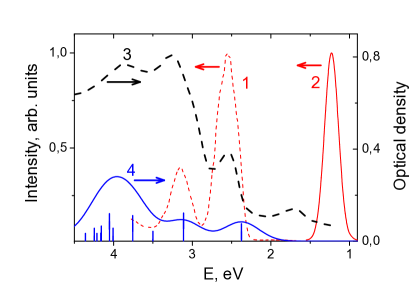
We find an intense luminescence in X-ray irradiated at 300 K CaF2 crystals doped with Lu3+ ions. The luminescence under lamp excitation in green wavelength range peaked at about 1.23 eV with a halfwidth of 0.21 eV (Fig. 2, solid curve 2). The excitation spectrum of the luminescence contains two bands peaking at 2.54 and 3.15 eV (Fig. 2, dashed curve 2). The low energy excitation band has more intensity than the higher energy one. The measured excitation spectrum also correlates well with the absorption spectrum of the PC(Lu) centers (Fig. 2, dashed curve 3). Therefore, we can conclude that the luminescence is due to radiative transitions into PC(Lu) center.
Intensity of the luminescence increases with decrease temperature (Fig. 3 (a)). The temperature dependence of the luminescence intensity is explained in terms of the probability of nonradiative transitions by Mott’s equation (Mott, 1938):
| (1) |
with frequency factor . The activation barrier for thermal quenching can be estimated at the value of =0.47 eV.
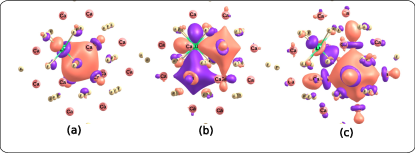
The calculated lattice distortion of photochromic center is small. So in the fully relaxed configuration the three nearest cations displace inward about 0.04 Å, and the displacements of six nearest cations do not exceed 0.11 Å. However, lutetium ion is displaced about 0.13 Å to the fluorine vacancy direction from the starting position. The small deformation around F-center is quite typical for this defect as was mentioned by Mysovsky et al. (2011). So the calculated structure of photochromic center is correspond to F′-center having two electrons in ground state which is slightly disturbed by rare earth ion. One-electron ground state is shown in Fig. 4 (a). It is clear, that the ground level is a spin-singlet 1A state in which both electrons are in the lowest-energy spatial state (1s) with antiparallel spins.
Excited state with energy 2.54 eV above the ground state is given in Fig. 4 (b). This state is formed by admixture of low-lying 5d states of rare earth ion and 2s-like states of F′-center. Higher energy states corresponding to transition with energy 3.25 eV is shown in Fig. 4 (c). It is formed by admixture of low-lying 5d states and 2p-like levels of F′-center. This result is in agreement with model proposed by Alig (1971) for PC(Ce) center and results of calculation PC(Y) center reported by Mysovsky et al. (2008).
In the calculated optical absorption spectrum three absorption bands are clearly observed (Fig. 2, vertical lines)). The smooth solid curve 4 shown in Fig. 2 is a convolution of Gaussian-type functions, each centered at the excitation energy of the corresponding transition and weighed with the value of the corresponding oscillator strength. The full width at half maximum (FWHM) for all Gaussians is 1 eV. The band position is in rather well agreement with experimental data (within 0.1 eV).
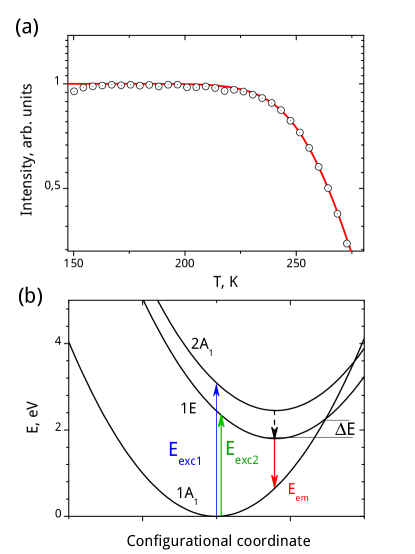
Based on experimental and theoretical results we can construct the simple configurational coordinate diagram of luminescence process in PC(Lu) center (Fig. 4 (b)). In absorption of Lu-doped CaF2, the allowed 1A1E and 1A2A transitions occur at 2.54 and 3.15 eV. Emission should then take place at longer wavelengths because of the expected Stokes shift. Thus, the 1.23 eV luminescence band is candidate for this emission. The absence of fine structure in the absorption (excitation) bands and strong temperature dependence of luminescence imply strong electron-phonon coupling for this transitions. Thermal activation energy of non-radiative intracenter process can be estimated about 0.47 eV. The relative weakness of the 3.15 eV band means a preferential population of the 1E level after excitation into optical absorption band of the PC(Lu) center.
Görlich et al. (1968) observed polarized luminescence of PC(Y) center in Y3+ doped CaF2 and SrF2 crystals. Kötitz et al. (1975) found weak luminescence in CaF2 doped with lanthanum ions related to PC(La) centers. The luminescence was not detected at temperatures higher 40 K for the PC(Y) centers and higher 78 K for the PC(La) centers. That strong temperature dependence can be due to dominating non-radiative mechanism. PC center can be considered as F-like center, therefore Bartram and Stoneham (1975) estimation of the condition for luminescence to be observed is applied:
| (2) |
Here is energy for center of luminescence band and is mean energy for optical absorption.
For PC(Lu) centers we can calculate the ratio from luminescence spectrum in Fig 2. It is approximately equal to 0.25. For PC(Y) and PC(La) centers using data of Görlich et al. (1968) and Kötitz et al. (1975) the ratios are 0.4 and 0.28, respectively.
The value of is the lowest for PC(Lu) center and it demonstrates the brightest luminescence among all investigated PC centers due to lower probability of non-radiative transition. For PC(La) centers non-radiative recombination becomes more probable, however the thermal energy barrier is still high to observe luminescence at 78 K. In the case of PC(Y) centers the value of is the largest, therefore the weak luminescence can be detected only at low temperature. PC(Ce) center has close to PC(La) energies for optical absorption bands, therefore, we can expect that PC(Ce) centers would demonstrate luminescence properties only at about 78 K. For other ”photochromic” impurities the value would be higher and the luminescence observes at lower than 77 K temperatures.
4 Conclusion
We studied optical properties of photochromic centers in lutetium doped CaF2 crystals. The photoluminescence in near IR wavelength range is attributed to photochromic centers. The theoretical calculation shows that excited states of PC(Lu) center have low-lying d orbitals of rare earth ion which overlap the F′-center wave functions. Therefore, the luminescence occurs due to transition from higher energy levels formed by admixture of p-like F′-center wavefunctions and low-lying d orbitals of rare earth ion to slightly disturbed 1s level of F′-center.
Acknowledgments
The authors gratefully acknowledge A. V. Egranov for the fruitful discussions. The work was partially supported by RFBR grants 15-02-06666a and 15-02-06514a. The authors appreciate the use of Blackford computational cluster located at the Institute of System Dynamics and Control Theory SB RAS.
References
- Aldous and Baker (1976) Aldous, R., Baker, J., 1976. Characterization of the photochromic centre in CaF2 using 19F ENDOR. Physics Letters A 57 (1), 85 – 86.
- Alig (1971) Alig, R. C., 1971. Theory of photochromic centers in Ca. Phys. Rev. B 3, 536–545.
- Anderson and Sabisky (1971) Anderson, C. H., Sabisky, E. S., 1971. EPR studies of photochromic Ca. Phys. Rev. B 3, 527–536.
- Bartram and Stoneham (1975) Bartram, R., Stoneham, A., 1975. On the luminescence and absence of luminescence of F centers. Solid State Communications 17 (12), 1593 – 1598.
- Bernhardt et al. (1971) Bernhardt, H., Görlich, P., Kötitz, G., 1971. Foreign ions with d1-states in alkaline earth fluoride crystals. physica status solidi (a) 6 (2), 479–486.
- Bugaenko et al. (2008) Bugaenko, T. Y., Radzhabov, E., Ivashechkin, V., 2008. Thermal decay of photochromic color centers in CaF2, SrF2, and BaF2 crystals doped by La and Y impurities. Physics of the Solid State 50 (9), 1671–1673.
- Egranov et al. (2015) Egranov, A. V., Sizova, T. Y., Shendrik, R. Y., Smirnova, N. A., 2015. Instability of some divalent rare earth ions and photochromic effect. ArXiv e-prints, 1507.04456.
- Frisch et al. (2007) Frisch, M. J., Trucks, G. W., Schlegel, H. B., Scuseria, G. E., et al, 2007. Gaussian 03, Revision C.02. Gaussian, Inc., Wallingford, CT, 2004.
- Görlich et al. (1968) Görlich, P., Karras, H., Kötitz, G., Rauch, R., 1968. Polarized luminescence of X-Irradiated CaF2:Y and SrF2:Y crystals and the structure their luminescence centres. physica status solidi (b) 27 (1), 109–115.
- Kötitz et al. (1975) Kötitz, G., Mothes, H., Persch, G., Rauch, R., Schwotzer, G., 1975. Verfärbung und photoleitfähigkeit reiner und dotierter erdalkalifluoridkristalle. physica status solidi (a) 31 (2), 371–384.
- Mott (1938) Mott, N. F., 1938. On the absorption of light by crystals. Proceedings of the Royal Society of London A: Mathematical, Physical and Engineering Sciences 167 (930), 384–391.
- Myasnikova et al. (2012) Myasnikova, A., Mysovsky, A., Radzhabov, E., 2012. First principle calculation of 4 absorption spectra of Ce3+ and Pr3+ ions in alkaline earth fluorides. Nuclear Science, IEEE Transactions on 59 (5), 2065–2068.
- Myasnikova et al. (2010) Myasnikova, A., Radzhabov, E., Mysovsky, A., 2010. Ab Initio calculation of charge-transfer absorption in CaF2 and SrF2 crystals with Eu3+ and Yb3+ impurities. Nuclear Science, IEEE Transactions on 57 (3), 1193–1195.
-
Mysovsky et al. (2008)
Mysovsky, A., Radzhabov, E., Reichling, M., Sils, J., Shluger, A., Sushko, P.,
2008. Perturbed F-Centres in impurity-containing CaF2 crystals: a
first principle study. Rusian physics journal 10, 180–188.
URL http://medphysics-irk.ru/publ-kef/pdf-radzhabov/2008/Izv-2008-Mys.pdf - Mysovsky et al. (2011) Mysovsky, A. S., Sushko, P. V., Radzhabov, E. A., Reichling, M., Shluger, A. L., 2011. Structure and properties of oxygen centers in CaF2 crystals from ab initio embedded cluster calculations. Phys. Rev. B 84, 064133.
- Sizova and Radzhabov (2012) Sizova, T., Radzhabov, E., 2012. Photochromism in calcium and strontium fluoride crystals doped with rare-earths ions. Nuclear Science, IEEE Transactions on 59 (5), 2098–2101.
- Staebler et al. (1968) Staebler, D., Schnatterly, S., Zernik, W., 1968. Linear dichroism in photochromic CaF2. Quantum Electronics, IEEE Journal of 4 (10), 575–578.
- Staebler and Schnatterly (1971) Staebler, D. L., Schnatterly, S. E., 1971. Optical studies of a photochromic color center in rare-earth-doped Ca. Phys. Rev. B 3, 516–526.
- Sushko et al. (2000) Sushko, P. V., Shluger, A. L., Catlow, C. R. A., 2000. Relative energies of surface and defect states: ab initio calculations for the MgO (001) surface. Surface Science 450 (3), 153–170.