Reconciling the infrared catastrophe and observations of SN 2011fe
Abstract
The observational effects of the ’Infrared Catastrophe’ are discussed in view of the very late observations of the Type Ia SN 2011fe. Our model spectra at 1000d take non-local radiative transfer into account, and find that this has a crucial impact on the spectral formation. Although rapid cooling of the ejecta to a few 100 K occurs also in these models, the late-time optical/NIR flux is brighter by 1-2 magnitudes due to redistribution of UV emissivity, resulting from non-thermal excitation and ionization. This effect brings models into better agreement with late-time observations of SN 2011fe and other Type Ia supernovae, and offers a solution to the long standing discrepancy between models and observations. The models show that spectral formation shifts from Fe II and Fe III at 300d to Fe I at 1000d, which explains the apparent wavelength shifts seen in SN2011fe. We discuss effects of time dependence and energy input from 57Co, finding both to be important at 1000d.
Subject headings:
supernovae: general— supernovae: individual (SN 2011fe) — nucleosynthesis1. INTRODUCTION
The infrared catastrophe (IRC) of Type Ia supernovae (SNe) was predicted already in 1980 by Axelrod (1980). It occurs at 500 days as a result of the change in cooling of the ejecta from transitions in the optical to fine-structure transitions in the mid- and far-infrared. Up to 500 days cooling is dominated by optical/NIR [Fe II-III] lines with excitation temperatures K. As radioactive energy input and temperature decrease, at K the cooling is replaced by mid-IR fine-structure lines with excitation temperatures K. Because the cooling is insensitive to temperature between 500-2000 K, the temperature drops dramatically until the Boltzmann factors for the fine structure lines become effective and the temperature stabilises at a few 100 K. At this point the thermal emission has moved completely to the mid/far-infrared.
Fransson et al. (1996) renewed this calculation, but found a strong discrepancy with the late observations of SN 1972E. Later studies (e.g., Sollerman et al., 2004; Leloudas et al., 2009) confirmed this and did not find much evidence for the IRC from either photometry or spectra. The modeling in these papers was based on the Kozma & Fransson (1998a, b) code, here referred to as the KF98 code. The model light curves predicted large drops in most photometric bands caused by the IRC, in disagreement with observations. The redistribution of radiation caused by the multiple scattering and fluorescence could, however, not be treated.
The nearby Type Ia SNe 2011fe and 2014J offer unique possibilities to study Ia SNe at late times with photometry and spectra up to days. From photometry up to days Kerzendorf et al. (2014) found a decline in the optical broadly consistent with that expected for 56Co decay, with no signs of an IRC.
In Taubenberger et al. (2015, in the following T2015) a spectrum taken at 1034 days was discussed with tentative line identifications. From a comparison with a day spectrum it was clear that the spectrum at this epoch was still dominated by Fe lines, but it was not clear if these were from Fe I or Fe II. This is important as a direct probe of the physical conditions of the ejecta. Graham et al. (2015) present a similar discussion based on a spectrum 981 days after explosion. These late epochs also offer a possibility to test explosion models from their nucleosynthesis, in particular the formation of isotopes such as 57Ni, 55Fe and 44Ti (e.g. Röpke et al., 2012). From photometry of SN 2012cg at years Graur et al. (2015) claim evidence for power input by 57Co, although the absence of spectral modeling makes the bolometric correction uncertain.
In this Letter we discuss a solution of the apparent contradiction between models of the IRC and observations, based on detailed spectral synthesis of realistic explosion models.
2. models
To calculate spectra and light curves we use two different codes. One is based on KF98, updated with extended atomic data. This code includes time dependence and calculates the ionization and temperature of the ejecta, including non-thermal excitations, and local scatterings treated with the Sobolev approximation. This gives an accurate calculation of the temperature and ionization, but does not take into account the multiple scatterings which redistribute UV radiation into optical radiation. As discussed in Jerkstrand et al. (2011), this is important in the phase when non-thermal processes dominate the ionization and excitation.
To treat this we use the code by Jerkstrand et al. (2011) in its latest version (Jerkstrand et al., 2015), here referred to as the JFK11+ code. This treats the combined NLTE and radiative transfer problem for all relevant ions from hydrogen to nickel, but does not include time dependence. These two approaches are therefore complementary.
As input explosion models we study the 1D W7 model by Nomoto et al. (1984) and the N100 3D delayed detonation model by Seitenzahl et al. (2013), which we make a 1D version of. For W7 we use the composition and density structure computed by Iwamoto et al. (1999, their Fig. 14). The ejecta are zoned into 30 (KF98 calculation) and 180 (JFK11+) shells, with the larger number needed to resolve the radiative transfer in the JFK11+ models.
For N100 we map the 3D model to a 1D version with the following recipe, which minimises the microscopic mixing between the major burning zones, in contrast to a straight spherical average at the different radii: For each cell in the 3D model the two most abundant elements are identified. This produces a set of 8 discrete composition classes. For each of these classes the composition is averaged by mass over all cells belonging to that class. The ejecta are then divided into shells in velocity up to , with 40 shells for KF98 and 240 shells for JFK11+. For each radial shell the two composition classes with the highest mass within that velocity range in the 3D model are identified, and the shell is split into two equal-density subshells with corresponding compositions and relative masses (more massive innermost). Compared to the original N100 model it conserves the total elemental masses at , with exception of 58Ni, with a total mass , compared to in the original model. This is a consequence of using only two composition zones per radial shell.
Radioactive input (gamma-rays, leptons and X-rays) from 56Ni, 57Ni and 44Ti and their daughter isotopes are included (e.g., Seitenzahl et al., 2009). At 1000 days 56Ni and 57Ni contribute roughly equal to the deposition, depending on the exact 57Ni mass. The 56Ni mass is in W7 and in N100, within the observed range for SN 2011fe, (Pereira et al., 2013). There is no independent observational constraint on the 57Ni mass. The delayed detonation models by Seitenzahl et al. (2013) have , with N100 at , while W7 has (Iwamoto et al., 1999).
3. Results
In the upper panel of Fig. 1 we show the temperature of typical composition zones of the W7 ejecta as function of time for the KF98 model. The temperature in all cases shows a drop from K to K. The epoch when this occurs differs from 400 to 800 days, depending on the composition. The C/O zone is cooling more slowly than the others, but reaches the lowest temperatures after 1000 days. This is a combination of low density, higher ionization and low cooling efficiency of the abundant ions. The cooling is here dominated by [C II] 157.7m and [O III] 88.34m (excitation temperatures 91 K and 164 K, respectively), while the Si and Fe rich zones cool by fine-structure lines of higher energy, 410 K and 553 K for [Si II] 34.81m and [Fe II] 25.99m, respectively. The cooling of these zones therefore drops at higher temperature compared to the C/O zone.
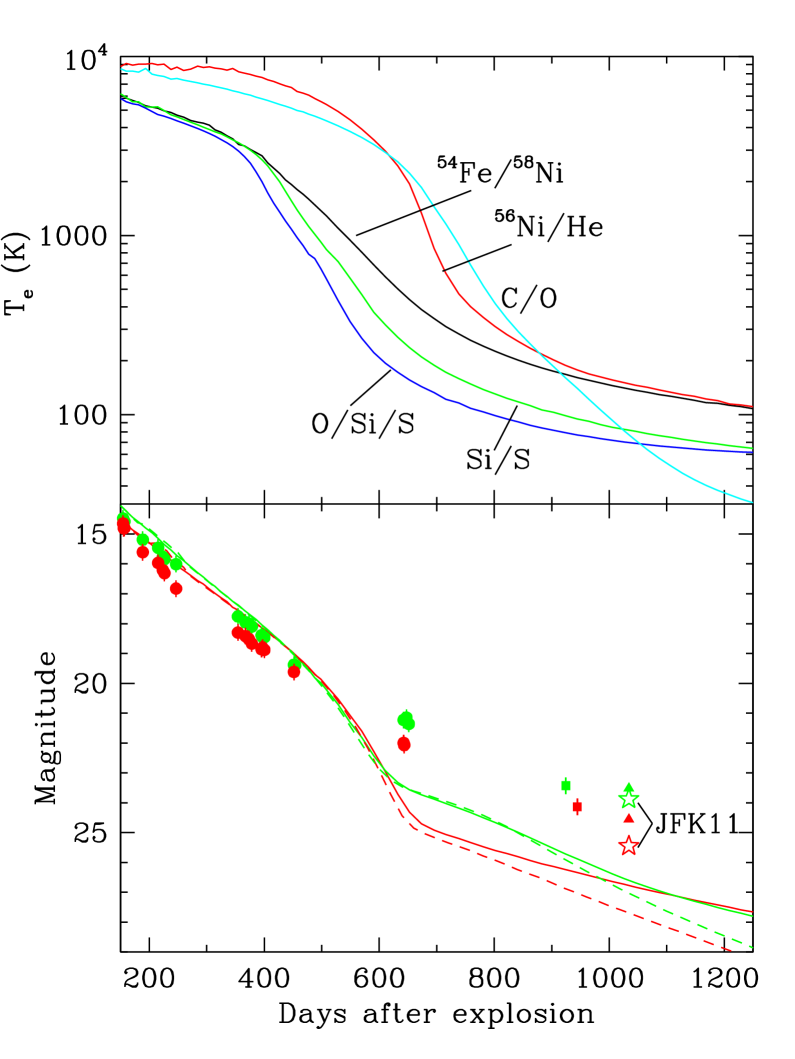
In the lower panel of Fig. 1 we show the V and R band light curves of the W7 model with the KF98 code. The IRC is here seen as the drop at days in both bands. A comparison with the magnitudes of Tsvetkov et al. (2013) and Kerzendorf et al. (2014) of SN 2011fe clearly shows the discrepancy after the IRC.
To demonstrate the importance of the radiative transfer treatment and the UV to optical conversion we show in Fig. 2 the W7 spectrum from UV to NIR, with and without non-local radiative transfer using the JFK11+ code.
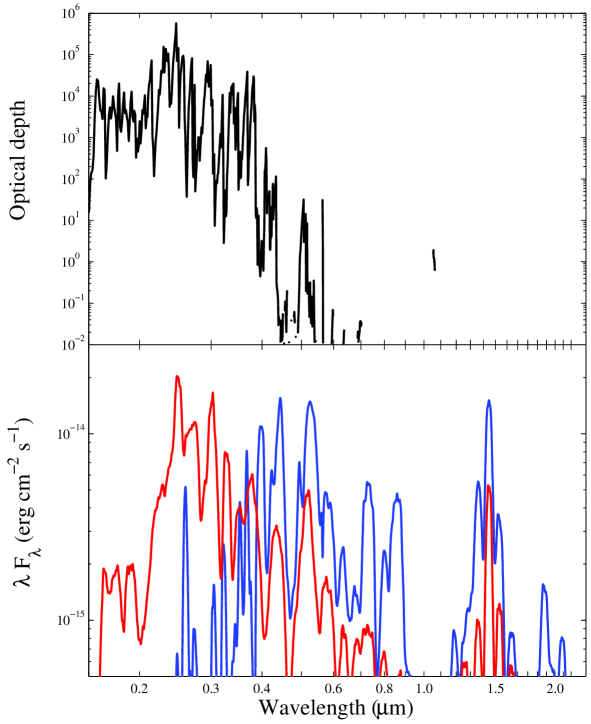
Without non-local radiative transfer we see extremely strong UV lines below Å, mainly resulting from non-thermal ionizations to Fe II and Fe III, followed by recombinations in the UV, as well as excitations of Fe I-II. In particular, of all Fe I excitations occur in a single transition, at Å, followed mainly by the emission of lines at 2999.5 Å and m. The latter dominates the NIR range (Fig. 2) and the non-thermal scenario may be tested by searching for this signature in SN 2014J. The optical/NIR luminosity is low, as most non-thermal excitation and ionizations lead to UV emission.
Including non-local scattering and fluorescence the forest of optically thick lines (upper panel of Fig. 2 ) decreases the UV flux below 4000 Å by a factor 5.7, while the flux between 4000 - 10000 Å and between m increases by factors 3.4 and 3.2, respectively. Both multiple scatterings and fluorescence contribute to transferring the UV emissivity to optical and NIR flux. For example, [Ca II] 7300 Å and the Ca II triplet are both powered by fluorescence following absorptions in the H and K lines.
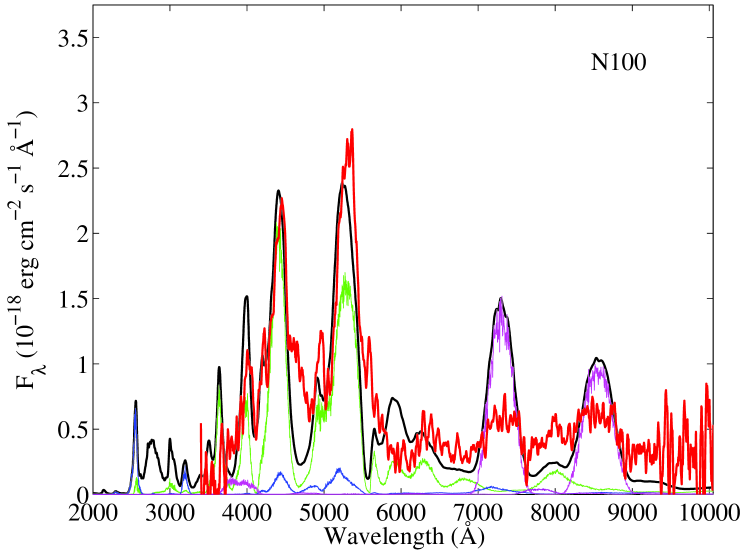
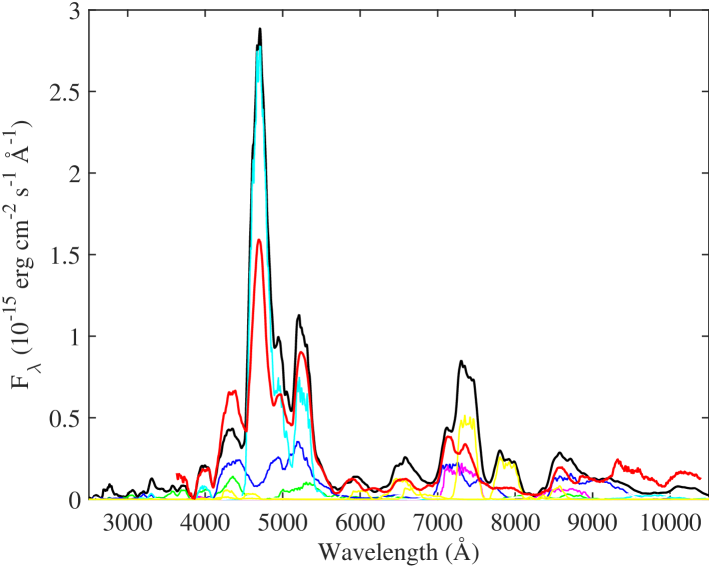
In Fig. 3 we show the observed spectrum of SN 2011fe together with the W7 and N100 spectra at 1034d calculated with the JFK11+ code. The models have been multiplied by a factor of 2, a correction still needed to match the optical luminosity. As we discuss later, this can plausibly be attributed to some combination of too low 57Ni mass in the W7 model and lack of freeze-out in the JFK+11 code.
The spectrum is dominated by Fe I lines as well as [Ca II] and the Ca IR triplet. In T2015 the feature at Å was interpreted as either [O I] or [Fe I] . In our synthetic spectra of both W7 and N100 it is dominated by Fe I, with some contribution of Si I-II in N100. There is therefore no need for any low velocity oxygen. The feature at Å is a mix of Na D and Fe I in N100. Unfortunately, Na is missing in the unburned high velocity region in W7, although already Fe I alone tends to overproduce this.
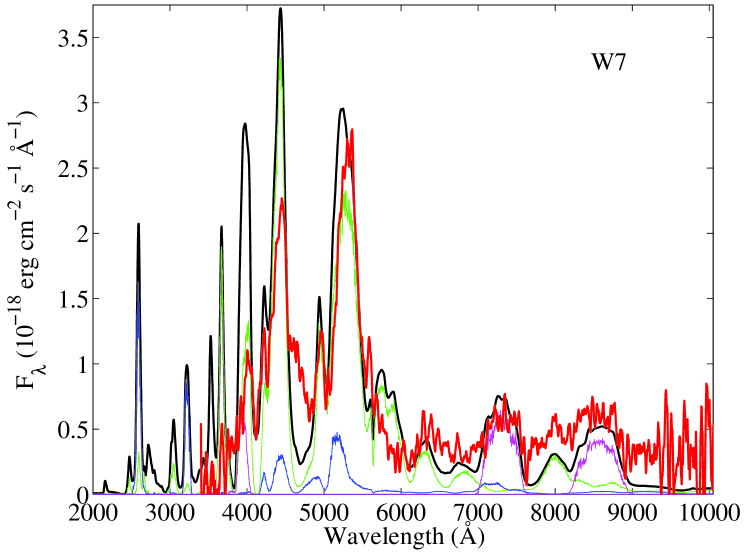
Calculating synthetic photometry for these spectra we find that the g and r band discrepancies between the photometry from the T2015 spectrum and the W7 model decrease from 3.0 mag and 2.2 mag in the KF98 models to 0.36 mag and 0.89 mag, respectively, in the JFK11+ model (not including the factor 2 scaling in Fig. 3) We note that the g-band contains most of the optical flux. Given the uncertainties discussed below, we thus find a resolution to the long-standing problem of the IRC not being observed in Type Ia supernovae: The omission of non-local radiative transfer effects in previous models seriously underestimates the optical/NIR flux at days.
We also note that the features at Å and Å are well reproduced in wavelength, and there is no need for any ejecta asymmetry, as was suggested in T2015 from a comparison with the 300 day spectrum. This is a consequence of the shift from a Fe II-III dominated spectrum to one dominated by Fe I.
There are many similarities of the 1000 days spectrum here to the conditions at years in the Fe-core of SN 1987A, discussed by Jerkstrand et al. (2011). The densities are similar, , and the dominant excitation and ionization is by leptons from the radioactive decays. Most of this energy is deposited in the iron rich regions in the core, resulting in Fe I dominated spectra. From Jerkstrand et al. (2011, Fig. 6 ) one can see that the emissions following non-thermal excitations and ionizations below Å escapes in line gaps longwards of Å.
Because of the low temperature, thermal, collisional processes are not important at this epoch, with the exception of the mid/far-IR fine-structure lines, which account for of the energy output (see below). This energy emerges mainly in [Fe II] m, and weaker [Fe III] m, [Fe I] m, [Si II] m and [Fe II] m. This part of the spectrum is unaffected by scattering.
The main discrepancy in our modeling are the general level of the optical flux, which is a factor of fainter than observed. In N100 there are also significant differences in the line ratios, in particular the ratio of the Ca II lines to the Fe I 4300, 5200 Å multiplets. In the W7 model there are also too strong line features at 2600, Å and at Å. There are, however, several factors which may contribute to these shortcomings.
An important factor is the quality of atomic data, especially for Fe I, where most excitation cross sections by non-thermal electrons are missing. Instead, we use the Bethe approximation, which is reasonable at high energy for permitted lines, but less accurate at low energies. Fortunately, most excitations go to permitted transitions.
Recombinations to both Fe I and Fe II are responsible for a comparable flux to the excitations. Rates have been calculated for a large number of specific levels (Nahar et al., 1997), but half of the total rate is to higher levels, and is in our model atom distributed among the highest levels according to statistical weights, introducing an uncertainty in individual lines.
Uncertainty in the explosive burning conditions is associated with at least a factor 2 uncertainty in the 57Ni mass, which accounts for of the energy input at this epoch. The density distribution at high velocity also shows a large variation between different models. An underestimate of the ’Fe’ abundances and/or the density at high velocities results in an underestimate of the UV-scattering, which may be the reason for the model overproduction of lines below Å.
The most important factor is probably the steady state assumption in the JFK11+ models. Because of the low density the balance between heating and cooling, as well as between ionization and recombination, may break down, usually known as ’freeze-out’ (Fransson & Kozma, 1993). From a comparison of a steady-state and a fully time-dependent calculation of the W7 model with the KF98 code, we find that later than days time dependent effects become increasingly important (Fig. 1). This leads to an underestimate of the flux by 0.35 and 0.86 mags in the V and R bands respectively at 1000 days in the steady-state compared to the time dependent case. We note the larger difference in the R-band, as is also seen for the JFK11+ model when compared to observations.
Taking these uncertainties and especially the freeze-out, into account, the model provides a satisfactory reproduction of the main properties of the 1034 day spectrum and photometry.
As a further test we show in Fig. 4 the JFK11+ model for W7 at 331d, compared with observations from T2015. In general, there is agreement between the model and the strongest features. The optical spectrum at this epoch is mainly dominated by blends of [Fe II-III] and weaker features of Ca II and [Ni II]. The overproduction of the [Ni II-III] lines between 6000-8200 Å indicates that W7 contains too much stable Ni. The analysis by Mazzali et al. (2015) also favoured relatively small amounts of stable nickel in the ejecta. The too strong Fe III multiplet at Å suggests a too high ionization of the ejecta. Despite these shortcomings the model can qualitatively reproduce the spectrum showing that one and the same model works at both 300d and 1000d.
4. Discussion
After the IRC, the temperature is far too low for thermal excitations of anything except for the mid/far-IR fine structure lines. Because of the concomitant decrease in the ionization an increasing fraction of the energy goes into non-thermal excitations and ionizations rather than heating (Kozma & Fransson, 1992). Recombinations, following the non-thermal ionizations to Fe II, are mainly to high-excitation levels of Fe I. This is also the case for the excitations, where the high-lying permitted transitions have the largest cross sections for the non-thermal electrons and positrons. Therefore both these processes result in populations of primarily high levels, which de-excite by permitted transitions in the UV.
In Fig. 5 we show the change of ionization with density at 1000 days for a model where we calculate the state of ionization and energy deposition for a pure iron plasma, but ignore all radiative transfer effects and only include cooling by the [Fe I-II] fine-structure lines. Because photoionizations are not included the degree of ionization may be somewhat underestimated, but the qualitative features should be correct. We assume M(56Ni) and M(57Ni) and constant energy input per unit mass. Gamma-rays are neglected, but make only a minor contribution.
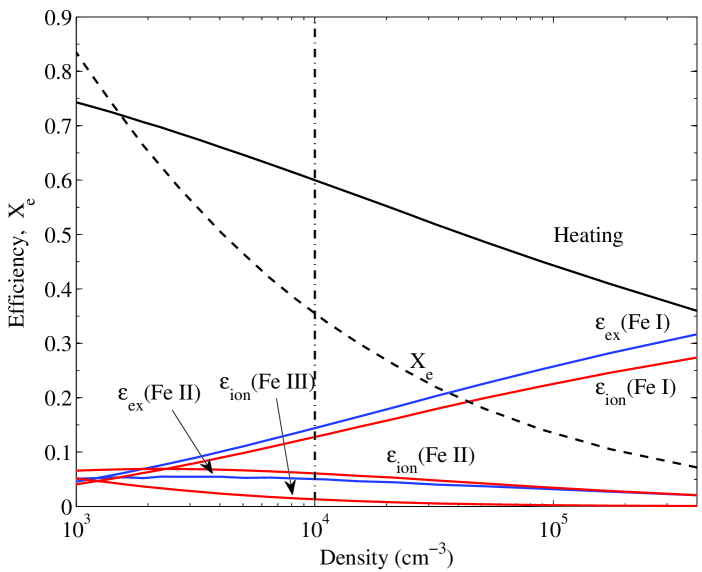
From this we see that in the range the electron fraction, , varies from to . Because the densities below vary between to in the explosion models (for no clumping), the dominance of Fe I features should be a robust result at these epochs. There is simply not enough radioactive power to maintain a higher ionization state. Between the heating efficiency varies between . Because the local ionization is roughly , where is the initial abundance of the radioactive 56Ni and 57Ni isotopes, depends on the density where the radioactive isotopes are abundant, which differs between different explosion models. With the JFK11+ code the deposition weighted heating efficiencies are for W7 and for N100.
Because the fraction going into heating is emitted as mid/far-IR radiation, while the rest is converted to optical/NIR emission, an increase in the ionization and excitation efficiency with density can have a strong effect on the optical flux. Clumping could increase the optical flux of our models and help alleviate the discrepancy with the observations (Kozma et al., 2005; Leloudas et al., 2009).
5. Conclusions
In this Letter we have studied the importance of radiative transfer in the nebular phase of Type Ia SNe. Without non-local radiative transfer, only of the deposited energy emerges in the optical/NIR at 1000d, the rest being in the MIR () and UV (). Non-local scattering and fluoresence, however, converts most of the UV flux into the optical/NIR, raising this by a factor to . Because of the dominance of non-thermal processes and the UV to optical conversion there is therefore no contradiction between the drop in temperature caused by the IRC and a sustained optical flux roughly consistent with the radioactive decay. Between of the non-thermal deposition still goes to heating leading to mid-IR line cooling, in particular by [Fe II] m. With this model improvement, we find a good general reproduction of the spectrum of SN 2011fe at 1000 days with a spectrum dominated by Fe I, which explains the ’shift’ of some lines at this epoch compared to the thermally dominated Fe II-III spectrum at 300 days, discussed by T2015.
We also find a strong need of radioactive input from 57Co at days. Without this the optical spectrum would be underproduced by a factor , compared to the factor in our models, which include of 57Ni. A 57Ni input at this level together with the freeze-out effects appears to be necessary to give the observed optical flux level at this late epoch.
References
- Axelrod (1980) Axelrod, T. S. 1980, PhD thesis, California Univ., Santa Cruz.
- Fransson et al. (1996) Fransson, C., Houck, J., & Kozma, C. 1996, in IAU Colloq. 145: Supernovae and Supernova Remnants, ed. T. S. Kuhn, 211
- Fransson & Kozma (1993) Fransson, C., & Kozma, C. 1993, ApJ, 408, L25
- Graham et al. (2015) Graham, M. L., Nugent, P. E., Sullivan, M., et al. 2015, arXiv:1502.00646
- Graur et al. (2015) Graur, O., Zurek, D., Shara, M. M., & Riess, A. G. 2015, ArXiv e-prints 1505.00777
- Iwamoto et al. (1999) Iwamoto, K., Brachwitz, F., Nomoto, K., et al. 1999, ApJS, 125, 439
- Jerkstrand et al. (2015) Jerkstrand, A., Ergon, M., Smartt, S. J., et al. 2015, A&A, 573, A12
- Jerkstrand et al. (2011) Jerkstrand, A., Fransson, C., & Kozma, C. 2011, A&A, 530, A45
- Kerzendorf et al. (2014) Kerzendorf, W. E., Taubenberger, S., Seitenzahl, I. R., & Ruiter, A. J. 2014, ApJ, 796, L26
- Kozma & Fransson (1992) Kozma, C., & Fransson, C. 1992, ApJ, 390, 602
- Kozma & Fransson (1998a) Kozma, C., & Fransson, C. 1998, ApJ, 496, 946
- Kozma & Fransson (1998b) —. 1998, ApJ, 497, 431
- Kozma et al. (2005) Kozma, C., Fransson, C., Hillebrandt, W., et al. 2005, A&A, 437, 983
- Leloudas et al. (2009) Leloudas, G., Stritzinger, M. D., Sollerman, J., et al. 2009, A&A, 505, 265
- Mazzali et al. (2015) Mazzali, P. A., Sullivan, M., Filippenko, A. V., et al. 2015, MNRAS, 450, 2631
- Nahar et al. (1997) Nahar, S. N., Bautista, M. A., & Pradhan, A. K. 1997, ApJ, 479, 497
- Nomoto et al. (1984) Nomoto, K., Thielemann, F.-K., & Yokoi, K. 1984, ApJ, 286, 644
- Nugent et al. (2011) Nugent, P. E., Sullivan, M., Cenko, S. B., et al. 2011, Nature, 480, 344
- Pereira et al. (2013) Pereira, R., Thomas, R. C., Aldering, G., et al. 2013, A&A, 554, A27
- Röpke et al. (2012) Röpke, F. K., Kromer, M., Seitenzahl, I. R., et al. 2012, ApJ, 750, L19
- Seitenzahl et al. (2009) Seitenzahl, I. R., Taubenberger, S., & Sim, S. A. 2009, MNRAS, 400, 531
- Seitenzahl et al. (2013) Seitenzahl, I. R., Ciaraldi-Schoolmann, F., Röpke, F. K., et al. 2013, MNRAS, 429, 1156
- Shappee & Stanek (2011) Shappee, B. J., & Stanek, K. Z. 2011, ApJ, 733, 124
- Sollerman et al. (2004) Sollerman, J., Lindahl, J., Kozma, C., et al. 2004, A&A, 428, 555
- Taubenberger et al. (2015) Taubenberger, S., Elias-Rosa, N., Kerzendorf, W. E., et al. 2015, MNRAS, 448, L48 (T2015)
- Tsvetkov et al. (2013) Tsvetkov, D. Y., Shugarov, S. Y., Volkov, I. M., et al. 2013, Contributions of the Astronomical Observatory Skalnate Pleso, 43, 94