Ultraviolet emission lines of Si ii in cool star and solar spectra
Abstract
Recent atomic physics calculations for Si ii are employed within the Cloudy modelling code to analyse Hubble Space Telescope (HST) STIS ultraviolet spectra of three cool stars, Geminorum, Centauri A and B, as well as previously published HST/GHRS observations of Tau, plus solar quiet Sun data from the High Resolution Telescope and Spectrograph. Discrepancies found previously between theory and observation for line intensity ratios involving the 3s23p 2PJ–3s3p2 4P intercombination multiplet of Si ii at 2335 Å are significantly reduced, as are those for ratios containing the 3s23p 2PJ–3s3p2 2D transitions at 1816 Å. This is primarily due to the effect of the new Si ii transition probabilities. However, these atomic data are not only very different from previous calculations, but also show large disagreements with measurements, specifically those of Calamai et. al. (1993) for the intercombination lines. New measurements of transition probabilities for Si ii are hence urgently required to confirm (or otherwise) the accuracy of the recently calculated values. If the new calculations are confirmed, then a long-standing discrepancy between theory and observation will have finally been resolved. However, if the older measurements are found to be correct, then the agreement between theory and observation is simply a coincidence and the existing discrepancies remain.
keywords:
atomic processes, Sun: UV radiation, stars: late-type1 INTRODUCTION
Emission lines involving transitions in Si ii are important diagnostics for astrophysical plasmas, with several intensity ratios being sensitive to temperature and density variations (Dufton & Kingston, 1985; Judge et al., 1991; Keenan et al., 1992). Over the past 40 years there have been many calculations of Si ii transition probabilities and electron impact excitation rates by several authors (Nussbaumer, 1977; Dufton & Kingston, 1991; Nahar, 1998; Tayal, 2008), which have been subsequently employed in modelling codes to predict theoretical line intensities for different types of plasma. However, discrepancies between observation and theory found in early studies of the Sun and other late-type stars remain unresolved. For example, Dufton et al. (1991) investigated the 3s23p 2PJ–3s3p2 4P intercombination multiplet at 2335 Å in the Skylab spectra of the Sun and International Ultraviolet Explorer (IUE) observations of several late-type stars. They noted that, in previous studies, observed line ratios involving these lines lay well outside the range of theoretical values, and indeed beyond the high density limit. This limit depends on the transition probabilities rather than the collisional rates, and hence Dufton et al. (1991) suggested that the discrepancies must be due to errors in the former. Although the transition probabilities calculated by Dufton et al. improved agreement between theory and observation, significant discrepancies remained.
Similarly, Judge et al. (1991) undertook an observational study of Si ii emission line intensity ratios in a range of astronomical sources, including the Sun, several late-type stars and the slow nova RR Telescopii. In particular, they analysed a high signal-to-noise, high resolution spectrum of Tau, obtained with the Goddard High Resolution Spectrograph (GHRS) on the Hubble Space Telescope (HST). These authors once again found discrepancies between theory and observation for line ratios involving the 2335 Å multiplet, which they attributed in part to blending of the Si ii lines with Ni ii transitions. However, they also suggested that the discrepancies may be partly due to errors in the adopted electron impact excitation rates, in contrast to the findings of Dufton et al. (1991).
In the present paper we use recent calculations of atomic data for Si ii by Aggarwal & Keenan (2014) in the modelling code Cloudy (Ferland et al., 1998; Ferland et al., 2013) to analyse emission lines in a representative set of ultraviolet spectra of late-type stars and the Sun, to investigate if the discrepancies between theory and observation can be resolved. Specifically, we examine very high quality datasets for three cool stars, Geminorum ( Gem), Centauri A ( Cen A) and B ( Cen B), obtained with the Space Telescope Imaging Spectrograph (STIS) on HST as part of the ASTRAL HST Large Treasury Project (Ayres 2013). The paper is organised as follows. Section 2 contains a description of the observations, while Section 3 discusses how we have updated the Cloudy database with the most recent Si ii atomic physics calculations. In Section 4 we compare the observations with both Cloudy simulations and also those generated with CHIANTI, and summarise our conclusions.
2 OBSERVATIONAL DATA
The main focus of our study are the three cool stars Gem, Cen A and B from the ASTRAL HST Large Treasury Project (Ayres, 2013). This project is aimed at collecting high signal-to-noise, high spectral resolution ultraviolet spectra for a representative sample of late-type (and subsequently early-type) stars. Observations were obtained with STIS, covering both the FUV (1150–1700 Å) and NUV (1600–3100 Å) prime grating settings, at a resolution of R = 100,000, apart from the 1700–2150 Å region which is at R = 30,000. For comparison, we note that the resolution of the HST/GHRS spectrum of Tau analysed by Judge et al. (1991) was only R = 24,000. Our choice of these stars for the Si ii analysis is due to the fact that they show comparatively narrow unblended emission lines, suitable for the accurate determination and investigation of line fluxes. A detailed description of the ASTRAL data processing and calibration may be found in Ayres (2010, 2013), while further information on the project is available at its website.111http://casa.colorado.edu/ayres/ASTRAL/
We also study some previously published Si ii measurements, namely those for the quiet Sun obtained by the HRTS experiment during a sounding rocket flight, which recorded the 1185–1730 Å solar spectral region on photographic emulsion at a resolution of R 30,000 (Keenan et al., 1992). In addition, we re-examine the HST/GHRS spectra of the K5 III star Tau, originally analysed by Judge et al. (1991), which spans the 2320–2368 Å region at a resolution of R = 24,000. Further details of the solar and Tau observations may be found in Keenan et al. (1992) and Carpenter et al. (1991), respectively.
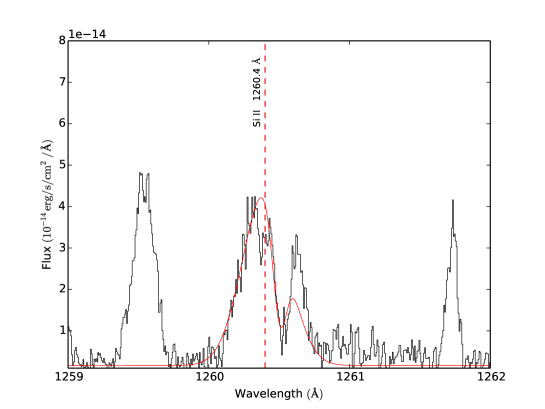
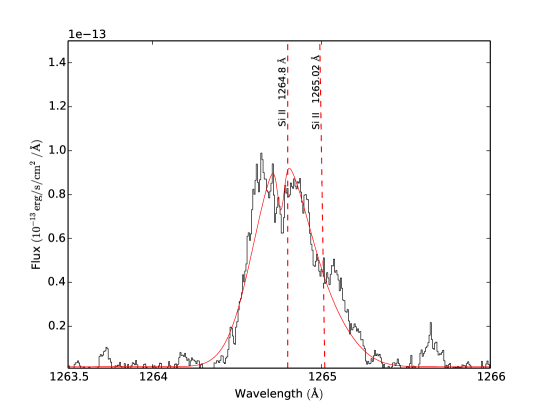
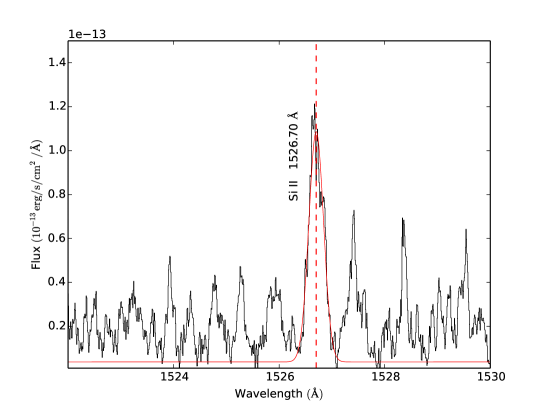
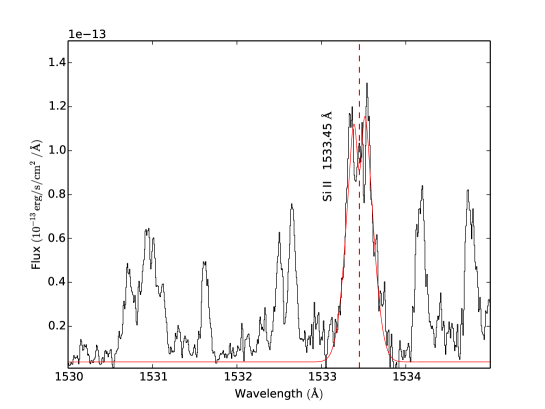
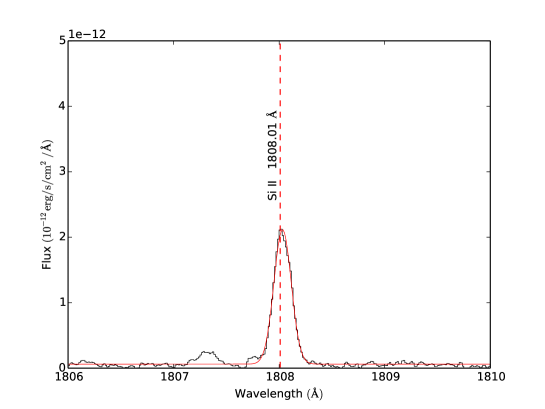
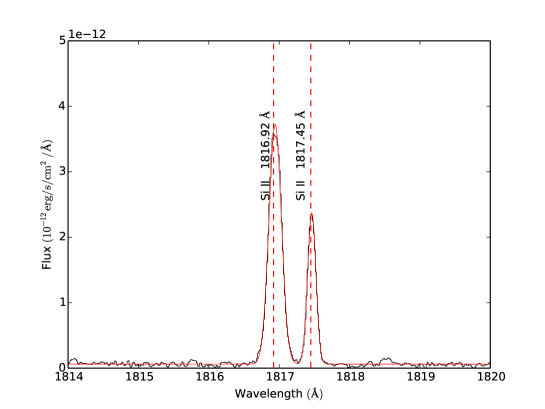
In Table 1 we list the Si ii transitions investigated, where we note that vacuum wavelengths are employed throughout this paper as the HST data are processed using these to avoid a discontinuity at 2000 Å between vacuum and air wavelengths. After fitting the local continuum with a polynomial, we have used a Gaussian profile to model the emission lines. In most cases a Gaussian provides a good fit to the emission feature, but in some instances (particularly shortward of 1800 Å) the Si ii lines show central reversals. These can arise due to chromospheric absorption from the same star or from the intervening interstellar medium.
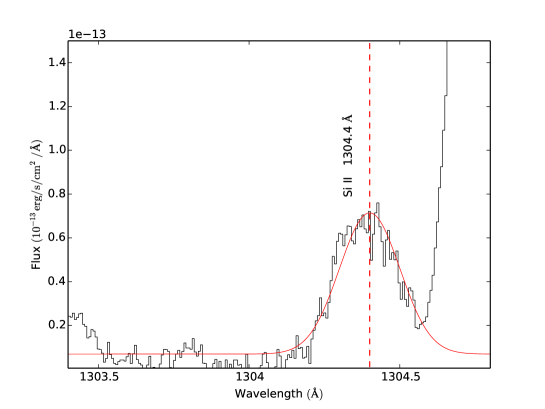
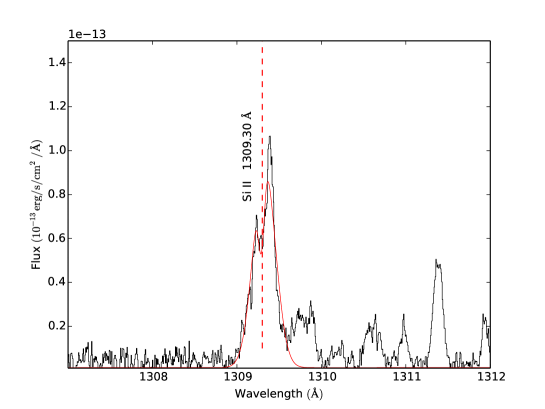
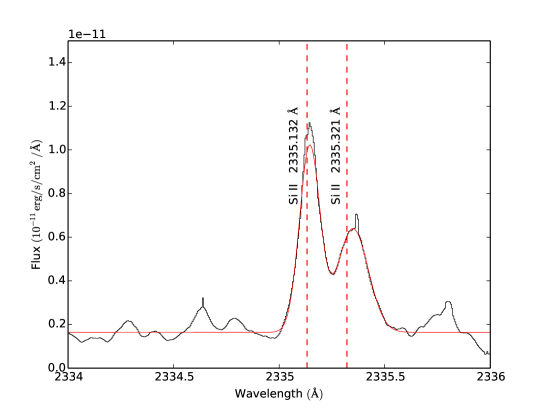
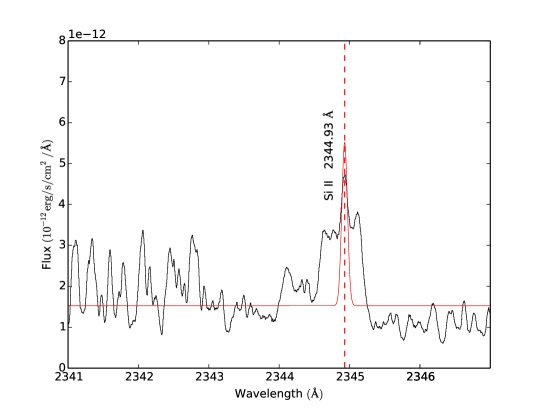
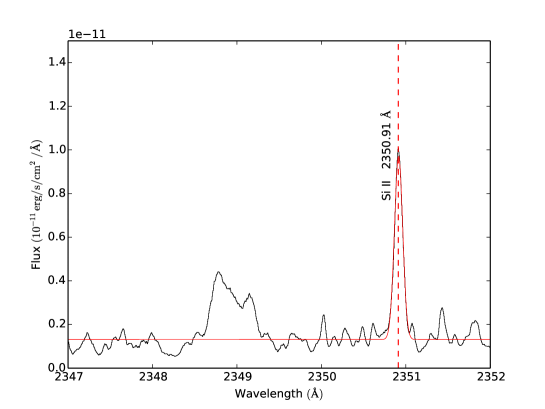
In Figures 1-6 we plot portions of the Gem spectrum containing Si ii emission lines, along with the best-fit Gaussian profiles to the observations, to illustrate the quality of the observational data. As noted above, in some instances there are reversals in the line cores, resulting in an intensity dip. In these cases we fitted the dip in the line profile with an inverted Gaussian as well as the standard one to correct for the reduction in line intensity arising from the dip. The results of the line profile fitting, including measured line wavelengths, widths and intensities, are summarised in Tables 2 and 3. However, for conciseness we only provide wavelengths and widths for Gem (in Table 2). The errors in the line intensities listed in Tables 2 and 3 were derived from a Monte-Carlo simulation of the measurement process given the assigned photometric error, and are hence lower limits to the true uncertainties. In some cases, such as for the Si ii 2344.92 Å line in Gem, the error may be dominated by systematic uncertainties, for example how to treat local blending. We note that for Cen A, intensities are only reported for Si ii features shortward of 1800 Å, because the photospheric continuum emission overwhelms weak lines (including those of Si ii ) at longer wavelengths. Below we discuss each of the Si ii multiplets separately.
-
•
1260 Å: (Figure 1). There are three emission lines observed in this multiplet (1260.42, 1264.73, 1265.02 Å), all of which show central reversals and have complex profiles. The intensity of 1260.42 Å has been measured by numerical integration of the blue half of the line profile (which is least affected by central reversal), and then doubled to obtain the total line flux. In Figure 1 we plot the 1260.42 Å feature fitted with two Gaussian profiles, where the negative Gaussian models the central reversal. The lines at 1264.73 and 1265.02 Å are blended, and we have used two Gaussian profiles to model these, with the central reversal in the former fitted using a negative Gaussian.
-
•
1304 Å: (Figure 2). Both the lines in this multiplet (1304.37, 1309.28 Å) are slightly broader than the instrument resolution. There is a very strong O i line at 1304.87 Å. The Si ii line at 1309.28 Å shows prominent central reversal which was modelled using a negative Gaussian profile.
-
•
1526 Å: (Figure 3). Both the lines in this multiplet (1526.70, 1533.40 Å) are broader than the instrument resolution.
-
•
1808 Å: (Figure 4). The three lines observed in this multiplet (1808.01, 1816.93, 1817.45 Å) are narrow and unblended.
-
•
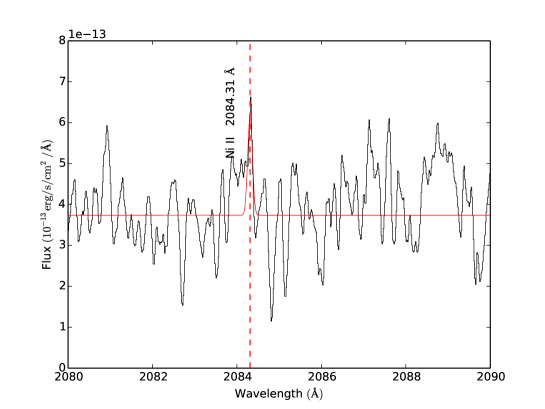
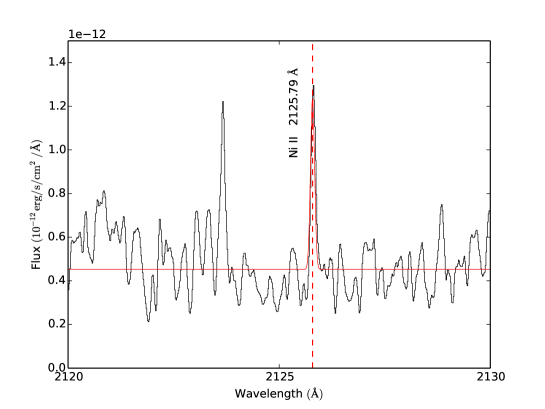
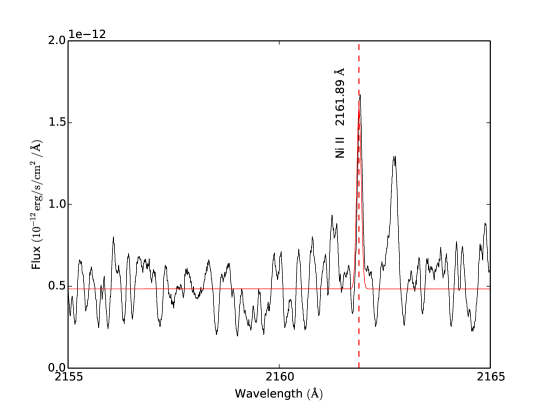
2335 Å: (Figures 5 and 6). There are four observed lines in this multiplet (2335.12, 2335.32, 2344.92, 2350.89 Å), with the 2329.23 Å transition not detected due to its very small A-value and hence predicted intensity. The Si ii 2335.32 Å line is blended with Ni ii 2335.30 Å. However, Carpenter et al. (1988) note that the Ni ii line is in fact radiatively pumped by the Si ii transition, as fluorescence emission is detected in another Ni ii feature at 2416.87 Å. Hence, as noted by Judge et al. (1991), the photons observed in the Ni ii 2416.87 Å line must actually be Si ii photons and the intensities of the Ni ii and Si ii transitions need to be added. Furthermore, Judge et al. (1991) pointed out that the pumped Ni ii level also gives rise to additional lines at 2084.31, 2125.79 and 2161.89 Å. Unfortunately, the spectra analysed by Judge et al. (1991) could not observe these three lines as they were outside the wavelength range of the HST/GHRS observations, and the IUE detectors were insensitive at these wavelengths. These authors hence had to calculate their contribution to the Si ii 2335.32 Å line flux. However, the STIS spectra for our cool star sample do contain these Ni ii features, along with the 2416.87 Å line, as may be seen in Figures 7–10 for Gem. Their measured wavelengths, widths and intensities are summarised in Table 2 for Gem, while line intensities are listed for Cen B in Table 3. We note that Judge et al. calculate the ratio of the total intensity of the three additional Ni ii lines to that of the 2416.87 Å feature to be 1.1, while from our STIS observations we find this ratio to be 1.1 for Gem and 0.48 for Cen B.
The resultant Si ii line intensity ratios from the Gem, Cen A and B observations are listed in Table 4, where we note that the Ni ii line fluxes have been added to that for Si ii 2335.32 Å in the determination of the 2335.32/2350.89 ratio. In Table 5 we provide some additional measurements of Si ii line ratios for Tau from the HST/GHRS observations of Judge et al. (1991), and HRTS quiet Sun data from Keenan et al. (1992).
3 THEORETICAL LINE RATIOS
We have undertaken several Si ii line intensity ratio calculations using the Cloudy modelling code with two sets of atomic data, to investigate the importance of adopting different atomic physics parameters on the theoretical results. All three Cloudy models generated consist of the energetically-lowest 148 fine-structure levels, with the energies taken from the NIST database222http://www.nist.gov/pml/data/asd.cfm as at 2015 August 8. The first atomic model, denoted CLOUDY1, employs the experimental A-values of Calamai et al. (1993) for the 3s23p 2PJ–3s3p2 4P intercombination lines, and the calculations of Nahar (1998) for the remaining transitions, plus the new Si ii electron impact effective collision strengths (ECS) of Aggarwal & Keenan (2014), which are not too different from the ECS data of Dufton & Kingston (1994) adopted in earlier versions of Cloudy. In the second atomic model, CLOUDY2, the A-values for transitions among the lowest 56 fine-structure levels are replaced by the calculations of Aggarwal & Keenan (2014), which in many instances show large discrepancies with the results of Calamai et al. (1993) and Nahar (1998). We have also calculated Si ii line ratios with the CHIANTI atomic database version 7.1.4 (Dere et al., 1997; Landi et al., 2013), which employs the A-value calculations of Tayal (2007), Nahar (1998) and Nussbaumer (1977), plus ECS from Tayal (2008). The Calamai et al., Tayal (2008), Nahar and Aggarwal & Keenan atomic data for the Si ii lines discussed in the present paper are summarised in Table 1 for comparison purposes. The CLOUDY1, CLOUDY2 and CHIANTI models were calculated for optically thin plasma conditions, and hence for completeness we have produced an additional Cloudy model, CLOUDY3, which uses the same atomic data as CLOUDY2 but calculates line ratios for an optically thick plasma, specifically a uniform slab with a total hydrogen column density of 1023 cm-2.
4 RESULTS AND DISCUSSION
In Table 4 we summarise the observed Si ii emission line intensity ratios for Gem, Cen A and B, along with theoretical optically thin values from the CHIANTI, CLOUDY1 and CLOUDY2 models calculated at an electron temperature Te = 7000 K and density Ne = 109.5 cm-3, typical of the physical conditions found in the line-forming regions of chromospheres in late-type giant stars (Judge, 1986a, b). For the CLOUDY2 model we also list theoretical ratios at Ne = 108.5 and 1010.5 cm-3, to show their sensitivity to the adopted electron density. (We note that the ratios do not vary significantly with temperature). In addition, results are presented for an optically thick plasma (CLOUDY3 model) to allow the effect of opacity on the results to be assessed, in particular for ratios involving strong allowed lines.
Similarly, in Table 5 we list observed line ratios for Tau from the HST/GHRS observations of Judge et al. (1991), plus HRTS quiet Sun data from Keenan et al. (1992). In addition we provide CHIANTI, CLOUDY1, CLOUDY2 and CLOUDY3 model results, calculated at the same plasma parameters for Tau as for the other cool stars, i.e. Te = 7000 K and Ne = 109.5 cm-3, as the former is also a late-type giant. For the quiet Sun we have generated theoretical ratios at Te = 7000 K and Ne = 1011 cm-3 (Dufton & Kingston 1983), but note that the ratios considered in Table 5 are insensitive to the adopted plasma parameters.
The first point to note from an inspection of Tables 4 and 5 is that the theoretical line ratios from the CHIANTI and CLOUDY1 models do not in general differ significantly, with discrepancies of typically only 11%. As the major difference between these models is the adoption of the new Aggarwal & Keenan (2014) ECS in the CLOUDY1 calculations, we can state that use of the Aggarwal & Keenan (2014) data does not significantly change the resultant Si ii line ratios, at least for those involving the ultraviolet transitions considered in the present paper. This is perhaps not surprising, as the Aggarwal & Keenan (2014) ECS are in generally good agreement with previous results, as shown in Table 1 for the Tayal (2008) data.
However, the situation is very different when the new A-value calculations of Aggarwal & Keenan (2014) are incorporated in plasma models, with the CLOUDY2 line ratios showing large discrepancies in some instances with the CHIANTI and CLOUDY1 results. In particular, the 1808.01/1817.45 ratio (3s23p 2P–3s3p2 2D transitions) and those involving the intercombination multiplet lines around 2335 Å (3s23p 2P–3s3p2 4P) in the CLOUDY2 calculations are up to a factor of 7 smaller than the CHIANTI and CLOUDY1 data. This is due to the A-values of Aggarwal & Keenan (2014) for the corresponding transitions similarly being much lower than those of Nahar (1998), by more than an order of magnitude in some cases (see Table 1). Aggarwal & Keenan discuss their calculations in great detail, and compare these with previous results. They estimate their A-values to be generally accurate to 20%, although this only applies to strong allowed transitions. For weaker ones, such as the 1808 and 2335 Å multiplet lines, the errors are likely to be larger and are very difficult to quantify, as discussed by Aggarwal & Keenan. It is unclear why there are large discrepancies between the Aggarwal & Keenan data and the theoretical work of Nahar (1998), and more importantly between the former and the experimental values of Calamai et al. (1993) for the 3s23p 2PJ–3s3p2 4P intercombination lines. However, we point out that the A-values for the 3s23p 2P–3s3p2 2D lines are up to three orders of magnitude smaller than those for the 3s23p 2P–3s3p2 2P allowed transitions (see Table 3 of Aggarwal & Keenan). As noted by the referee, since a large part of the matrix element for the 3s23p 2PJ–3s3p2 4P intercombination transitions arises from fine-structure interactions between the 3s3p2 4PJ and 2DJ levels, these becomes very sensitive because of the smaller size of the latter. Consequently, the A-values for the 1808 and 2335 Å multiplets are connected and very difficult to calculate. We hence strongly recommend further work on the determination of A-values for Si II, and in particular new measurements for the intercombination multiplet.
Given the discrepancies between the Aggarwal & Keenan (2014) results and previous theoretical and experimental data for A-values, it would be understandable to assume that the former must be in error. However, an inspection of Tables 4 and 5 reveal that the CLOUDY2 line ratio calculations, which include the Aggarwal & Keenan (2014) A-values, are in mostly better agreement with the observations than the CHIANTI and CLOUDY1 results. In particular, the long-standing discrepancies between theory and observation for the intercombination line ratios (see, for example Judge et al., 1991; Dufton et al., 1991, and references therein) are removed. Similarly, there is a significant improvement in the agreement between experimental values of the 1808.01/1817.45 line ratio and the theoretical results. This may be a coincidence, but we believe it is unlikely that the A-values for the components of the 3s23p 2PJ–3s3p2 4P intercombination multiplet and the 3s23p 2PJ–3s3p2 2D allowed lines would both be in error by the precise amounts required to provide good agreement between theory and observation, as they are different types of transition, albeit interconnected as noted above. In addition, the Aggarwal & Keenan (2014) A-values for other Si ii transitions are in agreement with previous work, with the resultant CLOUDY2 ratios similar to those generated by CHIANTI and CLOUDY1, which in turn generally agree with the observations. If the Aggarwal & Keenan (2014) data were in error, we might expect other transitions to be similarly affected. On the other hand, the Aggarwal & Keenan (2014) results imply that not only are previous calculations in error, but so are the measurements for the Si ii intercombination lines by Calamai et al. (1993), by up to a factor of 8, which seems unlikely. As noted above, new experimental determinations of the Si ii A-values are urgently required to investigate if the previous data are in error. If not, then the discrepancies between theory and observation for the intercombination lines remain, and will need further investigation.
In the cases of the 2329.23/2350.89 and 2335.32/2350.89 ratios in Table 5 for Tau, the CLOUDY2 values are in poorer agreement with observations than the CHIANTI and CLOUDY1 results. However, as noted previously the 2335.32 Å line intensity needs to be added to those for Ni ii features which are pumped by Si ii emission. Although we have identified and measured line intensities for all four Ni ii transitions in the spectrum of Gem and for three of the lines in Cen B (as 2084.31 Å was not detected in this star, Judge et al. (1991) could only determine the intensity for Ni ii 2416.87 Å and had to calculate fluxes for the others. Hence their estimate for the 2335.32 Å line intensity may not be reliable. Similarly, the 2329.23 Å feature is weak in the HST/GHRS spectrum of Tau (it was not detected in the higher quality HST/STIS data for the other stars) and hence may also not be well determined.
We note that although the 1260.42/(1264.73+1265.02) ratio for the quiet Sun in Table 5 agrees with all the theoretical optically thin values, the cool stars measurements for 1260.42/1264.73 in Table 4 are somewhat smaller than predicted. This cannot be due to optical depth effects, as the CLOUDY3 calculation for an optically thick plasma shows an even larger discrepancy with observation. The most likely explanation for the disagreement would be blending in the 1264.73 Å line, but a synthetic spectrum generated with CHIANTI reveals no likely candidate. For the other ratios involving allowed lines, the CLOUDY3 results indicate that at least some of the transitions must be subject to significant opacity, as the observations are in better agreement with these than with the optically thin CHIANTI, CLOUDY1 and CLOUDY2 theoretical ratios, one example being 1526.70/1533.40 in the three cool stars plus the quiet Sun.
To summarise, Si ii line intensity ratios measured from the ultraviolet spectra of cool stars and the Sun are found to be in generally good agreement with theoretical results generated with the Cloudy modelling code which include the radiative rate calculations of Aggarwal & Keenan (2014). In particular, adopting their A-values removes discrepancies previously found between theory and observation for ratios involving the 3s23p 2PJ–3s3p2 4P intercombination transitions at 2335 Å. However, these A-values are significantly different (by up to a factor of 8) from both previous calculations and experimental determinations. New measurements of the intercombination line A-values are hence urgently required to investigate if the existing experimental data are wrong. If not, then the good agreement found between theory and observation in the present paper is simply a coincidence.
ACKNOWLEDGEMENTS
Based on observations made with the NASA/ESA Hubble Space Telescope, obtained from the Mikulsky Archive at Space Telescope Science Institute, operated by the Association of Universities for Research in Astronomy, Inc., under NASA contract NAS 5-26555. Support for ASTRAL is provided by grants HST-GO-12278.01-A and HST-GO-13346.01-A from STScI. The project has made use of public databases hosted by SIMBAD, maintained by CDS, Strasbourg, France. SL, CAR and FPK are grateful to STFC for financial support via grant ST/L000709/1. GJF acknowledges financial support from the Leverhulme Trust via Visiting Professorship grant VP1-2012-025. CHIANTI is a collaborative project involving George Mason University, the University of Michigan (USA) and the University of Cambridge (UK).
| Lower level | Upper level | Wavelength (Å) | A | A | A | ECS | ECS |
|---|---|---|---|---|---|---|---|
| () | () | (NIST) | (s-1) | (s-1) | (s-1) | (Te = 7000 K) | (Te = 7000 K) |
| 3s23p 2P1/2 | 3s23d 2D3/2 | 1260.42 | … | 2.60E+9 | 2.01E+9 | 3.42 | 2.31 |
| 3s23p 2P3/2 | 3s23d 2D5/2 | 1264.73 | … | 3.04E+9 | 2.31E+9 | 6.76 | 4.71 |
| 3s23p 2P3/2 | 3s23d 2D3/2 | 1265.02 | … | 4.63E+8 | 5.23E+8 | 1.85 | 1.37 |
| 3s23p 2P1/2 | 3s3p2 2S1/2 | 1304.37 | … | 3.64E+8 | 3.60E+8 | 1.00 | 0.89 |
| 3s23p 2P3/2 | 3s3p2 2S1/2 | 1309.28 | … | 6.23E+8 | 6.60E+8 | 1.98 | 1.79 |
| 3s23p 2P1/2 | 3s24s 2S1/2 | 1526.70 | … | 3.81E+8 | 3.90E+8 | 1.06 | 1.21 |
| 3s23p 2P3/2 | 3s24s 2S1/2 | 1533.40 | … | 7.52E+8 | 7.90E+8 | 2.13 | 2.43 |
| 3s23p 2P1/2 | 3s3p2 2D3/2 | 1808.01 | … | 2.54E+6 | 1.00E+5 | 2.77 | 1.91 |
| 3s23p 2P3/2 | 3s3p2 2D5/2 | 1816.93 | … | 2.65E+6 | 2.00E+5 | 7.46 | 5.25 |
| 3s23p 2P3/2 | 3s3p2 2D3/2 | 1817.45 | … | 3.23E+5 | 5.30E+4 | 4.17 | 3.08 |
| 3s23p 2P1/2 | 3s3p2 4P3/2 | 2329.23 | 10 50 | 23.5 | 11.1 | 0.80 | 0.75 |
| 3s23p 2P1/2 | 3s3p2 4P1/2 | 2335.12 | 5200 19 | 5510 | 2296 | 0.51 | 0.47 |
| 3s23p 2P3/2 | 3s3p2 4P5/2 | 2335.32 | 2460 8 | 2440 | 397 | 2.38 | 2.07 |
| 3s23p 2P3/2 | 3s3p2 4P3/2 | 2344.92 | 1220 10 | 1310 | 157 | 1.05 | 1.04 |
| 3s23p 2P3/2 | 3s3p2 4P1/2 | 2350.89 | 4410 21 | 4700 | 3078 | 0.31 | 0.40 |
1Aexpt are the experimental A-values from Calamai et al. (1993); AN and ECST the A-values and effective collision strengths from Nahar (1998) and Tayal (2008), respectively; AAK the wavelength-corrected transition probabilities and ECSAK the effective collision strengths from Aggarwal & Keenan (2014).
| Experimental wavelength (Å) | Line centroid (Å) | Line width (Å) | Line flux |
|---|---|---|---|
| (in vacuum) | (observed) | (observed) | (10-14 erg cm-2 s-1) |
| 1260.42 | 1260.35 0.01 | 0.136 0.007 | 1.75 0.08 |
| 1264.73 | 1264.80 0.01 | 0.188 0.003 | 3.97 0.09 |
| 1265.02 | 1265.20 0.01 | 0.160 0.003 | 1.57 0.06 |
| 1304.37 | 1304.40 0.01 | 0.099 0.001 | 1.85 0.08 |
| 1309.28 | 1309.34 0.02 | 0.116 0.003 | 2.59 0.06 |
| 1526.70 | 1526.70 0.01 | 0.113 0.003 | 3.60 0.09 |
| 1533.40 | 1533.45 0.01 | 0.131 0.006 | 4.15 0.15 |
| 1808.01 | 1808.03 0.01 | 0.083 0.003 | 43.6 0.1 |
| 1816.93 | 1816.94 0.01 | 0.084 0.001 | 82.7 0.1 |
| 1817.45 | 1817.46 0.01 | 0.059 0.001 | 34.8 0.1 |
| 2329.231 | … | … | … |
| 2335.12 | 2335.12 0.01 | 0.048 0.001 | 124 1 |
| 2335.322 | 2335.32 0.01 | 0.070 0.001 | 78.6 0.3 |
| 2344.92 | 2344.93 0.01 | 0.040 0.001 | 61.1 0.4 |
| 2350.89 | 2350.91 0.01 | 0.050 0.001 | 104 1 |
| 2084.31 (Ni ii )3 | 2084.30 0.01 | 0.055 0.002 | 2.52 0.17 |
| 2125.79 (Ni ii )3 | 2125.79 0.01 | 0.048 0.001 | 11.3 0.2 |
| 2161.89 (Ni ii )3 | 2161.88 0.01 | 0.053 0.001 | 13.4 0.2 |
| 2416.87 (Ni ii )3 | 2416.90 0.01 | 0.050 0.001 | 24.5 0.3 |
1Line not detected in the Gem spectrum.
2Blended with Ni ii 2335.20 Å.
3Line of Ni ii which is radiatively pumped by Si ii 2335.32 Å. See Section 2 for details.
| Experimental wavelength (Å) | Line flux ( Cen A) | Line flux ( Cen B) |
|---|---|---|
| (in vacuum) | (10) | (10) |
| 1260.42 | 9.73 0.10 | 6.95 0.10 |
| 1264.73 | 22.9 0.10 | 22.7 0.3 |
| 1265.02 | 9.11 0.08 | 6.32 0.05 |
| 1304.37 | 7.95 0.07 | 5.00 0.06 |
| 1309.28 | 14.1 0.1 | 8.09 0.06 |
| 1526.70 | 32.6 0.2 | 17.9 0.1 |
| 1533.40 | 35.4 0.2 | 19.8 0.2 |
| 1808.01 | 322 2 | 179 1 |
| 1816.93 | 508 2 | 306 1 |
| 1817.45 | 243 2 | 95.6 0.4 |
| 2329.231 | … | … |
| 2335.12 | … | 127 1 |
| 2335.322 | … | 74.9 0.3 |
| 2344.92 | … | 135 1 |
| 2350.89 | … | 108 1 |
| 2084.31 (Ni ii )3 | … | … |
| 2125.79 (Ni ii )3 | … | 10.3 0.2 |
| 2161.89 (Ni ii )3 | … | 13.7 0.2 |
| 2416.87 (Ni ii )3 | … | 49.1 0.7 |
1Line not detected in the Cen A and Cen B spectra.
2Blended with Ni ii 2335.20 Å.
3Line of Ni ii which is radiatively pumped by Si ii 2335.32 Å. See Section 2 for details.
| Line ratio | Observed | Observed | Observed | CHIANTI1 | CLOUDY11 | CLOUDY21,2 | CLOUDY33 |
|---|---|---|---|---|---|---|---|
| Gem | Cen A | Cen B | |||||
| 1260.42/1264.73 | 0.44 0.02 | 0.42 0.01 | 0.30 0.01 | 0.56 | 0.56 | 0.55 (0.55, 0.55) | 0.97 |
| 1264.73/1265.02 | 2.52 0.12 | 2.51 0.02 | 3.59 0.05 | 9.55 | 9.69 | 9.41 (9.37, 9.41) | 0.96 |
| 1260.42/1304.37 | 0.94 0.06 | 1.22 0.02 | 1.39 0.03 | 2.31 | 1.83 | 1.77 (1.91, 1.56) | 0.22 |
| 1304.37/1309.28 | 0.72 0.09 | 0.56 0.01 | 0.62 0.01 | 0.58 | 0.59 | 0.55 (0.55, 0.55) | 0.95 |
| 1526.70/1533.40 | 0.87 0.04 | 0.92 0.01 | 0.90 0.01 | 0.51 | 0.51 | 0.51 (0.51, 0.51) | 0.96 |
| 1526.70/1808.01 | 0.082 0.010 | 0.10 0.01 | 0.10 0.01 | 0.026 | 0.039 | 0.050 (0.051, 0.042) | 0.32 |
| 1808.01/1817.45 | 1.25 0.01 | 1.32 0.01 | 1.87 0.01 | 7.47 | 7.90 | 1.93 (1.93, 1.93) | 0.87 |
| 1816.93/1808.01 | 1.89 0.01 | 1.58 0.01 | 1.71 0.01 | 1.69 | 1.68 | 2.31 (2.27, 2.35) | 1.03 |
| 2335.12/2350.89 | 1.19 0.02 | … | 1.18 0.01 | 1.20 | 1.18 | 0.75 (0.75, 0.75) | 0.96 |
| 2335.32/2350.89 | 1.25 0.014 | … | 1.37 0.01 | 4.14 | 4.41 | 1.42 (3.71, 0.50) | 1.12 |
| 2344.92/2350.89 | 0.58 0.01 | … | 1.25 0.02 | 2.04 | 2.92 | 0.41 (1.71, 0.13) | 1.00 |
1Optically thin line ratios calculated at Te = 7000 K, Ne = 109.5 cm-3.
2Values in brackets are optically thin line ratios calculated at Te = 7000 K, Ne = 108.5 and 1010.5 cm-3, respectively.
3Optically thick calculations at Te = 7000 K, Ne = 109.5 cm-3.
4Observed line ratio includes the contribution of the Ni ii lines to the Si ii 2335.32 Å flux. See Section 2 for details.
| Line ratio | Tau1 | Quiet Sun2 | CHIANTI3 | CLOUDY13 | CLOUDY23 | CLOUDY34 |
|---|---|---|---|---|---|---|
| 1260.42/(1264.73 + 1265.02) | … | 0.52 | 0.51 | 0.51 | 0.50 | 0.48 |
| 1260.42/1304.37 | … | 1.90 | 1.99 | 1.83 | 1.77 | 0.22 |
| 1304.37/1309.28 | … | 0.45 | 0.58 | 0.59 | 0.55 | 0.95 |
| 1526.70/1533.40 | … | 1.0 | 0.51 | 0.51 | 0.51 | 0.96 |
| 1808.01/1817.45 | 1.30 | … | 7.90 | 7.90 | 1.93 | 0.87 |
| 1816.93/1808.01 | 2.61 | … | 1.68 | 1.68 | 2.31 | 1.03 |
| 2329.23/2350.89 | 0.062 | … | 0.045 | 0.040 | 0.029 | 0.94 |
| 2335.12/2350.89 | 1.26 | … | 1.20 | 1.18 | 0.75 | 0.96 |
| 2335.32/2350.89 | 3.525 | … | 4.14 | 4.41 | 1.42 | 1.12 |
1HST/GHRS observations of Tau from Judge et al. (1991)
2HRTS observations of the quiet Sun from Keenan et al. (1992)
3Optically thin line ratios calculated at Te = 7000 K, Ne = 109.5 cm-3 ( Tau); Te = 7000 K, Ne = 1011 cm-3 (quiet Sun).
4Optically thick line ratios calculated at Te = 7000 K, Ne = 109.5 cm-3 ( Tau); Te = 7000 K, Ne = 1011 cm-3 (quiet Sun).
5Includes contributions of Ni ii lines to 2335.32 Å line flux as discussed by Judge et al. (1991).

References
- Aggarwal & Keenan (2014) Aggarwal K. M., Keenan F. P., 2014, MNRAS, 442, 388
- Ayres (2010) Ayres T. R., 2010, ApJS, 187, 149
- Ayres (2013) Ayres T. R., 2013, Astronomische Nachrichten, 334, 105
- Calamai et al. (1993) Calamai A. G., Smith P. L., Bergeson S. D., 1993, ApJ, 415, L59
- Carpenter et al. (1988) Carpenter K. G., Pesce J. E., Stencel R. E., Brown A., Johansson S., Wing R. F., 1988, ApJS, 68, 345
- Carpenter et al. (1991) Carpenter K. G., Robinson R. D., Wahlgren G. M., Ake T. B., Ebbets D. C., Linsky J. L., Brown A., Walter F. M., 1991, ApJ, 377, L45
- Dere et al. (1997) Dere K. P., Landi E., Mason H. E., Monsignori Fossi B. C., Young P. R., 1997, AAPS, 125, 149
- Dufton et al. (1991) Dufton P. L., Keenan F. P., Hibbert A., Stafford R. P., Byrne P. B., Agnew D., 1991, MNRAS, 253, 474
- Dufton & Kingston (1985) Dufton P. L., Kingston A. E., 1985, ApJ, 289, 844
- Dufton & Kingston (1991) Dufton P. L., Kingston A. E., 1991, MNRAS, 248, 827
- Dufton & Kingston (1994) Dufton P. L., Kingston A. E., 1994, Atomic Data and Nuclear Data Tables, 57, 273
- Ferland et al. (1998) Ferland G. J., Korista K. T., Verner D. A., Ferguson J. W., Kingdon J. B., Verner E. M., 1998, PASP, 110, 761
- Ferland et al. (2013) Ferland G. J., Porter R. L., van Hoof P. A. M., Williams R. J. R., Abel N. P., Lykins M. L., Shaw G., Henney W. J., Stancil P. C., 2013, RMxAA, 49, 137
- Judge (1986a) Judge P. G., 1986a, MNRAS, 221, 119
- Judge (1986b) Judge P. G., 1986b, MNRAS, 223, 239
- Judge et al. (1991) Judge P. G., Carpenter K. G., Harper G. M., 1991, MNRAS, 253, 123
- Keenan et al. (1992) Keenan F. P., Cook J. W., Dufton P. L., Kingston A. E., 1992, ApJ, 387, 726
- Landi et al. (2013) Landi E., Young P. R., Dere K. P., Del Zanna G., Mason H. E., 2013, ApJ, 763, 86
- Nahar (1998) Nahar S. N., 1998, Atomic Data and Nuclear Data Tables, 68, 183
- Nussbaumer (1977) Nussbaumer H., 1977, A&A, 58, 291
- Tayal (2008) Tayal S. S., 2008, ApJS, 179, 534