Chronography of the Milky Way’s Halo System with Field
Blue Horizontal-Branch Stars
Abstract
In a pioneering effort, Preston et al. reported that the colors of blue horizontal-branch (BHB) stars in the halo of the Galaxy shift with distance, from regions near the Galactic center to about 12 kpc away, and interpreted this as a correlated variation in the ages of halo stars, from older to younger, spanning a range of a few Gyrs. We have applied this approach to a sample of some 4700 spectroscopically confirmed BHB stars selected from the Sloan Digital Sky Survey to produce the first “chronographic map” of the halo of the Galaxy. We demonstrate that the mean de-reddened color, (), increases outward in the Galaxy from to (over a color window spanning []) from regions close to the Galactic center to 40 kpc, independent of the metallicity of the stars. Models of the expected shift in the color of the field BHB stars based on modern stellar evolutionary codes confirm that this color gradient can be associated with an age difference of roughly 2-2.5 Gyrs, with the oldest stars concentrated in the central kpc of the Galaxy. Within this central region, the age difference spans a mean color range of about 0.05 mag ( 0.8 Gyrs). Furthermore, we show that chronographic maps can be used to identify individual substructures, such as the Sagittarius Stream, and overdensities in the direction of Virgo and Monoceros, based on the observed contrast in their mean BHB colors with respect to the foreground/background field population.
Subject headings:
Galaxy: halo—methods: observational—methods: statistical—stars: horizontal-branch1. Introduction
Study of the stellar populations in the Galaxy has long been a pillar of the effort to understand its formation and evolution, ever since the introduction of the concept in the middle of the last century by Baade (1954). Indeed, the existence (or not) of gradients in the age and/or metallicity of the globular cluster system was a central piece of evidence used by Searle & Zinn (1978) to support their suggestion for a hierarchical assembly of the Galaxy, contrasting with the rapid, monolithic collapse model put forward by Eggen et al. (1962). More recently, Lee et al. (1994) argued in support of age as the primary “second parameter” in the morphology of cluster horizontal-branches, concluding that globular clusters located within 15-20 kpc of the Galactic center are on the order of 2 Gyrs older than clusters located outside this region. A modern discussion of the globular-cluster age-metallicity relationship (based on refined estimates of metallicity, and in particular, age), and its variation with distance in the Galaxy, can be found in Leaman et al. (2013).
While the globular clusters provide clear insight, it would be of even greater importance if a similar exercise could be carried out making use of the far more numerous field stars in the halo system. Even though astero-seismology is making great strides toward this goal (e.g., Soderblom, 2013; Silva Aguirre et al., 2015), age determinations for individual field stars remain a challenge, and for the present are still quite limited in the numbers of objects (and distance ranges) that have been studied.
The seminal work of Preston et al. (1991a) explored using the colors of field blue horizontal-branch (BHB) stars as tracers of the age of the underlying stellar population of the halo. These authors employed a sample of some 500 BHB candidates selected from the HK objective-prism survey (Beers et al., 1988; Preston et al., 1991b), with available broadband and colors that distinguished them from potential contamination by high-gravity blue stragglers or A-type main-sequence stars. Their analysis indicated that there exists a shift in the mean BHB colors, , on the order of 0.025 (0.004) mag with Galactocentric distance over the region 2 kpc 12 kpc, which they interpreted as an age gradient in the inner portion of the Galactic halo of 2 Gyr, similar to that suggested by Zinn (1980) to exist for inner-halo globular clusters.
In this letter we revisit the issue of the mean colors of halo BHB stars, and their possible variation with Galactocentric distance, making use of a much larger sample of field stars than were available to Preston et al. Our sample is drawn from photometry obtained by the Sloan Digital Sky Survey (SDSS; York et al., 2000), and with available SDSS spectroscopy that allows us to confidently differentiate BHB stars from possible contaminants, such as blue stragglers. This sample is used to produce, for the first time, a chronographic “age map” of the underlying stellar population of the halo system of the Galaxy. This map not only confirms the previous result from Preston et al. (1991a), albeit with a somewhat smaller age range found for the central region of the Galaxy, but permits the identification of stellar debris from the Sagittarius Stream, as well as the Virgo and Monoceros overdensities.
2. The BHB Sample
Our BHB sample is obtained from stars with photometry and spectroscopy released as part of SDSS DR8 (Aihara et al., 2011). The adopted restrictions for the selection of field BHB stars are fully described in Santucci et al. (2015). Briefly, stars were required to satisfy: (1) A color cut: and 111All magnitudes and colors presented in this work have been corrected for interstellar absorption and reddening according to Schlegel et al. (1998). and (2) Surface gravities, log , as derived from application of a recent version of the SEGUE Stellar Parameter Pipeline (SSPP; see Lee et al. 2008a, b; Allende Prieto et al. 2008; Smolinski et al. 2011; Lee et al. 2011 for details): 3.0 log 3.8. For a discussion of the log uncertainties and the application of surface-gravity estimates for selection of BHB stars, see Lee et al. (2008b) and Santucci et al. (2015), respectively.
These restrictions resulted in an initial sample of 4800 BHB stars. For the color window we employ for this study, , there are some 4700 BHB stars. In order to carry out an approximate comparison with the Preston et al. (1991a) results, we also obtained a transformation to the Johnson system, based on Zhao & Newberg (2006). See Beers et al. (2012) for comments on the range of validity of these transformations.
| (1) |
and
| (2) |
Distances were estimated adopting the absolute magnitude calibration described by Deason et al. (2011):
| (3) |
Note that Santucci et al. (2015) found little difference between the above relationship and those that included a metallicity-dependent term, at least for stars in our metallicity range.
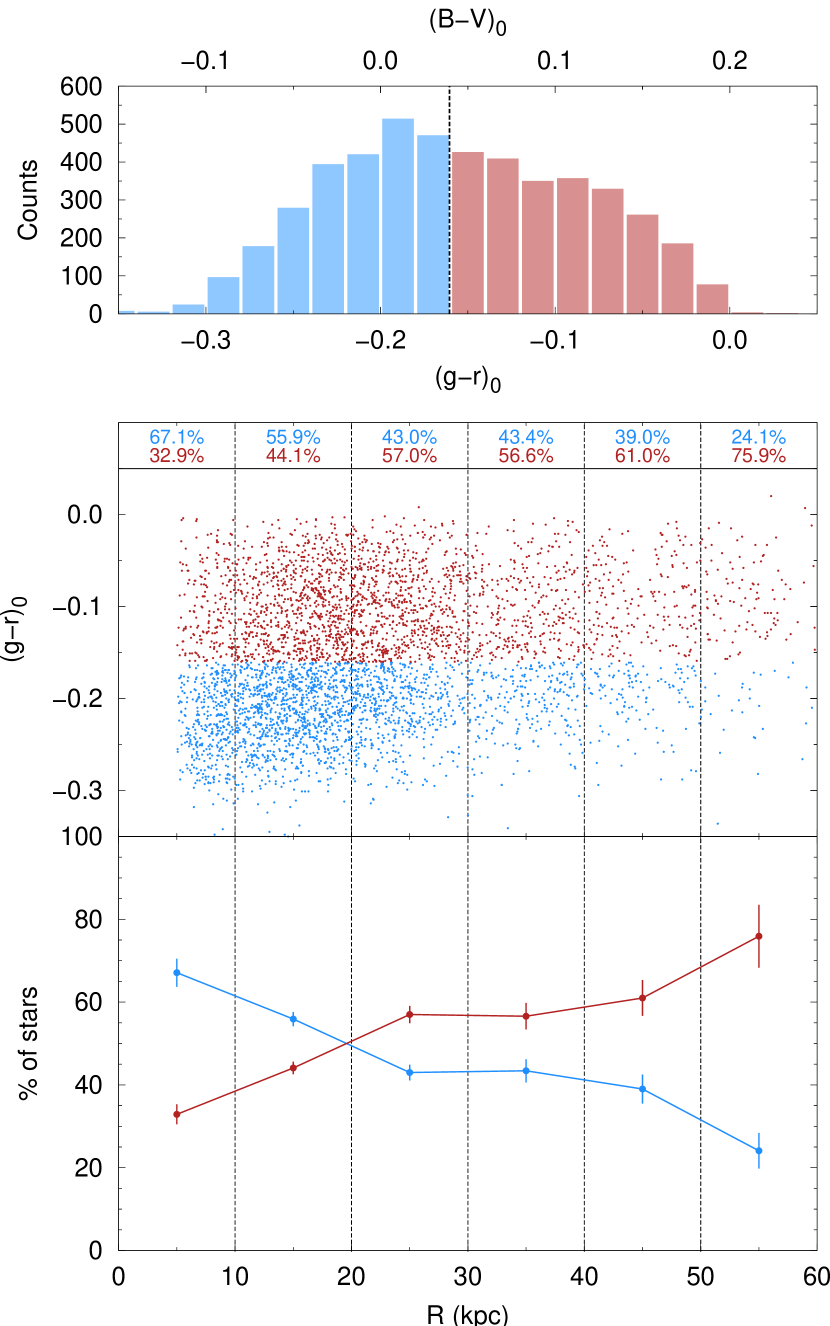
Figure 1 (top panel) shows the distributions of colors for our sample stars (an approximate scale is shown at the top of the panel). The vertical black dashed line in this panel marks the median value of the distribution ), which was used to split the BHB colors into two pieces, which we refer to as the red-window (RW) and blue-window (BW) stars. The lower panels show the distribution of the BW and RW stars as a function of Galactocentric distance, . It is immediately clear that the BW BHB stars are preferably found closer to the Galactic center, while the RW BHB stars are found over a wider range in distance.222This result is reminiscent of Figure 1 of Preston et al. (1991a), which showed the distribution of apparent magnitude and ()0 colors for their sample stars in three angular ranges toward the Galactic center. The crossover point occurs at around 20 kpc, beyond which there are more RW BHB stars then BW BHB stars. The percentages of BW and RW BHB stars in each step are shown at the top of the lower panel, and are indicated by blue and red lines, respectively.
The Preston et al. (1991a) color window, () is narrower than our present window, which covers (). We chose this “extended color window” to include bluer stars in order to increase the dynamical range of the color shift, since we can confidently classify our targets as BHB stars on the basis of spectroscopic measurements. We have verified that we do not undersample these bluer stars (due to their intrinsically lower luminosities compared with the redder stars) at the apparent magnitude corresponding to the maximum distances explored by our sample (for 20, the blue stars do not begin to fall out of the sample, relative to the redder BHB stars, until distances beyond 50 kpc are reached).
3. The Variation of BHB Colors with Metallicity
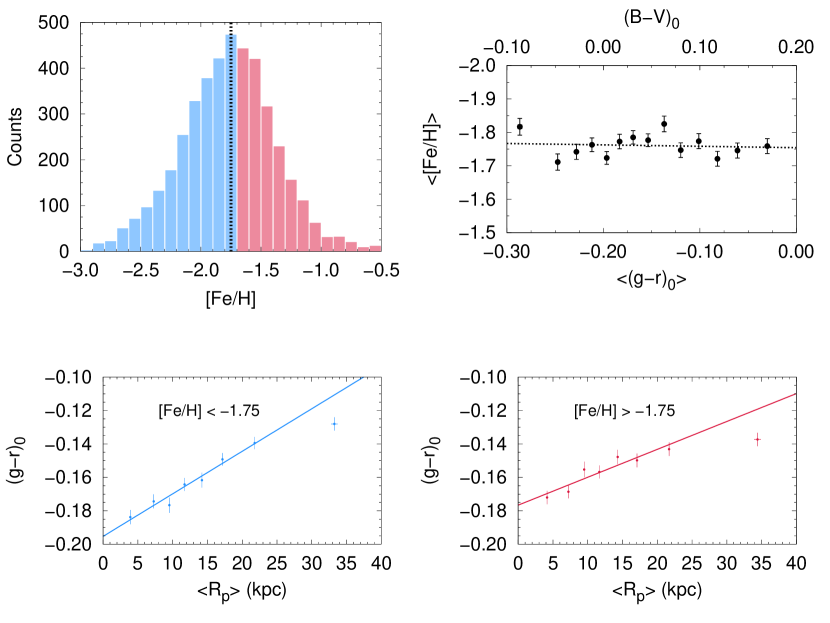
Preston et al. (1991a) demonstrated to their satisfaction that metallicity was not responsible for the observed color shift of their BHB candidates, but this was in the absence of spectroscopic determinations for their entire sample. Since we have that information for all of the stars in our sample, we can examine this question more quantitatively. The top-left panel of Figure 2 shows the distribution of spectroscopically determined metallicity, [Fe/H], for our sample. The top-right panel shows the mean metallicity [Fe/H], as a function of the mean color, (). As is clear from inspection, there is no variation.
As a further check, we have divided this distribution into two equal parts at the median value of [Fe/H]1.75. The lower panels of this figure show the distribution of mean colors for each of these metallicity regions, as a function of projected Galactocentric distance, . The color shift is present for both intervals, but it is slightly shallower for the relatively more metal-rich subset of the data.
4. The Observed Color Shift for Halo BHB Stars and the Derived Chronographic Map

Figure 3 is a map of the distribution of the colors of halo-system BHB stars in the plane X vs. Z. For comparison, this figure shows maps based on both the extended color window we employ (upper panel) and the original Preston et al. window (lower panel). As can be appreciated from inspection of these maps, the results are quite similar.
Preston et al. (1991a) proposed that the observed shift in the mean colors of BHB stars in their sample arose due to changes in the age of the underlying stellar population, and obtained an approximate relationship between the observed color shift and the proposed age shift333, where t9 is the age variation in Gyr and is the window of mean color over which the variation occurs., using stellar-evolution models that were then available, and an empirical calibration based on globular cluster horizontal branches.
We have reconsidered the approximation derived by Preston et al., using revision 5329 of the MESA stellar-evolution code (Paxton et al., 2011), tuned to produce evolutionary tracks and zero-age horizontal-branch (ZAHB) models close to those calculated with the Victoria code (VandenBerg et al., 2012). The position of a ZAHB star on the color-magnitude diagram, e.g., relative to the selected color window, is determined by its initial mass, metallicity, [Fe/H], initial helium () and CNO abundances, as well as by the amount of mass lost on the red giant branch. For simplicity, we have assumed that the stars have the same and [/Fe] = +0.4. To further reduce the number of free parameters, we have used the Reimers prescription (Reimers, 1977) for RGB mass loss with . This yields mean ZAHB masses () of stars with different initial masses and metallicities for a range of horizontal-branch (HB) ages. To populate a HB by stars with ZAHB masses close to the mean one, we have used our new HB population-synthesis tool. It assumes that the ZAHB masses are normally distributed around with a dispersion , the value of which does not affect the final results of this study. Our HB population-synthesis simulations enable the estimation of as a function of the HB age and metallicity and, as a result, to find the slopes (Figure 4).
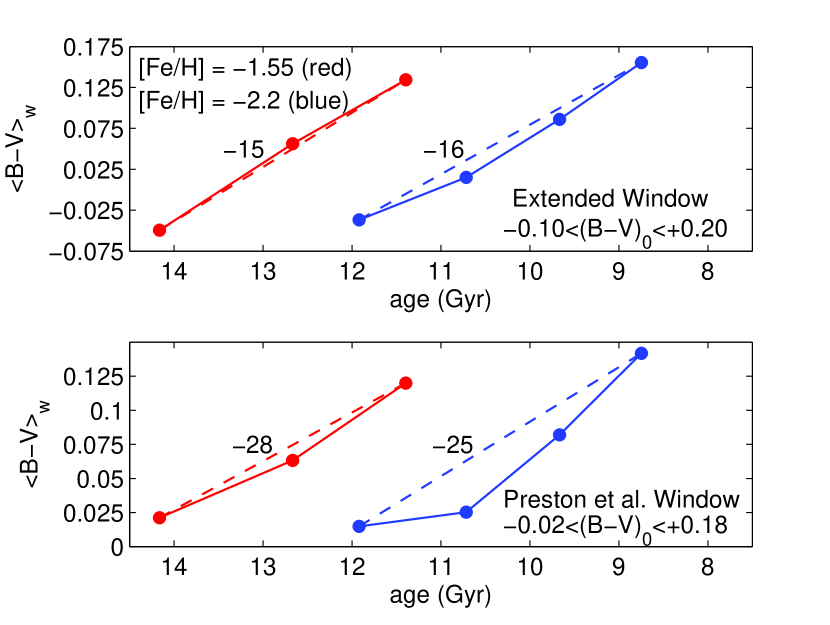
For our current purpose, the zero point of the mapping from color to age was set at 13.5 Gyr, which assumes that star formation began shortly after the Big Bang, consistent with the recent age determination of the very metal-poor subgiant HD 140283 (Vandenberg et al., 2014). Note that is similar, though not identical, to ( = ). In order to provide an appropriate color to age conversion, we use an average of the slopes shown in Figure 4 (Extended Window: ; Preston et al. Window: ).
There are a number of distinctive features seen in the chronographic maps of Figure 3. The most obvious is the concentration of the oldest stars (-12.5 Gyrs) within 15 kpc from the Galactic center. This “chronographic sphere” occupies the predicted locations for the most ancient stars in the Milky Way, as shown by a number of modern numerical simulations of galaxy assembly (see § 5). The color difference across this feature, mag, corresponds to an age difference of about 0.8 Gyrs, a factor of 2.5 smaller than that inferred previously by Preston et al. (1991a), primarily due to the revised slopes of the color-age relationship. It is worth noting that the ancient chronographic sphere reaches well into the Solar Neighborhood, suggesting that there should be numerous examples of relatively nearby stars whose origin is associated with the outer-halo population argued to be present by Carollo et al. (2007, 2010), Beers et al. (2012), and An et al. (2013, 2015). Other younger features (those with yellow and red colors in the maps) can be associated with the Sgr Stream, and overdensities in the directions of Virgo and Monoceros, although further interpretation is limited by the small sample size.
5. Interpretation
An age gradient within the Galactic halo that places older stars nearer the center of the Galaxy is consistent with the generic finding from structure formation theory in a CDM cosmology that the oldest progenitors of a halo are centrally concentrated. This concentration results from the “inside out” formation of CDM halos, in which any halo’s central regions are built from the first progenitor halos to collapse, while its outskirts are built preferentially from subhalos that themselves virialized and merged at later times (White & Springel, 2000). This robust behavior, seen in DM-only simulations of CDM halos, need not translate directly into gradients in the properties of stellar populations formed in these progenitor halos, as variations in star-formation histories, chemical abundances, and stellar physics could in principle erase any “age” gradient in the underlying DM subhalos.
However, detailed simulations of subhalos accreting over time to form a Milky Way (MW)-sized parent halo at (Bullock & Johnston, 2005; Cooper et al., 2010; Tumlinson, 2010) recover gradients in age from place to place in the Galactic halo, with the oldest stars at a given metallicity being preferentially concentrated at smaller radii and on more tightly bound orbits. These simulations typically find ages of 8-12 Gyr for stellar populations stripped from accreted halos to build the metal-poor MW halo near the Sun (Font et al., 2006; Cooper et al., 2010). These ages and the metallicities of the model populations match well with the range of ages and metallicities in the BHB sample. While these models qualitatively agree with our chronographic map, none of them analyzed gradients over the same range of metallicity and age as the BHB sample, so a direct comparison between model and data is precluded.
The models further show that the gradients occur in some stochastic halo-building histories, but are less strong or absent in others. This finding hints that clear age gradients may not be generic to all possible ways of building MW-like halos, but may arise from particular star-formation and/or chemical enrichment conditions that were met in our own Galaxy. Hydrodynamical cosmological simulations that include chemical evolution show the inner regions of MW-sized haloes to be populated by a combination of disrupted stars from accreted satellites, as well as stars formed in situ (McCarthy et al., 2012; Tissera et al., 2012). More detailed studies by Tissera et al. (2013) found that, while disrupted stars covered a larger range in binding energy than the in situ stars, both stellar populations are found to be low-metallicity, -element enhanced, and have ages older than Gyr, with a mean age of -12 Gyr. Their findings suggest that the existence of an age gradient could be linked to properties of the accreted satellites in early stages of the halo assembly, and modulated by the contribution of the in situ stars. In either case, our chronographic map enables important tests of hierarchical models and the physical ingredients that go into them.
6. Conclusions
We have presented the first chronographic map of the age distribution of stars in the halo system of the Galaxy, based on the mean colors of a spectroscopically confirmed sample of 4700 stars from SDSS. These results confirm and extend the previous work of Preston et al. (1991a), and are consistent with the reported age differences of globular clusters in the inner- vs. outer-halo regions, as well as with the predictions of current models of hierarchical galaxy assembly.
Although it should be cautioned that variations in the colors of BHB stars could also arise from differences in their helium and/or CNO abundances, it is difficult to imagine why these should correlate with distance from the Galactic center. Assuming age is indeed the primary factor affecting the mean colors of BHB stars, this provides a powerful new tool for the exploration of the star-formation history of halo stars and within individual accreted structures.
We look forward to application of the chronographic method to the full photometric sample of BHB stars from SDSS (Carollo et al., in prep.), as well as to other samples of resolved stellar populations in the Local Group with suitable available data. Comparison with insights from the Gaia mission (Perryman et al., 2001; Jordi, 2015), as well as application to the photometry gathered by LSST in more distant regions of the Galaxy, and the opportunity to identify overdensities and streams based on age contrast rather than exclusively number density contrast, are all exciting prospects.
References
- Aihara et al. (2011) Aihara, H., Allende Prieto, C., An, D. et al. 2011, ApJS, 193, 29
- Allende Prieto et al. (2008) Allende Prieto, C., Sivarani, T., Beers, T. C. et al. 2008, AJ, 136, 2070
- An et al. (2013) An, D., Beers, T. C., Johnson, J. A., et al. 2013, ApJ, 763, 65
- An et al. (2015) An, D., Beers, T. C., Santucci, R. M., et al. 2015, ApJ, submitted
- Baade (1954) Baade, W. 1954, Transactions of the International Astronomical Union VIII (Cambridge, 1954), 8, 682
- Beers et al. (2012) Beers, T. C., Carollo, D., Ivezić, Ž. et al. 2012, ApJ, 746, 34
- Beers et al. (1988) Beers, T.C., Preston, G.W., & Shectman, S.A. 1988, ApJS, 67, 461
- Bullock & Johnston (2005) Bullock, J. S., & Johnston, K. V. 2005, ApJ, 635, 931
- Carollo et al. (2007) Carollo, D., Beers, T. C., Lee, Y. S., et al. 2007, Nature, 450, 1020
- Carollo et al. (2010) Carollo, D., Beers, T. C., Chiba, M., et al. 2010, ApJ, 712, 692
- Carollo et al. (2015) Carollo, D., Beers, T. C., Placco, V. M. et al. 2015, in preparation
- Cooper et al. (2010) Cooper, A. P., Cole, S., Frenk, C. S., et al. 2010, MNRAS, 406, 744
- Deason et al. (2011) Deason, A. J., Belokurov, V., & Evans, N. W. 2011, MNRAS, 416, 2903
- Eggen et al. (1962) Eggen, O. J., Lynden-Bell, D., & Sandage, A. R. 1962, ApJ, 136, 748
- Font et al. (2006) Font, A. S., Johnston, K. V., Bullock, J. S., & Robertson, B. E. 2006, ApJ, 638, 585
- Jordi (2015) Jordi, C. 2015, Proceedings of the XI Scientific Meeting of the Spanish Astronomical Society, A. J. Cenarro, F. Figueras, C. Hernandez-Monteagudo, J. Trujillo Bueno, and L. Valdivielso (eds.), p. 390-401
- Leaman et al. (2013) Leaman, R., VandenBerg, D. A., & Mendel, J. T. 2013, MNRAS, 436, 122
- Lee et al. (1994) Lee, Y.-W., Demarque, P., & Zinn, R. 1994, ApJ, 423, 248
- Lee et al. (2008a) Lee, Y. S., Beers, T. C., Sivarani, T. et al. 2008a, AJ, 136, 2022
- Lee et al. (2008b) Lee, Y. S., Beers, T. C., Sivarani, T. et al. 2008b, AJ, 136, 2050
- Lee et al. (2011) Lee, Y. S., Beers, T. C., Allende Prieto, C. et al. 2011, AJ, 141, 90
- McCarthy et al. (2012) McCarthy, I.G., Font, A.S., Crain, R.A., Deason, A. J., et al. 2012, MNRAS, 420, 2245
- Paxton et al. (2011) Paxton, B., Bildsten, L., Dotter, A., Herwig, F., Lesaffre, P., & Timmes, F. 2011, ApJS, 192, 3
- Perryman et al. (2001) Perryman, M. A. C.,de Boer, K. S., Gilmore, G., et al. 2001, A&A, 369, 339
- Preston et al. (1991a) Preston, G. W., Shectman, S. A., & Beers, T. C. 1991a, ApJ, 375, 121
- Preston et al. (1991b) —. 1991b, ApJS, 76, 1001
- Reimers (1977) Reimers, D. 1977, A&A, 61, 217
- Santucci et al. (2015) Santucci, R. M., Placco, V. M., Rossi, S. et al. 2015, ApJ, 801, 116
- Schlegel et al. (1998) Schlegel, D. J., Finkbeiner, D. P., & Davis, M. 1998, ApJ, 500, 525
- Searle & Zinn (1978) Searle, L. & Zinn, R. 1978, ApJ, 225, 357
- Silva Aguirre et al. (2015) Silva Aguirre, V., Davies, G. R., Basu, S. et al. 2015, MNRAS, 452, 2127
- Smolinski et al. (2011) Smolinski, J. P., Lee, Y. S., Beers, T. C. et al. 2011, AJ, 141, 89
- Soderblom (2013) Soderblom, D. 2013, in Asteroseismology of Stellar Populations in the Milky Way, 2
- Tissera et al. (2012) Tissera, P.B., White, S.D.M., & Scannapieco, C. 2012, MNRAS, 420, 255
- Tissera et al. (2013) Tissera, P.B., Scannapieco, C., Beers, T.C., & Carollo, D. 2013, MNRAS, 432, 3391
- Tumlinson (2010) Tumlinson, J. 2010, ApJ, 708, 1398
- VandenBerg et al. (2012) VandenBerg, D. A., Bergbusch, P. A., Dotter, A. et al. 2012, ApJ, 755, 15
- Vandenberg et al. (2014) VandenBerg, D.A., Bond, H.E., Nelan, E.P., Nissen, P.E., Schaefer, G.H., & Harmer, D. 2014, ApJ, 792, 110
- White & Springel (2000) White, S. D. M., & Springel, V. 2000, The First Stars, 327
- York et al. (2000) York, D. G., Adelman, J., Anderson, Jr., J. E. et al. 2000, AJ, 120, 1579
- Zhao & Newberg (2006) Zhao, C. & Newberg, H. J. 2006, ArXiv:0612034
- Zinn (1980) Zinn, R. 1980, ApJ, 241, 602