High dispersion spectroscopy of solar-type superflare stars with Subaru/HDS ††thanks: This study is based on observational data collected with Subaru Telescope, which is operated by the National Astronomical Observatory of Japan.
Abstract
We carried out spectroscopic observations with Subaru/HDS of 50 solar-type superflare stars found from Kepler data.
More than half (34 stars) of the target stars show no evidence of the binary system,
and we confirmed atmospheric parameters of these stars are roughly
in the range of solar-type stars.
We then conducted the detailed analyses for these 34 stars.
First, the value of the “” (projected rotational velocity) measured from spectroscopic results
is consistent with the rotational velocity estimated from the brightness variation.
Second, there is a correlation between the amplitude of the brightness variation and the intensity of Ca II IR triplet line.
All the targets expected to have large starspots because of their large amplitude of the brightness variation
show high chromospheric activities compared with the Sun.
These results support that the brightness variation of superflare stars
is explained by the rotation of a star with large starspots.
keywords:
stars:activity, stars:flare, stars:rotation, stars:solar-type, stars:starspots1 Introduction
Flares are energetic explosions in the stellar atmosphere,
and are thought to occur by intense releases of magnetic energy stored around starspots,
like solar flares (e.g., [Shibata & Magara (2011), Shibata & Magara 2011]).
Superflares are flares 10106 times more energetic
(1033-38erg; [Schaefer et al. (2000), Schaefer et al. 2000]) than the largest solar flares (1032erg).
Recently, we analyzed the data of the Kepler space telescope ([Koch et al.(2010), Koch et al. 2010]),
and discovered more than 1000 superflares on a few hundred solar-type (G-type main-sequence) stars
([Maehara et al. (2012), Maehara et al. 2012], [Maehara et al. (2015), 2015];
[Shibayama et al. (2013), Shibayama et al. 2013]; [Candelaresi et al. (2014), Candelaresi et al. 2014]).
We here define solar-type stars as the stars that have
a surface temperature of K and a surface gravity of .
With these data, we studied the statistical
properties of the occurrence rate of superflares,
and found that the occurrence rate () of the superflare versus the flare energy () has a power-law distribution
of , where
([Maehara et al. (2012), Maehara et al. 2012], [Maehara et al. (2015), 2015]; [Shibayama et al. (2013), Shibayama et al. 2013]),
and this distribution is roughly similar to that for the solar flare.
Many of the superflare stars show quasi-periodic brightness variations with a typical period of from one day to a few tens of days.
The amplitude of these brightness variations is in the range of 0.1-10% ([Maehara et al. (2012), Maehara et al. 2012]),
and is much larger than that of the solar brightness variation (0.01-0.1%) caused by the existence of sunspots on the rotating solar surface.
[Notsu et al. (2013b)] showed that the above brightness variations of superflare stars can be well explained
by the rotation of a star with fairly large starspots, taking into account the effects of inclination angle and the spot latitude.
[Notsu et al. (2013b)] compared the superflare energy and frequency with the rotation period,
assuming that the brightness variation corresponds to the rotation.
They then found slowly rotating stars can still produce as energetic flares as those of more rapidly rotating stars,
though the average flare frequency is lower for more slowly rotating stars.
[Notsu et al. (2013b)] also clarified that the superflare energy is related to the total coverage of the starspots,
and that the energy of superflares can be explained by the magnetic energy stored around these large starspots.
In addition, [Shibata et al. (2013)] suggested, on the basis of theoretical estimates, that the Sun can generate large magnetic flux sufficient for causing
superflares with an energy of erg within one solar cycle.
The results described above are, however, only based on Kepler monochromatic photometric data.
We need to spectroscopically investigate whether these brightness variations are explained by the rotation, and whether superflare stars have large starspots.
The stellar parameters and the binarity of the superflare stars are also needed to be investigated with spectroscopic observations
in order to discuss whether the Sun can really generate superflares.
We have then performed high-dispersion spectroscopy of superflares stars (50 stars in total).
We describe the results of this observation in the following.
2 Observations
In this observation, we observed 50 solar-type superflare stars by using High Dispersion Spectrograph (HDS; [Noguchi et al.(2002), Noguchi et al. 2002]) at the 8.2m Subaru telescope on 6 nights during 20112013 ([Notsu et al. (2013a), Notsu et al. 2013a], [Notsu et al. (2015a), 2015a] & [Notsu et al. (2015b), 2015b]; [Nogami et al. (2014), Nogami et al. 2014]; [Honda et al. (2015), Honda et al. 2015]). These 50 target stars were selected from superflare stars reported by our previous researches (e.g., [Shibayama et al. (2013), Shibayama et al. 2013]). Spectroscopic resolution () of each observation date is . The wavelength range is 61008800Å. This range includes Ca II near-IR triplet (8498/8542/8662Å) and H (6563Å), which are well-known indicators of stellar chromospheric activity. More details of the observations and the target stars are described in [Notsu et al. (2015a)].
3 Results and discussion
3.1 Stellar parameters
As a result of the observations,
we found more than half (34 stars) of our 50 targets have no evidence of binary system ([Notsu et al. (2015a), Notsu et al. 2015a]).
Among the remaining 16 stars, 12 stars show double line profiles or radial velocity shifts, which are expected be caused by
the orbital motion of binary system.
The other 4 stars have visual companion stars.
We then estimated effective temperature (), surface gravity (), metallicity ([Fe/H]),
and projected rotation velocity ()
of these 34 “single” superflare stars on the basis of our spectroscopic data ([Notsu et al. (2015a), Notsu et al. 2015a]).
We here estimated by measuring Doppler broadening of photospheric lines
taking into account macroturbulence and insturumental broadening
(cf. [Takeda et al.(2008), Takeda et al. 2008]; [Notsu et al. (2015a), Notsu et al. 2015a]).
We confirmed that stellar atmospheric parameters (, , and [Fe/H]) of
the 34 target stars are roughly in the range of ordinary solar-type (G-type main sequence) stars.
In particular, the temperature, surface gravity, and brightness variation period ()
of 9 stars are in the range of “Sun-like” stars (K, 4.0, and 10 days).
Five of the 34 target stars are fast rotators (km s-1),
while 22 stars have relatively low values (km s-1).
These results suggest that stars whose spectroscopic properties similar to the Sun can have superflares,
and this supports the hypothesis that the Sun might cause a superflare.
In the following, we conducted the detailed analyses for these 34 single stars ([Notsu et al. (2015b), Notsu et al. 2015b]).
3.2 Rotational velocity and inclination angle
We here compare “” with the brightness variation period (), and consider whether the brightness variation of superflare stars is explained by the rotation. Assuming that the brightness variations are caused by the rotation of the stars with starspots, we can estimate the rotational velocity () from and (stellar radius) by using
| (1) |

In Figure 1, we plot as a function of the . Some data points in Figure 1 show differences between the values of and . The projected rotational velocity () tends to be smaller than . Such differences should be explained by the inclination effect, as in [Notsu et al. (2013a), Notsu et al. (2013a)]. On the basis of and , the stellar inclination angle () can be estimated by using the following relation:
| (2) |
In Figure 1, we also show four lines indicating (), , , and . This figure shows two following important results. First, for almost all the stars (33 stars), the relation “” is satisfied. This is consistent with our assumption that the brightness variation is caused by the rotation since the inclination effect mentioned above can cause the relation “” if values really correspond to the rotational velocities (i.e. ). This is also supported by another fact that the distribution of the data points in Figure 1 are not random. Their distribution is expected to be much more random if the brightness variations have no relations with the stellar rotation. Second, stars that are distributed in the lower right side of Figure 1 are expected to have small inclination angles and to be nearly pole-on stars. In this figure, we distinguish such five stars with especially small inclination angle () from the other stars, using filled triangle data points.
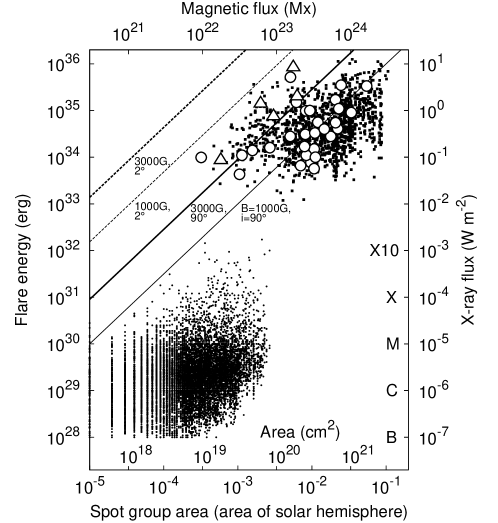
We can confirm the above inclination effects from another point of view. Figure 2 is a scatter plot of the flare energy of superflares and solar flares as a function of the spot coverage. The spot coverage of superflare stars is calculated from the amplitude of stellar brightness variations. Thick and thin solid lines correspond to the analytic relation between the spot coverage and the flare energy, which is obtained from Equation (14) of [Notsu et al. (2013b)] in case of for =3,000G and 1,000G. The thick and thin dashed lines correspond to the same relation in case of (nearly pole-on) for =3,000G and 1,000G, assuming that the brightness variation becomes small as a result of the inclination effect. These lines are considered to give an upper limit of superflare energy for each inclination angle. Considering these things, the superflare stars located in the upper left side of this figure are expected to have a low inclination angle. Open triangles in Figure 2 correspond to superflare stars whose inclination angle is especially small () on the basis of Figure 1, while open circles represent the other stars (). This classification is the same as that in Figure 1. All of the five triangle data points are located above the thick solid line ( and =3000G). This means that these stars are confirmed to have low inclination angle on the basis of both of the Figures 1 and 2. As a result, these two figures (Figures 1 and 2) are confirmed to be consistent. In other words, the stellar projected rotational velocity spectroscopically measured is consistent with the rotational velocity estimated from the brightness variation. This fact supports that the brightness variation of superflare stars is caused by the rotation.
3.3 Stellar chromospheric activity and starspots of superflare stars
In order to investigate the chromospheric activity of the target stars, we measured (8498), (8542), (8662), and (H) index, which are the residual core flux normalized by the continuum level at the line cores of the Ca II IRT and H, respectively. These indexes are known to be good indicators of stellar chromospheric activity (e.g., [Takeda et al.(2010), Takeda et al. 2010]; [Notsu et al. (2013a), Notsu et al. 2013a]). As the chromospheric activity is enhanced, the intensity of these indicators becomes large since a greater amount of emission from the chromosphere fills in the core of the lines.
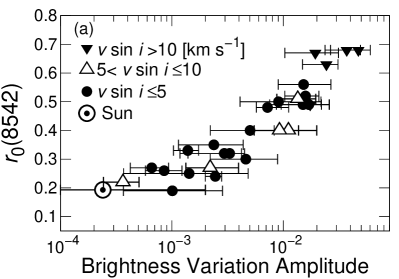
The (8542) values are plotted in Figure 3 (a)
as a function of the amplitude of stellar brightness variation (BVAmp) of Kepler data.
First, almost all the target superflare stars are more active compared with the Sun from the viewpoint of the (8542) index.
In other words, the mean magnetic field strength of the target stars can be higher than that of the Sun.
Next, in this figure, there is a rough positive correlation between (8542) and BVAmp.
Assuming that the brightness variation of superflare stars is caused by the rotation of a star with starspots,
the brightness variation amplitude (BVAmp) corresponds to the starspot coverage of these stars.
Then, we can say that there is a rough positive correlation between the starspot coverage and chromospheric activity level ((8542)).
This rough correlation shows us that all the target stars expected to have large starspots
on the basis of their large amplitude of the brightness variation show high magnetic activity compared with the Sun.
In other words, our assumption that the amplitude of the brightness variation correspond to the spot coverage is supported,
since high magnetic activity, which are confirmed by using (8542) values, are considered to be caused by the existence of large starspots.
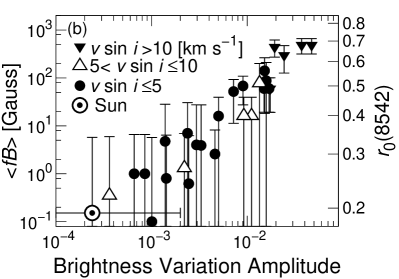
In Figure 3 (b), we also plot values as a function of BVAmp.
values are estimated from
on the basis of the rough relation estimated in [Notsu et al. (2015b)] with spectroheliographic observation of a solar active region.
With this figure, we can see the same conclusion as we did with Figure 3 (a),
though the errors of values are a bit large especially for less active stars.
We also investigated the emission flux of Ca II IRT and H lines for reference in [Notsu et al. (2015b)],
and confirmed basically the same conclusions as we did here with (8542) index.
4 Summary
Superflares are very large flares that release total energy 10104 times greater than
that of the biggest solar flares (1032 erg).
Recent Kepler-space-telescope observations found more than 1000 superflares
on a few hundred solar-type stars.
Such superflare stars show quasi-periodic brightness variations with the typical period of from one to a few tens of days.
Such variations are thought to be caused by the rotation of a star with large starspots.
However, spectroscopic observations are needed in order to confirm whether the variation is
really due to the rotation and whether superflares can occur on ordinary single stars similar to our Sun.
We have carried out spectroscopic observations of 50 solar-type superflare stars with Subaru/HDS.
As a result, more than half (34 stars) of the target stars show no evidence of the binary system,
and we confirmed stellar atmospheric parameters of these stars are roughly
in the range of solar-type stars on the basis of our spectroscopic data.
We then conducted the detailed analyses for these 34 stars.
First, the value of the measured from spectroscopic results
is consistent with the rotational velocity estimated from the brightness variation.
Next, we measured the intensity of Ca II IRT and H lines, which are good indicators of stellar chromospheric activity.
The intensity of these lines indicates that the mean magnetic field strength ()
of the target superflare stars can be higher than that of the Sun.
We found a correlation between the amplitude of the brightness variation and the intensity of Ca II IRT.
All the targets expected to have large starspots because of their large amplitude of the brightness variation show high
chromospheric activity compared with the Sun.
These results support that the brightness variation of superflare stars is explained by the rotation with large starspots.
References
- [Candelaresi et al. (2014)] Candelaresi, S., Hillier, A., Maehara, H., et al. 2014, ApJ, 792, 67
- [Honda et al. (2015)] Honda, S., Notsu, Y., Maehara, H., et al. 2015, PASJ, 67, 85
- [Koch et al.(2010)] Koch, D. G., Borucki, W. J., Basri, G., et al. 2010, ApJ, 713, L79
- [Maehara et al. (2012)] Maehara, H., Shibayama, T., Notsu, S., et al. 2012, Nature, 485, 478
- [Maehara et al. (2015)] Maehara, H., Shibayama, T., Notsu, Y., et al. 2015, Earth, Planets and Space, 67, 59
- [Nogami et al. (2014)] Nogami, D., Notsu, Y., Honda, S., et al. 2014, PASJ, 2014, 66, L4
- [Noguchi et al.(2002)] Noguchi, K., Aoki, W., Kawanomoto, S., et al. 2002, PASJ, 54, 855
- [Notsu et al. (2013a)] Notsu, S., Honda, S., Notsu, Y., et al. 2013a, PASJ, 65, 112
- [Notsu et al. (2013b)] Notsu, Y., Shibayama, T., Maehara, H., et al. 2013b, ApJ, 771, 127
- [Notsu et al. (2015a)] Notsu, Y., Honda, S., Maehara, H., et al. 2015a, PASJ, 67, 32
- [Notsu et al. (2015b)] Notsu, Y., Honda, S., Maehara, H., et al. 2015b, PASJ, 67, 33
- [Schaefer et al. (2000)] Schaefer, B. E., King, J. R., & Deliyannis, C. P. 2000, ApJ, 529, 1026
- [Shibata & Magara (2011)] Shibata, K., & Magara, T. 2011, Living Rev. Sol. Phys, 8, 6
- [Shibata et al. (2013)] Shibata, K., Isobe, H., Hiller, A., et al. 2013, PASJ, 65, 49
- [Shibayama et al. (2013)] Shibayama, T., Maehara, H., Notsu, S., et al. 2013, ApJS, 209, 5
- [Takeda et al.(2008)] Takeda, Y., Sato, B., & Murata, D. 2008, PASJ, 60, 781
- [Takeda et al.(2010)] Takeda, Y., Honda, S., Kawanomoto, S., et al. 2010, A&A, 515, A93