Charge transfer energies of benzene physisorbed on a graphene sheet from constrained density functional theory
Abstract
Constrained density functional theory (CDFT) is used to evaluate the energy level alignment of a benzene molecule as it approaches a graphene sheet. Within CDFT the problem is conveniently mapped onto evaluating total energy differences between different charge-separated states, and it does not consist in determining a quasi-particle spectrum. We demonstrate that the simple local density approximation provides a good description of the level aligmnent along the entire binding curve, with excellent agreement to experiments at an infinite separation and to calculations close to the bonding distance. The method also allows us to explore the effects due to the presence of graphene structural defects and of multiple molecules. In general all our results can be reproduced by a classical image charge model taking into account the finite dielectric constant of graphene.
I Introduction
Organic molecular crystals, namely crystals composed of organic molecules held together by weak van der Waals forces, are emerging as excellent candidates for fabricating nanoscale devices. These have potential application in electronics and optoelectronics in particular in areas such as solar energy harvesting, surface photochemistry, organic electronics and spintronics Dimitrakopoulos and Malenfant (2002); Gadzuk (1996); Repp (2005); Koch (2007); Sanvito (2011). A feature common to such class of devices is that they are composed from both an organic and inorganic component, where the first forms the active part of the device and the second provides the necessary electrical contact to the external circuitry. Clearly the electronic structure of the interface between these two parts plays a crucial role in determining the final device performance and needs to be understood carefully. In particular it is important to determine how charge transfers between the organic and the inorganic component and the energies at which the transfer takes place. This is a challenging task, especially in the single-molecule limit. Upon adsorption on a substrate, the electron addition and removal energies of a molecule change value from that of their gas phase counterparts. This is expected since, when the molecule is physisorbed on a polarisable substrate, the removal (addition) of an electron from (to) the molecule gives rise to a polarisation of the substrate. The image charge accumulated on the substrate in the vicinity of the molecule alters the addition or removal energy of charge carriers from the molecule.
A common way to calculate the addition and removal energies is to use a quasiparticle (QP) description. Within the QP picture, one ignores the effects of relaxation of molecular orbitals due to addition or removal of electrons and consequently takes the relative alignment of the metal Fermi level, , with either the lowest unoccupied molecular orbital (LUMO) and highest occupied molecular orbital (HOMO) of a molecule as removal energy. This effectively corresponds to associate the electron affinity and the ionization potential respectively to the LUMO and HOMO of the molecule. The adequacy of the QP description then depends on the level of theory used to calculate the energy levels of the HOMO and LUMO.
If the theory of choice is density functional theory (DFT) Hohenberg and Kohn (1964), then a number of observations should be made. Firstly, it is important to note that except for the energy of the HOMO, which can be rigorously interpreted as the negative of the ionization potential Janak (1978), in general the Kohn-Sham orbitals cannot be associated to QP energies. This is, however, commonly done in practice and often the Kohn-Sham QP levels provide a good approximation to the true removal energies, in particular in the case of metals. For molecules unfortunately the situation is less encouraging with the local and semi-local approximations of the exchange and correlation functional, namely the local density approximation (LDA) and the generalized gradient approximation (GGA), performing rather poorly even for the HOMO level. Such situation is partially corrected by hybrid functionals Becke (1993) or by functional explicitly including self-interaction corrections Pemmaraju et al. (2007); Filippetti et al. (2011), and extremely encouraging results have been recently demonstrated for range separated functionals Refaely-Abramson et al. (2012); Egger et al. (2014).
The calculation of the energy levels alignment of a molecule in the proximity of a metal, however, presents additional problems. In fact, the formation of the image charge, although it is essentially a classical electrostatic phenomenon, has a completely non-local nature. This means that unless a given functional is explicitly non-local it will in general fail in capturing such effect. The most evident feature of such failure is that the position of the HOMO and LUMO changes very little when a molecule approaches a metallic surface Thygesen and Rubio (2009). Such failure is typical of the LDA and GGA, and both hybrid and self-interaction corrected functionals do not improve much the situation. A possible solution to the problem is that of using an explicit many-body approach to calculate the QP spectrum. This is for instance the case of the GW approximation Hybertsen and Louie (1986), which indeed is capable of capturing the energy levels renormalization due to the image charge effect Neaton et al. (2006). The GW scheme, however, is highly computationally demanding and can be applied only to rather small systems. This is not the case for molecules on surfaces, where the typical simulation cells have to include several atomic layers of the metal and they should be laterally large enough to contain the image charge in full. This, in addition to the GW necessity to compute a significant fraction of the empty states manifold, make the calculations demanding and it is often not simple even to establish whether convergence has been achieved.
In this paper we approach the problem of evaluating the charge transfer energies of an organic molecule physisorbed on an inorganic substrate with the help of a much more resource-efficient alternative, namely constrained density functional theory (CDFT) Wu and Voorhis (2005). In CDFT, one transfers one electron from the molecule to the substrate (and vice versa) and calculates the difference in energy with respect to the locally charge neutral configuration (no excess of charge either on the molecule or the substrate) Souza et al. (2013). As such CDFT avoids the calculation of a QP spectrum, which is instead replaced by a series of total energy calculations for different charge distributions. This approach is free of any interpretative issues and benefits from the fact that even at the LDA level the total energy is usually an accurate quantity. Finally, it is important to remark that, for any given functional, CDFT is computationally no more demanding than a standard DFT calculation, so that both the LDA and the GGA allow one to treat large systems and to monitor systematically the approach to convergence.
Here we use the CDFT approach to study the adsorption of molecules on a 2-dimensional (2D) metal in various configurations. It must be noted that in contrast to a regular 3D metal, in a 2D one the image charge induced on the substrate is constrained within a one-atom thick sheet. This means that electron screening is expected to be less efficient than in a standard 3D metal and the features of the image charge formation in general more complex. In particular we consider here the case of graphene, whose technological relevance is largely established Ferrari et al. (2015). Most importantly for our work, recently graphene has been used as template layer for the growth of organic crystals Wang et al. (2015). It is then quite important to understand how such template layer affects the level alignment of the molecules with the metal. As a model system we consider a simple benzene molecule adsorbed on a sheet of graphene. This has been studied in the past AlZahrani (2010); Chakarova-Käck et al. (2006); Zhang et al. (2010), so that a good description of the equilibrium distance and the corresponding binding energy of the molecule in various configurations with respect to the graphene sheet are available. Furthermore, a study for some configurations exists Despoja et al. (2013), so that our calculated QP gap can be benchmarked.
Our calculations show that the addition and removal energies decrease in absolute value as the molecule is brought closer to the graphene sheet. Such decrease can be described with a classical electrostatic model taking into account the true graphene dielectric constant. As it will be discussed, a careful choice of the substrate unit cell is necessary to ensure the inclusion of the image charge, whose extension strongly depends on the molecule-substrate distance. We also reveal that the presence of defects in the graphene sheet, such as a Stone-Wales one, does not significantly alter the charge transfer energies. In realistic situations, e.g. at the interface between a molecular crystal and an electrode, a molecule is surrounded by many others, which might alter the level alignment. We thus show calculations, where neighboring molecules are included above, below and in the same plane of the one under investigation. Interestingly, our results suggest that the charge transfer states are weakly affected by the presence of other molecules.
II Method
In order to find the ground state energy of a system, Kohn-Sham DFT minimises a universal energy functional
| (1) |
where , and denote respectively the Hartee, exchange-correlation (XC) and external potential energies. The Kohn-Sham orbitals, , for an electron with spin define the non-interacting kinetic energy , while is the total number of electrons with spin . The electron density, is then given by .
In contrast to regular DFT, in CDFT one wants to find the ground state energy of the system subject to an additional constraint of the form
| (2) |
where is a weighting function that describes the spatial extension of the constraining region and is the number of electrons that one wants to confine in that region. In our case is set to 1 inside a specified region and zero elsewhere. In order to minimise subject to the constraint, we introduce a Lagrange multiplier and define the constrained functional Wu and Voorhis (2005)
| (3) |
Now the task is that of finding the stationary point of under the normalization condition for the Kohn-Sham orbitals. This leads to a new set of Kohn-Sham equations
| (4) |
where is the exchange and correlation potential. Equation (4) does not compute , which remains a parameter. However, for each value of it produces a unique set of orbitals corresponding to the minimum-energy density. In this sense we can treat as a functional of only. It can be proved that has only one stationary point with respect to , where it is maximized Wu and Voorhis (2005). Most importantly the stationary point satisfies the constraint. One can then design the following procedure to find the stationary point of : (i) start with an initial guess for and and solve Eq. (4); (ii) update until the constraint Eq. (2) is satisfied; (iii) start over with the new and a new set of s.
Here we use CDFT to calculate the charge transfer energy between a benzene molecule and a graphene sheet. For any given molecule-to-substrate distance, , we need to perform three different calculations:
-
1.
a regular DFT calculation in order to determine the ground state total energy and the amount of charge on each subsystem (i.e. on the molecule and on the graphene sheet)
-
2.
a CDFT calculation with the constraint that the graphene sheet contains one extra electron and the molecule contains one hole. This gives the energy .
-
3.
a CDFT calculation with the constraint that the graphene sheet contains one extra hole and the molecule one extra electron. This gives the energy .
The charge transfer energy for removing an electron from the molecule and placing it on the graphene sheet is then . Similarly, that for the transfer of an electron from the graphene sheet to the molecule is . Since in each run the cell remains charge neutral, there is no need here to apply any additional corrections. However, we have to keep in mind that this method is best used when the two subsystems are well separated so that the amount of charge localized on each subsystem is a well defined quantity.
In our calculations we use the CDFT implementation Souza et al. (2013) for the popular DFT package SIESTASoler et al. (2002), which adopts a basis set formed by a linear combination of atomic orbitals (LCAO). The constrain is introduced in the form of a projection over a specified set of basis orbitals and in particular use the Lowdin projection scheme. Throughout this work we adopt double-zeta polarized basis set with an energy cutoff of 0.02 Ry. The calculations are done with norm-conserving pseudopotential and the LDA is the exchange-correlation functional of choice. A mesh cutoff of 300 Ry has been used for the real-space grid. We impose periodic boundary conditions with different cell-sizes and the -space grid is varied in accordance with the size of the unit cell. For instance, an in plane 55 -grid has been used for a 1313 graphene supercell.
Result And Discussion
Single Benzene on pristine Graphene
We begin this section with a discussion on the equilibrium distance for a benzene molecule adsorbed on graphene. This is obtained by simply minimizing the total energy difference , where is the total energy for the cell containing benzene on graphene, while () is the total energy of the same cell when only the benzene (graphene) is present. This minimization is performed for two different orientations of the benzene molecule with respect to the graphene sheet: the hollow (H) configuration, in which all the carbon atoms of the benzene ring are placed exactly above the carbon atoms of graphene, and the stack (S) configuration, in which alternate carbon atoms of the benzene molecule are placed directly above carbon atoms of the graphene sheet [see Fig. 1(a,b)]. For the H configuration we find an equilibrium distance of 3.4 Å, while for the S one this becomes 3.25 Å. These results are in fair agreement with another LDA theoretical study Zhang et al. (2010) (predicting 3.4 Å and 3.17 Å respectively for for the H and S orientations). Note that a more precise evaluation of such distances requires the use of van der Waals corrected functionals. This exercise, however, is outside the scope of our work and here we just wish to establish that the equilibrium distance is large enough for our constrain to remain well defined. It can also be noted that the equilibrium distance of 3.6 Å obtained with a vdW-DF study Chakarova-Käck et al. (2006) is not very different from our LDA result.


We then study the dependence of the charge transfer energies on the size of the graphene unit cell used. This is achieved by looking at the charge transfer gap, , as a function of the unit cell size at various molecule-to-graphene distances (see Fig. 2). When the molecule is very close to the graphene sheet, after transferring an electron, the image charge is strongly attracted by the oppositely charged molecule and thereby remains highly localized. However, as the molecule moves away from the substrate, the attraction reduces since the Coulomb potential decays with distance, resulting in a delocalization of the image charge. This will eventually spread uniformly all over the graphene sheet in the limit of an infinite distance. If the unit cell is too small, the image charge will be artificially over-confined, resulting in an overestimation of and and, as a consequence, of the charge transfer energies. This effect can be clearly seen in Fig. 2, where we display the variation of the charge transfer energies as a function of the cell size. Clearly, for the shorter distance (3.4 Å corresponding to the average equilibrium distance), the energy gap converges for supercells of about 1010 (1010 graphene primitive cells). At the larger distance of 6.8 Å the same convergence is achieved for a 1313 supercell.

Next we compute the charge transfer energies as a function of the distance between the sheet and the molecule. In order to compare our results with the gap expected in the limit of an infinite distance, we need to evaluate first the ionization potential, , and the electron affinity, , of the isolated benzene molecule. This is also obtained in terms of total energy differences between the neutral and the positively and negatively charged molecule, namely with the SCF method. This returns a quasiparticle energy gap, , of 11.02 eV, in good agreement (within 4.5%) with the experimental value Clare and Sowerby (1981); Burrow et al. (1987). Likewise we also determine the Fermi level () of graphene, which is found to be 4.45 eV.
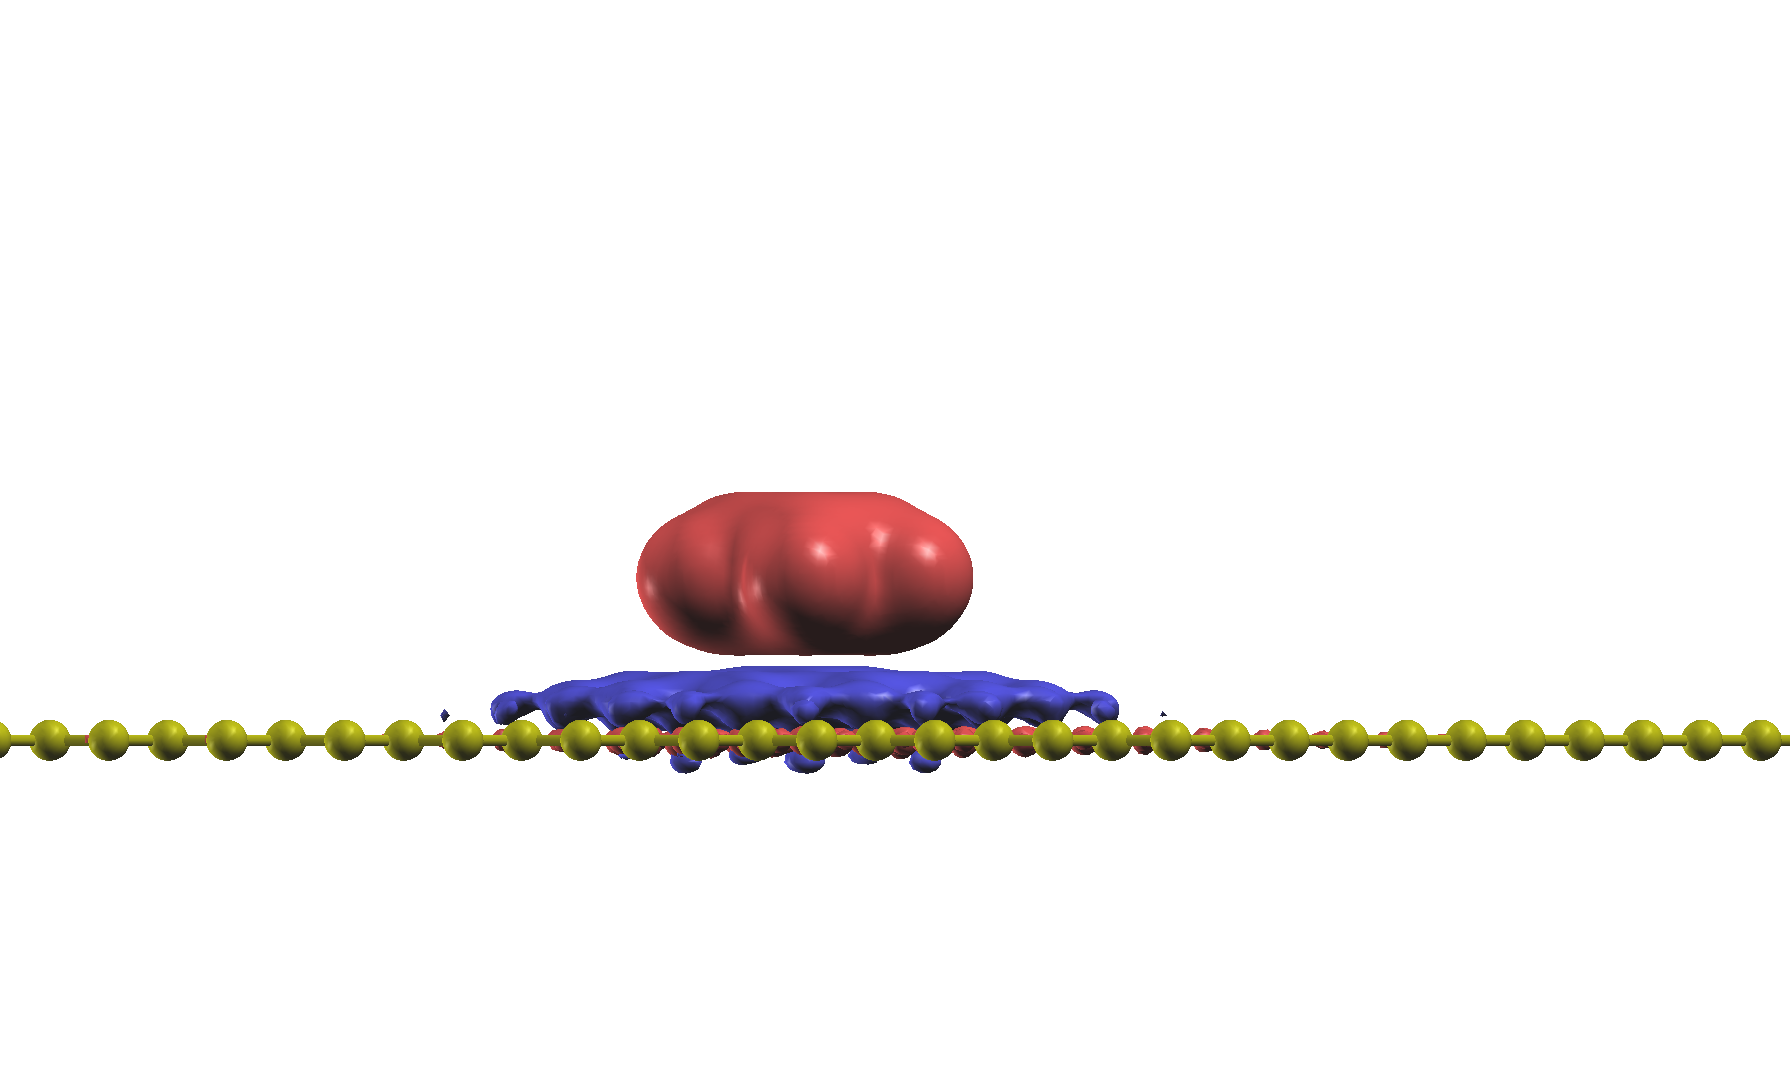
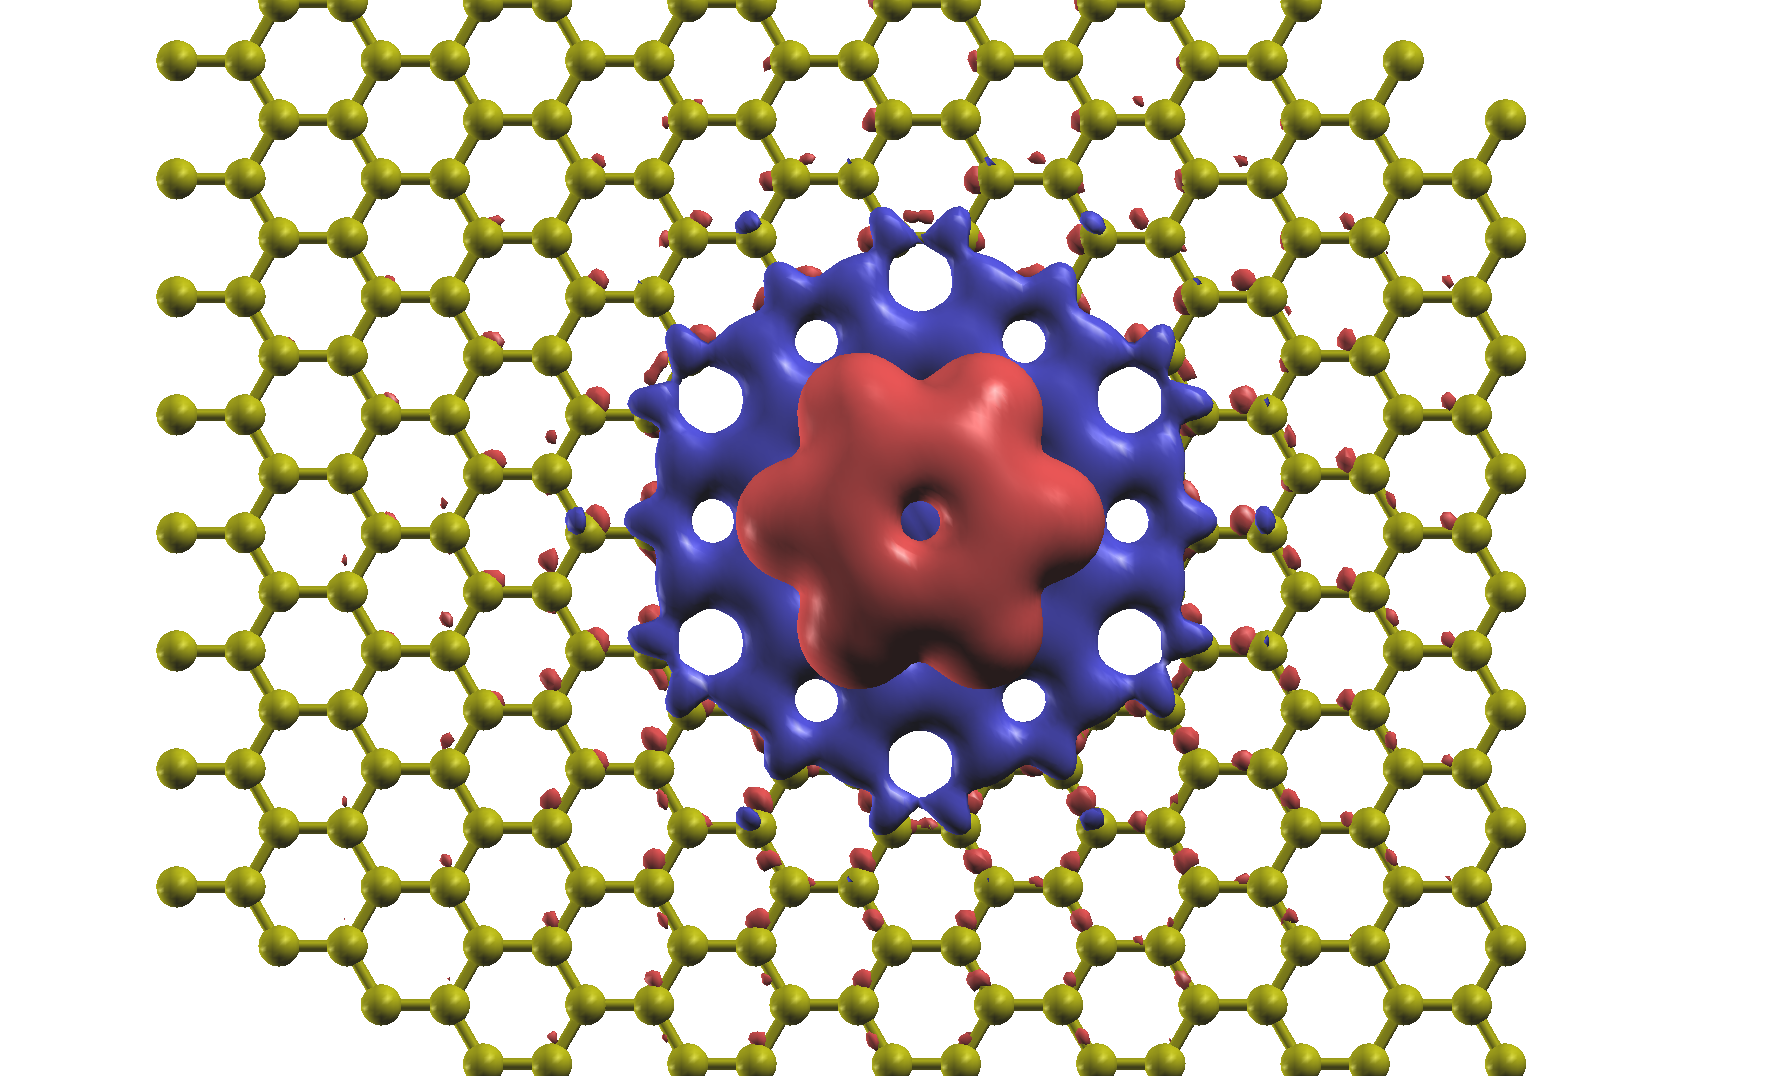
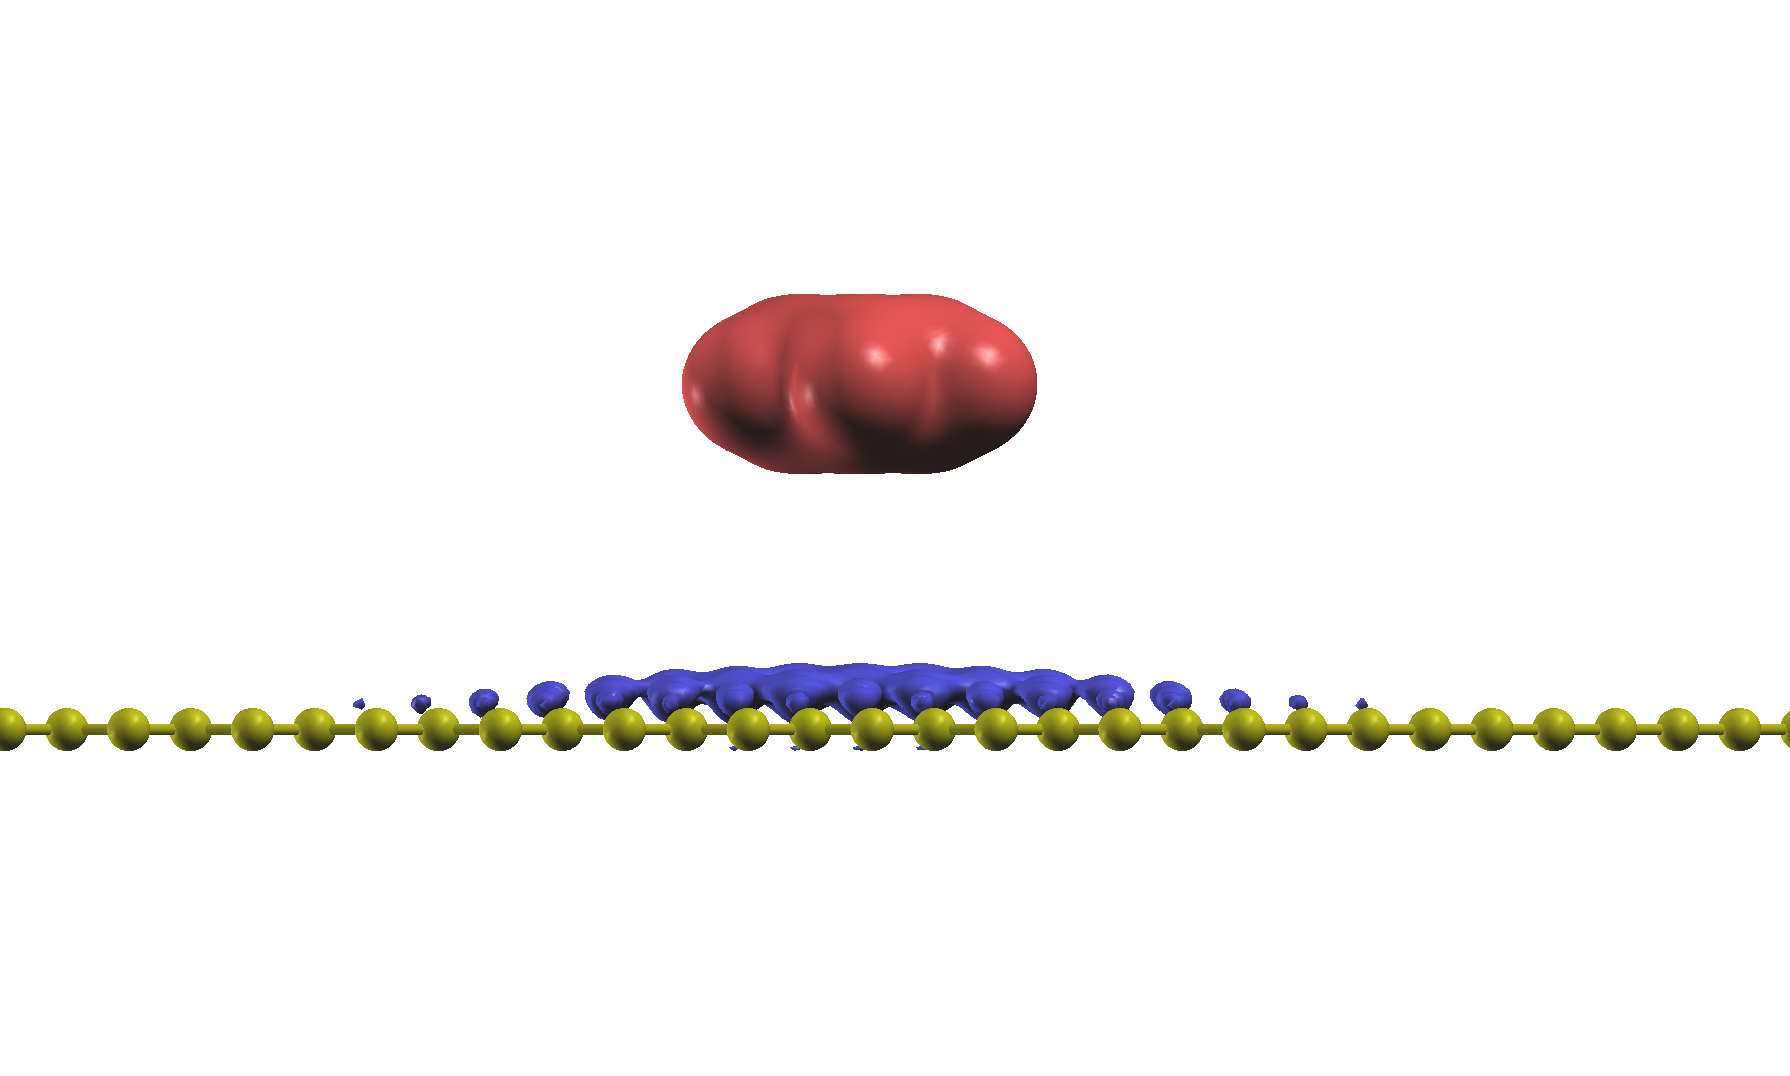
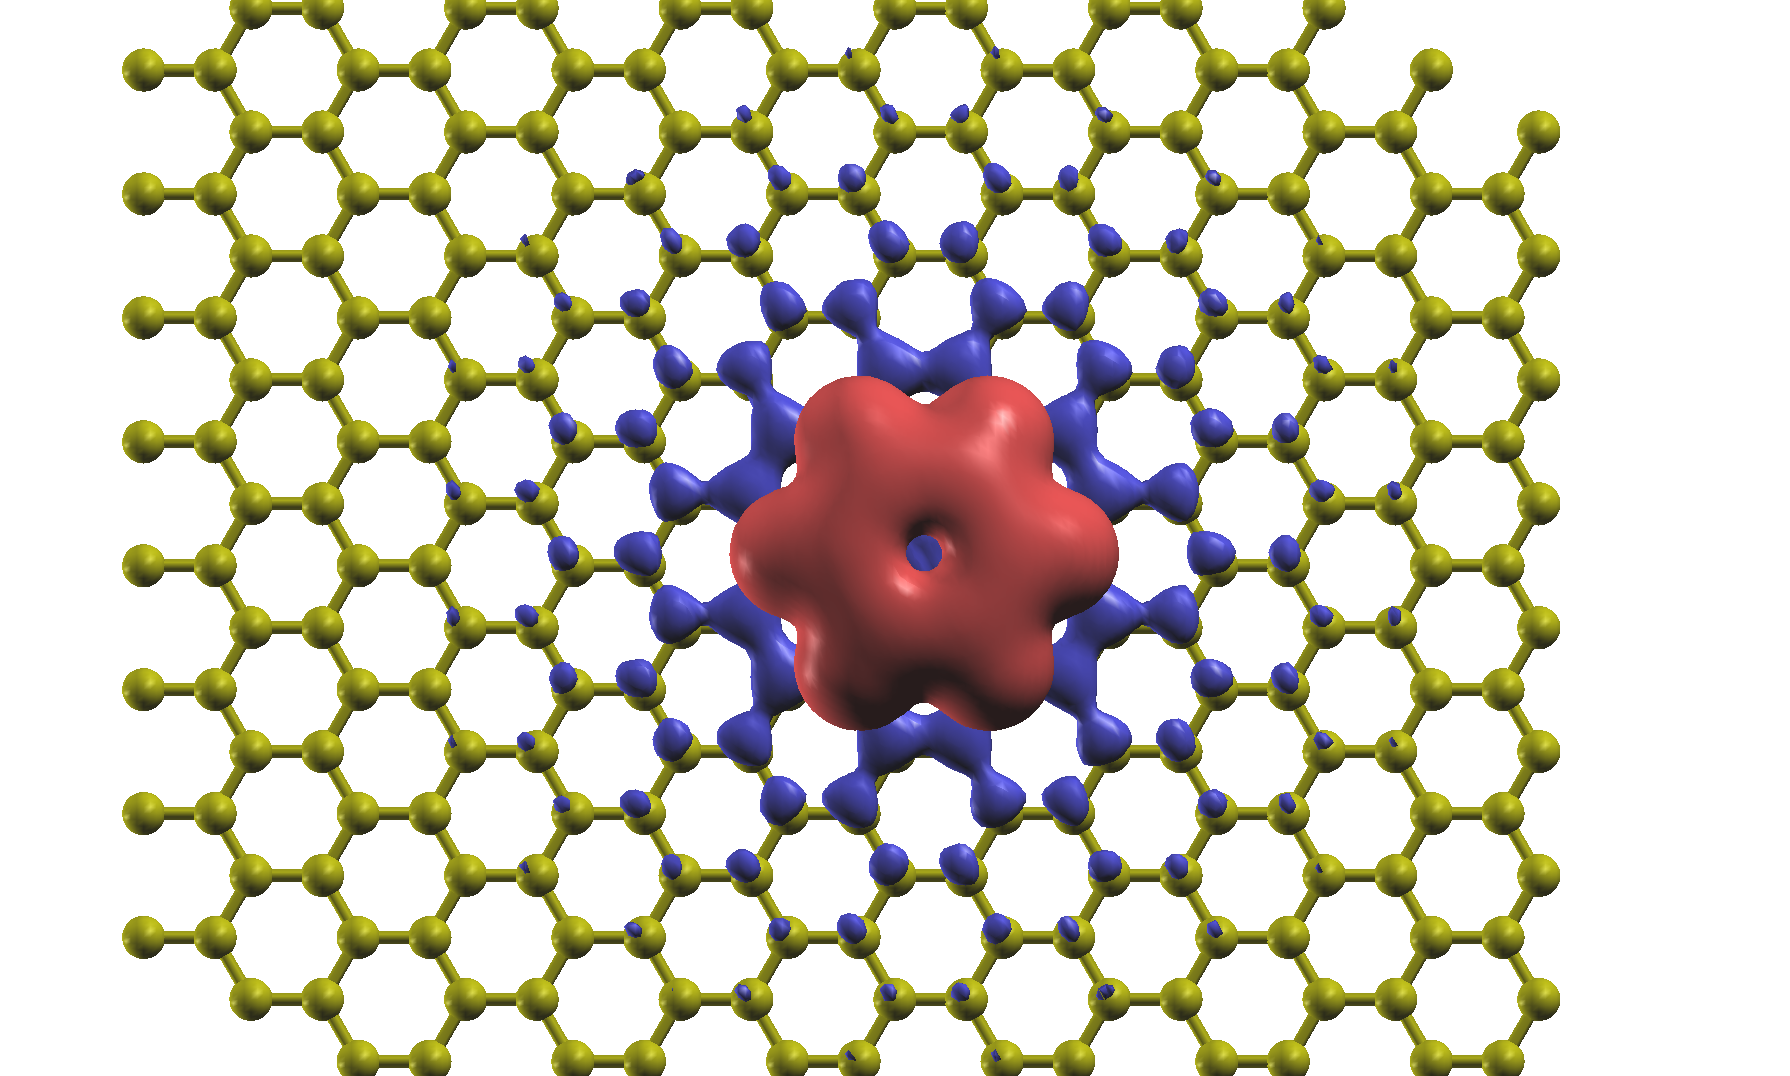
In Fig. 3(a) we show the change in the charge transfer energy gap with the distance of the benzene from the graphene sheet for the H configuration. As expected, when the molecule is close to the surface, there is a considerably large attraction between the image charge and the opposite charge excess on the molecule, resulting in an additional stabilization of the system and a reduction in magnitude of and . Hence, in such case the charge transfer energies have a reduced magnitude and the charge transfer gap is smaller than that in the gas phase. Then, as the molecule moves away from the graphene sheet, the charge transfer energies increase and so does the charge transfer energy gap until it eventually reaches the value corresponding to the HOMO-LUMO gap of the isolated molecule in the limit of an infinite distance. In Figs. 3(b), (c) ,(d) and (e) we show the excess charge-density, , in different parts of the system after transferring one electron for two different molecule-to-graphene distances. The excess charge-density is defined as , where and are respectively the charge densities of the system before and after the charge transfer. Thus the portion of localized on the graphene sheet effectively corresponds to the image charge profile. Clearly, due to the stronger Coulomb attraction, the image charge is more localized for Å than for Å. At equilibrium for the S configuration, Å, the charge transfer energy gap is calculated to be 8.91 eV, which is in good agreement (within 4%) with the gap obtained by Despoja et al. (2013). In Table 1, for the purpose of comparison, we have listed the charge transfer energies and charge transfer gaps for two different heights, 3.4 Å and 6.8 Å, and in different configurations. The most notable feature is that for the case of a pristine graphene substrate the specific absorption site plays little role in determining the charge transfer levels alignment.
Benzene on graphene with Stone-Wales defect
In general actual graphene samples always display lattice imperfections Banhart et al. (2001). In order to determine the effect of such structural defects on the CT energies, we consider a reference system where a Stone-Wales (SW) defect (in which a single C-C bond is rotated by 90∘) is present in the graphene sheet. We have then calculated for two different positions of the molecule with respect to the defect on the sheet, namely the position, in which the molecule is placed right above the defect and the position, in which it is placed above the sheet far from the defect (see Fig. 1).
Our findings are listed in Tab. 1, where we report the charge transfer energies for both the configurations, assuming the molecule is kept at the same distance from the graphene sheet. From the table it is evident that the structural change in graphene due to presence of such defect does not alter the charge transfer energies of the molecule. This is because the image charge distribution on graphene is little affected by presence of the SW defect. In addition, the density of states (DOS) of graphene remains almost completely unchanged near its Fermi energy after introducing such defect as can be seen in Fig. 4, which shows that the partial density of states (PDOS) of the atoms forming the SW defect has no significant presence near the Fermi level. Thus, after the charge transfer, the electron added to (or removed from) the graphene sheet has the same energy that it would have in the absence of the defect, i.e. it is subtracted (added) from a region of the DOS where there is no contribution from the SW defect. In this context, it is noteworthy that a study Despoja et al. (2013) has concluded that altering the structure of pristine graphene by introducing dopant (which raises the Fermi level of graphene by 1 eV) also has minor effect on the QP gap of benzene, reducing it by less than 3%.

| Configuration | (Å) | (eV) | (eV) | (eV) |
|---|---|---|---|---|
| H | 3.4 | 4.32 | -4.81 | 9.13 |
| H | 6.8 | 4.95 | -5.72 | 10.67 |
| 3.4 | 4.30 | -4.78 | 9.08 | |
| 3.4 | 4.34 | -4.83 | 9.17 | |
| S | 3.4 | 4.33 | -4.81 | 9.14 |
| 3.4 | 4.12 | -4.76 | 8.88 | |
| 6.8 | 4.73 | -5.64 | 10.37 | |
| 3.4 | 4.27 | -4.62 | 8.89 |
Multiple benzene molecules adsorbed on graphene
In real interfaces between organic molecules and a substrate, molecules usually are not found isolated but in proximity to others. It is then interesting to investigate the effects that the presence of other benzene molecules produce of the charge transfer energies of a given one. To this end we select three representative configurations. In the first one, , the graphene sheet is decorated with two benzene molecules, one at 3.4 Å while the other is placed above the first at 6.8 Å from the graphene plane. We then calculate the charge transfer energies of the middle benzene (the one at 3.4 Å from the sheet). The excess charge on different parts of the system (image charge), after transferring one electron to the sheet, is displayed in Fig. 5(a) and Fig. 5(b). The second configuration, , is identical to the first one but now we calculate the charge transfer energies of the molecule, which is farther away from the graphene sheet, namely at a distance of 6.8 Å. For this configuration, the excess charge after a similar charge transfer is shown in Fig. 5(c) and Fig. 5(d). In the third configuration, , we arrange multiple benzene molecules in the same plane. The molecules are in close proximity with each other although their atomic orbitals do not overlap. Charge transfer energies are then calculated with respect to one benzene molecule keeping the others neutral and an isovalue plot for similar charge transfer is shown in Fig. 5(e) and Fig. 5(f).
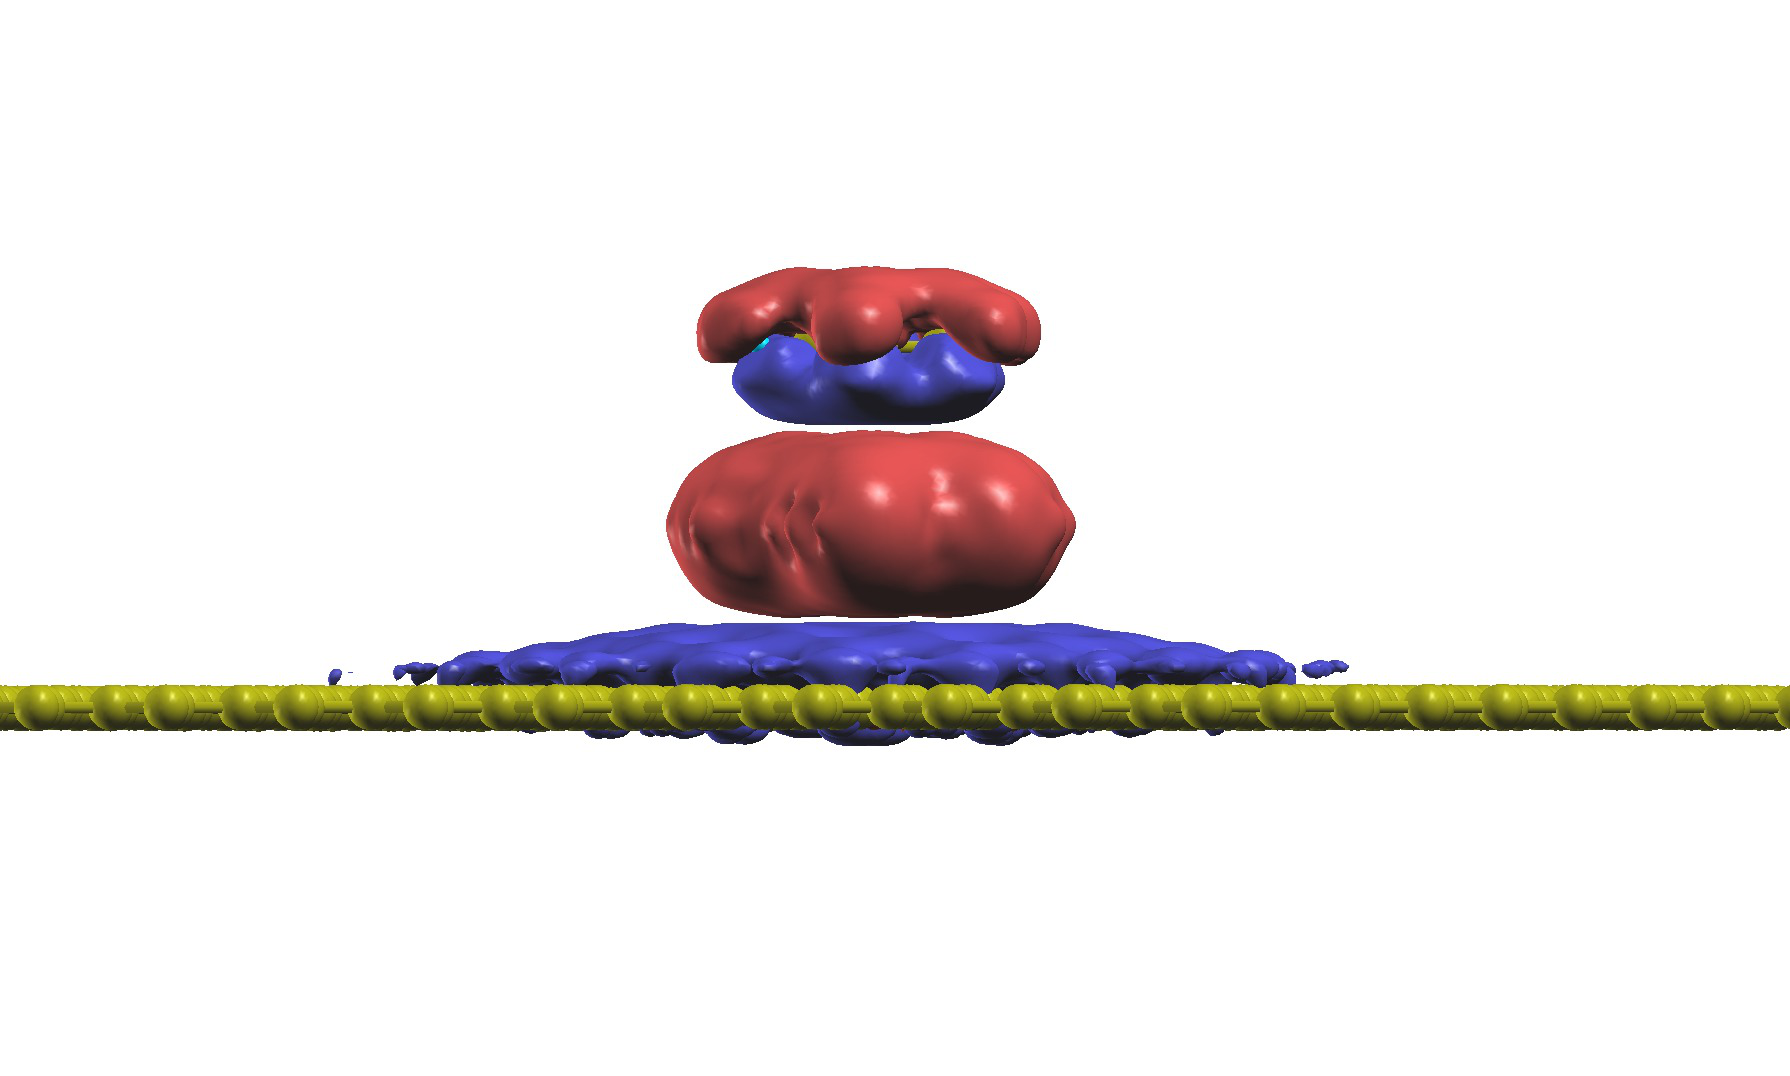

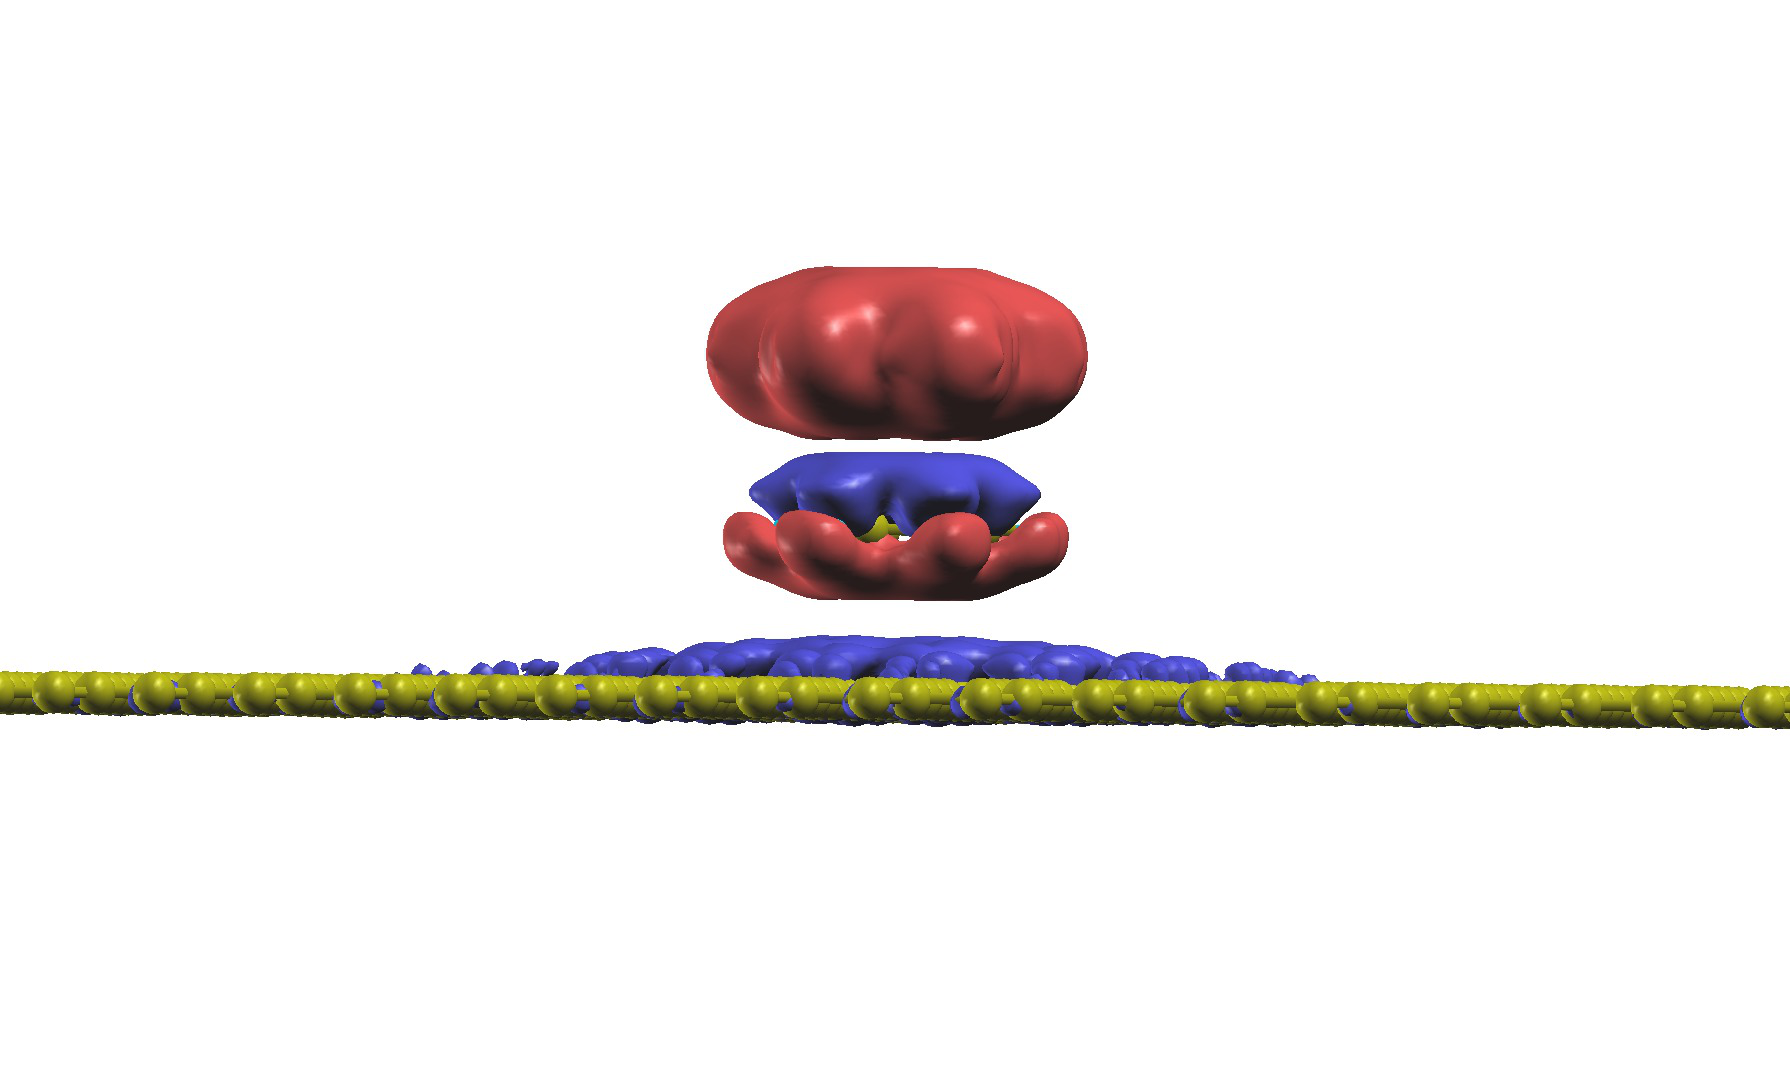


The charge transfer energies calculated for these three configurations are shown in Tab. 1. If one compares configurations where the molecule is kept at the same distance from the graphene plane, such as the case of H( Å), and or of H( Å) and , it appears clear that the presence of other molecules has some effect on the charge transfer energies. In particular we observe than when other molecules are present both and get more shallow, i.e. their absolute values is reduced. Interestingly the relative reduction of and depends on the details of the positions of the other molecules (e.g. it is different for and ) but the resulting renormalization of the HOMO-LUMO gap is essentially identical [about 25 meV when going from H( Å) to either or ].
This behaviour can be explained in terms of a simple classical effect. Consider the case of for example. When one transfers an electron from the middle benzene to the graphene sheet the second benzene molecule, placed above the first, remains neutral but develops an induced charge dipole. The moment of such dipole points away from the charged benzene and lowers the associated electrostatic potential. Importantly, also the potential of graphene will be lowered. However, since the potential generated by an electrical dipole is inversely proportional to the square of distance, the effect remains more pronounced at the site of the middle benzene than at that of the graphene sheet. A similar effect can be observed for an electron transfer from the graphene sheet to the middle benzene and for the configuration.
In the case of , the system comprising the topmost benzene (from which we transfer charge) and the graphene plane can be thought of as a parallel-plate capacitor. The work, , done to transfer a charge from one plate to the other is where is the capacitance, which in turn is proportional to the dielectric constant of the medium enclosed between the plates. Hence, at variance with the case of H(d=6.8 Å), the space in between the molecule and the graphene sheet is occupied by a molecule with finite dielectric constant and not by vacuum. This results in a reduction of , so that the charge transfer energies for are smaller than those for H(d=6.8 Å).
Classical electrostatic approximation
Finally, we show that our calculated energy levels alignment can be obtained from a classical electrostatic model. If one approximates the transferred electron as a point charge and the substrate where the image charge forms as an infinite sheet of relative permittivity then, for a completely planar distribution of the bound surface charge, the work done by the induced charge to take an electron from the position of the molecule (at a distance ) to infinity is
| (5) |
Hence, this electrostatic approximation predicts that the presence of the substrate lowers the of the molecule by with respect to the corresponding gas-phase value. However, the actual image charge is not strictly confined to a 2D plane but instead spills out over the graphene surface. We can account for such non-planar image charge distribution by introducing a small modification to the above expression Lang and Kohn (1971) and write the LUMO at a height as
| (6) |
where is the distance between the centre of mass of the image charge and the substrate plane and is the gas-phase LUMO (the electron affinity). A similar argument for the HOMO level shows an elevation of same magnitude due to the presence of the substrate. In Fig. 6 we plot the charge transfer energies and show that they compare quite well with the curves predicted by the classical model by using an effective dielectric constant of 2.4 for graphene Wunsch et al. (2006). When drawing the classical curves we have used an approximate value, Å, which provides an excellent estimate for smaller distances, . It is worth noting that for larger distances, though the actual value of should be much less, the overall effect of is very small and almost negligible. In the same graph, we have also plotted the classical curves corresponding to benzene on a perfectly metallic () surface. This shows that the level renormalization of benzene for physisorption on graphene is significantly different from that on a perfect metal, owing to the different screening properties of graphene.

Conclusion
We have used CDFT as implemented in the SIESTA code to calculate the energy levels alignment of a benzene molecule adsorbed on a graphene sheet. In general the charge transfer energies depend on the distance between the molecule and the graphene sheet, and this is a consequence of the image charge formation. Such an effect cannot be described by standard Kohn-Sham DFT, but it is well captured by CDFT, which translates a quasi-particle problem into an energy differences one. With CDFT we have simulated the energy level renormalization as a function of the molecule-to-graphene distance. These agree well with experimental data for an infinite separation, where the charge transfer energies coincide with the ionization potential and the electron affinity. Furthermore, an excellent agreement is also obtained with calculations at typical bonding distances. Since CDFT is computationally inexpensive we have been able to study the effects arising from bonding the molecule to a graphene structural defect and from the presence of other benzene molecules. We have found that a Stone-Wales defect does not affect the energy level alignment since its electronic density of state has little amplitude at the graphene Fermi level. In contrast the charge transfer energies change when more then a molecule is present. All our results can be easily rationalized by a simple classical electrostatic model describing the interaction of a point-like charge and a uniform planar charge distribution. This, at variance to the case of a perfect metal, takes into account the finite dielectric constant of graphene.
Acknowledgment
This work is supported by the European Research Council, Quest project. Computational resources have been provided by the supercomputer facilities at the Trinity Center for High Performance Computing (TCHPC) and at the Irish Center for High End Computing (ICHEC). Additionally, the authors would like to thank Dr. Ivan Rungger and Dr. A. M. Souza for helpful discussions.
References
- Dimitrakopoulos and Malenfant (2002) C. Dimitrakopoulos and P. Malenfant, Adv. Mater. 14, 99 (2002).
- Gadzuk (1996) J. W. Gadzuk, Phys. Rev. Lett. 76, 4234 (1996).
- Repp (2005) J. Repp, Phys. Rev. Lett. 94, 026803 (2005).
- Koch (2007) N. Koch, ChemPhysChem 8, 1438 (2007).
- Sanvito (2011) S. Sanvito, Chem. Soc. Rev. 40, 3336 (2011).
- Hohenberg and Kohn (1964) P. Hohenberg and W. Kohn, Phys. Rev. 136, B864 (1964).
- Janak (1978) J. F. Janak, Phys. Rev. B 18, 7165 (1978).
- Becke (1993) A. D. Becke, J. Chem. Phys. 98, 1372 (1993).
- Pemmaraju et al. (2007) C. D. Pemmaraju, T. Archer, D. Sánchez-Portal, and S. Sanvito, Phys. Rev. B 75, 045101 (2007).
- Filippetti et al. (2011) A. Filippetti, C. D. Pemmaraju, S. Sanvito, P. Delugas, D. Puggioni, and V. Fiorentini, Phys. Rev. B 84, 195127 (2011).
- Refaely-Abramson et al. (2012) S. Refaely-Abramson, S. Sharifzadeh, N. Govind, J. Autschbach, J. B. Neaton, R. Baer, and L. Kronik, Phys. Rev. Lett. 109, 226405 (2012).
- Egger et al. (2014) D. A. Egger, S. Weissman, S. Refaely-Abramson, S. Sharifzadeh, M. Dauth, R. Baer, S. Kümmel, J. B. Neaton, E. Zojer, and L. Kronik, J. Chem. Theory Comput. 10, 1934 (2014).
- Thygesen and Rubio (2009) K. S. Thygesen and A. Rubio, Phys. Rev. Lett. 102, 046802 (2009).
- Hybertsen and Louie (1986) M. S. Hybertsen and S. G. Louie, Phys. Rev. B 34, 5390 (1986).
- Neaton et al. (2006) J. B. Neaton, M. Hybertsen, and S. Louie, Phys. Rev. Lett. 97, 216405 (2006).
- Wu and Voorhis (2005) Q. Wu and T. V. Voorhis, Phys. Rev. A 72, 024502 (2005).
- Souza et al. (2013) A. M. Souza, I. Rungger, C. D. Pemmaraju, U. Schwingenschloegl, and S. Sanvito, Phys. Rev. B 88, 165112 (2013).
- Ferrari et al. (2015) A. C. Ferrari et al., Nanoscale 7, 4598 (2015).
- Wang et al. (2015) Y. Wang, J. Torres, A. Stieg, S. Jiang, M. Yeung, Y. Rubin, S. Chaudhuri, X. Duan, and R. Kaner, ACS Nano (2015).
- AlZahrani (2010) A. AlZahrani, Appl. Surf. Sci. 257, 807 (2010).
- Chakarova-Käck et al. (2006) S. D. Chakarova-Käck, E. Schröder, B. I. Lundqvist, and D. C. Langreth, Phys. Rev. Lett. 96, 146107 (2006).
- Zhang et al. (2010) Y.-H. Zhang, K.-G. Zhou, K.-F. Xie, J. Zeng, H.-L. Zhang, and Y. Peng, Nanotechnology 21, 065201 (2010).
- Despoja et al. (2013) V. Despoja, I. Lončarić, D. J. Mowbray, and L. Marušić, Phys. Rev. B 88, 235437 (2013).
- Soler et al. (2002) J. M. Soler, E. Artacho, J. D. Gale, A. García, J. Junquera, P. Ordejón, and D. Sánchez-Portal, J. Phys. Condens. Matter 14, 2745 (2002).
- Clare and Sowerby (1981) P. Clare and D. B. Sowerby, J. Inorg. Nucl. Chem. 43, 477 (1981).
- Burrow et al. (1987) P. Burrow, J. A. Michejda, and K. D. Jordan, J. Chem. Phys. 86, 9 (1987).
- Banhart et al. (2001) F. Banhart, J. Kotakoski, and A. V. Krasheninnikov, ACS Nano 5, 26 (2001).
- Lang and Kohn (1971) N. D. Lang and W. Kohn, Phys. Rev. B 3, 1215 (1971).
- Wunsch et al. (2006) B. Wunsch, T. Stauber, F. Sols, and F. Guinea, New J. Phys. 8, 318 (2006).