X-ray scattering study of pyrochlore iridates: crystal structure, electronic and magnetic excitations
Abstract
We have investigated the structural, electronic, and magnetic properties of the pyrochlore iridates and using a combination of resonant elastic x-ray scattering, x-ray powder diffraction, and resonant inelastic x-ray scattering (RIXS). The structural parameters of have been examined as a function of temperature and applied pressure, with a particular emphasis on regions of the phase diagram where electronic and magnetic phase transitions have been reported. We find no evidence of crystal symmetry change over the range of temperatures (6 to 300 K) and pressures (0.1 to 17 GPa) studied. We have also investigated the electronic and magnetic excitations in single crystal samples of and using high resolution Ir L3-edge RIXS. In spite of very different ground state properties, we find these materials exhibit qualitatively similar excitation spectra, with crystal field excitations at 3-5 eV, spin-orbit excitations at 0.5-1 eV, and broad low-lying excitations below 0.15 eV. In we observe highly damped magnetic excitations at 45 meV, which display significant momentum dependence. We compare these results with recent dynamical structure factor calculations.
I Introduction
The pyrochlore iridates (R = Y or rare-earth lanthanides) possess a unique combination of extended 5d orbitals, strong electronic correlations, small magnetic moments, geometric frustration, and large spin-orbit coupling effects. In the case of R = Pr, these features appear to give rise to a novel metallic spin liquid ground state and an anomalous Hall effectNakatsuji et al. (2006); Machida et al. (2007, 2010); Lee et al. (2013a). In the case of R = Eu, Y, Nd, Sm, and Lu, these features have been predicted to give rise to new topological phases, such as the Weyl semi-metal stateWan et al. (2011); Balents (2011); Witczak-Krempa and Kim (2012). Unlike a topological insulator, which has the bulk electronic properties of an insulator with topologically protected conducting states on the surface, the Weyl semi-metal has both surface and bulk states at the Fermi surface. The low energy bulk band structure is described by a Dirac quasiparticle-like linear dispersion, while the surface states are characterized by a Fermi arc. Furthermore, while topological insulators require time-reversal symmetry, the Weyl semi-metal is realized in three-dimensional magnetic solids which break time-reversal symmetry. Therefore, a significant amount of theoretical work has gone into determining the magnetic ground state of the systemsWan et al. (2011); Witczak-Krempa and Kim (2012); Maiti (2009); Yang and Kim (2010). In particular, the Weyl semi-metal phase in has been predicted to display an all-in/all-out spin configurationWan et al. (2011). In the all-in/all-out structure, the spins at the four corners of each Ir-tetrahedron point directly inwards (all-in) or outwards (all-out) along the local 111 direction (i.e. towards or away from the center of the tetrahedron), while the spins on each neighboring tetrahedron align in the opposite direction. A detailed theoretical account of Weyl semi-metal physics and other topological phases is provided in recent review articles Witczak-Krempa et al. (2014); Vafek and Vishwanath (2014).
Experimentally, bulk characterization measurementsTaira et al. (2001); Yanagishima and Maeno (2001); Matsuhira et al. (2007, 2011); Zhao et al. (2011); Ishikawa et al. (2012) on the R2Ir2O7 series provide evidence of a magnetic phase transition at temperatures ranging from = 36 K (R = Nd) to 150 K (R = Y). In the case of R = Nd, Sm, and Eu, this magnetic transition is also accompanied by an electronic transition from metal to insulator. Magnetic susceptibility measurements on (R = Y, Sm, Eu, and Lu) reveal a small anomaly at and significant hysteresis between field-cooled and zero-field-cooled curves Taira et al. (2001); Matsuhira et al. (2007, 2011); Ishikawa et al. (2012). This has been interpreted as evidence of either a spin glass Taira et al. (2001) or a more complicated antiferromagnetic state Matsuhira et al. (2007). Muon spin rotation (SR) measurements performed on by Zhao et al. suggest the presence of commensurate long-range order below K Zhao et al. (2011). A similar result has also been reported for Yb2Ir2O7 with = 130 KDisseler et al. (2012a). However, SR studies on , Sm2Ir2O7, and Y2Ir2O7 indicate that only short-range (i.e. spin-glass-like) magnetic order develops in the hysteretic region below , with true long-range order only forming at much lower temperaturesDisseler et al. (2012b); Graf et al. (2014); Disseler et al. (2012a). In a recent analysis by Disseler it is argued that SR data on and is only consistent with an all-in/all-out magnetic structureDisseler (2014).
Although bulk susceptibility and SR studies have clearly established the presence of broken time-reversal symmetry in these compounds, very little direct information regarding the ordered moment direction and periodicity is available to test theoretical predictions. Since Ir is a strong neutron absorber, studying iridate compounds with neutron scattering is technically challenging. Nevertheless, several attempts have been made to study magnetic order in pyrochlore iridates using neutron powder diffraction. Disseler et al. were unable to detect a magnetic signal in their neutron powder diffraction study of Disseler et al. (2012b). Similarly, Shapiro and coworkersShapiro et al. (2012) did not detect ordering of Ir moments in their study of . However, the latter measurements did establish an upper limit on the size of the possible Ir ordered moment, which was set at 0.2 (for ) or 0.5 (for q = 0). This result was subsequently confirmed by Disseler et al.Disseler et al. (2012a)
Indirect confirmation of the all-in/all-out structure has been provided by two recent neutron and x-ray diffraction experiments. In their neutron study of , Tomiyasu et al.Tomiyasu et al. (2012) were able to detect magnetic intensity at low temperatures due to the ordering of Nd moments, even though Ir ordering was below the experimental detection limit. Nd moments were found to order in an all-in/all-out fashion, leading the authors to conclude that Ir moments were likely to adopt the same configuration. In a recent resonant x-ray diffraction experiment on Eu2Ir2O7, Sagayama et al.Sagayama et al. (2013) directly observed the ordering of Ir magnetic moments with a wave vector of q = 0. Unfortunately, this result alone does not provide sufficient information to unambiguously determine the spin structure. However, Sagayama and coworkers were able to argue that the all-in/all-out structure is the only symmetry allowed spin structure which does not result in a structural distortion, and showed that the crystal symmetry remains unchanged across Sagayama et al. (2013). This lack of structural symmetry change at is supported by recent high-resolution x-ray powder diffraction measurementsTakatsu et al. (2014). However, these results are at odds with previous Raman scattering measurements on R = Eu and Sm pyrochlores, which report the appearance of new peaks below Hasegawa et al. (2010).
The physics of pyrochlore iridates can also be explored by applying hydrostatic pressure. High pressure transport studies have revealed new electronic phases in both Sakata et al. (2011) and Tafti et al. (2012). In the case of Eu2Ir2O7, Tafti et al. discovered a pressure-induced electronic transition at 6 GPa. At low temperature (T ), applied pressure drives Eu2Ir2O7 from an insulator to an unconventional metal (/ 0 and non-Fermi-liquid-like temperature dependence). At high temperature (T ), applied pressure drives the system from an incoherent metal (high resistivity, power law temperature dependence, and / 0) to a conventional metallic state (/ 0). The value of for Eu2Ir2O7 was found to exhibit very little pressure dependence up to 12 GPa. In the case of Nd2Ir2O7, Sakata et al. found that the metal-insulator transition is gradually suppressed by applied pressure, with the insulating state disappearing above 10 GPa. A new low temperature transition is observed in the pressure-induced metallic state, accompanied by a drop in resistivity and potential ferromagnetic (2-in/2-out) ordering of Nd moments. Whether the structure of these materials stays the same in these high pressure phases remains unknown. A careful investigation of structural symmetry is therefore extremely important for our understanding of these new pressure-induced electronic states.
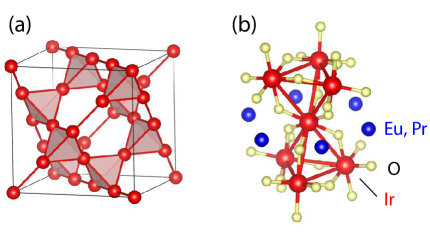
Even in the absence of a distinct transition or crystal symmetry change, variations in structural parameters appear to play a key role in determining the electronic and magnetic properties of the pyrochlore iridates. In particular, previous experimental work has shown that both of these properties are highly sensitive to the A-site cation size Taira et al. (2001); Yanagishima and Maeno (2001). As shown in Fig. 1, the pyrochlore crystal structure is described by space group (#227), with A-site atoms at the 16d position (0.5, 0.5, 0.5), Ir at the 16c position (0, 0, 0), O1 at 48f (, 0.125, 0.125), and O2 at 8a (0.375, 0.375, 0.375). Only two free parameters in this structure – the lattice constant and the -coordinate associated with the O1 site – are adjustable. All pyrochlore iridates have larger than the value for an ideal IrO6 octahedra (), indicating that a compressive trigonal distortion is present. Larger A-site ions tend to result in a smaller distortion, which is believed to be responsible for increased hopping and a stronger metallic characterWitczak-Krempa et al. (2014).
The examples above illustrate the importance of structural details in determining the electronic and magnetic properties of pyrochlore iridates. In the first half of this article, we report comprehensive x-ray diffraction measurements which address several of the unresolved questions raised above. First, we present a resonant x-ray diffraction study of temperature dependence in single crystal . We observe x-ray diffraction peaks which violate structure factor extinction rules when x-ray energy is tuned near the Ir L3 absorption edge. These peaks arise from so-called Templeton scattering, which reflects the anisotropic charge distribution near the iridium atoms and is very sensitive to local structural distortions. We observe no significant changes in peak intensity as the sample passes through the magnetic transition at , supporting the idea that the magnetic transition in Eu2Ir2O7 occurs without structural distortion. We also present an x-ray powder diffraction study of as a function of applied pressure up to 17 GPa. We observe no evidence of structural transitions induced by applied pressure, and find that all structural parameters evolve monotonically over the range of pressures studied. Therefore, our results suggest that the pressure-induced metal-insulator transition observed by Tafti et al.Tafti et al. (2012) is of purely electronic origin.
We were unable to detect magnetic Bragg peaks associated with magnetic order in our resonant x-ray diffraction studies. However, the magnetic ordering wave vector, q, can often be revealed by studying the momentum dependence of magnetic excitations. We have thus carried out a Resonant Inelastic X-ray Scattering (RIXS) investigation to study the magnetic excitation spectrum of single crystal , which will be discussed in the second half of this article. RIXS is a second-order scattering process which can be used to probe elementary excitations involving spin, orbital, charge, and lattice degrees of freedom Ament et al. (2011a, b). RIXS has made particularly significant contributions to our understanding of the physics of iridates Kim et al. (2012a, b, 2014); Gretarsson et al. (2013a, b); Liu et al. (2012); Yin et al. (2013); Moretti Sala et al. (2014); Lupascu et al. (2014). Among its many advantages, RIXS only requires very small sample volumes, and is unaffected by the neutron absorption issues which hinder inelastic neutron studies. The d-d excitations (or spin-orbit excitations) of and have been studied in earlier work by combined RIXS and theoretical quantum chemistry calculations Hozoi et al. (2014).
In this article, we report low energy magnetic excitations in single crystal . Unlike the insulating iridates and Sr3Ir2O7, in which well-defined magnon modes have been observedKim et al. (2012a, b), here we find only a highly damped excitation, with weak momentum dependence and a very broad peak width. This result is found to be consistent with theoretical calculations of the dynamic structure factor for all-in/all-out magnetic order in the intermediate-coupling regime. RIXS measurements on single crystal reveal a very similar excitation spectrum, distinguished by larger non-cubic crystal field splitting and a broad, low-lying feature which may be attributed to paramagnetic fluctuations.
II Experimental methods and sample characterization
For resonant elastic and inelastic scattering experiments, single crystal samples of and were grown using KF flux methods. As noted in Ref. Hozoi et al., 2014, resistivity measurements performed on the resulting single crystal revealed almost metallic behavior, with a residual resistivity ratio of / 0.7. Issues with sample stoichiometry are known to be very common in this family of materialsIshikawa et al. (2012), and this result was initially interpreted as evidence of a slight excess of Ir. However, subsequent characterization via electron probe microanalysis (EPMA) has revealed that the actual sample composition is Eu-rich: Eu2(1-x)Ir2(1+x)O7+δ with x = -0.09(2) and = 0.06(2). A thorough investigation of disorder and sample stoichiometry effects on the transport properties of is provided in Ref. Ishikawa et al., 2012. The Eu-rich region of the Eu2(1-x)Ir2(1+x)O7+δ phase diagram has received comparatively little attention. In our sample, we find that x = -0.09 is sufficient to split the transition at 120 K into separate magnetic ( 155 K) and electronic ( 60 K) phase transitions. Electrical resistivity and magnetic susceptibility data for this sample can be found in the supplemental material accompanying this article. A comparison with recent measurements on “near-stoichiometric” Eu2Ir2O7 (x 0.05)Uematsu et al. (2015) shows that the high energy RIXS spectrum exhibits very little stoichiometry dependence (i.e. the d-d excitations are essentially unchanged).
For x-ray powder diffraction experiments, a polycrystalline sample of was synthesized using standard solid-state reaction methods. A mixture of and with purity of 99.99% was ground in a stoichiometric molar ratio, pelletized, and then heated in air at 1000 ∘C for 100 hours. The resulting material was reground, pressed into pellets, and resintered at the same temperature for an additional 150 hours, with two intermediate regrindings. The phase purity of the sample was verified by x-ray powder diffraction, and the sample stoichiometry was determined from Rietveld refinements. The polycrystalline sample was found to be slightly Ir-rich, with a composition of Eu1.97Ir2.03O7 (x = 0.015(6)).
Resonant x-ray scattering measurements were performed on single crystal using beamline 6-ID-B at the Advanced Photon Source. The incident x-ray energy was tuned near the Ir L3 absorption edge at 11.22 keV. Incident photons were linearly polarized perpendicular to the vertical scattering plane ( polarization). Resonant magnetic scattering rotates the plane of linear polarization into the scattering plane ( polarization). In contrast, charge scattering does not change the polarization of the scattered photons. As a result, polarization analysis of the scattered beam can be used to distinguish the magnetic () and charge () scattering contributions. The (3,3,3) reflection from single crystal aluminum was used as a polarization and energy analyzer ( 90.3∘). The sample was mounted on the coldfinger of a closed-cycle refrigerator capable of reaching temperatures from 6 K to 300 K. Single crystal Eu2Ir2O7 grows with facets along the 111 direction, and our measurements primarily focused on reflections along or close to the surface normal direction. A series of measurements were also carried out on a second sample with a cut and polished 100 surface. The results from the 100 and 111 surfaces are qualitatively similar, hence only the 111 results will be presented here.
High-pressure x-ray diffraction measurements were performed using the Hard X-ray Micro-Analysis (HXMA) 06ID-1 beamline at the Canadian Light Source. Finely ground Eu2Ir2O7 was loaded into a diamond anvil cell, and measured under applied pressures of up to 17 GPa. The pressure was tuned with a precision of GPa using the R1 fluorescent line from a ruby chip placed inside the sample space. Data sets were collected using two different choices of quasistatic pressure transmitting medium: (1) silicone fluid (polydimethylsiloxane, 1 cSt) and (2) a methanol-ethanol-water (MEW) mixture in a volume ratio of 16:3:1. X-ray diffraction data were collected using angle-dispersive techniques, employing high-energy x rays ( = 24.350 keV) and a MAR345 image plate detector. Additional details of the experimental setup are reported elsewhereSmith and Desgreniers (2009). Structural parameters were extracted from full profile Rietveld refinements carried out using the GSAS software packageLarson and Van Dreele (2000).
RIXS measurements were performed on single crystal and using the MERIX spectrometer on beamline 30-ID-B at the Advanced Photon Source. A double-bounce diamond-(1,1,1) primary monochromator, a channel-cut Si-(8,4,4) secondary monochromator, and a spherical (2 m radius) diced Si-(8,4,4) analyzer crystal were used to obtain an overall energy resolution of 35 meV (full width at half maximum [FWHM]). In order to minimize the elastic background intensity, measurements were carried out in horizontal scattering geometry, focusing on wave vectors in the vicinity of Q = (7.5, 7.5, 7.5) for which the scattering angle is close to 90 degrees.
III Experimental results: structure
III.1 Resonant x-ray diffraction
The pyrochlore crystallizes in the cubic space group with a lattice parameter of Å.Millican et al. (2007) In each unit cell there are 8 formula units, meaning that the theoretically predicted all-in/all-out magnetic order will give rise to q = 0 magnetic Bragg peaks. In addition, there are a number of other non-collinear antiferromagnetic structures, predicted to be similar in energy to the all-in/all-out stateWitczak-Krempa and Kim (2012), which also correspond to q = 0 type order. In general, q = 0 magnetic order is very difficult to detect due to the large scattering contribution from structural Bragg peaks that coincide with the magnetic peaks. However, because the atoms in exclusively occupy special high symmetry positions in the pyrochlore lattice, there is an extinction rule which governs reflections with , ; i.e. structural peaks such as (4,4,2) and (4,4,6) are absent. Therefore, q = 0 magnetic peaks may be observable in these positions. Similarly, there are very weak structural Bragg peaks, such as (5,5,5), which might allow one to study magnetic peak intensity superimposed on the structural intensity.
We concentrated our attention on two of these forbidden or weak Bragg peak positions, (4,4,2) and (5,5,5), and investigated the energy, momentum, polarization, and temperature dependence of these peaks. The energy dependence of the (4,4,2) peak is shown in Fig. 2. A clear resonant enhancement is observed at this position near E = 11.223 keV. This resonance behavior is contrasted with the energy dependence of a regular structural Bragg peak, (6,6,6), which exhibits typical intensity modulation near the absorption edge. The Ir L3 absorption profile, obtained by monitoring x-ray fluorescence from the sample, is plotted to illustrate that the (6,6,6) peak intensity is inversely correlated with the absorption coefficient. We note that the resonant enhancement for the (4,4,2) peak occurs at an energy slightly above the XAS maximum (E = 11.221 keV). This resonance behavior is quite different from that of the magnetic peaks reported for other iridates such as Sr2IrO4Kim et al. (2009), Na2IrO3Liu et al. (2011), and Sr3Ir2O7Boseggia et al. (2012), all of which display a resonance several eV below the XAS maximum.
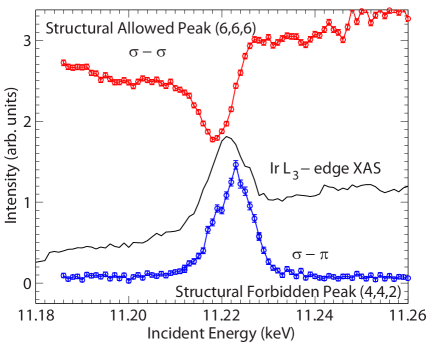
In spite of the fact that the (4,4,2) peak displays significant intensity in the scattering channel, this difference in photon energy dependence provides strong evidence against assigning this peak as a magnetic reflection. The lack of temperature dependence for this peak (discussed below) further supports this interpretation. Instead, we attribute the resonant intensity at these forbidden peak positions to Templeton scattering, or the Anisotropic Tensor of Susceptibility (ATS). This scattering arises from the anisotropic nature of the d orbitals and the shape of the local charge distribution around the Iridium site. In previous studies, ATS has been used to probe the = 1/2 character of electronic wavefunctions in CaIrO3Ohgushi et al. (2013) and Eu2Ir2O7Uematsu et al. (2015). Here, we can use the structural sensitivity of ATS to investigate the degree of distortion around the Ir atoms.
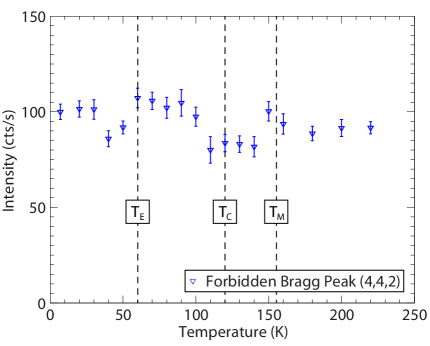
The temperature dependence of the structurally forbidden (4,4,2) peak is shown in Fig. 3. Note that, within experimental uncertainty, the peak intensity does not change from room temperature down to 6 K. In particular, we do not observe any intensity changes associated with the magnetic or electronic transition temperatures: 120 K (for near-stoichiometric Eu2Ir2O7), 155 K and 60 K (for Eu-rich Eu2Ir2O7). This lack of temperature dependence indicates (1) the observed peak is not magnetic in origin, and (2) there are no local structural distortions at , , or . In order to verify that these observations are general beyond the (4,4,2) reflection, similar measurements were also performed for the (5,5,5) Bragg reflection. (5,5,5) is an allowed Bragg peak, but one with a very small structure factor (over 103 times weaker than the nearby (4,4,4) reflection). As in the case of (4,4,2), we observe resonantly enhanced intensity in the channel, with no apparent temperature dependence. We also scanned along several high symmetry directions in reciprocal space in order to search for q 0 magnetic order. No significant signal above background was observed in any of these scans.
III.2 High pressure crystal structure
In Fig. 4, we show the evolution of the x-ray diffraction pattern for as a function of applied pressure. The data in Fig. 4(a) were obtained using silicone fluid as a pressure transmitting medium, whereas the data in Fig. 4(b) were obtained using MEW. The diffraction patterns from the two pressure transmitting media are almost identical, save for the small peak at 2 13∘ which appears in Fig. 4(b) due to scattering from the Re gasket. These diffraction patterns reveal a gradual contraction of the lattice with increasing pressure, as all Bragg peaks move towards progressively higher angles. The diffraction peaks also become noticeably broader at higher pressures, a common effect which arises due to strain-broadening. However, there is no evidence of new peaks forming, or of existing peaks splitting, as the pressure is varied. These results indicate that no structural phase transitions occur in Eu2Ir2O7 up to P 17 GPa.
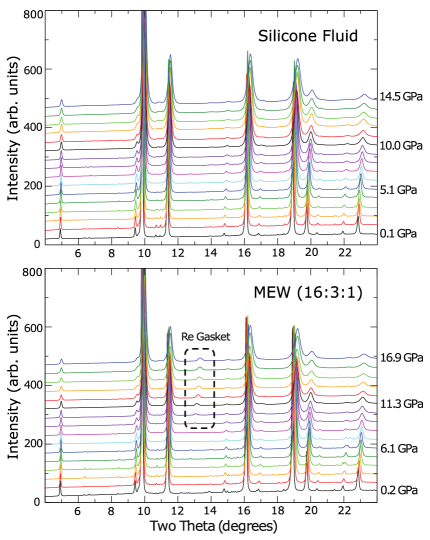
It is important to be cautious about experimentally realizing pure hydrostatic pressure conditions. This is particularly true during low temperature experiments, where there is a strong possibility that pressure transmitting media may solidify and give rise to anisotropic pressure conditions. However, at room temperature, there are many liquid pressure media which work well to preserve hydrostatic conditions up to relatively high pressures. In this experiment we have used two different choices of pressure transmitting medium – MEW (16:3:1) and silicone fluid. The hydrostatic limit for MEW has been found to be 10.5 GPaKlotz et al. (2009), while the reported limits for silicone fluid range from 3 GPaKlotz et al. (2009) to over 10 GPaRagan et al. (1996); Shen et al. (2004), depending on specific chemical composition and viscosity. The low viscosity silicone fluid used in this experiment is expected to offer similar, if not slightly better, performance than MEW over the measured pressure range. Most importantly, we note that the results from both media agree within error bars, giving credence to our experimental observations.
The diffraction patterns were analyzed by Rietveld refinements carried out using the GSAS software packageLarson and Van Dreele (2000). The lattice parameters, atomic positions, thermal parameters, lineshape, and background were all refined in this process. The diffraction patterns were well-described by a structural model from ambient pressure up to P = 14.5 GPa for data obtained with the silicone fluid pressure medium, and from P = 0.2 GPa to P = 16.9 GPa for data obtained with MEW. Goodness-of-fit parameters, and , indicate that the quality of the refinements remains good across the full pressure range. This provides further evidence against the occurrence of any pressure-induced structural distortions. Additional details of the structural refinements can be found in the supplemental material accompanying this article.
In Fig. 5(a), the refined lattice parameter is plotted as a function of applied pressure for both choices of pressure transmitting media. Both data sets show that the cubic lattice parameter evolves monotonically as a function of pressure. The full pressure range can be well fit by the Murnaghan equation, which describes the relation between hydrostatic pressure and volume contraction. This equation can be written as:
| (1) |
where represents the modulus of incompressibility at ambient pressure, represents the first derivative of with respect to pressure, and represents the volume of the unit cell at ambient pressure. From the fit provided in Fig. 5(a) we can extract values of = 166(4) GPa and = 27.8(5) for Eu2Ir2O7. We note that the value of is surprisingly large, indicating that Eu2Ir2O7 stiffens rapidly as a function of applied pressure. This result holds true whether the data is fit to Murnaghan or Birch-Murnaghan equations of state.
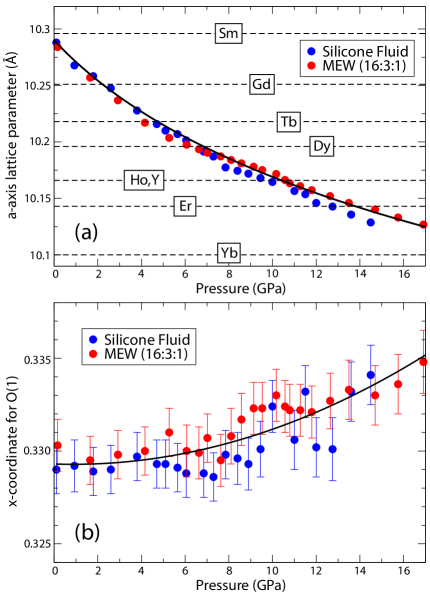
Small changes in slope can be observed in the intermediate pressure range, at 7 GPa (silicone fluid) and 10 GPa (MEW), but these changes appear to be well within the experimental uncertainties. The difference between the silicone fluid and MEW data sets grows progressively larger with increasing pressure, which is likely due to deviations from ideal hydrostatic conditions. For comparison, the ambient pressure lattice constants for pyrochlore iridates with smaller R-site ions such as Gd, Tb, Dy, Ho, Y, Er, and Yb, have also been marked in Fig. 5(a). This allows us to directly examine the relation between chemical pressure (tuned by R-site substitution) and actual hydrostatic pressure. The substitution of Eu3+ for Er3+ for example, which corresponds to 6% reduction in ionic radius, is found to be equivalent to an applied pressure of 14 GPa.
Apart from the cubic lattice parameter, there is only one free structural parameter in the pyrochlore lattice: the -coordinate associated with the O(1) site. This positional parameter provides a measure of the distortion of the IrO6 octahedra, with corresponding to ideal, undistorted octahedra. For 5/16 the IrO6 octahedra become trigonally compressed, while for 5/16 they become trigonally elongated. In Fig. 5(b) we plot the evolution of as a function of pressure. A small, but finite, increase in is clearly observed, suggesting that the IrO6 octahedra become increasingly more distorted at higher pressures. The degree of distortion, , is 25-30% larger at GPa than it is at ambient pressure.
IV Experimental results: excitations
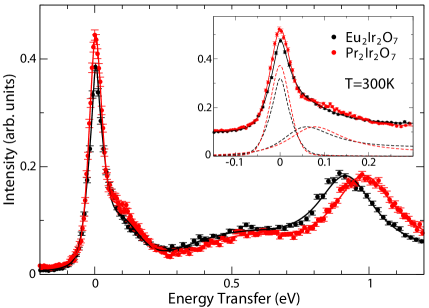
The RIXS process at the L3 edge of Ir (or any other d electron system) is a second order process consisting of two dipole transitions ( followed by ). In Fig. 6, we show representative energy scans obtained from RIXS measurements on and Pr2Ir2O7 single crystals. These scans contain several prominent features. First, there is a sharp elastic peak at zero energy loss, which provides a measure of the experimental energy resolution (35 meV FWHM). This is followed by three strong inelastic features: two sharp low energy excitations around 0.6-1 eV ( and ) and an extremely broad high energy excitation around 2.5-5 eV (). Quantum chemistry calculationsHozoi et al. (2014) have shown that and arise from d-d excitations within the t2g manifold, while arises from transitions between the t2g and eg bands. We will demonstrate that there is also a fourth inelastic feature, which can be observed as a small shoulder on the right-hand side of the elastic peak. This low-lying feature is particularly prominent in Eu2Ir2O7, where we will argue that it must be magnetic in origin.
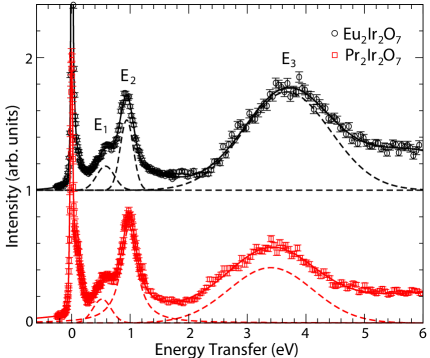
Before examining the detailed momentum and temperature dependence of the RIXS spectrum for Eu2Ir2O7, we first offer some general comparisons between Eu2Ir2O7 and . The R = Pr compound appears to be unique among rare-earth pyrochlore iridates, in that it is the only (intrinsically) metallic compound. As one can see from the data in Fig. 6, the RIXS spectrum of Pr2Ir2O7 is qualitatively very similar to that of . This similarity is expected for the d-d excitations, as the energies of , , and are largely determined by local structure (Pr2Ir2O7 shares the same crystal structure with a slightly expanded lattice parameter, Å). However, the existence of a broad, low-lying excitation is quite interesting, since no magnetic order has been observed in the R = Pr compound down to 70 mKNakatsuji et al. (2006). We will return to the low energy spectrum in more detail at the end of this section. In their quantum chemistry calculations, Hozoi et al.Hozoi et al. (2014) showed that the energies of the d-d excitations are quite similar for a variety of pyrochlore iridates (R = Sm, Eu, Lu, and Y). In particular, the non-cubic contribution to the crystal field splitting is quite significant in all four materials, as demonstrated by the large splitting between the two peaks associated with intra-t2g transitions, eV and eV. The authors also determined that it is long-range lattice anisotropy, involving next-nearest neighbor Ir and R-site ions, which is primarily responsible for the symmetry-breaking field that results in the splitting of the levels. Our RIXS measurements on indicate that similar local d-d excitations are present even in this metallic sample, suggesting that the high-energy electronic structure of these materials may not be that different. A table of d-d excitation energies, extracted from fits to the RIXS data in Fig. 6, is provided in Table 1. We note that Pr2Ir2O7 displays significantly larger non-cubic crystal field splitting than Eu2Ir2O7 ( = 0.46 eV compared to 0.36 eV), but with a slight reduction in the octahedral crystal field splitting (3.40 eV compared to 3.68 eV).
| (eV) | (eV) | (eV) | (eV) | |
|---|---|---|---|---|
| Eu2Ir2O7 | 0.59(1) | 0.95(1) | 3.68(2) | 0.36(2) |
| Pr2Ir2O7 | 0.52(1) | 0.98(1) | 3.40(2) | 0.46(2) |
In Fig. 7, we plot the momentum dependence of the RIXS spectrum for . These spectra were obtained for momentum transfers along the (111) direction in reciprocal space, tracing a path through the Brillouin zone as illustrated in Fig. 7(a). The Q points which correspond to the position, i.e. the zone centers at (7,7,7) and (8,8,8), were not measured in this study, since any spectra collected near allowed Bragg peak positions will be dominated by the strong elastic signal. The d-d excitations in display no obvious momentum dependence, which is very different from square lattice iridates such as Kim et al. (2012a, 2014) or Kim et al. (2012b). It should be emphasized that the strong momentum dependence in these square lattice iridates originates from the large hopping amplitude which contributes to strong superexchange coupling. Therefore, the bandwidth of the orbital (or spin-orbiton) excitations is the same as the magnon bandwidth. In the honeycomb iridate , smaller orbital overlap due to almost 90∘ Ir-O-Ir geometry keeps the dispersion of magnetic and orbital excitations small Gretarsson et al. (2013a, b).
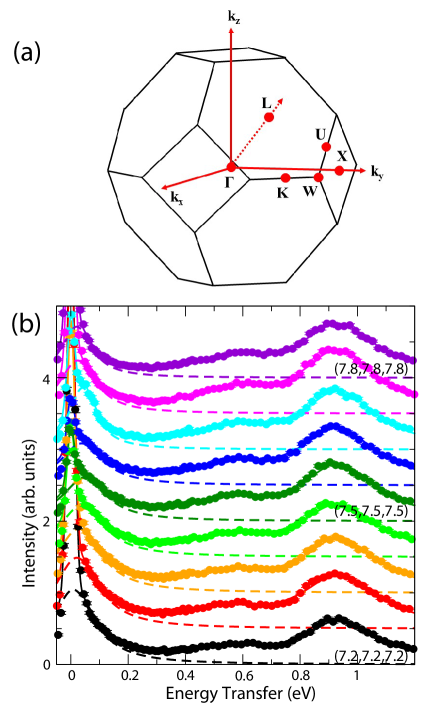
The low energy shoulder below 0.3 eV does appear to display momentum dependence in Fig. 7. We focus on examining this low energy region in more detail in Fig. 8. In Fig. 8(a), we show the temperature dependence of RIXS spectra collected at the Q = (7.5, 7.5, 7.5) zone boundary position. At T = 25 K, well below the magnetic transition temperature, we can clearly observe a broad feature below 0.1 eV. This feature is greatly suppressed when the temperature is raised above , up to T = 300 K. This behavior can be contrasted with the negative energy transfer side of the spectrum (i.e. x-ray energy gain/sample energy loss), in which the tail of the elastic peak increases at high temperature. This form of temperature dependence can be explained in terms of an increase in the Bose population factor for phonons. However, the decrease of spectral weight observed at 0.1 eV requires an explanation that goes beyond routine temperature dependence. The most natural explanation is to associate this low-lying feature with magnetic excitations that lose spectral weight when magnetic order disappears at high temperature.
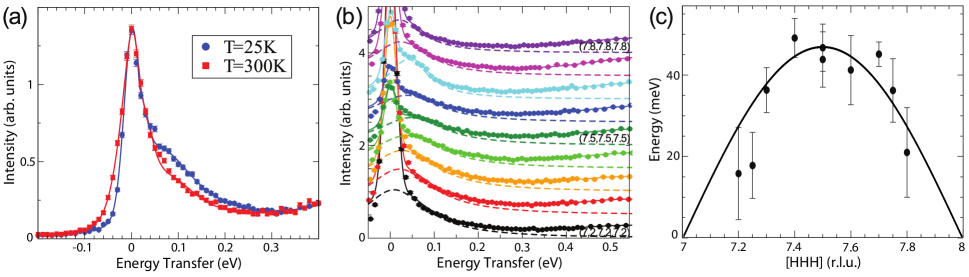
The low-lying magnetic excitation also shows significant momentum dependence. In Fig. 8(b), we plot the low energy region of the spectra from Fig. 7. Note that the shoulder on the elastic line appears to shift from higher energy to lower energy as Q moves from the Brillouin zone boundary at (7.5, 7.5, 7.5) towards the zone centers at (7,7,7) and (8,8,8). This low-lying excitation is extremely broad, and therefore cannot be associated with a dispersive quasiparticle excitation. The simplest way to analyze the momentum dependence of this feature is to model the elastic line by a resolution-limited pseudo-Voigt function, and fit the position of the low energy shoulder using a simple Lorentzian function. This method provides a rough measure of the center of gravity of the spectral feature, but often overestimates the scattering intensity at negative energy transfers. The quality of fit can be significantly improved by introducing an asymmetric lineshape, such as an exponentially damped Lorentzian, although the resulting peak positions do not appear to be overly sensitive to the precise choice of fit function.
In Fig. 8(c), we plot the dispersion of the low-lying magnetic excitation along the direction, using the peak positions extracted from our fitting analysis. Here the error bars have been chosen to reflect the additional uncertainty introduced by the choice of lineshape. If we consider a simple spin wave model, the observed dispersion relation seems to suggest that the magnetic excitation reaches a maximum energy of 45 5 meV near the zone boundary at (7.5, 7.5, 7.5) (i.e. the -point), and disperses towards zero energy at the points on either side. This result would be consistent with a spin wave mode associated with q = 0 magnetic order. However, it should be noted that the observation of such a highly damped excitation suggests that the simple spin wave picture is probably not appropriate for this material, and a more sophisticated interpretation of the spin dynamics is required.
In Fig. 9, we compare the low energy RIXS spectra of Eu2Ir2O7 and Pr2Ir2O7. Since Pr2Ir2O7 displays no magnetic order down to T = 70 mK, here we have plotted two data sets collected at T = 300 K, well within the paramagnetic phase for both compounds. As noted earlier, these measurements reveal a clear shift in the energy of the d-d excitations, with R = Pr displaying 25% larger non-cubic crystal electric field splitting than R = Eu. Most striking, however, is the fact that we observe a broad low energy shoulder in both of these materials, even outside the magnetically ordered state. Modelling this shoulder with a damped Lorentzian lineshape, we find the center of the feature to be at 45 5 meV for R = Eu and 70 5 meV for R = Pr. Interpreting the origins of this feature is non-trivial, as low-lying spectral weight can arise from phonon scattering, electon-hole continuum scattering, and/or paramagnetic fluctuations above . However, the fact that this shoulder occurs at substantially higher energies for R = Pr would appear to contradict both the resonant phonon explanation (since the difference in phonon energies for isostructural Eu2Ir2O7 and Pr2Ir2O7 would be expected to be much smaller) and the electron-hole continuum explanation (since R = Pr is more metallic than R = Eu, we would expect the continuum scattering in Pr2Ir2O7 to occur at lower energies rather than higher ones). Similarly, the fact that the high temperature shoulder in Eu2Ir2O7 appears at exactly the same energy as the low temperature magnetic excitation, albeit with significantly reduced spectral weight, strongly suggests that this is a paramagnetic remnant of the same magnetic feature. Therefore, we tentatively attribute this low-lying feature to the presence of short-lived paramagnetic fluctuations.
V Discussion and conclusions
V.1 Structure
The main conclusion from our structural studies is that the pyrochlore iridate Eu2Ir2O7 retains its crystal symmetry throughout a wide variety of electronic and magnetic phases. We find no evidence of any structural distortion associated with the thermally-driven magnetic transition at , confirming previous neutron and x-ray diffraction results. In addition, we observe no pressure-induced structural transitions or symmetry changes for applied pressures up to 17 GPa. This result has direct implications for recent high pressure transport studies by Tafti et al.Tafti et al. (2012), which reported pressure-induced metal-insulator (low temperature) or metal-incoherent metal (high temperature) transitions in Eu2Ir2O7 around 6-8 GPa. Since our experimental results have demonstrated that no structural anomalies occur in the vicinity of the critical pressure, we can conclude that these pressure-induced transitions are likely driven by purely electronic effects.
Our resonant x-ray scattering measurements provided evidence of temperature-independent ATS scattering, but were unable to detect magnetic Bragg peaks. This differs from previous resonant x-ray scattering measurements on single crystal by Sagayama et al., which reported a resonantly enhanced peak at (10,0,0) that disappeared above the magnetic transition temperature. We note that (10,0,0) is a forbidden peak position which is crystallographically equivalent to the (4,4,2) position measured in this study, with both wave vectors corresponding to an X-point on the Brillouin zone boundary (see Fig. 7(a)). It is possible that this discrepancy is simply due to differences in sample stoichiometry, as the single crystal sample used in our study was found to be Eu-rich (x = -0.09) while the sample in Ref. 24 was found to be slightly Ir-rich (x 0.05). However, bulk magnetization measurements on our sample do reveal a clear magnetic transition at 155 K, and in spite of the lack of magnetic Bragg peaks below , there is strong evidence of magnetic dynamics provided by RIXS. This implies that at the very least there must be some form of short-range magnetic correlations in this sample.
V.2 Excitations
The main result from our RIXS investigation of is that there is a highly damped magnetic excitation which reaches a maximum energy of 45 5 meV at the -position. This excitation exhibits significant momentum dependence, and disperses towards lower energies as the momentum transfer approaches the -position. The observation of such Landau-damped magnetic excitations is not surprising given that our sample remains metallic/semi-metallic even at low temperatures due to sample stoichiometry. As discussed in Section II and in previous work by Ishikawa et al.Ishikawa et al. (2012), many single crystal samples are known to suffer from (1) deviations from ideal stoichiometry, and (2) anti-site disorder which leads to mixing of the Eu and Ir sublattices. It is unclear what kind of magnetic excitations should be expected in such an impurity/defect-induced metallic state.
Another way to understand the damped magnetic excitations observed in our sample is to approach the problem using weak/intermediate coupling theory. Since the ground state of Eu2Ir2O7 is close to a metal, conventional semi-metal, or Weyl semi-metal phase, it is reasonable to assume that well-defined magnon modes derived from a strong-coupling approach will be inadequate to describe the magnetic excitations in this material. In recent theoretical studies by Lee et al.Lee et al. (2013b), the dynamic structure factor for the pyrochlore iridates, , was calculated using the random phase approximation (RPA). This result is reproduced in Fig. 10 for the same path measured in Figs. 7 and 8. Note that this calculation has been performed for two different regimes from the theoretical phase diagram (See Ref. Lee et al., 2013b), with hopping values correponding to (a) a (topological) semi-metallic phase ( = 1.45), and (b) a metallic phase ( = 1.70). As expected, in the strong coupling limit (U = 6), dispersive quasiparticle excitations are found. However, as the coupling strength decreases, the overall spectrum begins to broaden. In the intermediate coupling limit (U = 4 to 4.5), the sharp quasiparticle features have almost vanished, and the only well-defined spectral features are found near special high symmetry positions.
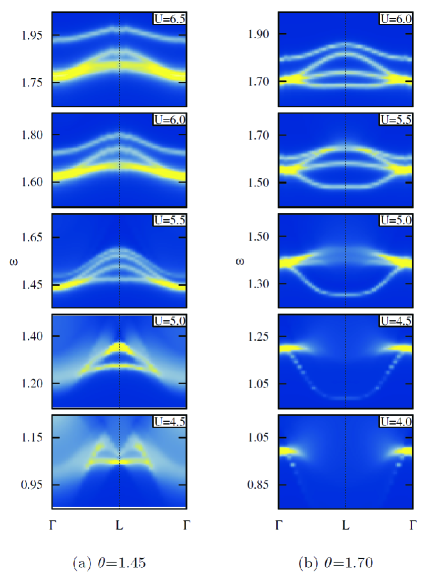
What is interesting is that these sharp high symmetry points differ greatly between the two regions of the phase diagram considered in Ref. Lee et al., 2013b. The in Fig. 10(a), obtained with parameters close to the Weyl semi-metal phase, has a well-defined peak near the -point. On the other hand, the in Fig. 10(b), which corresponds to the metallic all-in/all-out phase, displays a strong, sharp peak near the -point. Our RIXS spectrum exhibits a strong peak at the -point, which broadens and weakens as it approaches the -point. Thus, the experimental data clearly supports the calculated shown in Fig. 10(a).
One important caveat is whether it is justified to compare the RIXS spectrum with in this situation. In the case of localized spin models, this certainly appears to be a valid approach. In their study of , Kim et al. showed that the magnetic RIXS spectrum is proportional to the dynamic structure factor for magnon excitations. Similarly, the RIXS spectrum of has also been found to follow the dynamic stucture factorBraicovich et al. (2009). In systems where electrons take on more itinerant characteristics, there appears to be more controversy on this issue, and it is clear that further studies are still needed. One comment that we can offer here is that possible intensity modulations due to matrix-element effects, which are ignored in the calculation, are not significant in our measurements. These transition matrix elements depend on the total photon momentum transfer , and not the crystal momentum transfer . The total momentum transfer along our line ranges from (7,7,7) to (8,8,8), i.e. only 13% change in .
Perhaps the most surprising result from our RIXS investigation concerns the excitation spectrum of Pr2Ir2O7. In spite of the absence of magnetic order in this compound, we observe a similar highly damped -point feature at 70 5 meV. This feature closely resembles the low energy peak in paramagnetic Eu2Ir2O7, and thus we have tentatively attributed it to paramagnetic fluctuations. The R = Pr sample exhibits a low-temperature anomalous Hall effect, which has been associated with an exotic metallic spin liquid stateMachida et al. (2007, 2010). It has been proposed that the large Pr3+ moments exhibit spin-ice-like physics, and that strong quantum fluctuations drive “quantum melting” into a chiral spin liquidOnoda and Tanaka (2010); Machida et al. (2010). The Pr moments are indirectly coupled to the itinerant Ir electrons through an antiferromagnetic RKKY interaction. The observed Curie-Weiss temperature of = 20 K, which is much larger than the energy scale expected from the Pr moments, is attributed to this RKKY energy scaleNakatsuji et al. (2006). Below T 20 K, the Pr moments are partially screened by the Kondo effect, and the antiferromagnetic interaction is renormalized to 1.7 KNakatsuji et al. (2006). Our observation of resonant inelastic scattering intensity at 70 meV 810 K suggests that the energy scale associated with the Ir conduction electrons is much greater than either of these interactions. Therefore, our results point towards the existence of a third, significantly larger, magnetic energy scale in Pr2Ir2O7.
Acknowledgements.
We would like to thank Arun Paramekanti and Jacob Ruff for valuable discussions. Work at the University of Toronto was supported by the Natural Sciences and Engineering Research Council of Canada through a Discovery Grant and Research Tools and Instruments Grant. Work at Seoul National University was supported by National Creative Research Initiative 2010-0018300. Use of the Advanced Photon Source at Argonne National Laboratory is supported by the U.S. Department of Energy, Office of Science, under Contract No. DE-AC02-06CH11357. Use of the Canadian Light Source is supported by the Canada Foundation for Innovation, the Natural Sciences and Engineering Research Council of Canada, the University of Saskatchewan, the Government of Saskatchewan, Western Economic Diversification Canada, the National Research Council of Canada, and the Canadian Institutes of Health Research.References
- Nakatsuji et al. (2006) S. Nakatsuji, Y. Machida, Y. Maeno, T. Tayama, T. Sakakibara, J. v. Duijn, L. Balicas, J. N. Millican, R. T. Macaluso, and J. Y. Chan, Phys. Rev. Lett. 96, 087204 (2006).
- Machida et al. (2007) Y. Machida, S. Nakatsuji, Y. Maeno, T. Tayama, T. Sakakibara, and S. Onoda, Phys. Rev. Lett. 98, 057203 (2007).
- Machida et al. (2010) Y. Machida, S. Nakatsuji, S. Onoda, T. Tayama, and T. Sakakibara, Nature 463, 210 (2010).
- Lee et al. (2013a) S. Lee, A. Paramekanti, and Y. B. Kim, Phys. Rev. Lett. 111, 196601 (2013a).
- Wan et al. (2011) X. Wan, A. M. Turner, A. Vishwanath, and S. Y. Savrasov, Phys. Rev. B 83, 205101 (2011).
- Balents (2011) L. Balents, Physics 4, 36 (2011).
- Witczak-Krempa and Kim (2012) W. Witczak-Krempa and Y. B. Kim, Phys. Rev. B 85, 045124 (2012).
- Maiti (2009) K. Maiti, Solid State Commun. 149, 1351 (2009).
- Yang and Kim (2010) B.-J. Yang and Y. B. Kim, Phys. Rev. B 82, 085111 (2010).
- Witczak-Krempa et al. (2014) W. Witczak-Krempa, G. Chen, Y. B. Kim, and L. Balents, Annual Review of Condensed Matter Physics 5, 57 (2014).
- Vafek and Vishwanath (2014) O. Vafek and A. Vishwanath, Annual Review of Condensed Matter Physics 5, 83 (2014).
- Taira et al. (2001) N. Taira, M. Wakeshima, and Y. Hinatsu, Journal of Physics: Condensed Matter 13, 5527 (2001).
- Yanagishima and Maeno (2001) D. Yanagishima and Y. Maeno, J. Phys. Soc. Japan 70, 2880 (2001).
- Matsuhira et al. (2007) K. Matsuhira, M. Wakeshima, R. Nakanishi, T. Yamada, A. Nakamura, W. Kawano, S. Takagi, and Y. Hinatsu, Journal of the Physical Society of Japan 76, 043706 (2007).
- Matsuhira et al. (2011) K. Matsuhira, M. Wakeshima, Y. Hinatsu, and S. Takagi, Journal of the Physical Society of Japan 80, 094701 (2011).
- Zhao et al. (2011) S. Zhao, J. M. Mackie, D. E. MacLaughlin, O. O. Bernal, J. J. Ishikawa, Y. Ohta, and S. Nakatsuji, Phys. Rev. B 83, R180402 (2011).
- Ishikawa et al. (2012) J. J. Ishikawa, E. C. T. O’Farrell, and S. Nakatsuji, Phys. Rev. B 85, 245109 (2012).
- Disseler et al. (2012a) S. M. Disseler, C. Dhital, A. Amato, S. R. Giblin, C. de la Cruz, S. D. Wilson, and M. J. Graf, Phys. Rev. B 86, 014428 (2012a).
- Disseler et al. (2012b) S. M. Disseler, C. Dhital, T. Hogan, A. Amato, S. R. Giblin, C. de la Cruz, A. Daoud-Aladine, S. D. Wilson, and M. J. Graf, Phys. Rev. B 85, 174441 (2012b).
- Graf et al. (2014) M. J. Graf, S. M. Disseler, C. Dhital, T. Hogan, M. Bojko, A. Amato, H. Luetkens, C. Baines, D. Margineda, S. R. Giblin, et al., Journal of Physics: Conference Series 551, 012020 (2014).
- Disseler (2014) S. M. Disseler, Phys. Rev. B 89, 140413 (2014).
- Shapiro et al. (2012) M. C. Shapiro, S. C. Riggs, M. B. Stone, C. R. de la Cruz, S. Chi, A. A. Podlesnyak, and I. R. Fisher, Phys. Rev. B 85, 214434 (2012).
- Tomiyasu et al. (2012) K. Tomiyasu, K. Matsuhira, K. Iwasa, M. Watahiki, S. Takagi, M. Wakeshima, Y. Hinatsu, M. Yokoyama, K. Ohoyama, and K. Yamada, Journal of the Physical Society of Japan 81, 034709 (2012).
- Sagayama et al. (2013) H. Sagayama, D. Uematsu, T. Arima, K. Sugimoto, J. J. Ishikawa, E. O’Farrell, and S. Nakatsuji, Phys. Rev. B 87, 100403 (2013).
- Takatsu et al. (2014) H. Takatsu, K. Watanabe, K. Goto, and H. Kadowaki, Phys. Rev. B 90, 235110 (2014).
- Hasegawa et al. (2010) T. Hasegawa, N. Ogita, K. Matsuhira, S. Takagi, M. Wakeshima, Y. Hinatsu, and M. Udagawa, Journal of Physics: Conference Series 200, 012054 (2010).
- Sakata et al. (2011) M. Sakata, T. Kagayama, K. Shimizu, K. Matsuhira, S. Takagi, M. Wakeshima, and Y. Hinatsu, Phys. Rev. B 83, 041102 (2011).
- Tafti et al. (2012) F. F. Tafti, J. J. Ishikawa, A. McCollam, S. Nakatsuji, and S. R. Julian, Phys. Rev. B 85, 205104 (2012).
- Ament et al. (2011a) L. J. P. Ament, M. van Veenendaal, T. P. Devereaux, J. P. Hill, and J. van den Brink, Rev. Mod. Phys. 83, 705 (2011a).
- Ament et al. (2011b) L. J. P. Ament, G. Khaliullin, and J. van den Brink, Phys. Rev. B 84, 020403(R) (2011b).
- Kim et al. (2012a) J. Kim, D. Casa, M. H. Upton, T. Gog, Y.-J. Kim, J. F. Mitchell, M. van Veenendaal, M. Daghofer, J. van den Brink, G. Khaliullin, et al., Phys. Rev. Lett. 108, 177003 (2012a).
- Kim et al. (2012b) J. Kim, A. H. Said, D. Casa, M. H. Upton, T. Gog, M. Daghofer, G. Jackeli, J. van den Brink, G. Khaliullin, and B. J. Kim, Phys. Rev. Lett. 109, 157402 (2012b).
- Kim et al. (2014) J. Kim, M. Daghofer, A. H. Said, T. Gog, J. van den Brink, G. Khaliullin, and B. J. Kim, Nat. Commun. 5, 4453 (2014).
- Gretarsson et al. (2013a) H. Gretarsson, J. P. Clancy, X. Liu, J. P. Hill, E. Bozin, Y. Singh, S. Manni, P. Gegenwart, J. Kim, A. H. Said, et al., Phys. Rev. Lett. 110, 076402 (2013a).
- Gretarsson et al. (2013b) H. Gretarsson, J. P. Clancy, Y. Singh, P. Gegenwart, J. P. Hill, J. Kim, M. H. Upton, A. H. Said, D. Casa, T. Gog, et al., Phys. Rev. B 87, 220407 (2013b).
- Liu et al. (2012) X. Liu, V. M. Katukuri, L. Hozoi, W.-G. Yin, M. P. M. Dean, M. H. Upton, J. Kim, D. Casa, A. Said, T. Gog, et al., Phys. Rev. Lett. 109, 157401 (2012).
- Yin et al. (2013) W.-G. Yin, X. Liu, A. M. Tsvelik, M. P. M. Dean, M. H. Upton, J. Kim, D. Casa, A. Said, T. Gog, T. F. Qi, et al., Phys. Rev. Lett. 111, 057202 (2013).
- Moretti Sala et al. (2014) M. Moretti Sala, K. Ohgushi, A. Al-Zein, Y. Hirata, G. Monaco, and M. Krisch, Phys. Rev. Lett. 112, 176402 (2014).
- Lupascu et al. (2014) A. Lupascu, J. P. Clancy, H. Gretarsson, Z. Nie, J. Nichols, J. Terzic, G. Cao, S. S. A. Seo, Z. Islam, M. H. Upton, et al., Phys. Rev. Lett. 112, 147201 (2014).
- Hozoi et al. (2014) L. Hozoi, H. Gretarsson, J. P. Clancy, B.-G. Jeon, B. Lee, K. H. Kim, V. Yushankhai, P. Fulde, D. Casa, T. Gog, et al., Phys. Rev. B 89, 115111 (2014).
- Uematsu et al. (2015) D. Uematsu, H. Sagayama, T. Arima, J. J. Ishikawa, S. Nakatsuji, H. Takagi, M. Yoshida, J. Mizuki, and K. Ishii, Phys. Rev. B 92, 094405 (2015).
- Smith and Desgreniers (2009) J. S. Smith and S. Desgreniers, J. Synch. Rad. 16, 83 (2009).
- Larson and Van Dreele (2000) A. C. Larson and R. B. Van Dreele, Los Alamos National Laboratory Report LAUR 86-748 (2000).
- Millican et al. (2007) J. N. Millican, R. T. Macaluso, S. Nakatsuji, Y. Machida, Y. Maeno, and J. Y. Chan, Materials Research Bulletin 42, 928 (2007), ISSN 0025-5408.
- Kim et al. (2009) B. J. Kim, H. Ohsumi, T. Komesu, S. Sakai, T. Morita, H. Takagi, and T. Arima, Science 323, 1329 (2009).
- Liu et al. (2011) X. Liu, T. Berlijn, W.-G. Yin, W. Ku, A. Tsvelik, Y.-J. Kim, H. Gretarsson, Y. Singh, P. Gegenwart, and J. P. Hill, Phys. Rev. B 83, 220403 (2011).
- Boseggia et al. (2012) S. Boseggia, R. Springell, H. C. Walker, A. Boothroyd, D. Prabhakaran, D. Wermeille, L. Bouchenoire, S. P. Collins, and D. F. McMorrow, Phys. Rev. B 85, 184432 (2012).
- Ohgushi et al. (2013) K. Ohgushi, J. Yamaura, H. Ohsumi, K. Sugimoto, S. Takeshita, A. Tokuda, H. Takagi, M. Takata, and T. Arima, Phys. Rev. Lett. 110, 217212 (2013).
- Klotz et al. (2009) S. Klotz, J.-C. Chervin, P. Munsch, and G. Le Marchand, J. Phys. D: Appl. Phys. 42, 075413 (2009).
- Ragan et al. (1996) D. D. Ragan, D. R. Clarke, and D. Schiferl, Rev. Sci. Instrum. 67, 494 (1996).
- Shen et al. (2004) Y. Shen, R. S. Kumar, M. Pravica, and M. F. Nicol, Rev. Sci. Instrum. 75, 4450 (2004).
- Lee et al. (2013b) E. K.-H. Lee, S. Bhattacharjee, and Y. B. Kim, Phys. Rev. B 87, 214416 (2013b).
- Braicovich et al. (2009) L. Braicovich, L. J. P. Ament, V. Bisogni, F. Forte, C. Aruta, G. Balestrino, N. B. Brookes, G. M. De Luca, P. G. Medaglia, F. Miletto Granozio, et al., Phys. Rev. Lett. 102, 167401 (2009).
- Onoda and Tanaka (2010) S. Onoda and Y. Tanaka, Phys. Rev. Lett. 105, 047201 (2010).
- Hammersley et al. (1996) A. P. Hammersley, S. O. Svensson, M. Hanfland, A. N. Fitch, and D. Hausermann, High Press. Res. 14, 235 (1996).
Appendix A Sample Characterization (Supplemental Material)
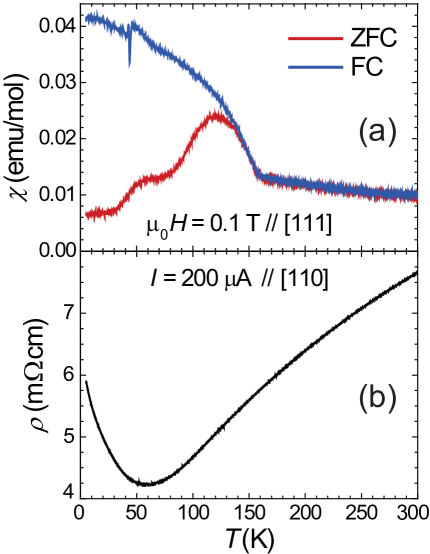
Previous experimental studies of pyrochlore iridates have demonstrated that sample stoichiometry plays an important role in determining electronic propertiesIshikawa et al. (2012). It is very difficult to synthesize stoichiometric single crystal samples of Eu2Ir2O7, and the resulting material is more accurately described as Eu2(1-x)Ir2(1+x)O7+δ. Even a 1% deviation from ideal stoichiometry is sufficient to change the residual resistivity ratio of a sample by several orders of magnitudeIshikawa et al. (2012). Samples near ideal stoichiometry display a clear metal-insulator transition at , with on the order of 103 to 105. In contrast, samples which display a significant excess of Eu or Ir tend to remain metallic or semi-metallic at low temperature. Sample stoichiometry has comparatively little influence on the magnetic properties of Eu2Ir2O7. For x 0.03, non-stoichiometry reduces the hysteresis between field-cooled and zero-field-cooled magnetic susceptibility, but has no apparent effect on the value of Ishikawa et al. (2012).
As noted in the main text, EPMA measurements on the single crystal used in this study suggest that our sample is Eu-rich/Ir-deficient, with a composition of x = -0.09(2) and = 0.06(2). Bulk characterization measurements on this sample are provided in Figure 11. Note that for this Eu-rich stoichiometry we observe a clear splitting of the magnetic and electronic transition temperatures. The magnetic transition occurs at 155 K, with pronounced field-cooled/zero-field-cooled hysteresis appearing below 140 K. Although our sample is not strongly insulating at low temperatures (/ 0.7), the temperature dependence of the resistivity shows a clear upturn below 60 K and an inflection point at 130 K. This behavior can be contrasted with the simultaneous magnetic ordering and metal-insulator transitions that occur in “near-stoichiometric” samples at = 120 K.
Appendix B High Pressure Structural Refinements (Supplemental Material)
The pressure dependence of the crystal structure of Eu2Ir2O7 was investigated using high pressure x-ray powder diffraction measurements. Diffraction data was collected using a two-dimensional image plate detector, and processed using the FIT2D programHammersley et al. (1996). The resulting one-dimensional diffraction patterns (Intensity vs. 2) were then refined using the GSAS software packageLarson and Van Dreele (2000). The background, cubic lattice parameter (a), lineshape, oxygen positional parameter (X(O1)), and thermal parameters (Uiso) were all refined individually, and then simultaneously. A series of representative refinements are provided in Figure 12. These refinements were carried out on data sets collected at pressures of 0.1, 6.9, 11.0, and 14.5 GPa, using silicone fluid as a pressure transmitting medium. The key structural parameters from these refinements are provided in Table II.
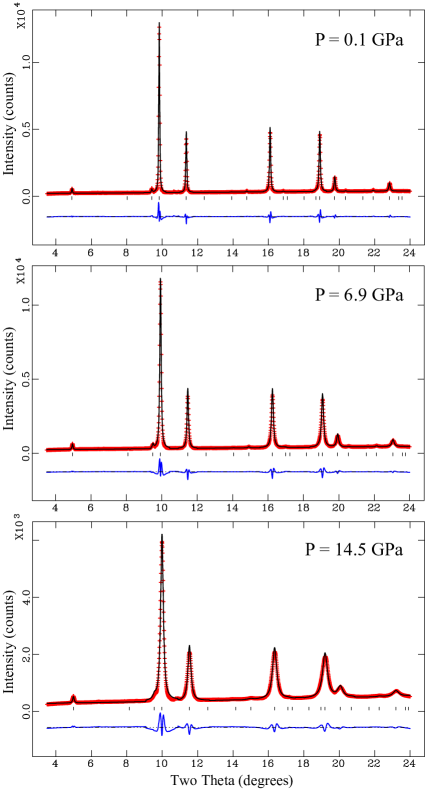
| 0.1 GPa | 6.9 GPa | 11.0 GPa | 14.5 GPa | |
|---|---|---|---|---|
| a (Å) | 10.2880(1) | 10.1915(2) | 10.1566(3) | 10.1287(4) |
| x(O1) | 0.3290(13) | 0.3288(13) | 0.3306(16) | 0.3341(16) |
Given concerns with stoichiometry in single crystal Eu2Ir2O7, we also refined the occupancies of the Eu and Ir sites in our powder data. Negligible improvement in goodness-of-fit was achieved by (a) varying the Eu and Ir occupancies freely or (b) refining the occupancies under a “fully occupied” constraint (i.e. xEu + xIr = 2). At ambient pressure, these refinements yielded occupancies of xEu = 0.985(6) and xIr = 1.015(6). Thus, we can conclude that the powder sample is much closer to ideal stoichiometry than the single crystal sample, and that it is slightly Ir-rich rather than Ir-deficient.
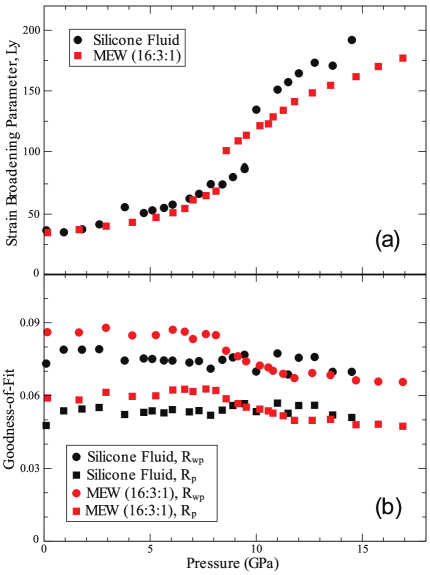
The diffraction patterns in Figure 12 reveal a clear broadening of the lineshape at higher pressures. This is the result of pressure-induced strain broadening, which can be modelled by refining lineshape parameters during the structural refinements. In particular, the Lorentzian component of the lineshape profile, Ly, provides a quantitative measure of this microstrain broadening. The pressure dependence of the Ly parameter is plotted in Figure 13(a). Note that a sudden increase in peak broadening is observed for both pressure transmitting media, occurring at 8 GPa for MEW 16:5:1 and 10 GPa for silicone fluid. This jump likely provides an indication of where hydrostatic conditions begin to break down in each of these data sets.
The goodness-of-fit parameters, Rwp and Rp, are plotted in Figure 13(b). Note that the goodness-of-fit remains relatively constant over the entire pressure range, and even improves slightly at higher pressures. This provides a strong indication that the structural model remains valid for Eu2Ir2O7 up to the highest measured pressures. If there were any pressure-induced structural distortions or symmetry changes in this material we would expect this to be reflected by a decrease in the quality of the refinements.