Optical counterparts of two ULXs in NGC 5474 and NGC 3627 (M 66)
Abstract
We identified two optical counterparts of brightest ultraluminous X-ray Sources (ULXs) in galaxies NGC 5474 and NGC 3627 (M66). The counterparts in Hubble Space Telescope images are very faint, their magnitudes are 24.7 () and 25.9 (), respectively. NGC 5474 X-1 changes the X-ray flux more than two orders of magnitude, in its bright state it has erg s-1, the spectrum is best fitted by an absorbed power-law model with a photon index . M66 X-1 varies in X-rays with a factor of , its maximal luminosity being erg s-1 with . Optical spectroscopy of the NGC 5474 X-1 has shown a blue spectrum, which however was contaminated by a nearby star of 23 mag, but the counterpart has a redder spectrum. Among other objects captured by the slit are a background emission-line galaxy (z ) and a new young cluster of NGC 5474. We find that these two ULXs have largest X-ray-to-optical ratios of for NGC 5474 X-1 (in its bright state) and 8000 for M66 X-1 both with the faintest optical counterparts ever measured. Probably their optical emission originates from the donor star. If they have super-Eddington accretion discs with stellar-mass black holes, they may also have the lowest mass accretion rates among ULXs such as in M81 X-6 and NGC 1313 X-1.
keywords:
galaxies: individual: NGC 5474, NGC 3627 – X-rays: general1 Introduction
Ultraluminous X-ray sources (ULXs) are sources with X-ray luminosities exceeding the Eddington limit for a typical stellar-mass black hole (Feng & Soria, 2011), erg s-1. The most popular models of ULXs involve either intermediate-mass black holes (IMBHs) of with standard accretion discs (Colbert & Mushotzky, 1999) or stellar-mass black holes () accreting at super-Eddington rates (Poutanen et al., 2007). However, both scenarios require a massive donor in a close binary.
Most ULXs are associated with the star-forming regions (Swartz et al. 2009). They are not distributed throughout galaxies as it would be expected for IMBHs originating from low-metallicity Population III stars (Madau & Rees, 2001). The IMBHs may be produced in runaway mergers in the cores of young clusters (Portegies Zwart et al., 2004; Freitag, Gürkan,& Rasio, 2006). In such cases, they usually stay within their clusters. It has been found (Poutanen et al., 2013) that all brightest X-ray sources in the Antennae galaxies are located nearby the very young stellar clusters. They concluded that these sources were ejected in the process of formation of stellar clusters in the dynamical few-body encounters and that the majority of ULXs are massive X-ray binaries with the progenitor masses larger than .
The X-ray spectra of the ULXs often show a high-energy curvature (Stobbart, Roberts, & Wilms, 2006; Gladstone, Roberts, & Done, 2009; Caballero-García & Fabian, 2010) with a downturn between and keV. The curvature hints that the ULX accretion discs are no standard. Inner parts of the discs may be covered with a hot outflow or optically thick corona (Gladstone, Roberts, & Done, 2009), Comptonizing the inner disc photons.
Multiwavelength study of ULXs is a key issue to investigate their nature and environment. Optical investigations show that some ULXs are associated with optical emission nebulae (Abolmasov et al., 2007; Feng & Soria, 2011). Optical counterparts of several ULXs have been identified with Hubble Space Telescope (HST) in nearby galaxies, for example NGC 4559 (Soria et al., 2005), NGC 5204 (Liu, Bregman, & Seitzer, 2004) and Holmberg II (Kaaret, Ward, & Zezas, 2004). In addition, optical spectra of some ULX counterparts and their environments also have been obtained with various ground-based telescopes and HST: ULXs in M101 (Kuntz et al., 2005), NGC 7331 (Abolmasov et al., 2007), Holmberg IX (Grisé et al., 2011) and NGC 7793 (Motch et al., 2014). On the other hand, some ULXs have no visible counterparts even in HST images, for example NGC 5128 X-1 or some sources in NGC 3034 (Gladstone et al., 2013).
In the recent spectroscopy of several optical ULX counterparts with Subaru telescope, Fabrika et al. (2015) have found that all these spectra, and also practically all previously published optical spectra of ULXs, are similar to one another and also to the optical spectrum of SS 433 (Fabrika, 1997, 2004). SS 433 is the only known supercritical accretor in our Galaxy, a close binary with a stellar-mass black hole. The spectra contain broad emission lines of He II and that of hydrogen (H and H) with full width at half-maximum (FWHM) km s-1. In X-rays, SS 433 is very different (Medvedev & Fabrika, 2010) from ULXs, both in the spectrum and X-ray luminosity. Nevertheless, it was suggested that being observed nearly face-on, the supercritical accretion disc in SS 433 is expected to be extremely bright X-ray source (Fabrika, 2004).
Here, we present optical identification of two new ULXs in galaxies NGC 5474 and NGC 3627 (M66). The first source is located in a star-forming region of the galaxy classified as a late-type dwarf spiral at a distance of 6.8 Mpc (Drozdovsky & Karachentsev, 2000). The source NGC 5474 X-1 is identified as a ULX by Swartz et al. (2011), with an X-ray luminosity of erg s-1. The second ULX is located on the edge of the disc of M66, which is an SAb-type barred galaxy at a distance of 10.6 Mpc (Lee & Jang, 2013). The ULX in this galaxy has luminosity of 1.8 erg s-1 at the adopted distance.
Here, we also present X-ray and optical analysis of Chandra and HST observations of these two sources including the optical spectroscopy of the region surrounding NGC 5474 X-1 taken with the 6 m BTA (Big Telescope Alt-azimuth) telescope and discuss the X-ray and optical luminosities of these two sources in comparison with other well-known ULXs.
2 Observations and Analysis
NGC 5474 was observed twice by Chandra ACIS-S on 2006 September 10 for 2 ks (ObsID 7086) and 2007 December 03 for 30 ks (ObsID 9546). Chandra observations of M66 were performed on 1999 November 3 for 2 ks (ObsID 394) and 2008 March 31 for 50 ks (ObsID 9548). For M66, there are also the XMM–Newton data (ObsID 0093641101) obtained on 2001 May 26. To test the long-time variability of the sources we used all available observations obtained with Swift. There are 14 Swift data sets for NGC 5474. The first one was obtained on 2011 April 15 with an exposure time of 5 ks. Other 13 observations were obtained from 2012 June 20 to November 21 with a total exposure of 13 ks, there were 0-2 counts in each of individual observation. M66 was observed by Swift four times, from 2008 July 20 to 2013 November 1.
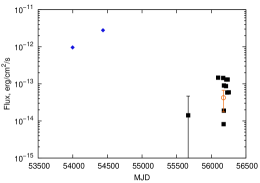
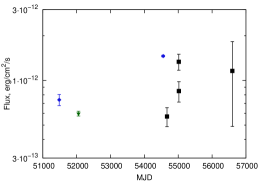
In Fig. 1 we present light curves of these two sources. NGC 5474 X-1 shows a strong variability. Its luminosity changes from to erg s-1. During the last 13 Swift observations, its average luminosity was about erg s-1. For all Swift data, we used 30 arcsec circular aperture (Fig. 1). In the later 13 observations of NGC 5474, the net count rate was s-1 (orange circle in the figure), whereas the background was s-1. When we use 12 arcsec aperture, we find the net count rate s-1 and the background s-1. Therefore, we have detected the source in the last Swift observations. With the total variability amplitude more than two orders of magnitude, we may consider NGC 5474 X-1 as a transient. On the other hand, M66 X-1 shows a variability with a factor of which is rather normal for ULXs (Feng & Soria 2011). For M66 X-1, we use 12 arcsec aperture because of nearby sources around.
Chandra data reductions were carried out using ciao version 4.6 with the CALDB (Calibration Data base) version 4.5.9. All data were filtered in the 0.310 keV energy range. The spectra were grouped to have at least 20 counts per bin for good statistical quality. The spectral analysis was performed using xspec version 12.8.
Using the longest exposure observation, we find that NGC 5474 X-1 has a hard X-ray spectrum. This spectrum is best fitted by an absorbed power-law model phabs*pl, giving a reduced with 189 degrees of freedom (dof). The best-fitting model has a power-law photon index of = and a hydrogen column density of = () cm-2. The calculated unabsorbed flux in the (0.310) keV energy range is erg cm-2 s-1. We have found that the luminosity of the source is erg s-1.
The X-ray spectrum of the ULX in M66 is best fitted with the same model at reduced 1.35 with 184 dof (the longest exposured observation). The resulting model parameters are = and = () cm-2. The source has a flux of erg cm-2 s-1. This yield a luminosity of =2.0 erg s-1.
To make astrometry and photometry of NGC 5474, X-1 we used HST ACS/WFC/ and images taken on 2012 February 26; for M66 X-1 we used ACS/WFC/ image taken on 2004 December 31, ACS/WFC/ and images taken on 2009 December 14. For X-ray images we used the longest Chandra observations for both sources. In each Chandra image, we identified six point-like sources with a flux larger than 30 counts which makes their identification unambiguous. In the result, we derived a position for NGC 5474 X-1 RA = , Dec. = with an accuracy better than 0.16 arcsec and a position for M66 X-1 RA = , Dec. = with an accuracy better than 0.13 arcsec. In Fig. 2, we present these positions of our ULXs.
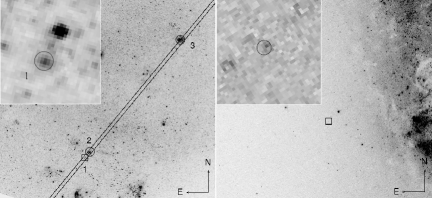
The photometry was performed on drizzled images, using the apphot package in iraf. All magnitudes are given in Vegamag system. The background was estimated from a concentric annulus around the objects. The optical counterpart of NGC 5474 X-1 is extended (Fig. 2), its size 0.22 arcsec 0.17 arcsec in the ACS/WFC/ image, whereas the surrounding stars have FWHM 0.11 arcsec. The counterpart may be complex. The measurements were performed with the aperture radius of 0.175 arcsec (3.5 pixels) in order to reduce contamination from nearby sources. The aperture corrections were not used due to a complex morphology of this object. The reddening correction was done in Synphot package using the Galactic extinction value (Schlegel, Finkbeiner, & Davis, 1998) for NGC 5474. An extinction found in our spectra (see below), coincides with the Galactic value. The dereddened magnitudes of the ULX counterpart are and .
We have also carried out a photometry of the nearby objects. The brightest star shown in the zoomed image of Fig. 2 (left), separated from the ULX counterpart by about 0.5 arcsec, has and . The magnitudes were corrected for aperture and reddening. This star is a major contributor to the spectrum of the object 1 (Figs 2 and 3). We also measured magnitudes of an emission-line galaxy (object 2 in the same figure), and . The photometry of the star and the galaxy have been performed with aperture radii of 0.1 and 0.3 arcsec, respectively.
The corrected position of M66 X-1 on the HST image can be seen within the X-ray error box in Fig. 2. It looks as a single star with extended background in the and filters. In the filter however, in a southern part of the box, the background becomes brighter, and a redder object appears in the error box. Therefore, we choose two apertures, a smaller one (with a radius of 0.1 arcsec) for bright blue component and a larger one (0.2 arcsec) to measure the total flux without aperture corrections. A reddening correction for M66 has been done using the Galactic value (Schlegel et al. 1998). In the smaller aperture, we found the magnitudes , m, and for . In the larger aperture we found , and . The redder object contaminates the larger aperture.
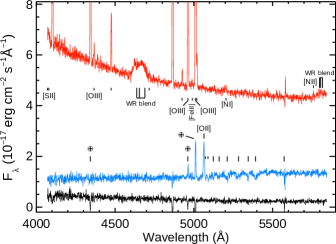
Long-slit spectroscopy of the NGC 5474 X-1 was obtained using the 6 m BTA telescope on 2014 January 02. The SCORPIO instrument was used with the grism VPHG1200G which covers a spectral range of 4000–5700 Å and provides a resolution of 5 Å (Afanasiev & Moiseev, 2005). The seeing was arcsec during the night. A total exposure of 5520 s was acquired. All the data reduction and calibrations were performed with midas procedures.
The optical spectra are shown in Fig. 3. The ULX counterpart is strongly contaminated by the nearby star of 23 mag. We find that the spectrum is blue. We also determined extinction from the H/H line ratio using surrounding H II nebulae. We have found the extinction value for NGC 5474 as , therefore we exclude extinction contamination of the galaxy. Other objects captured by the slit are also shown in the figure. The cluster (3 in Fig. 2) with z0.00075 belongs to NGC 5474. It shows emission lines typical for young clusters (Schaerer, Contini, & Pindao, 1999).
2.1 Discussion and Conclusions
We calculated a ratio of optical () to X-ray (0.310 keV) luminosities for our two ULXs; for NGC 5474 X-1 and for M66 X-1. Optical luminosity of the NGC 5474 counterpart has been derived by the extrapolation to the band. The X-ray luminosity has been taken from Swift data (orange circle in Fig. 2) as the nearest date to the optical data (MJD ). For M66 X-1, we used the band magnitude taken in 0.2 arcsec aperture and the nearest Swift observation (2009 July 4 and 7).
We have estimated the same ratio values for other well-studied ULXs: NGC 6946 ULX-1, Holmberg IX X-1, Holmberg II X-1, NGC 5408 X-1, IC342 X-1, NGC 1313 X-1, NGC 1313 X-2, NGC 5204 X-1, NGC 4559 X-7 and M81 X-6 (Tao et al., 2011; Yang, Feng, & Kaaret, 2011; Vinokurov, Fabrika, & Atapin, 2013; Sutton, Roberts, & Middleton, 2013; Pintore et al., 2014). The average value for these sources is , where a minimal one (260) is in NGC 6946 ULX-1 and a maximal one (4200) in M81 X-6. All the X-ray luminosities were estimated in the 0.310 keV range. A well-known HLX-1 ESO243-49 (Soria et al., 2012) has . Note that this ratio was derived for two different states of the HLX-1, when the luminosities were differed by a factor of 2. In the brighter state the ratio is about 40 % higher than that in the fainter state.
We find that the both our sources are outside of the ULX interval for : NGC 5474 X-1 is below the range while M66 X-1 has a greater . If we compare the sources with AGNs, we find that absolute majority of AGNs have the ratio from 0.1 to 10 (Aird et al., 2010), in extreme cases of heavily obscured AGNs the ratio is approached (Della Ceca et al., 2015). We may conclude that if a source has , it certainly must be a ULX. We do not have an optical luminosity of NGC 5474 X-1 in its X-ray bright state. If its counterpart does not change notably the optical brightness (as it is in other ULX counterparts), in the bright state the ratio will be . AGNs can not change their X-ray luminosities more than two orders of magnitude as we observed in NGC 5474 X-1. Therefore, this source is obviously a ULX.
It was suggested from X-ray and optical data (Sutton, Roberts, & Middleton, 2013; Fabrika et al., 2015) that ULXs are super-Eddington sources with stellar-mass black holes. If in standard accretion discs, the total luminosity is scaled with the mass accretion rate as , in the supercritical discs, it depends on black hole mass and is nearly independent of mass accretion rate, , where erg s-1 is the Eddington luminosity, and corresponding mass accretion rate, is a black hole mass expressed in , and is the parameter accounting for advection (Poutanen et al. 2007). This is because the excess gas is expelled as a disc wind and the accreted gas is advected with the photon trapping, contributing little to the photon luminosity. The mass accretion rate can provide a factor of several in the logarithmic term. Besides that, the funnel in the super-Eddington disc wind will collimate the X-ray radiation to an observer also with a factor of a few, when observer may look at the funnel (Ohsuga & Mineshige, 2011). Thus, the apparent X-ray luminosity of a ULX with a stellar mass black hole may well be up to erg s-1.
In the super-Eddington disc the ultraviolet/optical luminosity does depend stronger on the mass accretion rate, because the excess gas forms the wind reprocessing the disc X-ray radiation. Fabrika et al. (2015) have found that the ULX optical counterparts have very hot winds resembling WNL-type stars and their optical spectra are also very similar to that of SS 433. Using simple relations for the supercritical discs, they found that the optical luminosity of such discs is because the stronger wind will reprocess more radiation emerging in the disc funnel.
We may conclude therefore that these two sources NGC 5474 X-1 and M66 X-1 do belong to the ULX-type, and their high ratios are determined as usual for ULXs X-ray luminosity, but a lower optical luminosity. This large ratio may be due to faint donor stars and it is quite possible that their optical emission might arise from these stars. Taking into account the colour and magnitude of the optical counterparts, they may represent F-G-type stars. Their optical luminosities might be also explained by lower (but nevertheless supercritical) mass accretion rates in these systems. They could be compared with the most dim ULXs in optical such as M81 X-6 or NGC 1313 X-1 whose X-ray-to-optical luminosities are .
Acknowledgements
The authors are grateful to D. Swartz and S. Balman for helpful comments regarding X-ray data of NGC 5474 X-1. Our results are based on observations made with the NASA/ESA Hubble Space Telescope, obtained from the data archive at the Space Telescope Science Institute. STScI is operated by the Association of Universities for Research in Astronomy, Inc. under NASA contract NAS 5-26555. This research has made use of data obtained from the Chandra Data Archive and software provided by the Chandra X-ray Center (CXC) in the application package CIAO. This work made use of data supplied by the UK Swift Science Data Centre at the University of Leicester. This work is based on observations obtained with XMM-Newton, an ESA science mission with instruments and contributions directly funded by ESA Member States and NASA. The research was supported by the Russian RFBR grant 13-02-00885, the Program for Leading Scientific Schools of Russia N 2043.2014.2, the Russian Scientific Foundation (grant N 14-50-00043). SA acknowledge support from the Scientific and Technological Research Council of Turkey (TUBITAK) through project no. 113F039. SF and AV acknowledge support of the Russian Government Program of Competitive Growth of Kazan Federal University.
References
- Abolmasov et al. (2007) Abolmasov P., Fabrika S., Sholukhova O., Afanasiev V., 2007a, Astrophys. Bull., 62, 36
- Abolmasov et al. (2007) Abolmasov P. K., Swartz D. A., Fabrika S., Ghosh K. K., Sholukhova O., Tennant A. F., 2007b, ApJ, 668, 124
- Afanasiev & Moiseev (2005) Afanasiev V. L., Moiseev A. V., 2005, Astron. Lett., 31, 194
- Aird et al. (2010) Aird J., et al., 2010, MNRAS, 401, 2531
- Caballero-García & Fabian (2010) Caballero-García M. D., Fabian A. C., 2010, MNRAS, 402, 2559
- Colbert & Mushotzky (1999) Colbert E. J. M., Mushotzky R. F., 1999, ApJ, 519, 89
- Della Ceca et al. (2015) Della Ceca R., et al., 2015, MNRAS, 447, 3227
- Drozdovsky & Karachentsev (2000) Drozdovsky I. O., Karachentsev I. D., 2000, A&AS, 142, 425
- Fabrika (1997) Fabrika S. N., 1997, Ap&SS, 252, 439
- Fabrika (2004) Fabrika S., 2004, Astrophys. Space Phys. Rev., 12, 1
- Fabrika et al. (2015) Fabrika S., Ueda Y., Vinokurov A., Sholukhova O., Shidatsu M., 2015, Nature Phys., 11, 551
- Feng & Soria (2011) Feng H., Soria R., 2011, New Astron. Rev., 55, 166
- Freitag, Gürkan,& Rasio (2006) Freitag M., Gürkan M. A., Rasio F. A., 2006, MNRAS, 368, 141
- Gladstone, Roberts, & Done (2009) Gladstone J. C., Roberts T. P., Done C., 2009, MNRAS, 397, 1836
- Gladstone et al. (2013) Gladstone J. C., Copperwheat C., Heinke C. O., Roberts T. P., Cartwright T. F., Levan A. J., Goad M. R., 2013, ApJS, 206, 14
- Grisé et al. (2011) Grisé F., Kaaret P., Pakull M. W., Motch C., 2011, ApJ, 734, 23
- Lee & Jang (2013) Lee M. G., Jang I. S., 2013, ApJ, 773, 13
- Liu, Bregman, & Seitzer (2004) Liu J.-F., Bregman J. N., Seitzer P., 2004, ApJ, 602, 249
- Kaaret, Ward, & Zezas (2004) Kaaret P., Ward M. J., Zezas A., 2004, MNRAS, 351, L83
- Kuntz et al. (2005) Kuntz K. D., Gruendl R. A., Chu Y.-H., Chen C.-H. R., Still M., Mukai K., Mushotzky R. F., 2005, ApJ, 620, L31
- Madau & Rees (2001) Madau P., Rees M. J., 2001, ApJ, 551, L27
- Motch et al. (2014) Motch C., Pakull M. W., Soria R., Grisé F., Pietrzyński G., 2014, Nature, 514, 198
- Medvedev & Fabrika (2010) Medvedev A., Fabrika S., 2010, MNRAS, 402, 479
- Ohsuga & Mineshige (2011) Ohsuga K., Mineshige S., 2011, ApJ, 736, 2
- Pintore et al. (2014) Pintore F., Zampieri L., Wolter A., Belloni T., 2014, MNRAS, 439, 3461
- Portegies Zwart et al. (2004) Portegies Zwart S. F., Baumgardt H., Hut P., Makino J., McMillan S. L. W., 2004, Nature, 428, 724
- Poutanen et al. (2007) Poutanen J., Lipunova G., Fabrika S., Butkevich A. G., Abolmasov P., 2007, MNRAS, 377, 1187
- Poutanen et al. (2013) Poutanen J., Fabrika S., Valeev A. F., Sholukhova O., Greiner J., 2013, MNRAS, 432, 506
- Schaerer, Contini, & Pindao (1999) Schaerer D., Contini T., Pindao M., 1999, A&AS, 136, 35
- Schlegel, Finkbeiner, & Davis (1998) Schlegel D. J., Finkbeiner D. P., Davis M., 1998, ApJ, 500, 525
- Soria et al. (2005) Soria R., Cropper M., Pakull M., Mushotzky R., Wu K., 2005, MNRAS, 356, 12
- Soria et al. (2012) Soria R., Hakala P. J., Hau G. K. T., Gladstone J. C., Kong A. K. H., 2012, MNRAS, 420, 3599
- Stobbart, Roberts, & Wilms (2006) Stobbart A.-M., Roberts T. P., Wilms J., 2006, MNRAS, 368, 397
- Sutton, Roberts, & Middleton (2013) Sutton A. D., Roberts T. P., Middleton M. J., 2013, MNRAS, 435, 1758
- Swartz, Tennant, & Soria (2009) Swartz D. A., Tennant A. F., Soria R., 2009, ApJ, 703, 159
- Swartz et al. (2011) Swartz D. A., Soria R., Tennant A. F., Yukita M., 2011, ApJ, 741, 49
- Tao et al. (2011) Tao L., Feng H., Grisé F., Kaaret P., 2011, ApJ, 737, 81
- Vinokurov, Fabrika, & Atapin (2013) Vinokurov A., Fabrika S., Atapin K., 2013, Astrophys. Bull., 68, 139
- Yang, Feng, & Kaaret (2011) Yang L., Feng H., Kaaret P., 2011, ApJ, 733, 118