Investigating AGN Black Hole Masses and the MBH- relation for Low Surface Brightness Galaxies
Abstract
We present an analysis of the optical nuclear spectra from the active galactic nuclei (AGN) in a sample of low surface brightness (LSB) galaxies. Using data from the Sloan Digital Sky Survey (SDSS), we derived the virial black hole (BH) masses of 24 galaxies from their broad H parameters. We find that our estimates of nuclear BH masses lie in the range , with a median mass of 5.62 x 10. The bulge stellar velocity dispersion was determined from the underlying stellar spectra. We compared our results with the existing BH mass - velocity dispersion () correlations and found that the majority of our sample lie in the low BH mass regime and below the correlation. We analysed the effects of any systematic bias in the MBH estimates, the effects of galaxy orientation in the measurement of and the increase of due to the presence of bars and found that these effects are insufficient to explain the observed offset in MBH - correlation. Thus the LSB galaxies tend to have low mass BHs which probably are not in co-evolution with the host galaxy bulges. A detailed study of the nature of the bulges and the role of dark matter in the growth of the BHs is needed to further understand the BH-bulge co-evolution in these poorly evolved and dark matter dominated systems.
keywords:
galaxies: active - galaxies: nuclei - galaxies: bulges - galaxies: general1 Introduction
Low surface brightness (LSB) galaxies are late type galaxies that have a central disk surface brightness of 22 to 23 mag arcsec-2 (Impey & Bothun 1997; Impey, Burkholder & Sprayberry 2001; Das 2013). Optically they are distinguished by their diffuse, low luminosity stellar disks. The LSB disks have low star formation rates and are low in metal content (McGaugh 1994, Impey & Bothun 1997). Morphologically they span over a wide range of galaxies from dwarfs and irregulars to very large disk galaxies (McGaugh, Schombert & Bothun 1995). However loosely they can be divided into two types the (i) LSB dwarf and irregular galaxies and (ii) disk LSB galaxies. The LSB dwarfs and irregulars form the larger fraction of LSB galaxies and can be found in different environments such as galaxy groups or even within voids (Pustilnik et al., 2011). Disk LSB galaxies are more rare and usually found in low density environments (Bothun et al., 1993) and vary over a range of sizes (Beijersbergen, de Blok & van der Hulst, 1999). But the LSB galaxies with really large disk scale lengths (like Malin 1 which has a scale length of 55 kpc, Bothun et al. 1987), referred to as giant LSB (GLSB) galaxies, are generally found to lie close to the edges of voids (Rosenbaum et al., 2009). A recent study by Shao et al. (2015) on the environment, morphology and stellar populations of a sample of bulgeless LSB galaxies suggest that their evolution may be driven by their dynamics including mergers rather than by their large scale environment. Another defining characteristic of all LSB galaxies is their large Hi gas content. Large or small, LSB galaxies usually have large Hi disks that can extend over several optical disk scale lengths (de Blok, McGaugh & van der Hulst 1996; O’Neil et al. 2004; Das et al. 2007). The Hi rotation curves clearly show that their disks are dark matter dominated (Pickering et al., 1997) and even their centers have significant dark matter content (Kuzio de Naray, McGaugh & de Blok, 2008). The dark matter halo can suppress the formation of disk instabilities such as bars and spiral arms, which slows down the rate of star formation in these systems (Mayer & Wadsley 2004, Ghosh & Jog 2014).
Nuclear activity is not common in LSB galaxies. This is in marked contrast to high surface brightness disk galaxies where the percentage having active galactic nuclei (AGN) can be as high as 50, depending on the mean luminosity of the sample (Ho, Filippenko & Sargent, 1997). The most probable explanation for this low fraction is that LSB disks generally lack two structural features that facilitate inward gas flows and the formation of a central mass concentration in galaxies - bars and strong spiral arms in disks (Bothun, Impey & McGaugh, 1997). These structural features may be are suppressed by the dominant dark matter content in these galaxies (Ghosh & Jog, 2014). Most of the GLSB galaxies have significant bulge component along with the large LSB disk (Beijersbergen, de Blok & van der Hulst, 1999). Whereas a large fraction of normal LSB disk galaxies are relatively bulgeless (McGaugh & Bothun 1994). But there is often a bright core due to nuclear star formation which appears as a luminous point in a featureless low luminosity disk (Matthews et al., 1999). Strong H and [O i] emission lines in their spectra indicate ongoing nuclear star formation which is often in the form of kiloparsec (kpc) scale rings, as observed in the galaxy NGC 5905 (Comerón et al. 2010; Raichur et al. 2013; Raichur et al. 2015). Hubble space telescope (HST) observations have shown that the nuclear star formation can lead to the formation of compact nuclear star clusters that may sometimes co-exist with AGN activity (Seth et al., 2008). This activity can contribute to the formation of a central massive object (CMO) and lead to the build up of a bulge in an otherwise bulgeless galaxy (Davies, Miller & Bellovary, 2011).
However, although we do not generally see AGN in LSB galaxies, a significant fraction of bulge dominated GLSB galaxies do show AGN activity (Sprayberry et al. 1995; Galaz et al. 2011). Some of them are even radio bright and visible in X-rays (Das et al. 2009, Naik et al. 2010, Mishra et al. 2015). Galaz et al. (2011) compared the stellar mass, radius, absolute magnitude and the red shift distributions of LSB galaxies and High Surface Brightness (HSB) galaxies hosting AGN. They found that most of the distributions for LSB galaxies and HSB galaxies are similar, except the distribution of petrosian radius, r90. AGN activity in bulge dominated GLSB galaxies is not surprising as studies indicate that the growth of nuclear black holes (BHs) in galaxies is intimately linked to the growth of their bulges (e.g. Silk & Rees 1998a; Heckman et al. 2004a). The strong correlation of BH mass (MBH) with bulge mass or bulge luminosities in galaxies (MBH - ) is due to this super massive black hole (SMBH) - bugle co-evolution (Gültekin et al. 2009 and McConnell & Ma 2013). But in LSB galaxies, their bulge velocity dispersion and disc rotation speeds suggest that they lie below the MBH - correlation for bright galaxies (Pizzella et al., 2005). X-ray studies also suggest that GLSB galaxies do not lie on the radio X-ray correlation (Das et al., 2009) and their BH masses may be quite low (Naik et al., 2010).
Mei, Yuan & Dong (2009) estimated the BH masses of three GLSB galaxies and found them to lie close to the MBH - correlation and the values of MBH are found to be in the order of 107 M⊙. But later, the estimates from the study of another three GLSB galaxies by Ramya, Prabhu & Das (2011) showed that their sample galaxies lie offset from the MBH - correlation, with MBH values of 3-9 x 10⁵ M⊙. Thus these studies suggest that LSB galaxies tend to have low mass BHs 107 M and some of them lie below the MBH - correlation. A systematic study of a larger sample of LSB galaxies is needed to show a convincing trend.
Ramya, Prabhu & Das (2011) suggested that the bulges of their sample might be well evolved, but the MBH values are lower than those found in bright galaxies. Beijersbergen, de Blok & van der Hulst (1999) could not find any distinction between the structural parameters (bulge to disk ratio and size) of the bulges in the LSB galaxies and normal galaxies. Morelli et al. (2012) found that the stellar populations in the bulges of LSB galaxies have similar properties as that of the bulges of normal galaxies. Based on this they concluded that the formation and evolution history of bulges in LSB galaxies are similar to that of the bulges in normal galaxies. Pizzella et al. (2008) found signatures of pseudo bulges in 6 galaxies with LSB disk. Kormendy & Ho (2013) and references therein suggest that these pseudo bulges do not correlate with BHs in the same way as classical bulges correlate. The two LSB galaxies, UGC 6614 and Malin 2 studied by Ramya, Prabhu & Das (2011) which lie off from the MBH - relation are more likely to host classical bulges (Das 2013, Schmitz et al. 2014). If they host classical bulges then the reason of their observed offset is not clear. The significant contribution of dark matter in the inner regions may also affect the growth of the BHs in these systems. The total sample of bulge dominated LSB galaxies with AGN activity, specifically studied so far is very small (6 galaxies) to say any statistically significant trend on the mass of the BHs, their location in the MBH - correlation and the nature of the bulges they host. Though some of the LSB galaxies have been analysed in other studies of a large sample of AGN dominated systems (BH mass estimates for the galaxies, 1226+0105 and LSBC F727-V01, are available from Greene & Ho 2007), there is no specific study dedicated to analyse a large sample of LSB galaxies and to understand the BH-bulge co-evolution in these systems. A systematic study of a large sample of LSB galaxies is needed to understand the AGN activity, typical range of MBH values, nature of their bulges and the BH-bulge co-evolution in these poorly evolved and dark matter dominated systems. Low mass BHs in isolated LSB galaxies are also very interesting candidates for the study of seed BHs in galaxies (Volonteri, 2010).
In this paper, we present a detailed analysis of 24 bulge dominated LSB galaxies with signatures of type - I AGN (broad H component) identified from a large sample of 558 LSB galaxies to understand the AGN activity and to estimate the mass of the BHs present in their centers. Based on their location in the MBH - plot and from the nature of their bulges we discuss the presence/absence of BH-bulge co-evoloution in these systems. In the following sections (Section: 2 and Section: 3) we discuss the sample and analysis. The results are described in Section: 4. Discussion and conclusions are presented in Sections: 5 and 6 respectively.
2 Data and Sample
The Sloan Digital Sky Survey (SDSS) Data Release 10 (DR10) include hundreds of thousands of new galaxy and quasar spectra from the Baryon Oscillation Spectroscopic Survey (BOSS), in addition to all imaging and spectra from prior SDSS data releases. The spectral range of the SDSS multi-object spectrograph and the BOSS spectrograph is almost similar and the spectra resolution is 70 km/s for both instruments. The SDSS spectrograph fibre aperture is 3 arcsec in diameter (corresponding to 2.9 kpc at a redshift of 0.05) and the fibre aperture of BOSS spectrograph is 2 arcsec in diameter (corresponding to 1.9 kpc at a redshift of 0.05). Thus the size of the nucleus/bulge sample in the BOSS spectra will be less than that of the SDSS spectra.
The literature (Impey et al. 1996, Sprayberry et al. 1995, Schombert & Bothun 1988, Schombert et al. 1992, Burkholder, Impey & Sprayberry 2001, Galaz et al. 2002) provides a large sample ( 1200) of LSB galaxies. As an initial sample we selected a sample of 558 LSB galaxies from the literature, mentioned above, for which the SDSS DR10 nuclear spectra are available. The emission line fluxes of these 558 galaxies are available for public in the SDSS DR10 database. The Galspec product in the SDSS database provides the emission line fluxes for SDSS-I/II galaxies estimated based on the methods given by Kauffmann et al. (2003b), Brinchmann et al. (2004) and Tremonti et al. (2004). The emission line fluxes for SDSS III BOSS spectra are provided by the team in University of Portsmouth (Thomas et al., 2013).

The H, H, [Nii]6583 and [Oiii]5007 emission line fluxes of the 558 galaxies, were extracted from SDSS database using SQL query and the [Nii]6583/H vs [Oiii]5007/H Baldwin-Phillips-Terlevich (BPT) [first given by Baldwin, Phillips & Terlevich 1981 and improved further by Veilleux & Osterbrock 1987, also see Kewley et al. 2001 and Kewley et al. 2006 and references therein] diagram is constructed. This is shown in Figure: 1. The solid line is the starburst-Seyfert demarcation line taken from Kauffmann et al. (2003a) and the dotted line represents the extreme starburst line taken from Kewley et al. (2001). This is used as our primary diagnostic to select the AGN candidates for our further investigation. The sample to the left of solid line are considered as purely star forming galaxies and the sample to the right of the dotted line are considered as pure AGN candidates. The sample between the two lines are classified as composite and the nuclear activity of these galaxies are expected to have significant contribution from both star formation and AGN activity (Kewley et al., 2006). As the spectra of composite sample in general indicate some contribution from an AGN (Trouille, Barger & Tremonti 2011; Jia et al. 2011), they are included in our sample to investigate the AGN activity and to estimate the mass of the BH in their center. Out of 558 galaxies shown in diagnostic diagram, 160 galaxies (29%, with almost equal contribution from the composite and purely AGN candidates) constitute our AGN sample and the remaining 398 (71%) galaxies are purely star forming systems. Previous studies suggested a range of values for the fraction of LSB galaxies which host AGN, from 5% (Impey, Burkholder & Sprayberry 2001, Galaz et al. 2011) to 50% (Sprayberry et al. 1995, Schombert 1998). Our estimate of 29% is including the composite and AGN sample. If we consider only the sample which are classified as pure AGN candidates, the fraction is 16%. This value is closer to the estimates of Mei, Yuan & Dong 2009) who found a fraction of 10-20% LSB galaxies have AGN.
From the sample of 160 galaxies (which constitute the purely AGN candidates and composite candidates) we are particularly interested in those which host broad H emission. The broad H emission line full width at half maximum (FWHM) and luminosity can be used to estimate the masses of active BHs in the centers of these galaxies (Reines, Greene & Geha, 2013). To identify the sample with broad H, good quality spectra are required and hence, out of 160 galaxies we selected only those galaxies which have median S/N 15. Thus, finally we used an initial sample of 115 SDSS DR10 spectra of LSB galaxies to identify sources with broad balmer lines, specifically the H line which is the strongest balmer emission line in the optical wavelength region. The steps involved in the analysis of these 115 galaxies are described in the next section.
3 Analysis
3.1 Spectral Decomposition
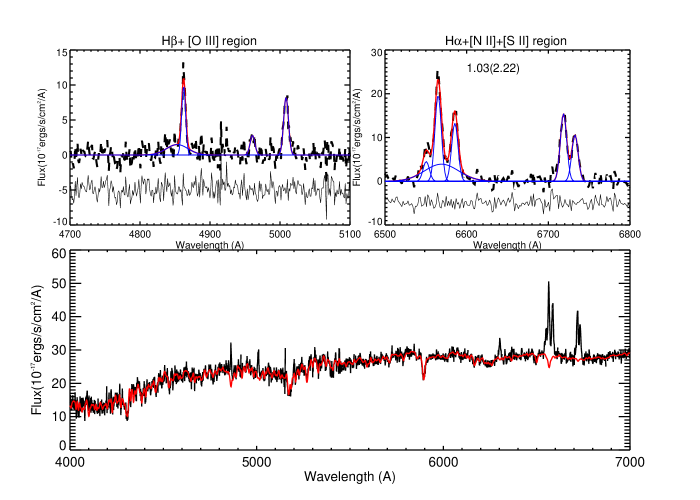
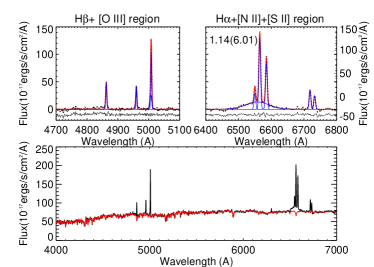
In order to isolate the AGN emission lines and identify the sample with broad H feature, we first removed the spectral contribution from underlying stellar population. The observed spectra of 115 galaxies were corrected for galactic reddening using the E(B-V) values provided by Schlafly & Finkbeiner (2011). Then we used the pPXF (Penalized Pixel-Fitting stellar kinematics extraction) code by Cappellari & Emsellem (2004) to obtain the best fit model for the underlying stellar population. The emission lines in the observed spectra were masked and the several masked spectra were modelled as a combination of single stellar population templates of different ages. The MILES single stellar population models are used as templates of the underlying stellar population. The templates are available for a large range of metallicity ([M/H] -2.32 to +0.22) and age (63 Myr to 17 Gyr). pPxF uses Gauss-Hermite parametrization (Gerhard 1993; van der Marel & Franx 1993) and works in the pixel space, which makes it easy to mask gas emission lines or bad pixels from the fit and the continuum matching can be done directly (Cappellari & Emsellem, 2004). pPxF creates an algorithm with initial guesses for systemic velocity of the system, V (redshift, z) and stellar velocity dispersion, . The model spectra are convolved with a broadening function using initial values. The residuals of each of the data points are fed into a non-linear least squares optimization routine to obtain V, and Gauss-Hermite polynomials. Though the major contribution to the observed spectra is the underlying stellar population, there are other contributors like power law continuum from AGN, Fe lines etc. While estimating the best fit to the underlying population, ppxf fits a polynomial, along with the optimal template, to account for the contributions from power law continuum. And the Fe lines in these galaxies are too weak to affect our further analysis. In all our sample galaxies the stellar population contribution to the best fit ranges from 80 - 95 % and the remaining factor is the contribution from AGN continuum and Fe lines. The output of this step of analysis is shown in the bottom panel of Figure: 2 (for the galaxy Malin 1 with identification number, 13). The reddening corrected spectra is shown in black and the best fit model is overplotted in red colour. The best fit model is subtracted from the reddening corrected spectrum to get the pure emission line spectrum (the residue of the pPXF fit).
| No | Galaxy | Morphology | Galaxy | Distance | fracDev | nb |
|---|---|---|---|---|---|---|
| Coordinates | (Mpc) | B/T | ||||
| 1 | 1226+0105 or 2MASX J12291286+0049042 | Sc | 12h29m12.8s +00∘49’04” | 349 | 1.0 | 7.95 |
| 2 | VIII ZW 318 | Sc (Merging pair?) | 13h30m32.0s -00d36m14s | 237 | 0.87 | 1.43 |
| 3 | 2MASX J14384627+0106576 | Sc | 14h38m46.3s +01d06m58s | 365 | 1.0 | 7.47 |
| 4 | Leda 135884 | Sb | 23h15m01.7s +00d04m24s | 214 | 0.61 | 7.97 |
| 5 | NGC 7589 | SAB(rs)a | 23h18m15.7s +00d15m40s | 120 | 0.98 | 5.91 |
| 6 | UGC 00568 | Sd | 00h55m08.9s -01d02m47s | 189 | 1.0 | 4.88 |
| 7 | 2MASX J00534265-0105066 | SBc | 00h53m42.6s -01d05m07s | 193 | 1.0 | 6.36 |
| 8 | UGC 00514 | Sb | 00h50m42.7s +00d25m58s | 291 | 0.34 | 8.0 |
| 9 | LSBC F611-03 | Sc | 01h13m20.1s +14d43m40s | 180 | 1.0 | 5.35 |
| 10 | ZW 091 | Interacting | 10h37m23.8s +02d18m43s | 173 | 0.93 | 3.41 |
| 11 | ZW 437 | Sc(r) | 14h36m02.0s +02d51m06s | 124 | 1.0 | 8.0 |
| 12 | LSBC F727-V01 | Sc | 15h51m40.5s +08d52m26s | 307 | 1.0 | 6.16 |
| 13 | Malin 1 | S | 12h36m59.3s +14d19m49s | 366 | 1.0 | 5.62 |
| 14 | UGC 10050 | Spiral | 15h49m44.9s +18d31m37s | 58.7 | 1.0 | – |
| 15 | LSBC F500-V01 | Spiral | 10h23m33.1s +22d47m46s | 320 | 0.98 | 5.06 |
| 16 | NGC 0926 | SB(rs)bc | 02h26m06.7s -00d19m55s | 86 | 0.56 | – |
| 17 | UGC 09087 | S0 | 14h12m16.8s +18d17m58s | 74.5 | 0.91 | – |
| 18 | UGC 08828 | Spiral | 13h54m26.8s +21d49m48s | 120 | 0.38 | – |
| 19 | 2MASX J10255577+0200154 | SBb | 10h25m55.7s +02d00m16s | 304 | 0.93 | 6.24 |
| 20 | IC 2423 | SAB(s)b | 08h54m47.1s +20d13m13s | 132 | 1.0 | – |
| 21 | LSBC F564-01 | Galaxy Pair | 09h10m29.4s +20d33m53s | 123 | 1.0 | 5.16 |
| 22 | SDSS J103704.86+202627.3 | Spiral | 10h37m04.9s +20d26m27s | 184 | 1.0 | 3.87 |
| 23 | 2MASX J14565122+2152295 | Spiral | 14h56m51.2s +21d52m30s | 195 | 0.79 | 8.0 |
| 24 | UGC 06614 | SA(r)a | 11h39m14.9s +17d08m37s | 93.2 | 1.0 | – |
| 25 | LSBC F508-02 | Sb | 13h06m59.0s +22d44m15s | 150 | 1.0 | 4.21 |
| 26 | KUG 0012-000 | Sb | 00h14m55.1s +00d15m08s | 160 | 0.57 | 3.68 |
| 27 | CGCG 006-023 | Spiral | 09h16m13.7s +00d42m02s | 166 | 0.98 | 8.0 |
| 28 | UGC 06284 | Galaxy pair | 11h15m49.1s +00d51m36s | 200 | 0.89 | 3.53 |
| 29 | LSBC F573-04 | Sb | 12h18m15.2s +20d00m40s | 127 | 0.42 | 5.77 |
| 30 | UGC 05035 | SBa | 09h27m10.2s +21d35m38s | 161 | 1.0 | 5.4 |
3.2 Emission line analysis
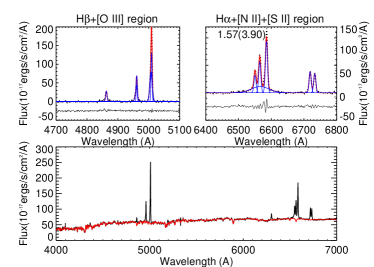
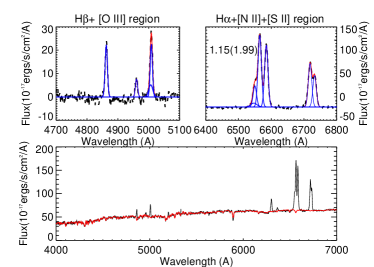
The pure emission line spectra are carefully analysed by modelling the narrow lines and simultaneously looking for the presence of broad balmer line profiles. Broad balmer lines indicate the presence of dense gas orbiting the central BH within the broad line region. For the sample with broad balmer lines, MBH can be estimated using scaling relations. The H line is the strongest balmer line in the optical wavelength region and hence to identify the final sample with broad balmer lines, we analysed the spectra of the initial sample in the wavelength range, 6400-6880 Å. As the H line is blended with the [Nii] doublet, we need to carefully fit this region to extract the broad line component of H. The method adopted here is similar to that described in Reines, Greene & Geha (2013). The method is based on the assumption that the [Sii] doublet lines close to the H region and well separated, are a good representation of the shape of the [Nii], H and H narrow lines. The [S ii] doublet is fitted with a single Gaussian model with the width of the two lines assumed to be equal and the relative separation between the two lines held fixed by their laboratory wavelengths. The [Sii] model is used as a template to fit the narrow H and [Nii] doublet lines. The H + [Nii] region of our emission line galaxy spectra are first modelled with three Gaussian components, one for H narrow and two for [Nii] doublet. The widths of [Nii] lines are assumed to be the same as that of [Sii] lines. The separation between the centroids of the [Nii] narrow components are held fixed using laboratory wavelengths and the flux of [Nii]6583 to [Nii]6548 is fixed at the theoretical value of 2.96 (Ludwig et al., 2012). The reduced value for the fit is obtained. Then the region is again fitted including a fourth component representing the broad H line. The final sample with broad H component is selected based on the three criteria, that the the inclusion of the broad component should improve the reduced value by at least 10%, the broad H FWHM should be greater than 600 kms-1 (after correcting for the instrumental resolution) and also the broad H peak flux should be at least two times larger than the residue of the fit. Thus based on the above criteria, 30 LSB galaxies were flagged as galaxies with broad H component. The basic parameters of these 30 galaxies are given in Table 1. More careful examination of the model fits of each of these 30 galaxies are performed before making the final sample of broad line AGN candidates for which the BH masses are estimated. This is described in Section: 4. 3.
The other emission lines present in the spectra of these 30 galaxies were also analysed. The narrow line profile derived from the [S ii] doublet is also used as a template for fitting H, using the same approach as that for H. The H line is fit twice, with and without a broad component. Here the width of broad H line is assumed to be the same as that of the broad H line. Based on the same criteria used to identify the broad component in H, the broad component in H is also identified. Since the [O iii] profile commonly exhibits a broad, blue shoulder (Heckman et al. 1981; Whittle 1985), the [O iii] doublet are fitted independently with one or two Gaussian components (the two component model is included if the reduced improves by 10 %. The [O i] doublet lines are also independently fitted with single Gaussian component. We have used the standard ’MPFITFUN’ of IDL to fit the emission lines employing the ’GAUSS1’ program where the parameters need to be fit for each Gaussian are centroid, peak value and sigma(fwhm/2.35). The input parameters are wavelength, flux and sqrt(1/inverse variance of flux) as error. The fitting routine provides the best fitting parameters along with errors associated with these parameters. The fluxes of all the emission lines are estimated using the peak and sigma values provided by the fit. Uncertainties in the fitted parameters of peak and sigma are added in quadrature to obtain the error on fluxes. The forbidden narrow emission line fluxes of 30 galaxies are tabulated in Table: A1. The different emission line profile fits of the galaxy, Malin 1 (with identification number 13) are shown in the upper right and upper left panels of Figure: 2.
4 Results
4.1 BPT Classification
As described in Section: 2, the initial sample of AGN candidates (which includes the broad line AGN candidates) were selected based on their location in the [Oiii]/H versus [Nii]/H AGN diagnostic diagram (Figure: 1). After further analysis we found that of these only 30 galaxies have an extra-broad component in their H emission region along with their narrow lines. The narrow emission line fluxes of these 30 galaxies are estimated after carefully deconvolving them from the other components. In this section, we discuss the location of the sample galaxies in the three AGN diagnostic diagrams. In Figure: 3, we revisit the location of these 30 galaxies in the primary diagnostic diagram, [Oiii]/H versus [Nii]/H. From the figure, we can see that 7 galaxies are in the composite region and the remaining 23 galaxies are in the AGN region. Further classification of the sample into Seyfert/LINER are made using the other two AGN diagnostic diagrams, [Oiii]/H versus [Sii]/H and [Oiii]/H versus [O I]/H. These diagrams are shown in Figures: 4 and 5. The demarcation lines between starbursts, Seyferts and LINERs were obtained from Kewley et al. (2001), Kewley et al. (2006) and Kauffmann et al. (2003a) and are shown in these diagrams. The [Oiii]/H versus [O I]/H plot shown in Figure: 5 has only 25 points as the remaining 5 galaxies do not have [O i] in emission. The galaxies, 1, 2, 5, 8, 12, 21 and 23 ( 20% of the sample) are classified as Seyfert type based on Figures 4 and 5. The galaxies in the starburst region in Figure 4 (26, 27 and 29) and Figure 5 (26, 27) are those which are classified as composite in Figure: 3. The galaxy with identification number 29 is not present in Figure: 5 as it does not have [O i] in emission. The galaxy, 17 which is classified as LINER in Figure: 4 lies closer to the starburst/Seyfert demarcation line in Figure: 5. This discrepancy may be due to the very low amount of flux (with relatively large error) associated with the [O i] emission line for this galaxy (see Table A1).


4.2 Metallicity of the sample
The [Nii]6583, [Oiii]5007, H and H narrow emission line fluxes are used to
estimate
the oxygen abundance of the nuclear/bulge regions of the final sample using the empirical relation
derived by Pettini & Pagel (2004). The relation is given as,
12 + log (O/H) = 8.73 - 0.32 x O3N2, where O3N2 is defined as
log [([O iii5007]/H)/ ([N ii6583]/H))]2.
Here we would like to mention that the estimated metallicities are
gas phase metallicity. The metallicity distribution of the sample galaxies is shown
in Figure: 6 and the metalicity value has a range, from log[O/H] = 7.94 to 8.8. The mean metallicity is 8.6, which is only slightly lower than the solar value of 8.69
(Asplund et al., 2009). A few of the galaxies with identification numbers, 26, 18, 16 and 6 in the sample are
slightly super solar. This initially appears surprising as LSB galaxies
are generally low in metallicity. However, these results are derived from nuclear spectra.
Nuclear star formation may result in higher metallicities in the central regions compared to the
disks of LSB galaxies.
Hence due to recent star formation in the central regions, the metallicity
is probably higher than the disks of LSB galaxies. The underlying stellar population obtained from pPXF fits, of these four super solar
metallicity galaxies, except the galaxy with identification number 18, have contributions from young (500 Myr-2 Gyr) and metal rich
(M/H = 0.00 to 0.22) population.

4.3 Broad line AGN candidates
From Section: 3.2 we found that 30 galaxies were identified to host AGN with broad H component in their emission line spectrum. Each of these 30 galaxies were examined carefully to define a sample of broad line AGN candidates. Out of 30, 3 galaxies (with identification numbers, 26, 27 and 29) are classified as star forming galaxies (Figures: 3, 4 and 5). This may be due to the reason that the star formation dominated the narrow emission lines within the SDSS fibre and the underlying broad component is real. But the broad component in H may as well be due to the contribution from stellar phenomenon. In these three galaxies, the broad component detection was marginal and we removed them from our final secure sample of broad line AGN candidates.
The broad H component of other two galaxies (identification numbers, 28 and 30, Figures: 17 and 18) are significantly blue shifted (15 - 17 Å which is 10 - 11 times the error associated with the central wavelength) which can be more likely to be associated with an outflow event rather than with a BH accretion. One of these galaxies (identification number 28) has a similar blueward component in [O iii] along with the blue shifted H balmer line, which also supports the presence of outflow. These two galaxies are also removed from our final sample. For the remaining 25 sample galaxies, except the galaxy with identification number 2, the central wavelengths of the broad and narrow H components are separated by less than 3 times the error associated with the line centers. For the galaxy with identification number 2, the broad and narrow components are separated by 6 times the error associated with the line centers and the broad component is blue shifted. This galaxy also shows a blue shifted outflow signature in [O iii]. It can be assumed that for the galaxy, 2 the broad H component may have contribution from both the broad line region due to BH accretion and from an outflow. We could not deconvolve the components due to the outflow and due to BH accretion using numerical profile fitting. Another galaxy, UGC 6614 (identification number 24) has a clear signature of outflow, blue shifted component in [O iii] doublet lines as well as in H and H emission lines, along with a broad H component. The candidates (identification number 2, 24, 28 and 30) with outflow signatures are discussed in Section: 5.3.
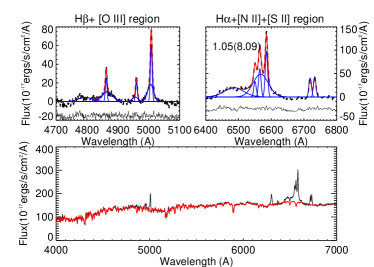
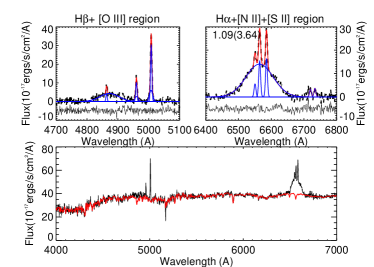
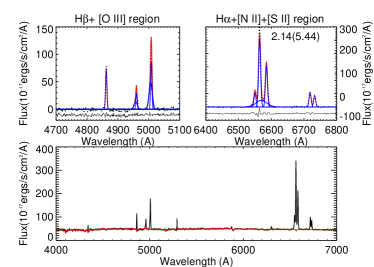
In order to check whether the broad H feature is due to the over subtraction of the H absorption line, we modelled the H absorption line of each sample (obtained from the best fit model, Section: 3.1) with a single Gaussian and obtained the FWHM. The FWHM of H absorption line in our sample galaxies is less than 600 kms-1, which is one of the criteria to identify the broad H component. For all our sample galaxies except the galaxy, LSBC F500-V01, the FWHM of broad H component is above 2-3 times the FWHM of the H absorption line. For LSBC F500-V01 (with identification number, 15), the FWHM of the H absorption line is 550 kms-1 and the FWHM of broad H is 995286 kms-1. Also, the absorption line fit has large residue in the wings. Thus the broad H component of this galaxy may not be real. As the two values are comparable and the absorption line fit is poor, we removed this galaxy from our final sample of broad line AGN candidates. The broad H detection in other sample galaxies appears to be real and not due to the over subtraction of H absorption line. Thus we have 24 confirmed broad line AGN candidates for which the mass of the BH can be estimated using scaling relations. Out of 24 broad line AGN candidates, 8 of them ( 30%) showed the presence of broad H component as well. The broad line parameters are given in Table A2. The emission line fits, similar to Figure: 2, of some of the remaining galaxies are shown in Section: 5.4 and the rest in appendix, A1.

4.4 Mass of the Central Black Hole
The virial MBH of 24 broad line AGN candidates was calculated using the equation given in Reines, Greene & Geha (2013),
using the luminosity and FWHM of broad H. The equation is given below.
In the original equation given in Reines, Greene & Geha (2013) the term log() in the right hand side
is the scale factor that depends on the broad line region geometry. There is a range of values
available in the literature for ( 0.75 - 1.4). We have used = 1. The variation in the estimated
MBH values with the adopted values of and its effect on the observed M correlation
is discussed in Section: 5.1.
The masses estimated are in the range 4.8 x 10⁵ M⊙ - 3.6 x 10⁷ M⊙. The median mass was found to be 5.62 x 10⁶ M⊙. The median mass is in the low end of the SMBH mass regime. These low mass BHs in the poorly evolved and isolated LSB galaxies are good candidates to study the evolution of heavy seed BHs. The mass distribution is shown in Figure: 7. The figure shows that the LSB galaxies have an asymmetric distribution in their BH masses, with a sharp decrease in the galaxies with BH masses less than . This can be due to the selection effect on the sample. The two galaxies with BH masses less than 10 are good candidates to study the nature of seed BHs in galaxy nuclei. The Eddington ratio of these accreting BHs are estimated using the bolometric luminosity estimated from [Oiii]5007 flux. The value associated with each galaxy is given in Table A2.

4.5 MBH vs plot
The stellar velocity dispersion values obtained using pPXf were corrected for aperture effects due to the finite size of SDSS fibre. The equivalent velocity dispersion at a radius of /8 in the galaxy bulge, where is the effective radius of the bulge, is calculated using the transformation equation given by Jorgensen, Franx & Kjaergaard (1995). The effective radius of the bulge corresponding to each galaxy in our sample is obtained from the SDSS database where a de Vaucouleurs profile is fitted to the surface brightenss profile and the effective radius of the bulge is obtained. The BH mass estimates for the 24 galaxies in our sample plotted against the equivalent velocity dispersion values, are shown in the MBH - plot in Figure: 8. Also plotted in the figure are the linear regression lines given by Tremaine et al. (2002), Ferrarese & Merritt (2000), Gültekin et al. (2009), Kormendy & Ho (2013) for only classical bulges/elliptical galaxies and McConnell & Ma (2013) for late type galaxies (dashed, solid, dotted, short-long dashed and long-dashed lines, respectively) for MBH against , based on a quiescent galaxy sample. The MBH - relations obtained for AGN sample appears to be shallower/flatter than that obtained for inactive/quiescent galaxies (Woo et al. 2010, Greene & Ho 2006). The slopes of active and inactive sample are consistent only with in 2 level. Woo et al. (2013) found that this discrepancy is due to inherent selection effects in the observed sample and intrinsically the MBH - relations for both the active and inactive galaxies are similar. Xiao et al. (2011) investigated the low mass end of the MBH - relation of active galaxies and found that they tend to follow the extrapolation of the MBH - relation of inactive galaxies. Hence we use only the scaling relations obtained from quiescent galaxy sample as reference frame for the comparison of our sample.
From the plot we can see that most of the galaxies are offset from the M- correlation. Here we would like to point out that the errors given with the values are obtained from the pPXF fit. The default errors given by pPXF are known to be an underestimate of the true uncertainty associated with the . But even an increase in the errors obtained from the pPXF fit by three times is not sufficient to explain the observed offset of our sample galaxies in the MBH - plot.
The possible reasons for the observed off-set are discussed in Section: 5.
5 Discussion
5.1 Possible reasons for the observed offset in the M- plot
It is now well established that BHs and bulges co-evolve (e.g. Heckman et al. 2004b; Volonteri 2011), though there are exceptions found in bulgeless galaxies (Seacrest et al. 2013; Simmons et al. 2013). One of the strongest observational indicators for this co-evolution is the correlation (Gültekin et al. 2009; McConnell & Ma 2013 and references therein). Using the bulge velocity dispersions, we plotted our galaxies on the BH mass - velocity dispersion () correlation (Figure: 8). Most of our sample galaxies ( 80%) lie below the correlation.
The observed offset of our sample in the M- plot could be explained due to an over-estimation of and/or an under-estimation of MBH. In this section we describe these possibilities in detail and then explain why we think that the observed offset of our sample galaxies in the M- correlation is real.
5.1.1 Methods adopted for the estimation
Offset in MBH: The MBH of three LSB galaxies in our sample, with identification numbers, 1 (1226+0105), 12 (LSBC F727-V01) and 24 (UGC 6614) have been previously estimated by various groups. Greene & Ho (2007) estimated the BH masses of galaxies, 1226+0105 and LSBC F727-V01 as 2.51 x 10⁷ and 0.63 x 10⁷ respectively. The error bars associated with the MBH estimates are not provided. They used the formalism provided by Greene & Ho (2005) for the MBH estimation. Our MBH estimates for 1226+0105 and LSBC F727-V01 are 3.63 x 10⁷ and 1.37 x 10⁷ respectively and both the values are slightly higher than the estimates of Greene & Ho (2007). Our estimates were obtained using the relation given by Reines, Greene & Geha (2013) who have also followed the approach outlined in Greene & Ho (2005) to estimate the MBH, but with the modified radius-luminosity relationship of Bentz et al. (2013). This modification causes a difference in MBH estimates in these galaxies, of the order of 1.7 x 10⁷ M⊙. The differences between our estimates and that from Greene & Ho (2007) are within this range. For UGC 6614 with identification number 24, the MBH estimates are provided by Naik et al. (2010) and Ramya, Prabhu & Das (2011). Ramya, Prabhu & Das (2011) estimated the MBH using the same technique that we used (from the single epoch measurements of H emission line from the spectra obtained from Himalayan Chandra Telescope and used the Starburst 99 model to remove the stellar continuum of the host galaxy) and obtained a BH mass of 3.89 x 10⁶ M⊙. From Table 3, we can see that our MBH estimate for UGC 6614 is 4.44 x 10⁶ M⊙ and these two values match well within errors. For all these three galaxies, the MBH estimates from previous studies based on single epoch measurements are in the same order of magnitude with our estimates. Out of these three galaxies the galaxy number 1 lie on the observed M- correlation, whereas the galaxies, 12 and 24 lie below the correlation. The small differences in the estimates are not sufficient to explain the observed offset of these two galaxies. Naik et al. (2010) used the technique of excess variance in X-ray emission and determined a mass of of 0.12 x 10⁶ M⊙. The estimate of MBH from Naik et al. (2010) is lower than our estimate. This can be attributed to the uncertainties in the method adopted. But this order of difference in the mass estimates are also not enough to explain the observed offset in the M - correlation.
In the present work, the virial BH masses of broad line AGN candidates are estimated using the single epoch H emission line measurements. The formalism (Reines, Greene & Geha 2013, Greene & Ho 2005) is based on the strong empirical correlation between the radius of the broad line region and the continuum luminosity and also the scaling relations using the reverberation mapping MBH estimates. The virial BH masses are subject to a number of uncertainties, even the different procedures to measure luminosities and line widths used in the virial mass estimators can cause discrepancies (Shen et al., 2008). The broad line region geometry varies considerably from object to object (Barth et al., 2011) and assuming a single value for the geometric scaling factor, (here we assume a value, = 1) can cause uncertainties in the MBH estimations. The value of scale factor which is physically associated with the geometry of the broad line region has a range ( 0.75-1.4,Grier et al. 2013) and the geometry varies for each galaxy. If we adopt the values 0.75 and 1.4 then we obtain the lower and upper limits for the MBH estimates. M- plot with the upper mass limits is shown in the upper left panel of Figure: 9. From the plot we can see that even the upper limit of the BH masses are insufficient or falls short to explain the observed offset in the M- relation.
| Galaxy | Previous estimate of | Our estimate |
|---|---|---|
| (km/s) | (km/s) | |
| NGC 5273 | 72.83.7 | 73.37.3 |
| Mrk 202 | 78.03.0 | 83.614.6 |
| Arp 151 | 118.04.0 | 129.89.0 |
| SBS1116+583A | 92.04.0 | 86.016.8 |
| Mrk 590 | 189.06.0 | 196.45.8 |

Wang et al. (2009) derived a new formalism to estimate the MBH using broad H line. They
found that the MBH (FWHM of H)1.09±0.22. This departs significantly from the relation,
MBH (FWHM of H)2, which was widely used in the previous studies. They claimed that their
formalism reduced the internal scatter between the mass estimations based on reverberation mapping and the single
epoch estimators. They found that the previous single epoch MBH estimators based on MBH (FWHM of H)2
underestimated the MBH at lower end and overestimated the MBH at higher mass end.
Recently (Wang & Dong, 2014) reported that the MBH estimated using Wang et al. (2009) formalism are
more consistent with those from the MBH - relation than those from previous single epoch
mass estimators. They suggested that the the BLR of AGN are multi-componential with at least two components, an intermediate
line region producing the emission line core and a very broad line region which produces the wings of the emission line.
They argued that the contribution of very broad line region affects the MBH - FWHM (of the emission line which is
the tracer of virial velocity) relation and induces a systematic bias in the BH masses of AGN estimated from
single epoch estimators. They found that the formalism based on Wang et al. (2009) is less affected by this bias.
Our MBH estimates are based on the relation given by Reines, Greene & Geha (2013) who have used the assumption,
MBH (FWHM of H)2 in their formalism.
In order to check whether the systematic bias, suggested by Wang et al. (2009) and Wang & Dong (2014),
can explain the observed offset of our sample in the MBH -
correlation we re-estimated the MBH of our sample using the formalism by Wang et al. (2009).
We used the formalism derived by Wang et al. (2009),
and the empirical relations provided by Reines, Greene & Geha (2013), between broad H luminosity and continuum luminosity, L5100,
and the FWHM of H and H,
LHα = 5.25 x 1042 ()1.157 ergs s-1 and
FWHMHβ = 1.07 x 10³ ()1.03 km s-1
to obtain a relation between MBH and the broad H parameters. The relation hence obtained was given by,
and was used to re-estimate the MBH of our sample. The re-estimated MBH is plotted against and is shown in the lower left
panel of Figure: 9. From the plot we can see that the MBH of the sample galaxies have slightly increased and the points have moved
closer to the MBH - correlation. But the majority of our sample galaxies are still significantly off from the
correlation and hence the systematic bias in the estimation of MBH due to the assumption, MBH (FWHM of H)2 is
insufficient to explain the observed offset of our sample from the MBH - correlation.
Offset in : Bentz & Katz (2015) have provided a database of AGN BH masses, for a sample of 60 galaxies, estimated using reverberation mapping. From the sample of 60 galaxies we selected the bulge dominated galaxies which have SDSS DR10 spectra and also have BH masses in the range of our estimates ( 106 - 107 MSun). We got a sample of 5 galaxies (NGC 5273, Mrk 202, Mrk 590, Arp 151 and SBS1116+583A) which satisfy our selection criteria. For this sample of five galaxies (in Table: 2), independent stellar velocity dispersion measurements (Mrk 202 and SBS1116+583A have estimates from Keck/ESI observations, Arp 151 has estimates from double spectrograph in Palomar Hale 5 m telescope, Mrk 590 has measurements from 4 m telescope at Kitt Peak National Observatory and NGC 5273 has measurements from the IFU 4.2 William Herschel Telescope) are available. The previous estimates of values of all these 5 galaxies, except NGC 5273 are given in (Grier et al., 2013). For NGC 5273, the estimate is from (Bentz et al., 2014). For NGC 5273 the (74.1 3.7) was provided in Bentz et al. (2014) and we converted that to using the effective radius (re = 18.2) values taken from SDSS database. The values are given in Table. 2. We applied our procedure to estimate the values to these 5 galaxies and the values are given in Table: 2. The values estimated by us are consistent with the above values and this suggests that the estimation of from SDSS matches with the estimates from other observations. It should be noted that all the five galaxies in Table 2 are QSO’s and are dominated by the AGN emission which makes the stellar velocity measurements difficult. The LSB galaxies in our sample are low luminosity AGNs and the SDSS spectra have sufficient S/N to estimate the stellar velocity dispersion. Thus the methodology adopted to compute the value is appropriate and the uncertainties in the method are not likely to be the reason for the observed offset of our sample in the M- correlation.
Recent studies by Bellovary et al. (2014) suggested that line of sight effects due to galaxy orientation can affect the measured . They found that the edge-on orientations give higher velocity dispersion values, due to contamination by non-bulge/disk stars when measuring line of sight quantities. Studies by Hartmann et al. (2014) and Debattista, Kazantzidis & van den Bosch (2013) also suggest that the measurements can be affected by the contamination of line of sight disk stars. According to all these studies the disk contamination in highly inclined systems can increase the bulge velocity dispersion upto 25%. The ellipticity (b/a) based on SDSS images of all of our sample galaxies are available in the SDSS database and ranges from 0.54 - 0.95. Ellipticity can be used as a proxy of galaxy inclination and it can be used to correct the observed for orientation effects. Though Bellovary et al. (2014) find a correlation between the and galaxy inclination they did not find any trend of with ellipticity. Bellovary et al. (2014) suggested that this may be due to the reason that the ellipticity changes with radius and can be affected by the non-axisymmetric shapes as well as inclination. They recommend to use the kinematic inclination estimates for the correction of orientation effects in the observed . Hartmann et al. (2014) found that in barred galaxies, the effect of redistribution of angular momentum due to bars can also cause an increase of in the central region (average of 12% increase with a maximum of 20%).
Here we consider the extreme case, of 25% increase of bulge velocity dispersion suggested due to the effect of orientations effect of host galaxy. This in turn suggests that a reduction up to 20% in the observed measurements is required to correct the effect of galaxy orientation. We considered this extreme case of reduction of 20% in the values of all the galaxies in our sample and re-plotted the M- plot. This is shown in the upper right panel of Figure: 9. The figure shows that though the sample galaxies move close to the M- correlation, majority of our sample are still off from the correlation. The identification number of our galaxies are not shown to avoid crowding. They are similar to what is shown in Figure: 8. The plot suggests that the orientation effects of galaxy cannot solely explain the observed offset of all the galaxies in our sample.
Thus the effects which can increase the observed , explained above, individually cannot explain
the observed offset
in of all the galaxies in our sample. A detailed study involving observations and simulations of the nature of
the different components of these galaxies are necessary to understand the evolution of
black holes in LSB galaxies.
Combined offset in MBH and : From the above two sub-sections we found that an under-estimation and over-estimation of MBH and respectively based on the uncertainties in the methods adopted for their estimation, cannot explain the observed offset of our sample LSB galaxies from the M- correlation (upper left, upper right and lower right panels of Figure: 9). At the same time we need to check the combined effect on these galaxies. In the lower right panel of Figure: 9 we plotted the MBH estimates, based on the formalism by Wang et al. (2009), against the values which are reduced by 20% (which is an upper limit of the effect on due to the orientation of host galaxies). The plot shows that when a combined effect is considered, most of the sample galaxies lie close to the M- correlation. But still the offset is present in many of the galaxies. Here we would like to point out that, the reduction in considered here is the upper limit of the effect of orientation of the host galaxy to the observed . Thus the offset of all our sample from the M- correlation may not be explained only by these effects. The intrinsic properties of the LSB galaxies may also contribute to the observed offset. This possibility is explained in the Section: 5.2.
5.2 Is the lack of BH - bulge co-evolution an intrinsic property of LSB galaxies?
A significant fraction of bulge dominated GLSB galaxies have large bulges (Galaz et al. 2006; Morelli et al. 2012) and so it is not surprising that GLSB galaxies show AGN activity, despite having low luminosity disks. However, what is surprising is that most of GLSB bulges appear to host relatively low mass BHs and many not even fall into the SMBH regime () (Ramya, Prabhu & Das, 2011). The galaxies in our sample have BH mass in the range and majority of them lie below the MBH - correlation of the elliptical galaxies. The precise MBH estimates for a group of spiral galaxies with maser disks (from megamaser measurements, Kuo et al. 2011) are also 107 M. These galaxies also lie below the MBH - correlation of massive elliptical galaxies (Greene et al., 2010).
Theoretical models predict a MBH - correlation of the form where to ; the value of the constant depends on whether the early BH mass accretion models included momentum driven winds (Silk & Rees, 1998b), or thermally driven winds (Fabian, 1999). The winds result in shocked shells of matter that are driven outwards and ultimately fragment to form stars that contribute to the growth of the bulge (King & Pounds, 2003). In both models mergers play an essential role in driving gas into the nucleus and fueling BH accretion leading to coupled BH-bulge growth. Since mergers are important in the theoretical framework for explaining the correlation, a possible explanation for some of the galaxies lying below the (as well as having low mass BHs) could be the lack of major mergers in the history of their evolution. The two reasons supporting this hypothesis are, (i) Most GLSB disks appear relatively undisturbed in appearance; they do not show signs of recent merger event. Although some GLSB galaxies such as UGC 6614 have prominent rings that could be the result of galaxy collisions (e.g. Mapelli & Moore 2008), secular evolution can also result in the formation of such rings (Kormendy & Kennicutt, 2004). (ii) They are usually isolated galaxies and often lie close to the edges of voids.
Cisternas et al. (2011) found that triggers for major BH growth since z 1 are not due to major galaxy mergers, but due to alternate mechanisms like internal secular processes and minor interactions. From the study of quasar host galaxies at z 2, Schawinski et al. (2012) found that the predominant driver of massive BH growth in these galaxies are secular processes rather than major mergers. Semi-empirical modelling of AGN fueling by Hopkins, Kocevski & Bundy (2014), suggested that the secular processes dominate the black hole growth in the low mass end. Menci et al. (2014) investigated the effect of disk instabilities in triggering AGN in isolated galaxies and found that it can efficiently provide the BH accretion in the low luminosity end. Kormendy & Ho (2013) and references therein suggest that the local AGNs in late type spirals accrete at sub-Eddington rates and they have low BH masses (105 - 107 M). These BHs grow mainly by secular processes and they do not co-evolve with their host galaxies. These studies suggest that secular processes dominate the growth of low mass BHs in our sample of LSB galaxies. Secular evolution leads to formation of pseudo bulges in disk galaxies (Kormendy & Kennicutt, 2004). Kormendy, Bender & Cornell (2011) did a detailed classifications of the bulges in the galaxies for which dynamical BH mass estimations were available and found that the BHs do not co-evolve with pseudo bulges. The majority (7 out of 9) of the maser disk galaxies with low mass BHs are found to have pseudo bulges (Greene et al., 2010). Jiang et al. (2011) did a systematic study of the properties of the 147 active host galaxies with low mass BHs (105 - 106 M) using HST observations. They found that majority of the sample galaxies with disks host pseudo bulges and only a small fraction host classical bulges. But interestingly, based on the structural classification by Simard et al. (2011), the majority of our sample LSB galaxies have bulges which are of classical nature (bulge Sersic index 2.5, Table 1).
Debattista, Kazantzidis & van den Bosch (2013) suggested that when a disk forms around a pre-existing classical bulge, due to gravitational compression increases. Then an increase of MBH by an average of 50-65% is required to satisfy the M- relation. If there is no corresponding growth in MBH, then sample with classical bulges are expected to have an offset. They did not find any such offset in the M- relation of classical bulges in the sample of Gültekin et al. (2009). Based on this they concluded that the BH in the classical bulges was growing along with the disk evolution. They also suggested that growth of BHs might be regulated by the AGN feedback. If the galaxies in our sample which show significant offset have classical bulges in their center, that would suggest that the bulge has not evolved with the disk and lack BH - bulge co-evolution. The structure and kinematics of the BLR, at least as crudely encoded in the f factor, seems to be related to the large-scale properties or formation history of the bulge (Ho & Kim, 2014). A detailed study on the classification of the bulges is required to better understand their relation between the observed offset of the LSB galaxies in the MBH - correlation and we plan to do this as a future work.
The secular processes and formation of pseudo bulges are mainly facilitated by bars and by other instabilities like spiral arms in the disk (Kormendy & Kennicutt, 2004). In the case of LSB galaxies, which are dark matter dominated even significantly in the inner regions, have featureless disks due to the suppression of disk instabilities by dark matter halos. Thus the formation of bulges and their properties in these systems are hence not clearly understood. The effect of dark matter may increase the potential experienced by stellar population in the bulge and hence increase the values which can lead to the offset of these galaxies in the MBH - correlation. AGN feedback is one of the natural mechanisms for BHs to regulate their growth and to couple with the host galaxy properties. Booth & Schaye (2010) explored the correlation between SMBH mass and the mass of the hosting dark matter halo. From their simulations, they suggested that the mass of SMBH is regulated primarily by the dark matter halo mass and not by the stellar mass of the galaxy. Krumpe et al. (2015) also suggested a positive correlation of dark matter halo mass on the mass of BHs which is prominent in the BHs with MBH 108-9 M⊙. In the case of LSB galaxies, the effect of dark matter in the self regulation of black hole growth through AGN feedback and its coupling with the host galaxy properties may be important and it needs to be analysed further. It is necessary to obtain more direct measures of halo properties, such as halo mass to understand BH growth in LSBs. Another mode of BH growth, which is through disk instabilities can also have an impact in the dark matter dominant LSB galaxies. The low surface gas density in these systems can also affect the growth of BHs and bulges.
5.3 Do LSB nuclei harbor Pristine BHs ?
Seed BHs that are formed in the early universe grow by mass accretion
to become the massive BHs in galaxies that we observe in our local universe; the accretion is driven by galaxy mergers and interactions.
The most massive BH seeds formed from gravitational collapse of large gas clouds whereas the lighter BH seeds formed from the
evolution of Population III stars (Volonteri 2010 and references therein). Models predict higher fraction of low mass galaxies to
contain nuclear black holes if seeds are created from Population III stars (Volonteri, Lodato & Natarajan, 2008).
From the study of low mass BHS in small galaxies, Greene (2012) found a tentative evidence that the progenitors of SMBHs were
formed via direct collapse rather than from deaths of Population III stars using a simple argument of the occupation fractions,
matching with the models of Volonteri, Lodato & Natarajan (2008).
The observational evidence for the presence of SMBH (109 - 1010 M⊙) at early epochs (z7-10) poses time constraints on the growth efficiency of their seeds. Giving a jump start to the growth process through more massive seeds (103-106 M⊙) and/or occurrence of super Eddington accretion episodes may overcome this limitation. These have been investigated thoroughly by Pacucci, Volonteri & Ferrara (2015) and references therein. They found that the seeds in the mass range (103 - 104 M⊙) evolve less efficiently and those seeds in the mass range (105 - 106 M⊙) grow very rapidly . The end product of these massive seeds depends on the initial seed mass, the halo mass and density profile and the accretion scenario (standard Eddington-limited accretion or slim accretion disk appropriate for super Eddington accretion). The spectrum of the emerging radiation, for a massive BH observed at z=9, will be dominated in the infrared-submm (1-1000 micron) and X-ray (0.1-100 keV) bands and the future instruments like JWST and ATHENA could detect them (Pacucci et al., 2015). Natarajan (2011), using models of direct collapse, predicted that LSB galaxies and bulgeless galaxies with large disks are less likely to form massive black hole seeds at high redshifts. According to Johnson et al. (2012) extremely massive
stars ( 10 M⊙) at z 10 could collapse into BHs which could be the promising seed candidates for the origin of SMBHs (of the order of 109) at z 7. The recombination emission from the surrounding H II regions of the super massive stars in the early universe may be bright enough to be detected by future missions such as JWST.
Alternatively, BH seeds for IMBHs or SMBHs could be formed from fluctuations in the early Universe during or soon after inflation (Khlopov, 2010). Another process for seed BH formation is through the evolution of dark stars. This is very relevant for LSB galaxies because they have a high dark
matter content. Unlike regular stars that are supported by fusion, dark stars are supported by the energy released from dark matter particle or WIMP annihilations (Spolyar et al., 2009). Such stars could later evolve into massive BHs in the nuclei of LSB galaxies. Dark stars which have cooler temperatures than the fusion powered stars can accrete baryons all the way up to 105M⊙. The observational signatures and capabilities of future missions like JWST to detect of these dark stars are
discussed in literature (Ilie et al. 2012, Rindler-Daller et al. 2015).
Simulations suggest that both gas accretion and galaxy mergers are important for the growth of seed BHs in the centers of galaxies as both processes lead to gas accretion by the nuclear BH (Anglés-Alcázar et al., 2015). But at high redshifts the growth is probably driven by gas accretion from the surroundings, resulting in the formation of SMBHs in the centers of massive host galaxies. These SMBHs lie close to the relation. As the gas supply reduces, galaxy mergers and accretion events may play a more important role in BH growth (Dubois, Volonteri & Silk, 2014). However, if a galaxy is isolated, the rate of gas accretion maybe too slow and the rate of galaxy mergers too low for the seed BHs to grow beyond at redshift z=0. These relatively lighter nuclear BHs in isolated galaxies, can grow through slow accretion leading to relatively low mass BHs () that lie below the relation (Volonteri & Natarajan, 2009). Alternative models have also been proposed for the formation of intermediate mass BHs that have masses less than (Pacucci & Ferrara, 2015).
Bulge dominated LSB galaxies, such as those presented in this study, may be an example of such systems. These low mass BHs are relatively Pristine as they have not undergone as much gas processing as SMBHs in massive galaxies. Thus they can reveal important clues to the initial BH mass function and help us constrain the early evolution of BHs in galaxies. The BH masses in LSB galaxies lie in the range and the majority are outliers on the relation. Also, the Eddington ratios of majority of them are not high (see Table 3). Hence their BHs are not accreting at a high rate and they fall in the low luminosity AGN (LLAGN) class (Nagar, Falcke & Wilson 2005; Heckman et al. 2004a). Thus, the BHs in LSB galaxies represent one of the best candidates for Pristine BHs and a good place to study seed black holes in our local universe. Other low mass BH candidates for such studies are those found in bulgeless galaxies (e.g. Satyapal et al. 2014; Araya Salvo et al. 2012) and dwarf galaxies (Thornton et al. 2008, Reines et al. 2011, Reines, Greene & Geha 2013, Moran et al. 2014.
5.4 Nuclear Outflow from AGN in GLSB galaxies
Theoretical models of galaxy formation and evolution often invoke feedback from AGNs and SNe to explain the quenching of star formation in galaxies and hence formation of very massive galaxies in the universe (Di Matteo, Springel & Hernquist, 2005). Outflows are believed to be one of the signatures of AGN feedback and hence forms an important evidence to test the BH-bulge co-evolution. Numerical simulations indicate that feedback is triggered during an intense and rapidly accelerated BH fueling phase during a gas-rich galaxy merger (Narayanan et al. 2010 and references therein). So one would expect to see extreme outflowing gas moving with velocities greater than 1500 km s-1only in a high-z quasar or/and ULIRGs associated with AGNs accreting at high eddington ratios.
 |
 |
| UGC 6614 (No 24) | 1226+0105 (No 1) |
 |
 |
| VIII ZW 318 (No 2) | NGC 7589 (No 5) |
 |
 |
| 2MASX J00534265-0105066 (No 7) | UGC 6284 (No 28) |
Interestingly, a few galaxies in our sample show signatures of outflows. The three galaxies in our sample, UGC 6614 (identification no 24), UGC 6284 (identification no 28) and UGC 5035 (identification no 30), which are classified to be LINERs show blue-shifted component in H emission lines. For UGC 6614, along with the blue shifted outflow component, there is a broad H component which is associated with the BH accretion. The blue shifted H component in these galaxies suggest the presence of an ionised gas outflow. The forbidden [O iii] emission lines are ideal tracers of extended ionized outflowing gas which cannot be produced by the high density broad line regions (Cresci et al., 2015). Thus the asymmetric extended [O iii] line profiles are considered as powerful signature of the presence of outflowing gas. Extended [O iii] emission from quasars are ubiquitously found by many authors (Nesvadba et al. 2008,Greene et al. 2014, Ramya et al. in preparation and references therein). UGC 6614 and UGC 6284 show the presence of outflow components in [Oiii] emission line region along with H region. This suggests that outflow signatures in these galaxies are real. Whereas, UGC 5035 does not show any outflow signature in the [Oiii] region. Thus the blue shifted H component in this galaxy may not be associated with any outflow event and may be associated with the broad line region and BH accretion. Along with UGC 6614 and UGC 6284, another four galaxies in our sample, 2MASX J12291286+0049042 (identification no 1), VIII ZW 318 (identification no 2), NGC 7589 (identification no 5) and 2MASX J00534265-0105066 (identification no 7) also show blue shifted outflow signatures in [O iii]. These four galaxies are classified as Seyfert galaxies in the BPT diagrams. The velocity of outflowing gas, associated with the [Oiii] blue shifted components of the galaxies in our sample are given in Table 3. The emission line fits, similar to Figure: 2, of the galaxies which show signatures of outflow are shown in different panels of Figure: 10.
| Galaxy | Velocity offset (kms-1) | FWHm (kms-1) |
|---|---|---|
| UGC 6614 | -141.38 45.0 | 1363122.39 |
| VIII ZW 318 | -120.04 10.12 | 705.8782.12 |
| UGC 6284 | -114.7 83.07 | 900.07 169.34 |
| 2MASX J00534265-0105066 | -112.67 6.34 | 520.32 67.24 |
| NGC 7589 | -79.47 23.23 | 404.2655.69 |
| 2MASX J12291286+0049042 | -27.08 47.71 | 727.5497.77 |
UGC 6614 shows outflow feature in H, [Oiii] and H regions. The measured Eddington ratio and BH mass for UGC 6614 are 0.024 and M⊙ respectively. The outflow component as measured by the blue shifted H line is moving at 3604.77 86.39 kms-1 with a FWHM of 3213 200 kms-1. Similarly the outflow component as measured by H line is moving at 4149 267 kms-1 with a FWHM of 3304 667 kms-1. The velocity offset and FWHM values of H and H components are similar. Ramya, Prabhu & Das (2011) had detected outflow components in H and H regions. Our values are similar to their estimates. The H luminosity of the outflowing component can be used to estimate the mass of the ionized gas in the outflow. For further discussions on outflows and estimation of outflow rate, we will concentrate on UGC 6614 alone.
It is possible to obtain an order of magnitude estimate for the mass outflow rate assuming that the outflowing gas is moving in a simple bi-conical distribution of uniformly filled outflowing clouds. We also assume that the farther side of the bi-conical outflow is obscured and hence we detect only the blue shifted emission while the red shifted part is obscured in the observed emission lines (Maiolino et al., 2012). The total ionized gas mass can be estimated using H luminosity and assuming electron number density (ne) of 100 cm-3. Then,
M⊙
The H luminosity of the outflow component in UGC 6614 is ergs-1. Estimated ionized gas mass is
M⊙. The of [O iii]5007 component is 141.4 kms-1.
Following Cresci et al. (2015) and assuming the radius at which the outflow is detected to
be about kpc (typical size of NLR), we derive the dynamical time to be equal to
Myr.
Then, the volume-averaged density is estimated as where is the solid angle subtended by the outflow.
The mass outflow rate is then :
The estimated mass outflow rate is then 0.1-0.28 M⊙yr-1. The above outflow rate is estimated from broad [ O iii] lines. If we consider the outflow component using H and H lines, then we will have another estimate for the mass outflow rate which is 27 times more than the one estimated using the [O iii] emission. The mass outflow rate estimated from broad H (or H) component is 2.7-7.695 Myr-1. These are order of magnitude estimates and we caution the reader in using them during specific calculations. Using the narrow line H luminosity of UGC 6614, we estimate the SFR in this galaxy to be equal to 0.04 Myr-1. The mass outflow rate is an order of magnitude greater than the SFR in this galaxy and hence clearly indicating that the outflows are powered by the AGN. An important question arises regarding the discrepany of outflow velocities as seen from Balmer lines ( 3800 km/s and FWHM 3000 km/s) and the forbidden [O iii] line ( 141 km/s and FWHM 1400 km/s). One explanation could be that these outflows are emitted from two different regions, one close to the BLR region or the intermediate line regions (ILR) and the other from the NLR. The deceleration in velocities from 1000km/s (in ILR) to a 100 km/s (NLR) is consistent with that seen in nearby Seyfert galaxy NGC 4151 (Das et al. 2005, Crenshaw et al. 2015 and references therein). The mass outflow rate of 3 Myr-1 seen in NGC 4151 is similar to the value obtained using the broad balmer lines for UGC 6614 and could produce effective feedback on scales where circumnuclear star formation and bulge growth occur.
While UGC 6614 shows such large outflow velocities, it is not very common in these systems as only 1 out of 30 LSBs with AGN show this feature encouraging our search for such systems. This further calls for detailed study of the geometry and kinematics of UGC6614 using existing IFUs.
Mapelli & Moore (2008) suggest that the progenitors for GLSB galaxies such as UGC 6614, Malin1, Malin2 and NGC 7589 are ring galaxies which is created after an interaction. The gas and stars are redistributed in such an encounter and hence the formation of large diffuse stellar disks. This encounter triggers an AGN which could further create such ionized gas outflows.
The effect of this outflowing gas on the host galaxy is difficult to determine with existing data. Cresci et al. (2015) using VLT SINFONI observations found that the fast expanding outflowing gas sweeps away expelling most of the gas thereby quenching star forming activity along its route, while the outflowing gas also triggered star formation by compression of gas clouds by the outflow-driven shock at the outflow edges. This was a classical case of both positive and negative feedback by fast moving outflows. In UGC 6614 and other LSB galaxies which show signature of outflow, the action of such feedback on the host galaxy can be understood using future IFU observations.
6 Conclusions
-
•
From the analysis of the SDSS optical spectra of 24 LSB galaxies, We derived the virial mass of their central BHs. The median value of MBH is 5.62 x 10⁶ M.
-
•
Majority of our sample lie below the MBH - correlation of the normal spiral galaxies.
-
•
The effects of systematic bias in the MBH estimation and the effect of orientation of the host galaxies in the measurement of are insufficient to explain the observed offset of our sample galaxies in the MBH - relation.
-
•
In general, the LSB galaxies tend to have low mass BHs which probably are not in co-evolution with the host galaxy bulges. The isolated and poorly evolved LSB galaxies are good candidates to understand the evolution of heavy seed BHs.
-
•
The lack of bulge - BH co-evolution, indicative of secular evolution in these systems, can be one of the probable reasons for the observed offset. But majority of the LSB galaxies in the sample are likely to host classical bulges (Sersic index 2.5) which are products of major mergers. A detailed study of the nature of the bulges and the role of dark matter in the growth of the BHs is important and planned to be addressed in future.
Acknowledgements
We would like to thank the anonymous referee for the comments and suggestions which improved the quality of the paper immensely.
RS kindly acknowledges the award of NSFC (Grant No. 11450110401) and President’s International Fellowship Initiative (PIFI) awarded by the
Chinese Academy of Sciences.
This research has made use of the NASA/IPAC Extragalactic Database (NED) which is operated by the Jet Propulsion Laboratory,
California Institute of Technology, under contract with the National Aeronautics and Space Administration.
We would like to thank the SDSS team for making the data available in public. Funding for SDSS-III has been provided by the
Alfred P. Sloan Foundation, the Participating Institutions, the National Science Foundation,
and the U.S. Department of Energy Office of Science. The SDSS-III web site is http://www.sdss3.org/.
SDSS-III is managed by the Astrophysical Research Consortium for the Participating Institutions of the SDSS-III Collaboration including
the University of Arizona, the Brazilian Participation Group, Brookhaven National Laboratory, Carnegie Mellon University, University of
Florida, the French Participation Group, the German Participation Group, Harvard University, the Instituto de Astrofisica de Canarias,
the Michigan State/Notre Dame/JINA Participation Group, Johns Hopkins University, Lawrence Berkeley National Laboratory, Max Planck
Institute for Astrophysics, Max Planck Institute for Extraterrestrial Physics, New Mexico State University, New York University, Ohio
State University, Pennsylvania State University, University of Portsmouth, Princeton University, the Spanish Participation Group,
University of Tokyo, University of Utah, Vanderbilt University, University of Virginia, University of Washington, and Yale University.
References
- Anglés-Alcázar et al. (2015) Anglés-Alcázar D., Özel F., Davé R., Katz N., Kollmeier J. A., Oppenheimer B. D., 2015, ApJ, 800, 127
- Araya Salvo et al. (2012) Araya Salvo C., Mathur S., Ghosh H., Fiore F., Ferrarese L., 2012, ApJ, 757, 179
- Asplund et al. (2009) Asplund M., Grevesse N., Sauval A. J., Scott P., 2009, ARA&A, 47, 481
- Baldwin, Phillips & Terlevich (1981) Baldwin J. A., Phillips M. M., Terlevich R., 1981, PASP, 93, 5
- Barth et al. (2011) Barth A. J. et al., 2011, ApJ, 743, L4
- Beijersbergen, de Blok & van der Hulst (1999) Beijersbergen M., de Blok W. J. G., van der Hulst J. M., 1999, A&A, 351, 903
- Bellovary et al. (2014) Bellovary J. M., Holley-Bockelmann K., Gültekin K., Christensen C. R., Governato F., Brooks A. M., Loebman S., Munshi F., 2014, MNRAS, 445, 2667
- Bentz et al. (2013) Bentz M. C. et al., 2013, ApJ, 767, 149
- Bentz et al. (2014) Bentz M. C. et al., 2014, ApJ, 796, 8
- Bentz & Katz (2015) Bentz M. C., Katz S., 2015, PASP, 127, 67
- Booth & Schaye (2010) Booth C. M., Schaye J., 2010, MNRAS, 405, L1
- Bothun, Impey & McGaugh (1997) Bothun G., Impey C., McGaugh S., 1997, PASP, 109, 745
- Bothun et al. (1987) Bothun G. D., Impey C. D., Malin D. F., Mould J. R., 1987, AJ, 94, 23
- Bothun et al. (1993) Bothun G. D., Schombert J. M., Impey C. D., Sprayberry D., McGaugh S. S., 1993, AJ, 106, 530
- Brinchmann et al. (2004) Brinchmann J., Charlot S., White S. D. M., Tremonti C., Kauffmann G., Heckman T., Brinkmann J., 2004, MNRAS, 351, 1151
- Burkholder, Impey & Sprayberry (2001) Burkholder V., Impey C., Sprayberry D., 2001, AJ, 122, 2318
- Cappellari & Emsellem (2004) Cappellari M., Emsellem E., 2004, PASP, 116, 138
- Cisternas et al. (2011) Cisternas M. et al., 2011, ApJ, 726, 57
- Comerón et al. (2010) Comerón S., Knapen J. H., Beckman J. E., Laurikainen E., Salo H., Martínez-Valpuesta I., Buta R. J., 2010, MNRAS, 402, 2462
- Crenshaw et al. (2015) Crenshaw D. M., Fischer T. C., Kraemer S. B., Schmitt H. R., 2015, ApJ, 799, 83
- Cresci et al. (2015) Cresci G. et al., 2015, ApJ, 799, 82
- Das (2013) Das M., 2013, Journal of Astrophysics and Astronomy, 34, 19
- Das et al. (2007) Das M., Kantharia N., Ramya S., Prabhu T. P., McGaugh S. S., Vogel S. N., 2007, MNRAS, 379, 11
- Das et al. (2009) Das M., Reynolds C. S., Vogel S. N., McGaugh S. S., Kantharia N. G., 2009, ApJ, 693, 1300
- Das et al. (2005) Das V. et al., 2005, AJ, 130, 945
- Davies, Miller & Bellovary (2011) Davies M. B., Miller M. C., Bellovary J. M., 2011, ApJ, 740, L42
- de Blok, McGaugh & van der Hulst (1996) de Blok W. J. G., McGaugh S. S., van der Hulst J. M., 1996, MNRAS, 283, 18
- Debattista, Kazantzidis & van den Bosch (2013) Debattista V. P., Kazantzidis S., van den Bosch F. C., 2013, ApJ, 765, 23
- Di Matteo, Springel & Hernquist (2005) Di Matteo T., Springel V., Hernquist L., 2005, Nature, 433, 604
- Dubois, Volonteri & Silk (2014) Dubois Y., Volonteri M., Silk J., 2014, MNRAS, 440, 1590
- Fabian (1999) Fabian A. C., 1999, MNRAS, 308, L39
- Ferrarese & Merritt (2000) Ferrarese L., Merritt D., 2000, ApJ, 539, L9
- Galaz et al. (2002) Galaz G., Dalcanton J. J., Infante L., Treister E., 2002, AJ, 124, 1360
- Galaz et al. (2011) Galaz G., Herrera-Camus R., Garcia-Lambas D., Padilla N., 2011, ApJ, 728, 74
- Galaz et al. (2006) Galaz G., Villalobos A., Infante L., Donzelli C., 2006, AJ, 131, 2035
- Gerhard (1993) Gerhard O. E., 1993, MNRAS, 265, 213
- Ghosh & Jog (2014) Ghosh S., Jog C. J., 2014, MNRAS, 439, 929
- Greene (2012) Greene J. E., 2012, Nature Communications, 3, 1304
- Greene & Ho (2005) Greene J. E., Ho L. C., 2005, ApJ, 630, 122
- Greene & Ho (2006) Greene J. E., Ho L. C., 2006, ApJ, 641, L21
- Greene & Ho (2007) Greene J. E., Ho L. C., 2007, ApJ, 667, 131
- Greene et al. (2010) Greene J. E. et al., 2010, ApJ, 721, 26
- Greene et al. (2014) Greene J. E., Pooley D., Zakamska N. L., Comerford J. M., Sun A.-L., 2014, ApJ, 788, 54
- Grier et al. (2013) Grier C. J. et al., 2013, ApJ, 773, 90
- Gültekin et al. (2009) Gültekin K. et al., 2009, ApJ, 698, 198
- Hartmann et al. (2014) Hartmann M., Debattista V. P., Cole D. R., Valluri M., Widrow L. M., Shen J., 2014, MNRAS, 441, 1243
- Heckman et al. (2004a) Heckman T. M., Kauffmann G., Brinchmann J., Charlot S., Tremonti C., White S. D. M., 2004a, ApJ, 613, 109
- Heckman et al. (2004b) Heckman T. M., Kauffmann G., Brinchmann J., Charlot S., Tremonti C., White S. D. M., 2004b, ApJ, 613, 109
- Heckman et al. (1981) Heckman T. M., Miley G. K., van Breugel W. J. M., Butcher H. R., 1981, ApJ, 247, 403
- Ho, Filippenko & Sargent (1997) Ho L. C., Filippenko A. V., Sargent W. L. W., 1997, ApJ, 487, 568
- Ho & Kim (2014) Ho L. C., Kim M., 2014, ApJ, 789, 17
- Hopkins, Kocevski & Bundy (2014) Hopkins P. F., Kocevski D. D., Bundy K., 2014, MNRAS, 445, 823
- Ilie et al. (2012) Ilie C., Freese K., Valluri M., Iliev I. T., Shapiro P. R., 2012, MNRAS, 422, 2164
- Impey & Bothun (1997) Impey C., Bothun G., 1997, ARA&A, 35, 267
- Impey, Burkholder & Sprayberry (2001) Impey C., Burkholder V., Sprayberry D., 2001, AJ, 122, 2341
- Impey et al. (1996) Impey C. D., Sprayberry D., Irwin M. J., Bothun G. D., 1996, ApJS, 105, 209
- Jia et al. (2011) Jia J., Ptak A., Heckman T. M., Overzier R. A., Hornschemeier A., LaMassa S. M., 2011, ApJ, 731, 55
- Jiang et al. (2011) Jiang Y.-F., Greene J. E., Ho L. C., Xiao T., Barth A. J., 2011, ApJ, 742, 68
- Johnson et al. (2012) Johnson J. L., Whalen D. J., Fryer C. L., Li H., 2012, ApJ, 750, 66
- Jorgensen, Franx & Kjaergaard (1995) Jorgensen I., Franx M., Kjaergaard P., 1995, MNRAS, 276, 1341
- Kauffmann et al. (2003a) Kauffmann G. et al., 2003a, MNRAS, 346, 1055
- Kauffmann et al. (2003b) Kauffmann G. et al., 2003b, MNRAS, 341, 33
- Kewley et al. (2001) Kewley L. J., Dopita M. A., Sutherland R. S., Heisler C. A., Trevena J., 2001, ApJ, 556, 121
- Kewley et al. (2006) Kewley L. J., Groves B., Kauffmann G., Heckman T., 2006, MNRAS, 372, 961
- Khlopov (2010) Khlopov M. Y., 2010, Research in Astronomy and Astrophysics, 10, 495
- King & Pounds (2003) King A. R., Pounds K. A., 2003, MNRAS, 345, 657
- Kormendy, Bender & Cornell (2011) Kormendy J., Bender R., Cornell M. E., 2011, Nature, 469, 374
- Kormendy & Ho (2013) Kormendy J., Ho L. C., 2013, ARA&A, 51, 511
- Kormendy & Kennicutt (2004) Kormendy J., Kennicutt, Jr. R. C., 2004, ARA&A, 42, 603
- Krumpe et al. (2015) Krumpe M., Miyaji T., Husemann B., Fanidakis N., Coil A. L., Aceves H., 2015, ArXiv e-prints
- Kuo et al. (2011) Kuo C. Y. et al., 2011, ApJ, 727, 20
- Kuzio de Naray, McGaugh & de Blok (2008) Kuzio de Naray R., McGaugh S. S., de Blok W. J. G., 2008, ApJ, 676, 920
- Ludwig et al. (2012) Ludwig R. R., Greene J. E., Barth A. J., Ho L. C., 2012, ApJ, 756, 51
- Maiolino et al. (2012) Maiolino R. et al., 2012, MNRAS, 425, L66
- Mapelli & Moore (2008) Mapelli M., Moore B., 2008, Astronomische Nachrichten, 329, 948
- Matthews et al. (1999) Matthews L. D. et al., 1999, AJ, 118, 208
- Mayer & Wadsley (2004) Mayer L., Wadsley J., 2004, MNRAS, 347, 277
- McConnell & Ma (2013) McConnell N. J., Ma C.-P., 2013, ApJ, 764, 184
- McGaugh (1994) McGaugh S. S., 1994, ApJ, 426, 135
- McGaugh & Bothun (1994) McGaugh S. S., Bothun G. D., 1994, AJ, 107, 530
- McGaugh, Schombert & Bothun (1995) McGaugh S. S., Schombert J. M., Bothun G. D., 1995, AJ, 109, 2019
- Mei, Yuan & Dong (2009) Mei L., Yuan W.-M., Dong X.-B., 2009, Research in Astronomy and Astrophysics, 9, 269
- Menci et al. (2014) Menci N., Gatti M., Fiore F., Lamastra A., 2014, A&A, 569, A37
- Mishra et al. (2015) Mishra A., Kantharia N. G., Das M., Srivastava D. C., Vogel S. N., 2015, MNRAS, 447, 3649
- Moran et al. (2014) Moran E. C., Shahinyan K., Sugarman H. R., Vélez D. O., Eracleous M., 2014, AJ, 148, 136
- Morelli et al. (2012) Morelli L., Corsini E. M., Pizzella A., Dalla Bontà E., Coccato L., Méndez-Abreu J., Cesetti M., 2012, MNRAS, 423, 962
- Nagar, Falcke & Wilson (2005) Nagar N. M., Falcke H., Wilson A. S., 2005, A&A, 435, 521
- Naik et al. (2010) Naik S., Das M., Jain C., Paul B., 2010, MNRAS, 404, 2056
- Narayanan et al. (2010) Narayanan D. et al., 2010, MNRAS, 407, 1701
- Natarajan (2011) Natarajan P., 2011, Bulletin of the Astronomical Society of India, 39, 145
- Nesvadba et al. (2008) Nesvadba N. P. H., Lehnert M. D., De Breuck C., Gilbert A. M., van Breugel W., 2008, A&A, 491, 407
- O’Neil et al. (2004) O’Neil K., Bothun G., van Driel W., Monnier Ragaigne D., 2004, A&A, 428, 823
- Pacucci & Ferrara (2015) Pacucci F., Ferrara A., 2015, MNRAS, 448, 104
- Pacucci et al. (2015) Pacucci F., Ferrara A., Volonteri M., Dubus G., 2015, ArXiv e-prints
- Pacucci, Volonteri & Ferrara (2015) Pacucci F., Volonteri M., Ferrara A., 2015, MNRAS, 452, 1922
- Pettini & Pagel (2004) Pettini M., Pagel B. E. J., 2004, MNRAS, 348, L59
- Pickering et al. (1997) Pickering T. E., Impey C. D., van Gorkom J. H., Bothun G. D., 1997, AJ, 114, 1858
- Pizzella et al. (2005) Pizzella A., Corsini E. M., Dalla Bontà E., Sarzi M., Coccato L., Bertola F., 2005, ApJ, 631, 785
- Pizzella et al. (2008) Pizzella A., Corsini E. M., Sarzi M., Magorrian J., Méndez-Abreu J., Coccato L., Morelli L., Bertola F., 2008, MNRAS, 387, 1099
- Pustilnik et al. (2011) Pustilnik S. A., Martin J.-M., Tepliakova A. L., Kniazev A. Y., 2011, MNRAS, 417, 1335
- Raichur et al. (2013) Raichur H., Das M., Alonso Herrero A., Shastri P., Kantharia N. G., 2013, ArXiv e-prints
- Raichur et al. (2015) Raichur H., Das M., Herrero A. A., Shastri P., Kantharia N. G., 2015, Ap&SS, 357, 32
- Ramya, Prabhu & Das (2011) Ramya S., Prabhu T. P., Das M., 2011, MNRAS, 418, 789
- Reines, Greene & Geha (2013) Reines A. E., Greene J. E., Geha M., 2013, ApJ, 775, 116
- Reines et al. (2011) Reines A. E., Sivakoff G. R., Johnson K. E., Brogan C. L., 2011, Nature, 470, 66
- Rindler-Daller et al. (2015) Rindler-Daller T., Freese K., Montgomery M. H., Winget D. E., Paxton B., 2015, in APS Meeting Abstracts, p. 14007
- Rosenbaum et al. (2009) Rosenbaum S. D., Krusch E., Bomans D. J., Dettmar R.-J., 2009, A&A, 504, 807
- Satyapal et al. (2014) Satyapal S., Secrest N. J., McAlpine W., Ellison S. L., Fischer J., Rosenberg J. L., 2014, ApJ, 784, 113
- Schawinski et al. (2012) Schawinski K., Simmons B. D., Urry C. M., Treister E., Glikman E., 2012, MNRAS, 425, L61
- Schlafly & Finkbeiner (2011) Schlafly E. F., Finkbeiner D. P., 2011, ApJ, 737, 103
- Schmitz et al. (2014) Schmitz D., Yoachim P., Loebman S., Debattista V. P., Kwak S., 2014, in American Astronomical Society Meeting Abstracts, Vol. 223, American Astronomical Society Meeting Abstracts 223, p. 453.06
- Schombert (1998) Schombert J., 1998, AJ, 116, 1650
- Schombert & Bothun (1988) Schombert J. M., Bothun G. D., 1988, AJ, 95, 1389
- Schombert et al. (1992) Schombert J. M., Bothun G. D., Schneider S. E., McGaugh S. S., 1992, AJ, 103, 1107
- Seth et al. (2008) Seth A., Agüeros M., Lee D., Basu-Zych A., 2008, ApJ, 678, 116
- Shao et al. (2015) Shao X., Disseau K., Yang Y. B., Hammer F., Puech M., Rodrigues M., Liang Y. C., Deng L. C., 2015, A&A, 579, A57
- Shen et al. (2008) Shen Y., Greene J. E., Strauss M. A., Richards G. T., Schneider D. P., 2008, ApJ, 680, 169
- Silk & Rees (1998a) Silk J., Rees M. J., 1998a, A&A, 331, L1
- Silk & Rees (1998b) Silk J., Rees M. J., 1998b, A&A, 331, L1
- Simard et al. (2011) Simard L., Mendel J. T., Patton D. R., Ellison S. L., McConnachie A. W., 2011, ApJS, 196, 11
- Spolyar et al. (2009) Spolyar D., Bodenheimer P., Freese K., Gondolo P., 2009, ApJ, 705, 1031
- Sprayberry et al. (1995) Sprayberry D., Impey C. D., Bothun G. D., Irwin M. J., 1995, AJ, 109, 558
- Thomas et al. (2013) Thomas D. et al., 2013, MNRAS, 431, 1383
- Thornton et al. (2008) Thornton C. E., Barth A. J., Ho L. C., Rutledge R. E., Greene J. E., 2008, ApJ, 686, 892
- Tremaine et al. (2002) Tremaine S. et al., 2002, ApJ, 574, 740
- Tremonti et al. (2004) Tremonti C. A. et al., 2004, ApJ, 613, 898
- Trouille, Barger & Tremonti (2011) Trouille L., Barger A. J., Tremonti C., 2011, ApJ, 742, 46
- van der Marel & Franx (1993) van der Marel R. P., Franx M., 1993, ApJ, 407, 525
- Veilleux & Osterbrock (1987) Veilleux S., Osterbrock D. E., 1987, ApJS, 63, 295
- Volonteri (2010) Volonteri M., 2010, A&A Rev., 18, 279
- Volonteri (2011) Volonteri M., 2011, Evolution of massive black holes, Livio M., Koekemoer A. M., eds., pp. 62–79
- Volonteri, Lodato & Natarajan (2008) Volonteri M., Lodato G., Natarajan P., 2008, MNRAS, 383, 1079
- Volonteri & Natarajan (2009) Volonteri M., Natarajan P., 2009, MNRAS, 400, 1911
- Wang & Dong (2014) Wang J., Dong X., 2014, Science China Physics, Mechanics, and Astronomy, 57, 584
- Wang et al. (2009) Wang J.-G. et al., 2009, ApJ, 707, 1334
- Whittle (1985) Whittle M., 1985, MNRAS, 216, 817
- Woo et al. (2013) Woo J.-H., Schulze A., Park D., Kang W.-R., Kim S. C., Riechers D. A., 2013, ApJ, 772, 49
- Woo et al. (2010) Woo J.-H. et al., 2010, ApJ, 716, 269
- Xiao et al. (2011) Xiao T., Barth A. J., Greene J. E., Ho L. C., Bentz M. C., Ludwig R. R., Jiang Y., 2011, ApJ, 739, 28
Appendix A
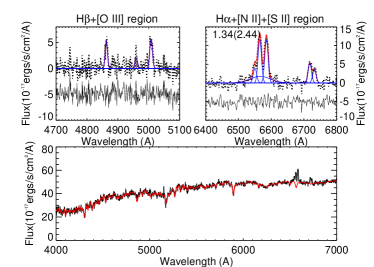 |
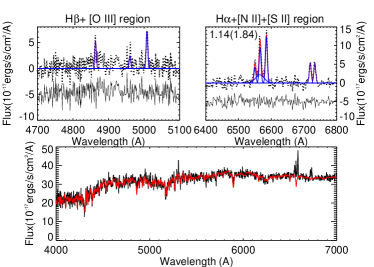 |
| 2MASXJ14384627+0106576 (No 3) | Leda 135884 (No 4) |
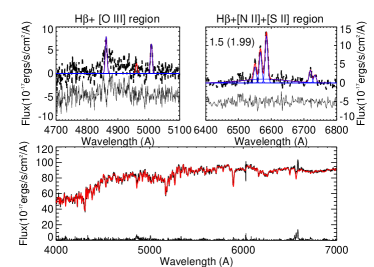 |
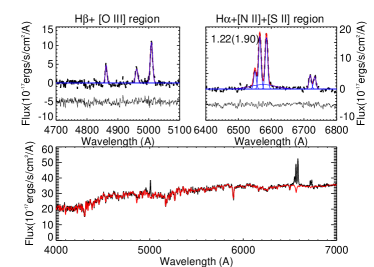 |
| UGC 00568 (No 6) | UGC 00514 (No 8) |
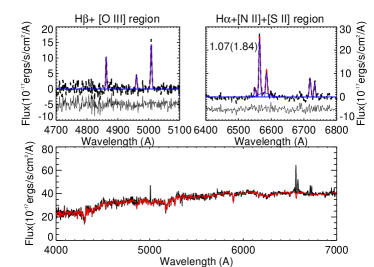 |
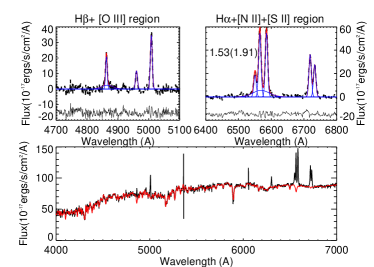 |
| LSBC F611-03 (No 9) | VIII ZW 091 (No 10) |
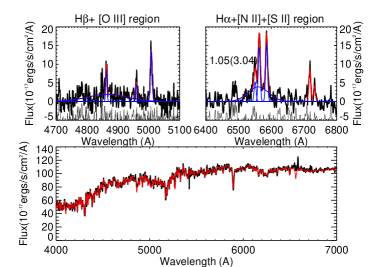 |
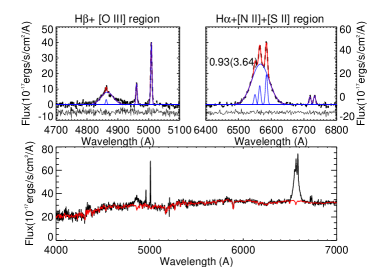 |
| VIII ZW 437 (No 11) | LSBC F727-V01 (No 12) |
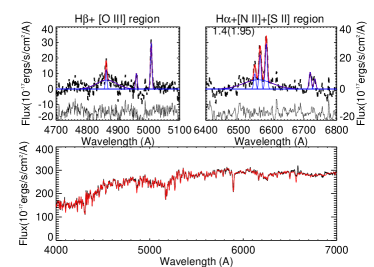 |
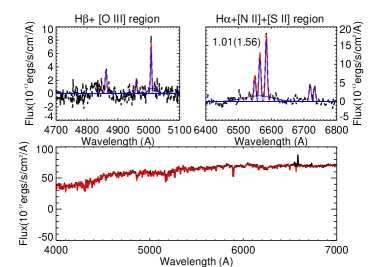 |
| UGC 10050 (No 14) | NGC 0926 (No 16) |
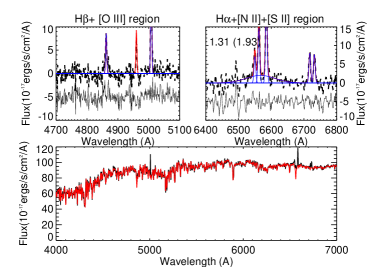 |
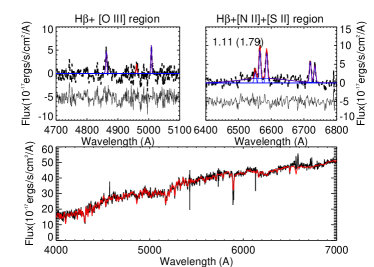 |
| UGC 9087 (No 17) | UGC 8828 (No 18) |
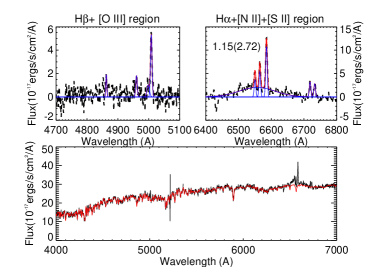 |
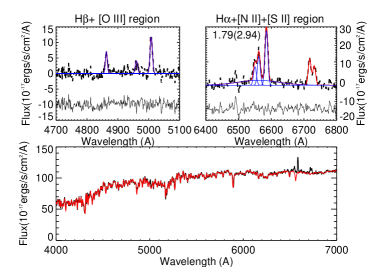 |
| 2MASX J10255577+0200154 (No 19) | IC 2423 (No 20) |
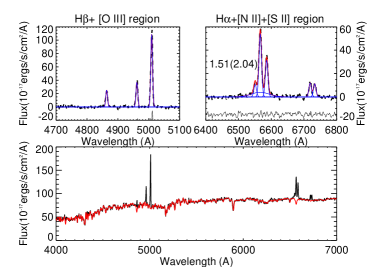 |
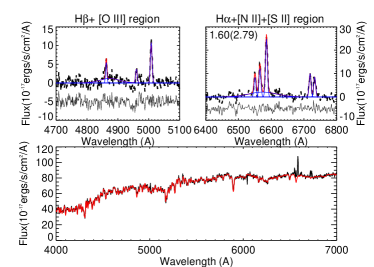 |
| LSBC F564-01 (No 21) | UGC 5770 (No 22) |
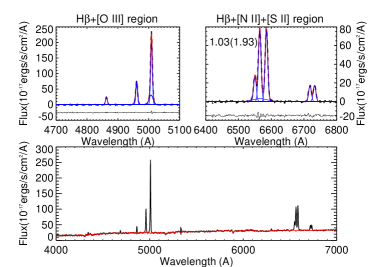 |
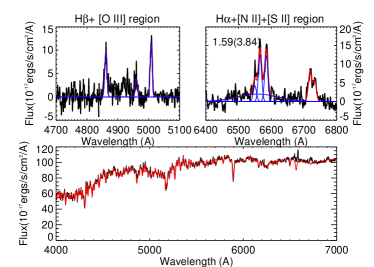 |
| 2MASX j14565122+2152295 (No 23) | LSBC F508-02 (No 25) |
| Galaxy | Hβ | [Oiii] | [O iii] | [O i] | [O i] | [Nii] | [Nii] | Hα | [Sii] | [Sii] |
|---|---|---|---|---|---|---|---|---|---|---|
| narrow | narrow | |||||||||
| 4861 | 4960 | 5007 | 6300 | 6364 | 6548 | 6584 | 6563 | 6717 | 6731 | |
| 1 | 18.13 3.72 | 82.84 19.07 | 223.68 46.01 | 9.51 6.67 | 0.77 3.54 | 36.38 1.92 | 107.31 1.92 | 100.94 5.69 | 20.85 4.52 | 24.08 3.91 |
| 2 | 346.28 5.98 | 293.38 17.71 | 967.12 43.61 | 108.14 9.03 | 36.97 4.51 | 365.99 3.66 | 1079.69 3.66 | 1800.43 16.76 | 391.04 6.78 | 300.47 5.63 |
| 3 | 47.74 4.89 | 20.31 3.35 | 59.92 3.35 | – | – | 49.30 3.73 | 145.44 3.73 | 147.27 12.00 | 67.62 9.25 | 46.79 7.70 |
| 4 | 23.96 3.39 | 12.83 2.58 | 37.85 2.58 | 14.02 6.49 | 10.05 3.97 | 28.24 1.97 | 83.29 1.97 | 63.19 6.34 | 36.42 4.52 | 35.64 3.93 |
| 5 | 177.24 5.32 | 155.14 22.32 | 449.03 55.47 | 43.17 9.68 | 14.25 4.19 | 166.39 3.30 | 490.85 3.30 | 744.37 12.37 | 206.37 7.55 | 144.97 6.39 |
| 6 | 31.61 4.61 | 14.80 2.86 | 43.66 2.86 | – | — | 38.40 1.95 | 113.29 1.95 | 73.74 5.53 | 31.57 4.98 | 19.78 4.49 |
| 7 | 147.12 4.79 | 391.31 18.04 | 1158.35 42.67 | 153.15 10.77 | 55.95 5.68 | 246.66 3.73 | 727.66 3.73 | 433.60 10.47 | 297.74 8.07 | 270.37 7.03 |
| 8 | 30.89 1.97 | 35.26 1.59 | 104.03 1.59 | 16.59 3.63 | 8.11 2.09 | 52.93 1.09 | 156.16 1.09 | 158.95 3.17 | 41.50 2.34 | 37.22 2.21 |
| 9 | 30.15 2.93 | 20.17 2.65 | 59.53 2.65 | 18.24 10.88 | 28.80 9.65 | 17.35 1.68 | 51.19 1.68 | 121.46 5.72 | 39.88 4.66 | 30.07 3.70 |
| 10 | 126.50 7.49 | 88.02 4.78 | 259.66 4.78 | 128.01 14.01 | - | 163.24 4.36 | 481.57 4.36 | 482.11 14.12 | 320.42 12.06 | 244.14 9.21 |
| 11 | 54.42 6.34 | 34.05 5.01 | 100.46 5.01 | - | - | 39.53 3.56 | 116.61 3.56 | 111.71 10.31 | 63.55 10.08 | 30.51 8.42 |
| 12 | 16.62 4.41 | 62.43 2.81 | 184.18 2.81 | 26.61 6.29 | 12.26 3.50 | 49.33 2.29 | 145.53 2.29 | 91.51 7.14 | 38.21 4.30 | 42.79 3.87 |
| 13 | 63.76 5.69 | 22.83 3.10 | 67.34 3.10 | 57.59 8.08 | 27.99 4.73 | 42.12 2.38 | 124.25 2.38 | 184.49 8.52 | 144.91 8.32 | 99.08 5.68 |
| 14 | 63.21 13.10 | 56.99 8.95 | 168.14 8.95 | 56.03 29.96 | 44.99 19.76 | 73.89 7.88 | 217.99 7.88 | 165.69 21.06 | 81.65 20.69 | 49.96 18.29 |
| 15 | 46.18 3.89 | 78.06 5.02 | 268.83 17.40 | 60.73 7.04 | 40.49 4.76 | 40.12 3.37 | 118.37 3.37 | 106.79 15.53 | 81.94 6.71 | 59.49 4.41 |
| 16 | 21.70 5.33 | 8.46 1.65 | 24.97 1.65 | 6.06 3.71 | 15.12 3.98 | 37.24 1.34 | 109.85 1.34 | 76.23 3.57 | 31.31 3.41 | 26.87 3.38 |
| 17 | 32.48 3.51 | 30.55 2.76 | 90.11 2.76 | 5.18 7.05 | – | 41.95 2.23 | 123.76 2.23 | 86.39 5.81 | 47.45 5.83 | 45.53 5.22 |
| 18 | 20.28 2.64 | 5.31 1.64 | 15.66 1.64 | 6.970 7.37 | 1.64 7.37 | 17.36 1.52 | 51.21 1.52 | 56.54 4.56 | 36.66 5.06 | 29.57 4.21 |
| 19 | 6.36 1.29 | 10.35 1.73 | 30.54 1.73 | 13.56 4.29 | 12.14 2.98 | 19.72 1.04 | 58.18 1.04 | 28.37 2.54 | 16.98 2.46 | 15.15 2.23 |
| 20 | 51.99 4.28 | 37.45 3.22 | 110.47 3.22 | 45.98 12.39 | —- | 83.31 2.79 | 245.77 2.79 | 129.83 7.23 | 117.83 8.02 | 86.29 6.55 |
| 21 | 166.06 6.44 | 250.92 5.52 | 740.21 5.52 | 67.19 14.99 | 24.74 7.99 | 101.64 4.72 | 299.83 4.72 | 515.57 17.16 | 113.54 9.54 | 106.62 8.76 |
| 22 | 25.51 3.91 | 23.08 2.97 | 68.08 2.97 | 11.27 9.03 | 6.31 4.85 | 58.23 2.79 | 171.77 2.79 | 84.67 7.00 | 69.17 7.17 | 59.54 6.17 |
| 23 | 164.83 4.02 | 578.50 20.15 | 1747.51 46.59 | 60.29 7.95 | 21.91 4.21 | 252.17 3.72 | 743.89 3.72 | 740.07 14.24 | 166.52 5.75 | 166.74 5.22 |
| 24 | 153.36 12.82 | 248.21 33.23 | 847.85 66.69 | 585.09 32.96 | 181.70 16.93 | 290.32 9.21 | 856.44 9.21 | 530.91 30.44 | 356.75 19.78 | 380.67 17.03 |
| 25 | 84.08 8.07 | 33.65 5.14 | 99.27 5.14 | 7.63 9.42 | 19.96 10.39 | 50.96 4.80 | 150.33 4.80 | 151.84 13.54 | 99.62 14.40 | 69.93 12.16 |
| 26 | 392.26 5.85 | 44.62 3.48 | 131.63 3.48 | 62.11 8.70 | 19.76 3.99 | 417.59 4.12 | 1231.90 4.12 | 2084.34 20.56 | 316.52 6.16 | 298.41 5.66 |
| 27 | 306.88 5.38 | 78.30 3.36 | 231.00 3.36 | 38.64 7.82 | 21.77 4.32 | 252.44 2.91 | 744.69 2.91 | 1512.81 14.76 | 245.98 6.23 | 196.46 5.67 |
| 28 | 202.17 6.19 | 65.17 6.19 | 192.25 15.25 | 368.55 15.25 | 110.39 7.40 | 403.25 4.80 | 1189.60 4.80 | 1383.67 21.04 | 840.22 15.18 | 605.96 11.95 |
| 29 | 23.88 3.36 | 5.80 2.24 | 17.12 2.24 | — | —- | 18.21 1.17 | 53.73 1.17 | 96.84 5.09 | 23.63 3.57 | 16.35 3.19 |
| 30 | 27.09 3.45 | 30.53 4.71 | 90.07 4.71 | —- | — | 69.81 4.56 | 205.94 4.56 | 96.26 23.42 | 59.06 12.11 | 66.33 11.17 |
| Galaxy | Hβ | Hα | Hα | MBH | km/s | Eddington | L | L |
|---|---|---|---|---|---|---|---|---|
| x10-17 ergs/s/cm2 | x10-17 ergs/s/cm2 | FWHM km/s | x 106 M⊙ | km/s | ratio | x 1040 ergs/s | x1040 ergs/s | |
| 1 | 332.46 16.82 | 1463.00 40.39 | 4453.21 76.08 | 36.30 | 152.78 7.40 | 0.014 | 18.32 0.51 | 4.16 0.21 |
| 2 | - | 988.09 36.89 | 1713.59 35.03 | 3.00 | 132.17 9.45 | 0.20 | 5.99 0.22 | - |
| 3 | - | 130.81 68.33 | 3177.11 792.68 | 6.07 | 267.89 8.25 | 0.038 | 1.79 0.94 | - |
| 4 | - | 70.69 26.29 | 1398.97 364.71 | 0.54 | 131.09 7.70 | 0.11 | 0.38 0.14 | - |
| 5 | - | 1166.11 54.55 | 3758.59 111.36 | 9.44 | 116.74 4.93 | 0.015 | 2.19 0.10 | - |
| 6 | —- | 172.08 31.59 | 5725.13 506.28 | 13.56 | 185.00 3.29 | 0.004 | 0.75 0.14 | 1.09 0.09 |
| 7 | - | 766.36 52.06 | 2902.42 108.41 | 6.87 | 148.56 3.85 | 0.08 | 3.46 0.24 | - |
| 8 | - | 138.01 22.08 | 4058.77 374.01 | 8.67 | 177.86 4.37 | 0.032 | 1.31 0.21 | - |
| 9 | - | 66.81 22.90 | 1606.80 394.84 | 0.60 | 149.96 6.88 | 0.107 | 0.262 0.09 | - |
| 10 | 115.74 21.77 | 344.50 69.27 | 2642.06 262.85 | 3.39 | 212.05 5.13 | 0.072 | 1.17 0.23 | 0.39 0.07 |
| 11 | - | 300.64 70.96 | 3776.36 562.99 | 4.88 | 164.18 4.49 | 0.01 | 0.53 0.12 | - |
| 12 | 394.75 14.99 | 1717.40 39.27 | 2808.12 33.53 | 13.72 | 168.98 9.19 | 0.04 | 17.45 0.39 | 4.01 0.15 |
| 13 | 57.58 13.07 | 204.41 36.83 | 2234.93 192.81 | 3.63 | 190.43 9.44 | 0.071 | 2.81 0.51 | 0.79 0.18 |
| 14 | 477.17 68.29 | 663.70 146.27 | 4745.67 583.01 | 5.70 | 155.68 2.19 | 0.003 | 0.27 0.060 | 0.19 0.03 |
| 16 | - | 174.03 30.51 | 4815.98 550.28 | 4.71 | 123.48 2.73 | 0.003 | 0.17 0.03 | - |
| 17 | — | 217.72 51.11 | 4643.30 727.45 | 3.89 | 115.05 2.94 | 0.004 | 0.13 0.03 | —- |
| 18 | — | 221.24 44.97 | 7632.90 1117.01 | 17.40 | 197.54 7.99 | 0.0004 | 0.36 0.07 | —- |
| 19 | - | 278.50 24.65 | 5868.40 361.53 | 25.96 | 150.79 5.04 | 0.003 | 2.68 0.24 | - |
| 20 | — | 328.33 59.00 | 6719.39 805.62 | 17.52 | 179.99 3.27 | 0.003 | 0.64 0.12 | — |
| 21 | - | 267.37 84.94 | 2898.75 469.04 | 2.69 | 185.77 2.97 | 0.135 | 0.47 0.15 | - |
| 22 | 92.52 18.56 | 216.55 51.74 | 4497.51 646.77 | 8.56 | 205.73 3.78 | 0.008 | 0.81 0.19 | 0.35 0.07 |
| 23 | - | 168.01 54.94 | 2306.66 303.52 | 2.06 | 169.07 6.59 | 0.73 | 0.73 0.24 | - |
| 24 | 451.72 36.94 | 2826.95 159.69 | 2482.03 84.62 | 4.44 | 136.46 3.86 | 0.024 | 2.72 0.15 | 0.43 0.04 |
| 25 | — | 306.51 96.78 | 6526.64 1356.49 | 17.96 | 169.40 4.70 | 0.004 | 0.77 0.24 | — |