Burning and graphitization of optically levitated nanodiamonds in vacuum
Abstract
A nitrogen-vacancy (NV-) center in a nanodiamond, levitated in high vacuum, has recently been proposed as a probe for demonstrating mesoscopic center-of-mass superpositions Scala2013 ; Zhang2013 and for testing quantum gravity Albrecht2014 . Here, we study the behavior of optically levitated nanodiamonds containing NV- centers at sub-atmospheric pressures and show that while they burn in air, this can be prevented by replacing the air with nitrogen. However, in nitrogen the nanodiamonds graphitize below mB. Exploiting the Brownian motion of a levitated nanodiamond, we extract its internal temperature () and find that it would be detrimental to the NV- center’s spin coherence time Toyli2012 . These values of make it clear that the diamond is not melting, contradicting a recent suggestion Neukirch2015 . Additionally, using the measured damping rate of a levitated nanoparticle at a given pressure, we propose a new way of determining its size.
pacs:
Even though diamond is thermodynamically metastable in ambient conditions, it has extremely high thermal conductivity, Young’s modulus, electrical resistivity, chemical stability, and optical transparency Mochalin2012 ; Khmelnitsky2014 ; Davies1972 ; Shenderova2002 . Nanodiamonds inherit most of these spectacular properties from their bulk counterparts and the inclusion of color centers such the NV-center has increased their realm of applications Doherty2013 ; Mochalin2012 . Proposed and demonstrated applications of diamond, nanodiamonds and nanodiamonds with NV- centers include tribology Ivanov2010 ; Mochalin2012 , nanocomposites Behler2009 , UV detection in space applications Pace2003 , magnetometry Taylor2008 , biological imaging Balasubramanian2008 , quantum information processing Dutt2007 ; Fuchs2011 and thermometry Toyli2012 . More recently nanodiamonds with NV- centers have been suggested for testing quantum gravity Albrecht2014 and for demonstrating center of mass (CM) superpositions of mesoscopic objects Scala2013 ; Zhang2013 . These superpositions and interferometry also point towards a broader future application of levitated diamonds in sensing and gravitometry. In the scheme for testing quantum gravity, an NV- center in a nanodiamond is exploited in a Ramsey-Borde interferometer Albrecht2014 and, in the nonrelativistic limit, the first order correction to the energy dispersion scales with the size of a nanodiamond. In the case of creating CM superpositions, the NV- center’s spin is utilized and the spatial separation of the superposed CM states depends on the size of a nanodiamond Scala2013 ; Zhang2013 . To prevent the adverse effects of motional decoherence, these proposals Albrecht2014 ; Scala2013 ; Zhang2013 have been conceptualized in high vacuum ( mB). It is, however, well known that at atmospheric temperature and pressure graphite is the most stable form of carbon both in the bulk as well as at the nanoscale ( nm) Barnard2003B ; Wang2005 ; Shenderova2002 ; Bundy1996 ; Davies1972 while diamond is stable between nm and nm Barnard2003B . Since the utility of diamond and diamond with various color centers depends on its crystalline existence, it is imperative to study the behavior of diamond in vacuum for scientific as well as for practical purposes. Furthermore, while the determination of the size of nanoparticles using electron microscopy and dynamic light scattering are well established, their utility in levitated experiments is limited if not completely excluded. As a result it seems reasonable to devise a way by which one can determine the size of an individual levitated object while performing the experiment. This is particularly useful in experiments in which the size of a nanoparticle plays important roles. The significance of in situ size determination is further emphasized by the polydisperse nature of nanoparticles (for example see Fig. 4a).
In this article, we levitate high pressure high temperature (HPHT) synthesized nanodiamonds containing NV- centers (ND-NV- nm, Adamas Nanotechnology, USA) using an optical tweezer and study their behavior under different levels of vacuum. We show that as the pressure of the trapping chamber is reduced, the internal temperature () of a trapped nanodiamond can reach K. Due to this elevated temperature levitated nanodiamonds burn in air. We also demonstrate that the burning of nanodiamond is preventable under a nitrogen environment down to mB, but beyond that, it graphitizes. The source of heating is believed to be the absorption of nm trapping laser light by the impurities in diamond and the amorphous carbon on the surface. Lastly, exploiting the measured damping rate of a levitated object, we present a new way of determining its size in situ.
I Experimental setups
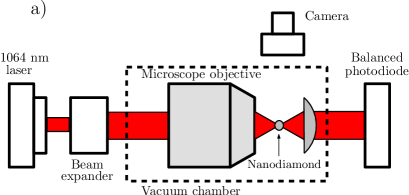
Figure 1a shows a schematic of our experimental setup where we use a numerical aperture (NA) microscope objective to focus a nm laser beam into a diffraction limited spot. The force resulting from the electric field gradient forms the basis of our dipole trap Gieseler2012 . The balanced photodiode visible in Fig. 1a provides a voltage signal generated from the interference between the directly transmitted trapping laser light and the oscillator’s position dependent scattered electromagnetic radiation Gieseler2012 . Performing a Fourier transform on this voltage signal provides the measured spectral information as well as the damping rate of a levitated nanoparticle. We use this spectral information and damping rate to retrieve and the size of a nanodiamond.
In the regime where the oscillation amplitude of a trapped particle is small, the trapping potential of an optical tweezer can be approximated as harmonic Gieseler2012 . Under this condition, the motion of a levitated object can be expressed as
| (1) |
where is the displacement of a trapped particle from the center of the trap along the -axis. and , respectively, are the mass and the damping rate of a trapped particle while is the trap frequency and is the spring constant of the trap Gieseler2012 . is a Gaussian random force exerted by the gas molecules on a trapped particle with and , where is the Boltzmann constant, is the CM temperature of a trapped particle, and is the Dirac delta function Gieseler2012 . Similar analyses for the remaining two axes are also valid. After performing a Fourier transform and rearrangement, the power spectral density (PSD) of (1) can be written as
| (2) |
We fit (2) with the experimental data.
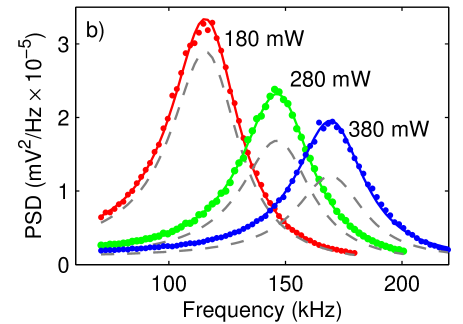
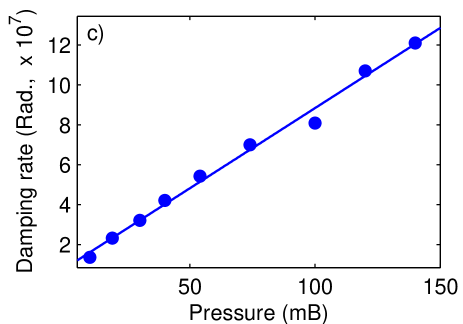
Figure 1b shows the PSDs corresponding to the measured voltage signals from a levitated nanodiamond for different trapping powers along with the respective fits (solid lines) of equation (2) at mB. For the purpose of comparison, in Fig. 1b we have also included the relevant theoretical PSDs (dashed gray lines). In plotting the theoretical PSDs we have assumed that all parameters are identical to the measured PSDs except which has been taken equal to K. Figure 1c demonstrates the measured damping rate as a function of pressure at a constant trapping power of mW. Later, we use this damping rate to find the size of a nanoparticle.

II Levitated nanodiamonds in vacuum
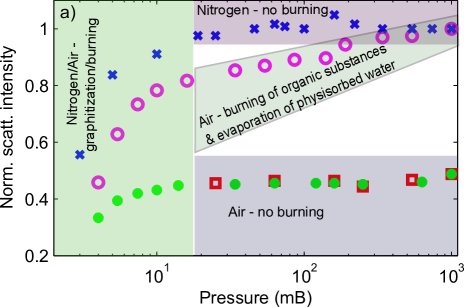
To study the behavior of diamond below atmospheric pressure, after levitating a nanodiamond with the minimum possible trapping power ( mW), we gradually take it to different levels of vacuum whilst continuously monitoring its scattering intensity (size) using a camera. Figure 2a shows a typical plot of scattering intensity versus pressure (pink circles) from a levitated nanodiamond (for more data points see supplementary information). It can be observed that as we evacuate the trapping chamber, the scattering intensity diminishes: a levitated nanodiamond shrinks in size as the pressure is reduced. We attribute this reduction in size to the removal of physisorbed water and organic substances such as the carboxyl groups (nanodiamonds as obtained from the supplier are in water and are coated with carboxyl groups for stabilization) present on the surface of nanodiamonds down to mB where the temperature reaches K (see Fig. 3). Physisorbed water and organic impurities normally disappearOsswald2006 at or below K. This is further confirmed when we keep a levitated nanodiamond in a vacuum of less than mB for an extended period of time (about an hour) and take it to back to atmospheric pressure (red squares in Fig. 2a) and bring it down to the low pressures again. In the second round of evacuation, the scattering intensity remains constant down to mB. This unaltered scattering intensity in the second round of evacuation indicates the absence of substances which evaporate/burn at relatively lower temperatures.
The reduction in size below mB is attributed to the burning of amorphous carbon or diamond. Amorphous carbon is generally found as an outer layer on the surface of nanodiamonds Gaebel2012 ; Smith2010 ; Osswald2006 . The burning temperature of amorphous carbon Osswald2006 at atmospheric pressure varies between K - K while the oxidation temperature of nanodiamondsOsswald2006 ; Gaebel2012 ; Xu2002 ranges from K to K. Also, the exact oxidation temperature of nanodiamonds depend on the surface quality, the crystallographic faces, and the densities of impurities in nanodiamonds Gaebel2012 ; Osswald2006 ; Xu2002 . To confirm the presence of amorphous carbon as well as diamond in the nanoparticles that we have used in our experiments, we performed Raman spectroscopy using a nm laser. At this wavelength amorphous carbon is more sensitive than diamond Ferrari2004 . Figure 2b presents the relevant data. This figure clearly shows the presence of amorphous carbon and diamond peaked at cm-1 and at cm-1, respectively Smith2010 ; Ferrari2004 ; Chen1999 ; Merkulov1997 Given that amorphous carbon is a strongly absorbing material Nagano2008 ; Stagg1993 ; Maron1990 ; Duley1984 , trapping light ( nm) absorption and hence raised and consequent burning in an air environment is highly probable. This burning of nanodiamond in air can potentially be a major hurdle in applications where vacuum is inevitable.
Based on the idea that an oxygen-less environment may be a cure to this problem, we have studied the behavior of levitated nanodiamonds in a nitrogen environment. This is shown in Fig. 2a as blue crosses for a constant trapping power of mW. It can be observed that at pressures mB the scattering intensity hence the size of a nanodiamond remains unchanged; even though temperature is quite high (see Fig. 3). This is due to the fact that for burning to occur, a nanodiamond requires oxygen which is absent in a nitrogen rich environment. However, if the pressure is reduced below mB, the scattering intensity of the nanodiamond gradually diminishes. Given that there is almost no oxygen in the chamber and the reduced pressure means less cooling due to gas molecules and hence higher internal temperature, we believe this is the onset of graphitization of the nanodiamond. At atmospheric pressure graphitization of nanodiamonds starts in the temperature range K and depends on the surface quality of nanodiamonds Chen1999 ; Xu2002 . Since we are operating at sub-atmospheric pressures, graphitization at a lower temperature is most likely to happen.
III Internal temperature of a levitated nanodiamond
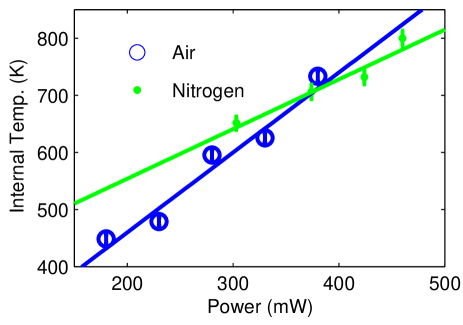
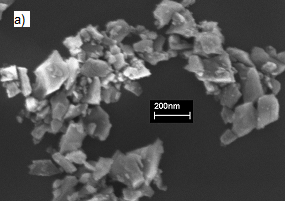
To verify that a levitated nanodiamond reaches such high temperatures in moderate levels of vacuum, in Fig. 3 we present obtained from the same nanodiamond used in Fig. 2 as a function of trapping power in air (blue circles) at mB. In measuring we have assumed that a levitated nanodiamond is at room temperature at mB. Also, since fitting uncertainties increase with the increasing pressure, has been plotted as a function of trapping power at a constant pressure and it was measured during the round of evacuation at which a levitated nanodiamond maintains its size. Constancy in size/mass is a requirement of the PSD analysis. From Fig. 3 one can see that the internal temperature reaches K at mW of trapping power in air. This is well within the reported burning temperature of amorphous carbon or diamond Xu2002 ; Osswald2006 ; Gaebel2012 . In Fig. 3 we have also included s obtained from a levitated nanodiamond submerged in a nitrogen environment. In this case reaches approximately K at the maximum trapping power. At pressures below mB, temperatures are expected to be higher given that the cooling due to gas molecules becomes less effective while the absorption remains constant. It is noteworthy that the fluorescence from NV- centers in diamond decreases significantly at temperatures beyond K and by K it reduces to of the room temperature value Toyli2012 . Also, at K, NV- center’s fluorescence lifetime and the contrast between electron spin resonances reduce below of the room temperature value Toyli2012 . At a temperature above K, the spin coherence time of the NV- center decreases as well Toyli2012 . Furthermore, the highest temperature that we have measured here, using trapping powers higher than those have been used by Neukirch et al. Neukirch2015 , rules out the possibility of melting diamond as suggested in ref. . Diamond usually melts at temperatures K and requires pressure above atmospheric pressure Eggert2010 . A slight difference between the temperatures at a constant power such as at mW in Fig. 3 between different environments can be attributed to the variation in surface qualities and the densities of impurities in different nanodiamonds Xu2002 ; Qian2004 . Additionally, it has been demonstrated that bigger particles heat up rapidly compared to smaller particles under the same experimental conditions MillenNat2014 . As a result, variation in the internal temperatures is expected unless all the attributes of different particles are identical. However, due to the inherent nature of levitated experiments, it is difficult to levitate particles with the same attributes in different runs of an experiment. This is further worsened by the polydispersity of nanoparticles. For example, the average size of the nanodiamonds that we have used in our experiment is quoted to be nm by the manufacturer. A representative scanning electron microscope (SEM) image of this nanodiamond is shown in Fig. 4a. Nanodiamonds from a few tens of nanometers to a few hundred nanometers are visible. Consequently, trapping different sizes of nanodiamonds in different runs of an experiment is possible. Nevertheless, to be consistent throughout the experiment, we levitate nanodiamonds of similar size by monitoring their scattering intensities. Also, next we present a way of determining the size of an individual levitated object from the measured damping rate () that it encounters while oscillating inside the trap. For the purpose of following calculations, we assume that a levitated nanodiamond is of spherical shape.
IV Determination of the size of a levitated nanodiamond
The effective damping rate as shown in Fig. 1c can be expressed as , where and are the damping rates due to the impinging and emerging gas molecules, respectively MillenNat2014 . can be written as while is related to by , where , , , and are the radius of a trapped particle, the number density of gas molecules at pressure , molecular mass, and the mean thermal velocity of impinging gas molecules, respectively MillenNat2014 . can further be expressed as , where is the number of gas molecules per cubic meter at atmospheric conditions and is the atmospheric pressure. On substitutions of various terms, one can express as
| (3) |
where has been expressed as and is the mass density of diamond.
Given that the levitated nanodiamonds burn, equation (3) gives the ultimate size of a nanodiamond for which we previously found temperatures. That is, it is the size of the nanodiamond after the first round of evacuation. The actual size of a nanodiamond before burning can be found using scattering theory. The scattering intensity of a Rayleigh particle () is given by , where and is the intensity of the trapping light BohrenHuffman . Provided that we know the scattering intensity (see Fig. 2b) at different pressures, we can find the actual size of a nanodiamond using equation (4):
| (4) |
where and are the radius and the scattering intensity of the particle at pressure , respectively.
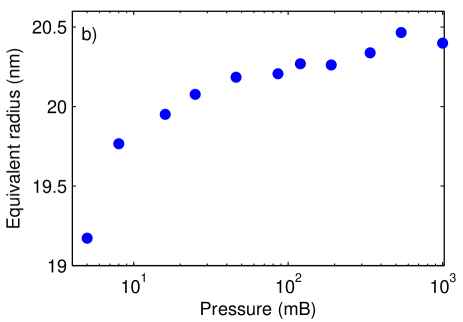
As examples, using the model developed here, we estimate the sizes of the nanodiamonds for which we have presented internal temperatures in Fig. 3. Using equations (3) and (4), and parameters , K, K, kg/, kg , mB and radian with the minimum trapping power of mW, Fig. 4b shows the radius of the trapped nanodiamond at various pressures in air. It can be observed that when the nanodiamond was initially trapped at atmospheric pressure, its diameter was nm. Similarly, for the nitrogen case using the same parameters except radian and K, we get the ultimate diameter of the nanodiamond is nm. Given the uncertainty in the shape of nanodiamonds as visible in Fig. 4a, the nanodiamonds that we have used to find s in air and nitrogen ambients are of similar size. This is also in good agreement with the technique (initial scattering intensities) that we have utilized to trap similar size nanodiamonds in different runs of an experiment. Furthermore, even though the actual dimensions of a nanodiamond will be different from due to its asymmetric shape, the estimated size provided by our model is well within the distribution visible in the SEM image (Fig. 4a). Lastly, we believe that the method developed here for the determination of size of an individual particle can be used in any levitated experiment.
V Discussion
We have demonstrated that nanodiamonds burn in air while they graphitize in a nitrogen ambient by absorbing trapping laser ( nm) light as the cooling due to gas molecules becomes less effective with decreasing pressure. We believe that amorphous carbon, a strongly absorbing material, present on the surface of nanodiamonds is a key reason for this. We also think that purer nanodiamonds instead of the currently available HPHT synthesized nanodiamonds can be a cure to this problem. Our Brownian motion based analysis has shown that the internal temperature of a levitated nanodiamond can reach up to K. This rules out the possibility of melting diamond which requires Eggert2010 a temperature K. Lastly, exploiting the damping rate that a particle encounters while in motion, we have developed a new way of determining its size. We consider that this new technique will be useful in present and future levitated experiments where the traditional electron microscopy and dynamic light scattering based size determinations are not suitable.
VI Method
Nanodiamonds containing NV- centres (ND-NV- nm) were bought from Adamas Nanotechnology Inc, USA. The average size of the nanodiamonds quoted by the manufacturer is nm. To prevent agglomeration we sonicate as received nanodiamonds for minutes in an ultrsonic bath and then put them into a nebulizer and inject them into the trapping chamber. The trapping chamber is continuously monitored by a CMOS camera (Thorlabs Inc). Once a nanodiamond is trapped, the trapping chamber is evacuated to study the behaviour of nanodiamonds in vacuum. Power spectral density data were collected using a balanced photodiode (Thorlabs Inc) and a Picoscope oscilloscope (Pico Technology, UK). In the case of nanodiamonds immersed in nitrogen, the trapping chamber was purged with nitrogen fifteen times.
References
- (1) Scala, M., Kim, M. S., Morley, G. W., Barker, P. F. & Bose, S. Matter-wave interferometry of a levitated thermal nano-oscillator induced and probed by a spin. Phys. Rev. Lett. 111, 180403 (2013).
- (2) Yin, Z.-q., Li, T., Zhang, X. & Duan, L. Large quantum superpositions of a levitated nanodiamond through spin-optomechanical coupling. Phys. Rev. A 88, 033614 (2013).
- (3) Albrecht, A., Retzker, A. & Plenio, M. B. Testing quantum gravity by nanodiamond interferometry with nitrogen-vacancy centers. Phys. Rev. A 90, 033834 (2014).
- (4) Toyli, D. et al. Measurement and control of single nitrogen-vacancy center spins above 600 K. Phys. Rev. X 2, 031001 (2012).
- (5) Neukirch, L. P., von Haartman, E., Rosenholm, J. M. & Vamivakas, N. Multi-dimensional single-spin nano-optomechanics with a levitated nanodiamond. Nat. Photon. Advance Online publication (2015).
- (6) Mochalin, V. N., Shenderova, O., Ho, D. & Gogotsi, Y. The properties and applications of nanodiamonds. Nat. Nano. 7, 11–23 (2012).
- (7) Khmelnitsky, R. A. & Gippius, A. A. Transformation of diamond to graphite under heat treatment at low pressure. Phase Transit. 87, 175–192 (2014).
- (8) Davies, G. & Evans, T. Graphitization of diamond at zero pressure and at a high pressure. P Roy. Soc. Lond. A Mat. 328, 413–427 (1972).
- (9) Shenderova, O. A., Zhirnov, V. V. & Brenner, D. W. Carbon nanostructures. Crit. Rev. Solid State 27, 227–356 (2002).
- (10) Doherty, M. W. et al. The nitrogen-vacancy colour centre in diamond. Phys. Rep. 528, 1 – 45 (2013).
- (11) Ivanov, M. G., Pavlyshko, S. V., Ivanov, D. M., Petrov, I. & Shenderova, O. Synergistic compositions of colloidal nanodiamond as lubricant-additive. J. Vac. Sci. Technol. B 28, 869–877 (2010).
- (12) Behler, K. D. et al. Nanodiamond-polymer composite fibers and coatings. ACS Nano 3, 363–369 (2009).
- (13) Pace, E. & Sio, A. D. Diamond detectors for space applications. Nucl. Instrum. Meth. A 514, 93 – 99 (2003).
- (14) Taylor, J. M. et al. High-sensitivity diamond magnetometer with nanoscale resolution. Nat. Phys. 4, 810–816 (2008).
- (15) Balasubramanian, G. et al. Nanoscale imaging magnetometry with diamond spins under ambient conditions. Nat. Phys. 455, 648–651 (2008).
- (16) Dutt, M. V. G. et al. Quantum register based on individual electronic and nuclear spin qubits in diamond. Science 316, 1312–1316 (2007).
- (17) Fuchs, G. D., Burkard, G., Klimov, P. V. & Awschalom, D. D. A quantum memory intrinsic to single nitrogen-vacancy centres in diamond. Nat. Phys. 7, 789–793 (1999).
- (18) Barnard, A. S., Russo, S. P. & Snook, I. K. Size dependent phase stability of carbon nanoparticles: Nanodiamond versus fullerenes. J Chem. Phys. 118, 5094–5097 (2003).
- (19) Wang, X., Scandolo, S. & Car, R. Carbon phase diagram from Ab Initio molecular dynamics. Phys. Rev. Lett. 95, 185701 (2005).
- (20) Bundy, F. et al. The pressure-temperature phase and transformation diagram for carbon; updated through 1994. Carbon 34, 141 – 153 (1996).
- (21) Gieseler, J., Deutsch, B., Quidant, R. & Novotny, L. Subkelvin parametric feedback cooling of a laser-trapped nanoparticle. Phys. Rev. Lett. 109, 103603 (2012).
- (22) Osswald, S., Yushin, G., Mochalin, V., Kucheyev, S. O. & Gogotsi, Y. Control of sp2/sp3 carbon ratio and surface chemistry of nanodiamond powders by selective oxidation in air. J Am. Chem. Soc. 128, 11635–11642 (2006).
- (23) Gaebel, T. et al. Size-reduction of nanodiamonds via air oxidation. Diam. Relat. Mater. 21, 28 – 32 (2012).
- (24) Smith, B. R., Gruber, D. & Plakhotnik, T. The effects of surface oxidation on luminescence of nano diamonds. Diam. Relat. Mater. 19, 314 – 318 (2010).
- (25) Xu, N., Chen, J. & Deng, S. Effect of heat treatment on the properties of nano-diamond under oxygen and argon ambient. Diam. Relat. Mater. 11, 249 – 256 (2002).
- (26) Ferrari, A. C. & Robertson, J. Raman spectroscopy of amorphous, nanostructured, diamond–like carbon, and nanodiamond. Philos. T. Roy. Soc. A 362, 2477–2512 (2004).
- (27) Chen, J., Deng, S. Z., Chen, J., Yu, Z. X. & Xu, N. S. Graphitization of nanodiamond powder annealed in argon ambient. Appl. Phys. Lett. 74, 3651–3653 (1999).
- (28) Merkulov, V. I. et al. uv studies of tetrahedral bonding in diamondlike amorphous carbon. Phys. Rev. Lett. 78, 4869–4872 (1997).
- (29) Nagano, A., Yoshitake, T., Hara, T. & Nagayama, K. Optical properties of ultrananocrystalline diamond/amorphous carbon composite films prepared by pulsed laser deposition. Diam. Relat. Mater. 17, 1199 – 1202 (2008).
- (30) Stagg, B. & Charalampopoulos, T. Refractive indices of pyrolytic graphite, amorphous carbon, and flame soot in the temperature range 25° to 600 oC. Combust. Flame 94, 381 – 396 (1993).
- (31) Maron, N. Optical properties of fine amorphous carbon grains in the infrared region. Astrophys. Space Sci. 172, 21–28 (1990).
- (32) Duley, W. W. Refractive indices for amorphous carbon. Astrophys. J. 287, 694 – 696 (1984).
- (33) Eggert, J. H. et al. Melting temperature of diamond at ultrahigh pressure. Nat. Phys. 6, 40–43 (2010).
- (34) Qian, J., Pantea, C., Huang, J., Zerda, T. & Zhao, Y. Graphitization of diamond powders of different sizes at high pressure–high temperature. Carbon 42, 2691 – 2697 (2004).
- (35) Millen, J., Deesuwan, T., Barker, P. & Anders, J. Nanoscale temperature measurements using non-equilibrium brownian dynamics of a levitated nanosphere. Nat. Nano. 9, 425–429 (2014).
- (36) Bohren, C. F. & Huffman, D. R. Particles Small Compared with the Wavelength, 130–157 (Wiley-VCH Verlag GmbH, 2007).