Silicon nitride membrane resonators at millikelvin temperatures with quality factors exceeding
Abstract
We study mechanical dissipation of the fundamental mode of millimeter-sized, high quality-factor () metalized silicon nitride membranes at temperatures down to 14 mK using a three-dimensional optomechanical cavity. Below 200 mK, high- modes of the membranes show a diverging increase of with decreasing temperature, reaching at 14 mK, an order of magnitude higher than reported before. The ultra-low dissipation makes the membranes highly attractive for the study of optomechanics in the quantum regime, as well as for other applications of optomechanics such as microwave to optical photon conversion.
Mechanical resonators made from silicon nitride have shown great potential for both fundamental research and applications. They have become platforms for studying quantum optomechanics, Thompson et al. (2008); Anetsberger et al. (2009); LaHaye et al. (2004); Naik et al. (2006); Sankey et al. (2010); Rocheleau et al. (2010); Purdy, Peterson, and Regal (2013); Purdy et al. (2013); Eerkens et al. (2015); Yuan et al. (2015) and key elements for applications such as optical to micro- and radio-wave photon transducers Bagci et al. (2014); Andrews et al. (2014) and NEMS/MEMS sensors.Unterreithmeier, Weig, and Kotthaus (2009); Faust et al. (2012); Fong et al. (2010) High-stress SiNx devices typically have very high quality factors, which is a key parameter for a mechanical resonator. In optomechanics, low dissipation reduces the mechanical resonator’s coupling to the environment and improves the cooperativity, enabling cooling to a lower temperature and state preparation with higher fidelity. High quality factors also enhance the efficiency of a transducer as well as the sensitivity of a NEMS/MEMS sensor.
Studies of the quality factor of SiNx resonators have found at room temperature of up to for nanostrings,Verbridge et al. (2006) for beams,Unterreithmeier, Weig, and Kotthaus (2009); Faust et al. (2012) for trampolines, Kleckner et al. (2011) and for the fundamental mode of membranes.Zwickl et al. (2008) Higher modes of membranes have been observed to have higher -factors,Adiga et al. (2012); Chakram et al. (2014) up to , Chakram et al. (2014) but show weaker optomechanical coupling (, the cavity mode frequency; , the mechanical displacement and , the amplitude of the zero-point fluctuation) and have smaller mode spacing leading to a dense mode spectrum. Smaller membranes were previously studied down to millikelvin temperatures, but was relatively low due to their lower aspect ratio.Suh, Weinstein, and Schwab (2013) Measurements of the of the fundamental mode of millimeter-sized membranes down to 300 mK demonstrated a plateau in below 1K at a value up to .Zwickl et al. (2008) A recent comprehensive review can be found in Ref. Villanueva and Schmid, 2014.
Here, we study the quality factor of large, high- SiNx membranes at temperatures down to 14 mK. We use a three-dimensional (3D) superconducting optomechanical cavity Yuan et al. (2015) to detect the motion. Similar to previous reports, we observe a plateau in down to 200 mK. Below 200 mK, we observe a new behavior of the quality factors of high- modes that diverges down to the lowest temperature we can measure, reaching a record of for a fundamental mode at 14 mK, promising for future applications in optomechanics in both the microwave and optical domains.
A photograph of the device is shown in Fig. 1(a). The 3D cavity is formed by two halves of a machined Al block. An SMA connector is partially inserted into the cavity for reflection measurement. The mechanical resonator is a Norcada SiNx membrane which can be seen on the sapphire support substrate. We present here results from the two membranes we have studied at these temperatures. The membranes are 50 nm thick in a square of size with mm for Device I and mm for Device II. Device I is stoichiometric with and a tensile stress of 0.8 GPa. Device II has a tensile stress of 0.25 GPa and is not specified by the manufacturer. We deposit a metal layer of 20 nm of Al on the membrane which forms a capacitor with the antenna pads deposited on the substrate. We avoid depositing Al over the the edges of the membrane to minimize possible mechanical losses at the clamping points. Yu, Purdy, and Regal (2012) The motion of the membrane is coupled to the cavity field via the antenna. The membrane is anchored on the substrate with l of Bison ‘5 minute’ 2-part epoxy at one corner of the silicon frame. The membrane-embedded 3D cavity is mounted with the plane of the membrane lying horizontally on top of the antenna chip in a cryo-free dilution refrigerator (BlueFors LD250) in which the temperature is controlled between 14 mK and 800 mK.
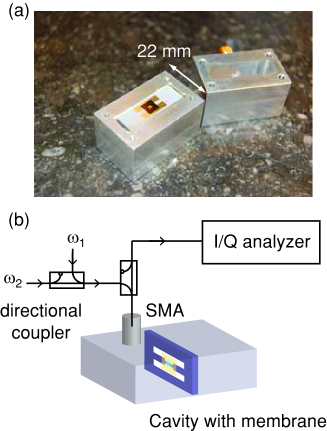
We measure the cavity response and mechanical motion using microwave reflectometry as described in previous work.Yuan et al. (2015) A simplified schematic of the reflection measurement is illustrated in Fig.1(b). Microwave signals are attenuated and sent into the cavity. The reflected signal is amplified and read out using a vector signal analyzer (Rohde and Schwarz FSV30) which records the in- and out-of-phase quadrature of the signal and as a function of time within a bandwidth up to 28 MHz around a local oscillator reference frequency. We study two membrane-cavity devices. The cavity resonance is GHz for Device I and GHz for Device II, with linewidths below 300 mK of kHz and kHz, respectively. The mechanical resonant frequency and the single-photon coupling rate for the modes studied are listed in Table 1. From the resonant frequency of the fundamental modes, we estimate the effective stress of the metalized membranes to be 0.79 GPa for Device I and 0.09 GPa for Device II, taking an effective density of 3.0 g/cm3. In Device II, the gap to the antenna is 3 m. In Device I, the gap is 10 m, resulting in a significantly reduced .
To measure the quality factor, we drive the membrane at its resonance frequency and then detect the timescale it takes for the motion to ring down (decay). The membrane is driven optomechanically, with a scheme based on an optomechanically-induced transparency (OMIT) measurement. Weis et al. (2010) As illustrated in Fig. 2(a), two phase-locked microwave signals are sent into the cavity: a swap tone at and a shake tone at . In the presence of the swap tone and the shake tone, there is a beating of the cavity field intensity at , giving an oscillating radiation pressure force that shakes the drum. From the optomechanical interaction, photons at are Raman scattered by the membrane resonator and upconverted into the cavity resonance, producing a mechanical sideband at that we use to measure the motion. The I/Q analyzer is set to detect the signal at with a sample rate of 100 Hz. Fig. 2(b) shows an example of OMIT measurement taken with Device II in the limit of large optomechanical cooperativity , where is the number of photons in the cavity generated by the swap tone. To avoid backaction of the swap tone on the motion, for the ringdown measurement we operate in a regime where of the swap tone is sufficiently small and optomechanical damping is negligible (, ).
| Device | I | II | ||
|---|---|---|---|---|
| Mode | (1,1) | (1,1) | (1,2) | (2,1) |
| (kHz) | 242 | 121 | 193 | 192 |
| (Hz) | 0.03 | 0.22 | 0.01 | 0.01 |
Fig. 2(c) illustrates the protocol of the optomechanical ringdown measurement. The membrane is first driven into motion when and are both on. The detected signal at consists of the directly reflected signal of the shake tone at as well as the mechanical sideband generated from the swap tone at . At the shake tone is switched off, while the swap tone stays on. When turning off the shake tone, the associated microwave field at decays on a timescale corresponding to . In addition to the microwave field from the shake tone, there is a second microwave field at that arises from a sideband of the swap tone generated by the mechanical motion. This second microwave field decays with a much slower timescale corresponding to . On the I/Q analyzer, we then observe a signal at from shake tone that falls off at the cavity decay rate and the remaining mechanical ringdown signal is read out and used to calculate the mechanical amplitude as it decays.
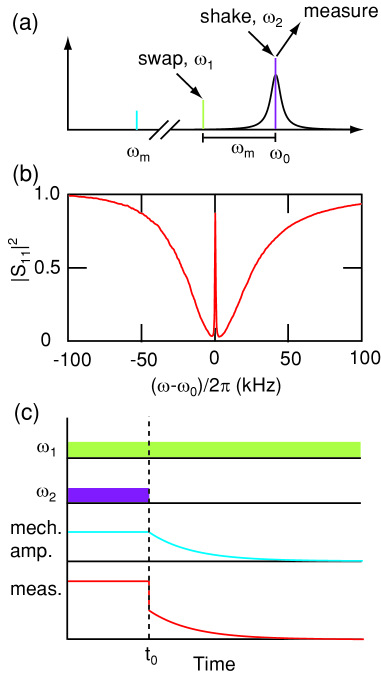
Fig. 3(a) shows an example of a ringdown trace of the mechanical resonator taken at 14 mK. The -axis is proportional to , representing the square amplitude of the resonator. By fitting the curve to an exponential decay , and the quality factor can be extracted. We vary the cryostat temperature and record the corresponding ringdown traces. The resultant -factor as a function of temperature for Device I (1,1) mode is plot in a linear scale in Fig. 3(b). As is decreased from 800 mK to 200 mK, there is a relatively flat plateau in , consistent with previous results with an optical detection scheme.Zwickl et al. (2008) As is further reduced to below 200 mK, begins to go up, and continues rising with no indication of saturation down to the base temperature of mK. The highest value corresponds to mHz and a time constant for amplitude of s.
The slight deviation from a straight line in Fig. 3(a) suggests some weak negative nonlinear damping, although the mechanical response of the membrane is still in the linear restoring-force regime. The amplitude unity in Fig. 3(a) corresponds to 0.37 nm. For small amplitudes nm, where the deviation becomes significant, we also performed an additional exponential fit, finding a quality factor for the lower amplitude regime. The Duffing critical amplitude is estimated to be 6.3 nm with the formulae in Ref. Chobotov and Binder, 1964; Kozinsky, 2007, significantly above the excitation amplitude used here.
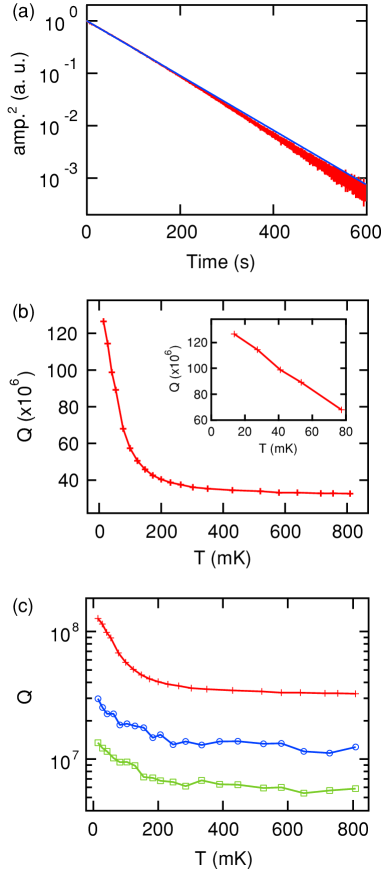
In Fig. 3(c) we plot the of Device I (1,1) mode (red), Device II (1,1) mode (blue) and Device II (1,2) mode (green) together in a log scale. Quality factors of all three modes are above and show similar behavior, improving with decreasing temperature below 200 mK and leveling off between 200 mK and 800 mK. It is also interesting to note that although the mode temperature saturates at 210 mK for Device I and 180 mK for Device II, continues to go up as the cryostat is cooled down to base temperature. The high mode temperature in the experiment is likely related to mechanical vibration noise in the setup, which includes only minimal vibration isolation. The fact that we observe an increasing down to temperatures far below the mode temperature suggests that the mechanism limiting the -factor is not related to the mode occupation. A likely candidate is a physical property of the material itself, such as surface losses.Villanueva and Schmid (2014) In this case, the physical lattice could be thermalized with the fridge, while the mechanical mode is heated out of equilibrium by the vibrational noise.
In contrast to the other modes, Mode (2,1) of Device II has a much lower that is independent of temperature from 14 to 800 mK. Although the (1,2) mode and (2,1) are separated by only 1 kHz in frequency, it is striking that -factors are different by orders of magnitude. This large difference in could result from the anchoring of the chip at one corner, giving very different clamping losses through the substrate chip for the two modesSchmid et al. (2011). With a splitting of the (1,2) and (2,1) into modes symmetric (S) and antisymmetric (AS) with respect to the anchor point, the AS mode could have a temperature-independent limited by radiation into the sapphire substrate, while the S mode would then be limited by a different temperature-dependent mechanism.
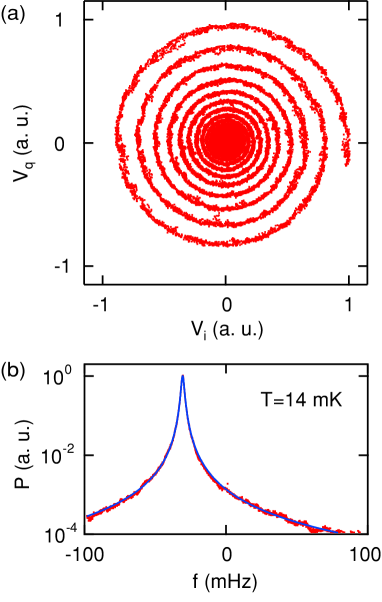
In the ringdown experiments performed here with the I/Q analyzer, we are able to determine not only the energy loss rate of the mechanical resonator, but also to characterize the dephasing of its mechanical motion. Applying an FFT to the acquired I/Q data from sufficiently long ringdown time trace, one can reconstruct the spectral content of the mechanical resonance during ringdown, giving access to the spectral linewidth -factor.Schneider et al. (2014) To do this, we slightly detune the swap tone with mHz and measure the I/Q data for seconds. In Fig. 4(a) the I/Q vector plot is shown, the -axis representing the in-phase quadrature and the -axis the out-of-phase quadrature . The trace forms a spiral: the decrease of the vector length corresponds to the decay in mechanical amplitude, and the angular frequency of the trajectory in the polar plot is determined by . To reconstruct a spectrum from the data, we perform an FFT of the complex vector , , shown in Fig. 4(b). A fit to the lineshape gives the spectral , in agreement, to within the error margin, with the ringdown quality factor extracted from the same dataset, demonstrating that the dephasing is not a significant source of decoherence for these membrane resonators.
In conclusion, we have measured the quality factor of SiNx membranes at millikelvin temperatures with 3D optomechanical cavities. At the base temperature of 14 mK, -factors as high as are observed for a fundamental mode, demonstrating the exceptional performance of SiNx membranes as mechanical resonators. This high is achieved in the presence of an Al coating of the membrane, expanding their potential into electrical and microwave applications. By virtue of this low dissipation, SiNx membranes could be an attractive test bed for quantum superposition states of massive mechanical objects and other applications in optomechanics.
Acknowledgements.
We thank Vibhor Singh and Simon Gröblacher for useful discussions. We acknowledge support from the Dutch Organization for Fundamental Research on Matter (FOM) and the Netherlands Organization for Scientific Research (NWO) through the Innovative Research Incentives Scheme (VIDI).References
- Thompson et al. (2008) J. D. Thompson, B. M. Zwickl, A. M. Jayich, F. Marquardt, S. M. Girvin, and J. G. E. Harris, Nature 452, 72 (2008).
- Anetsberger et al. (2009) G. Anetsberger, O. Arcizet, Q. P. Unterreithmeier, R. Rivière, A. Schliesser, E. M. Weig, J. P. Kotthaus, and T. J. Kippenberg, Nat. Phys. 5, 909 (2009).
- LaHaye et al. (2004) M. D. LaHaye, O. Buu, B. Camarota, and K. C. Schwab, Science 304, 74 (2004).
- Naik et al. (2006) A. Naik, O. Buu, M. D. LaHaye, A. D. Armour, A. A. Clerk, M. P. Blencowe, and K. C. Schwab, Nature 443, 193 (2006).
- Sankey et al. (2010) J. C. Sankey, C. Yang, B. M. Zwickl, A. M. Jayich, and J. G. E. Harris, Nat. Phys. 6, 707 (2010).
- Rocheleau et al. (2010) T. Rocheleau, T. Ndukum, C. Macklin, J. B. Hertzberg, A. A. Clerk, and K. C. Schwab, Nature 463, 72 (2010).
- Purdy, Peterson, and Regal (2013) T. P. Purdy, R. W. Peterson, and C. A. Regal, Science 339, 801 (2013).
- Purdy et al. (2013) T. P. Purdy, P.-L. Yu, R. W. Peterson, N. S. Kampel, and C. A. Regal, Phys. Rev. X 3, 031012 (2013).
- Eerkens et al. (2015) H. J. Eerkens, F. M. Buters, M. J. Weaver, B. Pepper, G. Welker, K. Heeck, P. Sonin, S. de Man, and D. Bouwmeester, Opt. Express 23, 8014 (2015).
- Yuan et al. (2015) M. Yuan, V. Singh, Y. M. Blanter, and G. A. Steele, Nat. Commun. 6, 8491 (2015).
- Bagci et al. (2014) T. Bagci, A. Simonsen, S. Schmid, L. G. Villanueva, E. Zeuthen, J. Appel, J. M. Taylor, A. Sørensen, K. Usami, A. Schliesser, and E. S. Polzik, Nature 507, 81 (2014).
- Andrews et al. (2014) R. W. Andrews, R. W. Peterson, T. P. Purdy, K. Cicak, R. W. Simmonds, C. A. Regal, and K. W. Lehnert, Nat. Phys. 10, 321 (2014).
- Unterreithmeier, Weig, and Kotthaus (2009) Q. P. Unterreithmeier, E. M. Weig, and J. P. Kotthaus, Nature 458, 1001 (2009).
- Faust et al. (2012) T. Faust, P. Krenn, S. Manus, J. P. Kotthaus, and E. M. Weig, Nat. Commun. 3, 728 (2012).
- Fong et al. (2010) K. Y. Fong, W. H. P. Pernice, M. Li, and H. X. Tang, Appl. Phys. Lett. 97, 073112 (2010).
- Verbridge et al. (2006) S. S. Verbridge, J. M. Parpia, R. B. Reichenbach, L. M. Bellan, and H. G. Craighead, J. Appl. Phys. 99, 124304 (2006).
- Kleckner et al. (2011) D. Kleckner, B. Pepper, E. Jeffrey, P. Sonin, S. M. Thon, and D. Bouwmeester, Opt. Express 19, 19708 (2011).
- Zwickl et al. (2008) B. M. Zwickl, W. E. Shanks, A. M. Jayich, C. Yang, A. C. Bleszynski Jayich, J. D. Thompson, and J. G. E. Harris, Appl. Phys. Lett. 92, 103125 (2008).
- Adiga et al. (2012) V. P. Adiga, B. Ilic, R. A. Barton, I. Wilson-Rae, H. G. Craighead, and J. M. Parpia, J. Appl. Phys. 112, 064323 (2012).
- Chakram et al. (2014) S. Chakram, Y. S. Patil, L. Chang, and M. Vengalattore, Phys. Rev. Lett. 112, 127201 (2014).
- Suh, Weinstein, and Schwab (2013) J. Suh, A. J. Weinstein, and K. C. Schwab, Appl. Phys. Lett. 103, 052604 (2013).
- Villanueva and Schmid (2014) L. G. Villanueva and S. Schmid, Phys. Rev. Lett. 113, 227201 (2014).
- Yu, Purdy, and Regal (2012) P.-L. Yu, T. P. Purdy, and C. A. Regal, Phys. Rev. Lett. 108, 083603 (2012).
- Weis et al. (2010) S. Weis, R. Rivière, S. Deléglise, E. Gavartin, O. Arcizet, A. Schliesser, and T. J. Kippenberg, Science 330, 1520 (2010).
- Chobotov and Binder (1964) V. A. Chobotov and R. C. Binder, J. Acoust. Soc. Am. 36 (1964).
- Kozinsky (2007) I. Kozinsky, Nonlinear Nanoelectromechanical Systems, Ph.D. thesis, California Institute of Technology (2007).
- Schmid et al. (2011) S. Schmid, K. D. Jensen, K. H. Nielsen, and A. Boisen, Phys. Rev. B 84, 165307 (2011).
- Schneider et al. (2014) B. H. Schneider, V. Singh, W. J. Venstra, H. B. Meerwaldt, and G. A. Steele, Nat. Comms. 5, 5819 (2014).