Properties of massive stars in four clusters of the VVV survey 111Based on observations with ISAAC/VLT/ESO (programme 087.D-0341A), New Technology Telescope at ESO/La Silla Observatory (programme 087.D-0490A), VVV ESO Large Survey (programme 179.B-2002) and with SOAR (programme CN2012A-616).
Abstract
The evolution of massive stars is only partly understood. Observational constraints can be obtained from the study of massive stars located in young massive clusters. The ESO Public Survey “VISTA Variables in the Vía Lácteá (VVV)” discovered several new clusters hosting massive stars. We present an analysis of massive stars in four of these new clusters. Our aim is to provide constraints on stellar evolution and to better understand the relation between different types of massive stars. We use the radiative transfer code CMFGEN to analyse K-band spectra of twelve stars with spectral types ranging from O and B to WN and WC. We derive the stellar parameters of all targets as well as surface abundances for a subset of them. In the Hertzsprung-Russell diagram, the Wolf-Rayet stars are more luminous or hotter than the O stars. From the log(C/N) – log(C/He) diagram, we show quantitatively that WN stars are more chemically evolved than O stars, WC stars being more evolved than WN stars. Mass loss rates among Wolf-Rayet stars are a factor of 10 larger than for O stars, in agreement with previous findings.
keywords:
Galaxy: open clusters and associations - stars: massive - stars: Wolf-Rayet1 Introduction
Through their powerful stellar winds, their strong UV radiation field and their violent end of life as supernova explosion, massive stars play a key role in the ecology and in the structure of the galaxies. They are major agents of galactic chemical enrichment and they give birth to new generations of stars by triggering star formation through their feedback effects (Deharveng et al., 2005).
Nevertheless, even-though their global evolution scheme as a function of initial mass is known (e.g. Crowther, 2007), the details are not well understood. At solar metallicity O-type stars with an initial mass above 40-60 M⊙ evolve into H-rich WN stars, and Luminous Blue Variables (LBV), before turning into H-poor WN stars and finally WC stars (Crowther, 2007). For O-type stars with lower initial masses, the H-rich WN and LBV phases are replaced by a blue and a red supergiant phase, respectively. But the detailed evolutionary path of a star born with a given mass is not accurately determined. Indeed, numerous physical effects (rotation, mass loss rate, magnetic field, binarity) strongly impact the internal structure of massive stars and thus their evolution. Evolutionary calculations allow to study these effects and predict the life and death of massive stars. But such calculations rely on various assumptions (e.g. Martins & Palacios, 2013).
In this context, the study of young massive clusters containing WR stars is a key to understand the detailed evolution of massive stars. Indeed, if one assumes coeval star formation in massive clusters, the comparison of evolved and main sequence stars allow us to constrain the nature of the most massive and evolved objects (their mass being higher than main sequence objects still present in the cluster, since more massive stars live shorter). For instance Martins et al. (2007) showed that in the central cluster of the Galaxy, direct connections between O-type and WR stars could be established. More important, the identification of main sequence O-type stars is a crucial piece of information: it shows the position of the turn-off of the entire population, providing constraints on the age (e.g. Paumard et al., 2006) and consequently an upper limit on the main sequence life time of the WR’s progenitors. The presence of red supergiants and WR star(s) in the same cluster constraint the link between hot and cool massive stars, and the evolutionary sequence between red supergiants and WR stars – Westerlund 1 (Clark et al., 2005) and central cluster (Paumard et al., 2014).
Because they are rare, far away and thus located behind lots of dust, young massive clusters cannot be observed at UV and optical bands where extinction is too strong. The infrared (IR) VISTA Variables in the Vía Láctea (VVV) survey (Minniti et al., 2010; Saito et al., 2012) provides hundreds of embedded clusters near-infrared photometry of tens of embedded clusters (Borissova et al., 2011, 2014A; Solin et al., 2014; Barbá et al., 2015). Borissova et al. (2011) discovered 96 new open clusters and stellar groups in the Galactic disk area. In this sample, six heavily-obscured clusters contain at least one WR star together with several main sequence OB stars (Chené et al., 2013). Although the census of the clusters’ population is not complete, these clusters likely sample various stellar ages and thus different phases of massive star evolution. Studying their stellar content is thus a first step towards a global characterization of stellar evolution at high masses.
In this paper, we perform a quantitative spectroscopic analysis of massive stars in four of these six clusters. We determine their fundamental parameters and, when possible, their surface abundances. In Sect. 2, we summarize the observations and data reduction. We describe in Sect. 3 our modelling tools and analysis strategy. The results are described in Sect. 4 and discussed in Sect. 5. Conclusions are given in Sect. 6.
2 Sample, observations and data reduction
The observations and data reduction were already presented in Chené et al. (2013). They are briefly summarized below.
Spectra were collected on different instruments: ISAAC on the VLT at ESO/Paranal Observatory; SofI on the NTT at ESO/La Silla Observatory; OSIRIS on the SOAR telescope. Total exposure times were typically 200-400 s for the brightest stars and 1200 s for the faintest. Details are given in Chené et al. (2013).
All reduction steps were executed using both custom-written Interactive Data Language (IDL) scripts and standard iraf4 procedures. Subsequent nodding observations were subtracted from one another to remove the bias level and sky emission lines. Flat fielding, spectrum extraction and wavelength calibration of all spectra were done in the usual way using iraf. Calibration lamp spectra (helium-argon and neon for OSIRIS, xenon-neon for SofI and ISAAC) taken at the beginning of each night were used for wavelength calibration. Correction for atmospheric absorption was done using the iraf task telluric. Finally, all spectra were rectified using a low-order polynomial fit to a wavelength interval that was assumed to be pure continuum, i.e. where no absorption or emission lines were observed nor expected. Due to some problems with the data, the ISAAC pipeline could not be used. A manual reduction was done. More details on the problems and solutions adopted are detailed in Chené et al. (2013).
| ID | R.A. | Dec | Sp. Typ. | MK | ||||||
| (J2000) | (J2000) | |||||||||
| VVV CL009 (d= 5 1 kpc) | ||||||||||
| 5 | 11:56:03.07 | –63:18:54.63 | 11.87 | 11.31 | 11.04 | O8–9V | -3.08 | |||
| 6 | 11:56:03.78 | –63:18:54.44 | 10.55 | 9.93 | 9.65 | OIf/WN7 | -4.51 | |||
| 8 | 11:56:04.38 | –63:18:54.44 | 12.14 | 11.59 | 11.34 | O8–9V | -2.76 | |||
| VVV CL073 (d= 4 1 kpc): | ||||||||||
| 2 | 16:30:23.73 | –48:13:04.90 | 15.40 | 12.51 | 11.08 | O4–6If+/WN9 | -4.65 | |||
| 4 | 16:30:23.98 | –48:13:05.48 | 14.71 | 11.53 | 9.92 | WN7 | -6.09 | |||
| VVV CL074 (d= 6 1 kpc): | ||||||||||
| 1 | 16:32:05.24 | –47:49:29.13 | 16.40 | 13.53 | 12.09 | O8.5I | -4.51 | |||
| 3 | 16:32:05.46 | –47:49:28.10 | 14.72 | 11.82 | 10.17 | WN8 | -6.58 | |||
| 5 | 16:32:05.49 | –47:49:29.80 | 15.64 | 12.90 | 11.54 | O8.5I | -4.94 | |||
| 7 | 16:32:05.67 | –47:49:30.00 | 15.98 | 13.46 | 12.19 | O8.5I | -4.10 | |||
| 9 | 16:32:05.93 | –47:49:30.92 | 15.22 | 12.53 | 11.31 | O4–6If+ | -5.05 | |||
| VVV CL099 (d= 4 1 kpc): | ||||||||||
| 5 | 17:14:25.42 | –38:09:50.40 | 13.43 | 11.70 | 10.64 | WN6 | -4.17 | |||
| 7 | 17:14:25.66 | –38:09:53.72 | 11.67 | 10.06 | 9.26 | WC8 | -5.32 | |||
In Table 1 we present the observational properties of the selected stars. The classification of the different stars, based on the catalogs of Hanson et al. (1996), Hanson et al. (2005) and Figer et al. (1997), have been presented in Chené et al. (2013). They were refined for the O stars in cluster VVV CL074. We also provide the absolute K-band magnitudes. They have been computed using and (Martins & Plez, 2006) and . We checked that the resulting absolute magnitudes corresponded to the calibrations of Martins & Plez (2006) for O stars, and Rosslowe & Crowther (2013) for Wolf-Rayet (WR) stars. In one case – star VVV CL074-2 – we found a large discrepancy between the calculated and tabulated values: this WC8 star has MK=-7.67 while the average value for such objects is about -5.0 (Rosslowe & Crowther, 2013). This may be explained by the presence of dust emission contributing to the K-band flux. We noted that the line intensities for that object are quite small, favouring this interpretation. We thus decided to exclude VVV CL074-2 from our study.
Compared to the sample of Chené et al. (2013) we have also excluded VVV CL099-04. The spectrum of this star clearly shows the presence of O-type absorption lines superimposed on top of broad WN-type emission lines, hinting at a binary nature. As we do not have multi-epoch spectra we are not able to disentangle the contribution on each star on the combined spectrum. Consequently we can not perform an analysis of stellar wind parameters for this system. We did not consider VVV CL036-9, a WN6 star, since its line intensities are about 50% lower than that of normal WN6 stars (e.g. Figer et al., 1997). Test models revealed that it was not possible to reproduce both the line intensities and the absolute magnitude of the star. Borissova et al. (2014B) showed that VVV CL036-9 was surrounded by a dust shell that may explain the morphology of spectral lines.
Finally, we also excluded main sequence B stars from our sample. These stars present only one hydrogen line in the K-band (Br) from which it is not possible to derive a temperature, surface gravity and other stellar parameters. Finally we ruled out stars for which the data quality (low signal-to-noise ratio) was not sufficient to perform a spectroscopic analysis (as VVV CL011-2). As a consequence, their are no stars available for a study in two of the massive clusters presented in Chené et al. (2013) VVV CL036, and VVV CL011.
3 Spectroscopic analysis
We used the radiative transfer code CMFGEN (Hillier & Miller, 1998) to determine the stellar and wind parameters of the massive stars presented in the previous section. For a spherically-symmetric and steady-state outflow, this modeling tool calculates continuum and line formation in the non-LTE regime by solving the coupled statistical equilibrium and radiative transfer equations. The main input parameters are: the effective temperature , the luminosity (or radius ), the mass (or surface gravity), the mass-loss rate , the wind terminal velocity as well as the exponent of the wind-velocity slope (the so-called parameter, set to 1.0 in our calculations), and the abundances of individual elements. We have used the following elements in our calculations: H, He, C, N, O, Ne, Si, S, Fe, Ni. A total of 6215 energy levels (treated using a super-level approach) and about 150 000 transitions were used in our models. The reference solar abundances were adopted from Grevesse et al. (2010). Finally, wind clumping (Eversberg et al., 1998; Bouret et al., 2005; Puls et al., 2008) was implemented as follows:
| (1) |
where is the volume filling factor, is the value of at the top of the atmosphere, is the velocity of the wind and is the velocity where the wind become inhomogeneous. We adopted and km s-1 in our calculations.
Once the atmosphere model was converged, a formal solution of the radiative transfer equation was performed to produce the emergent spectrum. In that step, detailed line profiles including Stark broadening were taken into account. Synthetic spectra were subsequently compared to the observations to determine the main parameters. Using spectral lines listed in Table 2, we proceeded as follows:
-
1.
Effective temperature: was determined from the ratio of the line strength of two successive ionization levels of a given ion. In the the infrared band, we used He i and He ii lines (see Tab. 2). We excluded He i 2.058 m from the analysis because of its sensitivity to many effects (Najarro et al., 2006). In addition to which is defined as the temperature of the star where the Rosseland optical depth equals 2/3, we determined as the temperature where the Rosseland optical depth is equal to 20. At these optical depth, the structure of the star corresponds to a quasi hydrostatic layer of the atmosphere, which is more similar to the outer radius of evolutionary models. In the case of O-type stars, the value of and are very close. But in for WR stars, which have dense winds and a large atmosphere, the difference between the two values can reach few thousand of degrees. The typical uncertainty of our measurements is 2000 to 3000 K.
- 2.
-
3.
Mass loss rate: was determined from the strength of the emission of Brγ and the helium lines. A change of leads to a general increase of the emission in all lines, while an increase of He/H strengthens the He lines and weakens Brγ. The uncertainty on , all other parameters being held fixed, is about 0.2 dex.
-
4.
Wind terminal velocity : was determined from the width of Brγ when it is in strong emission and from the extend of the absorption dip of the P-Cygni profile of He i 2.058 m. For the latter indicator, this is a direct measure. The width of Brγ does not give direct access to , but the higher the terminal velocity, the broader Brγ. Hence, models with high produce wider emission lines formed in the wind. When none of these indicators could be used (Brγ in absorption; He i 2.058 m contaminated by nebular emission), we simply adopted (Lamers et al., 1995), being the escape velocity.
-
5.
Surface abundances: the ratio He/H was obtained from the ratio of the strength of Br and helium lines in emission line stars. Otherwise, it was set to 0.1. Carbon and nitrogen lines (listed in Table 2) were sometimes clearly detected. In that case, they were used to constrain the surface abundances, with a typical uncertainty of 70%.
We adopted representative values of the surface gravity since the determination of was not feasible with our spectra. In our analysis we assumed km.s-1. The resolution of the spectra and their signal to noise ratio do not allow us to use a Fourier transform method to determine more precisely the rotational velocity of our stars. Our synthetic spectra are also convolved with the instrumental resolution of the observed spectra.
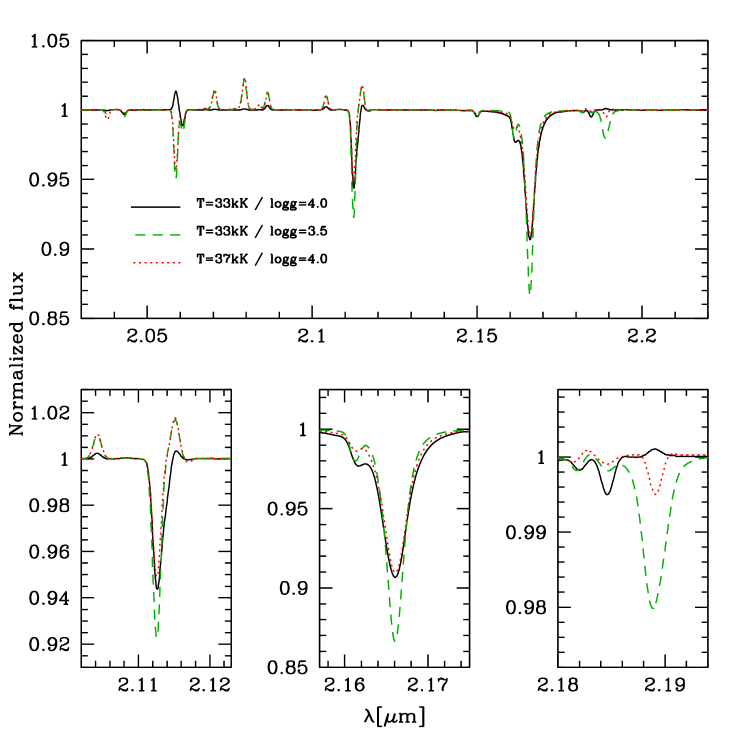
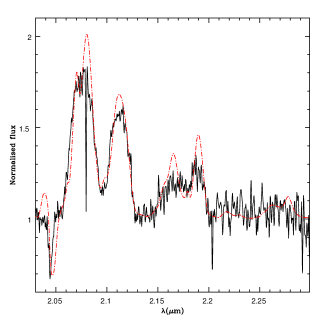
We stress that even for the relatively low spectral resolution of our data, the determination of stellar parameters is possible. For Wolf-Rayet stars, the line width does not require higher resolution. For O stars, Fig. 1 shows that the effects of and variations are clearly detected at R=2500. In particular, the He ii 2.189m line varies significantly over the range of sampled by the OB stars of the present study, ensuring a relatively safe determination.
| (m) | Ion | (m) | Ion | (m) | Ion |
|---|---|---|---|---|---|
| 2.0706 | C iv | 2.1155 | N iii | 2.1891 | He ii |
| 2.0802 | C iv | 2.1614 | He i | 2.2471 | N iii |
| 2.0842 | C iv | 2.1647 | He i | 2.2471 | N iii |
| 2.1126 | He i | 2.1652 | He ii | 2.3142 | He ii |
| 2.1138 | He i | 2.1661 | H i | 2.3470 | He ii |
| 2.1146 | C iii |
4 Results
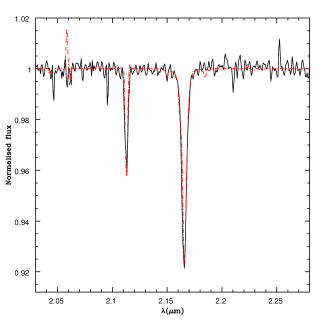
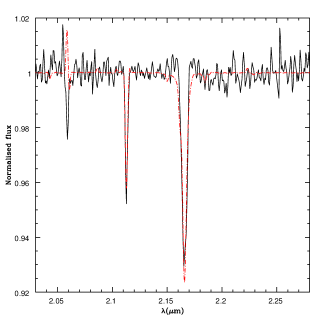
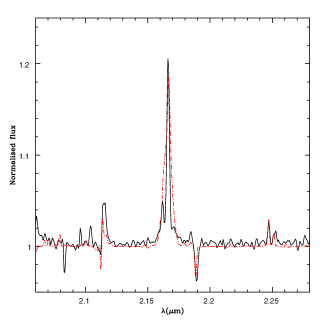
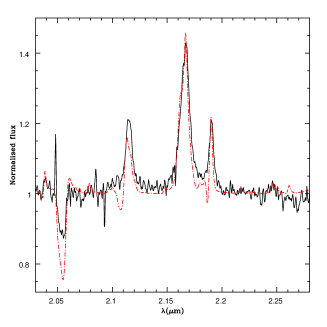
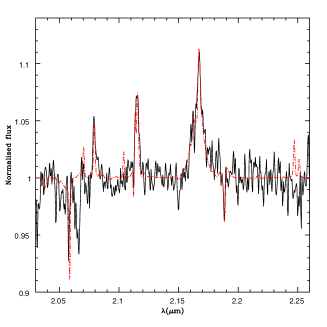
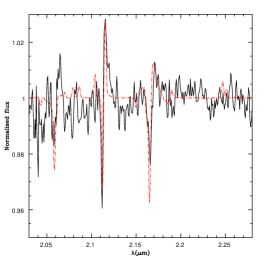
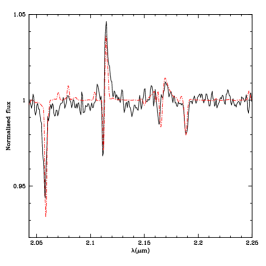
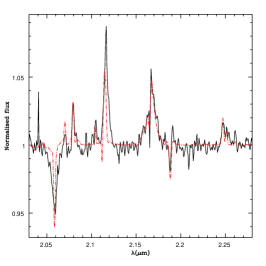
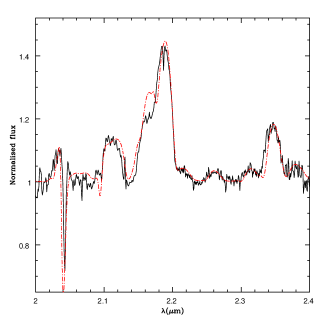
Our results are presented in Table 3. The best fits of the near-infrared spectra are shown in the Fig. 2, 3, 4 and 5. In the following we present a short description of the results for each cluster.
4.1 VVV CL009 cluster
Three stars have been analyzed in this cluster: VVV CL009-5 and VVV CL009-8 are classified as O8-9V and VVV CL009-6 as OIf/WN7.
Concerning VVV CL009-6, a fit of moderate quality is obtained (see Fig. 2, right panel). Fitting the narrow and relatively strong emission lines requires a moderate terminal velocity and a quite high mass loss rate (see Table 3). We suspect that part of the emission observed in Br is actually due to residual nebular emission. The mass loss rate we determine, mainly based on Br, should thus be regarded as an upper limit. The N iii doublet at 2.24m is clearly detected and allows to derive a high nitrogen abundance. An upper limit on the carbon content is obtained from the absence of C iv emission at 2.04-2.08m.
The observed spectra of the two O dwarfs are very similar. Our models reproduce the observed spectra quite well (Fig. 2 left and central panel). In both cases, the intensity and profile of Br are well accounted for, as well as the 2.11m line complex. We found very similar effective temperatures and mass loss rates for both stars. As no carbon nor nitrogen line is visible in the spectra we have assumed solar abundances.
| Star | ST | T∗ | log(L/L⊙) | log() | H | He | C | N | |||
| [kK] | [kK] | [km s-1] | [] | [] | |||||||
| VVV CL009-5 | O8-9V | 32.1 | 32.0 | 4.00∗ | 4.68 0.12 | -7.0* | 2735* | 0.70* | 0.28* | - | - |
| VVV CL009-6 | OIf/WN7 | 36.0 | 34.0 | 3.25∗ | 5.25 0.11 | -5.8 | 1200* | 0.70 | 0.28 | 0.9 | 4.0 |
| VVV CL009-8 | O8-9V | 32.1 | 32.0 | 4.00∗ | 4.55 0.12 | -7.0* | 2735* | 0.70* | 0.28* | - | - |
| VVV CL073-2 | O4-6If+/WN9 | 35.4 | 34.0 | 3.30∗ | 5.30 0.11 | -5.7 | 2000 | 0.70 | 0.28 | 4.0 | 5.0 |
| VVV CL073-4 | WN7 | 42.2 | 34.0 | 2.90∗ | 5.70 0.11 | -4.8 | 1400 | 0.26 | 0.73 | 3 | 5 |
| VVV CL074-1 | O8.5I | 31.3 | 31.0 | 3.50∗ | 5.21 0.12 | -6.0 | 2000 | 0.70 | 0.28 | 30 | 8.0 |
| VVV CL074-3 | WN8 | 32.4 | 31.0 | 3.50∗ | 5.70 0.13 | -4.7 | 600 | 0.13 | 0.85 | 1.3 | 11.9 |
| VVV CL074-5 | O8.5I | 33.3 | 33.0 | 3.50∗ | 5.44 0.12 | -5.8 | 2000 | 0.70 | 0.28 | 4 | 4 |
| VVV CL074-7 | O8.5I | 33.4 | 33.0 | 3.50∗ | 5.11 0.12 | -5.9 | 2000 | 0.70 | 0.28 | 4 | 2 |
| VVV CL074-9 | O4-6If+ | 34.4 | 34.0 | 3.50 | 5.52 0.11 | -5.7 | 2000 | 0.70 | 0.28 | 8 | 7 |
| VVV CL099-5 | WN6 | 62.1 | 51.2 | 4.00∗ | 5.10 0.10 | -4.6 | 2750 | 0.00 | 0.96 | 0.6 | 10 |
| VVV CL099-7 | WC8 | 47.4 | 45.1 | 3.50∗ | 5.50 0.10 | -4.7 | 2200 | 0.00 | 0.86 | 1300 | 0.2 |
-
1.
* adopted.
-
2.
Abundances are given in mass fraction.
4.2 VVV CL073 cluster
We have analyzed the WN7 star VVV CL073-4 and O4-6f+/WN9 object VVV CL073-2. A good fit of the observed spectra was obtained (see Fig. 3). For both stars, the ratio of the He i to He ii lines is fairly well accounted for, ensuring a good temperature determination as well as reasonable constraints on the helium content. VVV CL073-4 is significantly helium enriched, as expected from its spectral class. On the other hand, fitting the helium and hydrogen spectrum of VVV CL073-2 does not require He/H different from the solar value. Both stars are depleted in carbon (only an upper limit on C/H is derived for VVV CL073-4) and enriched in nitrogen. The mass loss rate of the WN7 star is much higher than that of the O4-6f+/WN9. Overall, VVV CL073-4 appears to be in a more advanced evolutionary state than VVV CL073-2.
4.3 VVV CL074 cluster
This cluster contains the largest number of massive stars with good spectroscopic data. We determined the stellar parameters of one WN8, one O4-6If+ and three O8.5I stars.
The spectra of the three O8.5I are very similar. For each of them, our fits reproduce the different H and He lines present in the K band (Fig. 4 top panel). The small differences in the He i/He ii ratio translate into differences of few thousands of Kelvin in their effective temperature. The different intensity of Br also revealed slight differences in mass loss rates. Upper limits in the carbon content could be obtained from the strength of the C iv lines. The nitrogen doublet at 2.24m provided indications of nitrogen enrichment.
Concerning the O4-6If+ star, the quality of the fit is good. Most of the lines are reasonably well reproduced. A rather strong mass loss rate explains the emission of Br. We found a carbon depletion and a strong nitrogen enrichment.
The spectrum of the WN8 star is well fitted by our best model. The only exception is the He i 2.058m line which is known to depend on details of the modelling and atomic physics (Najarro et al., 1997, 2006; Martins et al., 2007). The strong He i emission lines dominate the spectrum due to a large helium content and a strong mass loss rate. The presence of N iii lines indicates nitrogen enrichment. The absence of carbon lines is a sign of carbon depletion. The width of the emission lines indicates a low terminal velocity.
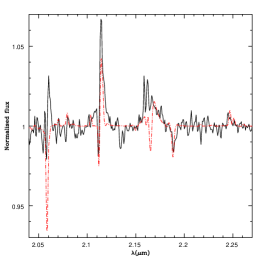
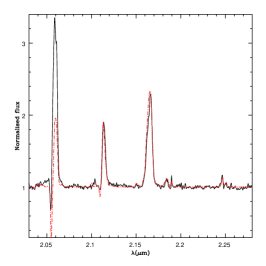
4.4 VVV CL099 cluster
A WN6 star (VVV CL099-5) and a WC8 star (VVV CL099-7) have been detected in this cluster. Our best fit models are presented in Fig. 5.
Concerning the WN6 star, our best fit model provides a very good match to the observed spectrum. We observe very intense and broad emission lines of He i, He ii and broad N iii lines. These different lines have been used to determine the effective temperature, a strong mass loss rate and high terminal velocity, and a strong nitrogen enrichment.
In the case of the WC8 star, our fit is reasonable, although the intensity of the helium lines around 2.2 m is still a little high. Reducing their intensity requires to reduce the luminosity and/or the mass loss rate, which translates in a too large absolute magnitude. Reducing the helium content does not help either. From the c iii and c iv lines, we found a significant carbon enrichment consistent with the spectral type of the star.
5 Discussion
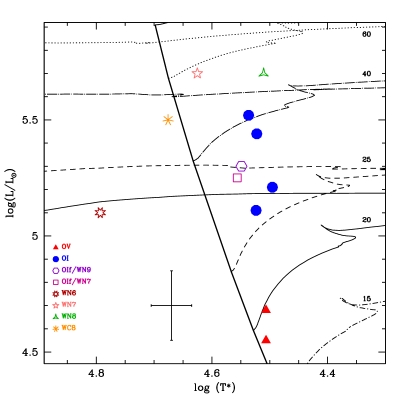
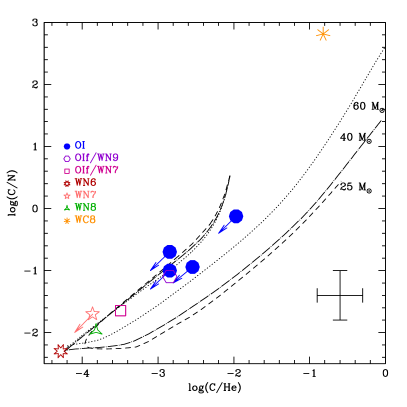
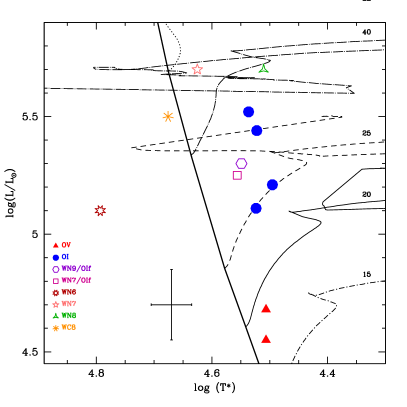
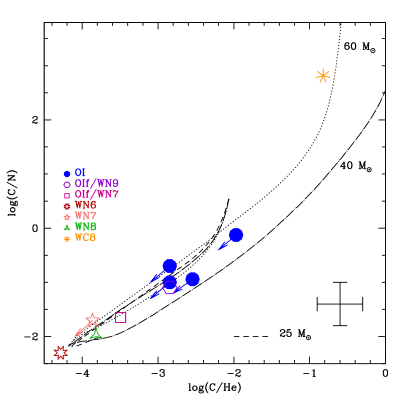
Given the small number of sources per cluster, we have grouped all stars in the same HR diagram and log(C/N) – log(C/He) diagram (Fig. 6). We thus discuss our results regardless of the cluster. We show these diagrams with the evolutionary tracks of Chieffi & Limongi (2013) and Ekström et al. (2012).
In the HR diagram, the two O dwarfs are located at relatively low luminosity, close to the zero-age main sequence (ZAMS). The O supergiants are more luminous and also farther away from the ZAMS. They are actually close to the terminal-age main sequence. Our results thus confirm the trend expected from spectral types (supergiants are more evolved in the HR diagram than dwarfs). The O dwarfs have initial masses in the range 15-20 M⊙ while the O supergiants are more massive (25-40 M⊙). In the abundance diagram (right panels of Fig. 6), the O supergiants are located close to (but not exactly at) the starting point of the evolutionary tracks, indicating that they are chemically little evolved (compared to other stars, see below).
The two objects with a transition classification OIf/WN (VVV CL009-6 and VVV CL073-2) are located at the same place as the other O supergiants in the HR diagram. Their transition classification is justified by the strength of their emission lines. Their mass loss rates are also similar to those of O supergiants. In the log(C/N) versus log(C/He) diagram, one transition object is close to the O supergiants while the other is slightly more evolved. One may suspect that these transition objects are 25 M⊙ stars having evolved to the red part of the HRD and now moving back to the blue. But at their position in the HR diagram, the 25 M⊙ track of Chieffi & Limongi (2013) predicts a significant helium enrichment (Y=0.43) which is not consistent with our determinations. We thus favor the interpretation that VVV CL009-6 and VVV CL073-2 are normal O supergiants perhaps, in one case, slightly more evolved than O supergiants.
The four Wolf-Rayet stars of our sample occupy different regions of the HR diagram and of the log(C/N) - log(C/He) diagram. They are more luminous or hotter than the O stars. A higher luminosity is indicative of a higher initial mass (40-60 M⊙ for the WN7 and WN8 stars according to Chieffi & Limongi 2013; 40 M⊙ according to Ekström et al. 2012). The WN6 star (VVV CL099-5) can be explained by the 20 and 25 M⊙ tracks of Chieffi & Limongi (2013). However, no model from the grid of Ekström et al. (2012) is able to account for the temperature and luminosity of VVV CL099-5. The WC8 star is probably the descendent of an O star with an initial mass between 25 and 40 M⊙ (depending on the set of tracks).
In the log(C/N) – log(C/He) diagram, all WN stars are located in the lower left corner, where nitrogen/helium enrichment and carbon depletion are the strongest. The position of the WN stars in this diagram is well reproduced by the evolutionary models of Chieffi & Limongi (2013) and Ekström et al. (2012). We note that evolutionary tracks with different initial masses follow the same path in the log(C/N) – log(C/He) diagram, at least in the lower left part. This indicates that CNO equilibrium has been reached and that we see its products at the surface of the stars. This is independent of the mixing processes (and their dependence on initial mass) and of the numerics of the code used to produce the tracks (the tracks from Chieffi & Limongi 2013 and Ekström et al. 2012 predict consistent evolution).
The WC8 star is located at the extreme opposite of the log(C/N) - log(C/He) diagram, where carbon enrichment is very strong. Our results thus indicate that WC stars are in a more advanced state of evolution than WN stars of type WN6 to WN8 (see also Martins et al., 2007). The Wolf-Rayet stars of our sample are also more chemically evolved than O-type stars. These results confirm the predictions of evolutionary models: WN stars show products of strong CNO processing; they are more chemically evolved than O supergiants. The WC star shows the products of helium burning, with a high carbon content. It is thus in a more advanced state of evolution than the WN stars.
Inspection of Table 3 reveals that the mass loss rates of the Wolf-Rayet stars are on average 10 times higher than those of O stars. Indeed, we find log() between -4.8 and -4.6 for the former, while for the latter the values are between -5.7 and -6.0. Even with relatively large uncertainties in our determinations, the difference is significant. It is also consistent with what is usually found for massive stars. Our mass loss rates are in very good agreement with the average values reported by Crowther (2007) : = M⊙ yr-1 for WN6-8 stars. Similarly, the mass loss rates reported by Hamann et al. (2006) for late-type WN stars in the luminosity range 5.6 5.8 are consistent with our measurements (see their Fig. 6). Mass loss rates for Galactic O stars with luminosities around L⊙ are usually close to M⊙ yr-1 (Mokiem et al., 2005), similar to what we find.
6 Conclusion
We have presented the analysis of massive stars in four young massive clusters recently discovered by the VVV survey. Based on near-infrared spectroscopy, we have determined the fundamental parameters of twelve stars with various spectral types: O dwarfs, O supergiants, WN and WC stars. Atmosphere models computed with the code CMFGEN have been used. We have also determined surface abundances (H, He, C and O) for a sub-set of these stars. We have shown that the Wolf-Rayet stars are more chemically evolved than the O supergiants, with a clear sequence of chemical enrichment when moving from O supergiants to WN and WC8 stars. Mass loss rates among Wolf-Rayet stars are a factor of 10 larger than for O stars, in agreement with previous findings.
The observation and subsequent analysis of additional targets in these clusters will help identify the main sequence, and thus the clusters’ turn-off and detailed evolutionary sequence. This is crucial to place constraints on the clusters’ ages and thus to test quantitatively the predictions of evolutionary models.
Acknowledgements
FM and AH thank the Agence Nationale de la Recherche for financial support (grant ANR-11-JS56-0007). AH is supported by the grant 14-02385S from GA ČR. JB are supported by Ministry of Economy, Development, and Tourism’s Millennium Science Initiative through grant IC120009, awarded to The Millennium Institute of Astrophysics, MAS. J.B, RK and SR acknowledge funds from Fondecyt Regular No1120601, 1130140 and 3140605.
References
References
- Barbá et al. (2015) Barbá, R. H., Roman-Lopes, A., Nilo Castellón, J. L., et al. 2015, A&A, 581, A120
- Borissova et al. (2011) Borissova, J., Bonatto, C., Kurtev, R. et al. 2011, A&A, 532A, 131
- Borissova et al. (2014A) Borissova, J., Chené, A.-N., Ramírez Alegría, S., et al. 2014, A&A, 569, A24
- Borissova et al. (2014B) Borissova, J., Kumar, M. S. N., Amigo, P. et al., 2014, AJ, 147, 18
- Bouret et al. (2005) Bouret, J.-C., Lanz, T., & Hillier, D.J. 2005, A&A 438, 301
- Chené et al. (2012) Chené, A.-N., Borissova, J., Clarke, J. R. A., et al. 2012, A&A, 545, A54
- Chené et al. (2013) Chené, A.-N., Borissova, J., Bonatto, C., et al. 2013, A&A, 549, A98
- Chieffi & Limongi (2013) Chieffi, A., Limongi, M., 2013, ApJ, 764, 21
- Clark et al. (2005) Clark, J. S., Negueruela, I., Crowther, P. A., & Goodwin, S. P. 2005, A&A, 434, 949
- Crowther (2007) Crowther, P. A. 2007, ARA&A, 45, 177
- Crowther & Bohanann (1997) Crowther, P.A. & Bohanann 1997, A&A, 317, 532.
- Crowther & Walborn (2011) Crowther, P.A. & Walborn, N., 2011, MNRAS, 416,1311.
- Deharveng et al. (2005) Deharveng, L., Zavagno, A., & Caplan, J. 2005, A&A, 433, 565
- Ekström et al. (2012) Ekström, S., Georgy, C., Eggenberger, P., et al. 2012, A&A, 537, A146
- Eldridge (2012) Eldridge, J. J. 2012, MNRAS, 422, 794
- Eenens et al. (1991) Eenens, P. R. J., Williams, P. M., & Wade, R. 1991, MNRAS, 252, 300
- Eversberg et al. (1998) Eversberg, T., Lépine, S., & Moffat, A.F.J. 1998, ApJ 494, 799
- Figer et al. (1997) Figer, D.F., McLean, I.S., Najarro, F., 1997, ApJ, 486, 420
- Geballe et al. (2006) Geballe, T. R., Najarro, F., Rigaut, F., Roy, J.-R., 2006, ApJ 652, 370
- Grevesse et al. (2010) Grevesse, N., Asplund, M., Sauval, A. J., & Scott, P., 2010, ApSS, 328, 179
- Gray (2008) Gray, D.F. 2008, Stellar Photospheres, 2008, Cambridge University Press
- Groh et al. (2013) Groh, J. H., Meynet, G., Georgy, C., & Ekström, S. 2013, A&A, 558, A131
- Hanson et al. (2005) Hanson, M. M., Kudritzki, R.-P., Kenworthy, M. A., Puls, J., & Tokunaga, A. T. 2005, ApJs, 161, 154
- Hanson et al. (1996) Hanson, M. M., Conti, P.S., Rieke, M.J., 1996, ApJS, 107, 281
- Hamann et al. (2013) Hamann, W.-R., Todt, H., Sander, A., et al. 2013, Massive Stars: From alpha to Omega, 119
- Hamann et al. (2006) Hamann, W.-R., Gräfener, G., & Liermann, A. 2006, Stellar Evolution at Low Metallicity: Mass Loss, Explosions, Cosmology, 353, 185
- Herrero et al. (2001) Herrero, A., Puls, J., Corral, L. J., Kudritzki, R. P., & Villamariz, M. R. 2001, A&A, 366, 623
- Hillier & Miller (1998) Hillier, J., & Miller, E. 1998, ApJ, 496, 416
- Lamers et al. (1995) Lamers, H. J. G. L. M., Snow, T. P., & Lindholm, D. M. 1995, ApJ, 455, 269
- Liermann et al. (2012) Liermann, A., Hamann, W.-R., & Oskinova, L. M. 2012, A&A, 540, A14
- Martins et al. (2005) Martins, F., Schaerer, D., & Hillier, D. J. 2005, A&A, 436, 1049
- Martins & Plez (2006) Martins, F., Plez, B., 2006, A&A, 457, 637
- Martins et al. (2007) Martins, F., Genzel, R., Hillier, D. J., et al. 2007, A&A, 468, 233
- Martins et al. (2008) Martins, F., Hillier, D. J., Paumard, T., et al. 2008, A&A, 478, 219
- Martins & Palacios (2013) Martins, F., & Palacios, A. 2013, A&A, 560, A16
- Massey et al. (2000) Massey, Waterhouse, E., DeGioia-Eastwood, K., 2000, AJ, 119, 2214
- Massey et al. (2001) Massey, DeGioia-Eastwood, K., Waterhouse, E., 2001, AJ, 121, 1050
- Meynet & Maeder (2005) Meynet, G. & Maeder, A. 2005, A&A, 429, 581
- Minniti et al. (2010) Minniti, D., Lucas, P. W., Emerson, J. P., et al. 2010, New A, 15, 433
- Mokiem et al. (2005) Mokiem, M. R., de Koter, A., Puls, J. et al., 2005, A&A, 441, 711
- Najarro et al. (1997) Najarro, F., Krabbe, A., Genzel, R. et al., 1997, A&A, 325, 700
- Najarro et al. (2006) Najarro, F., Hillier, D. J., Puls, J., Lanz, T., Martins, F., 2006, A&A, 456, 659
- Paumard et al. (2006) Paumard, T., Pfuhl, O., Martins, F. et al., 2006, A&A, 568, A85
- Paumard et al. (2014) Paumard, T., Pfuhl, O., Martins, F., et al. 2014, A&A, 568, A85
- Puls et al. (2008) Puls, J., Vink, J. S., & Najarro, F. 2008, A&Ar, 16, 209
- Rosslowe & Crowther (2013) Rosslowe, C. K., & Crowther, P. A. 2013, Massive Stars: From alpha to Omega
- Saito et al. (2012) Saito, R. K., Hempel, M., Minniti, D. et al. 2012, A&A, 537A, 107
- Schnurr et al. (2008) Schnurr, O., Casoli, J., Chené, A.-N., Moffat, A. F. J., & St-Louis, N. 2008, MNRAS, 389, L38
- Solin et al. (2014) Solin, O., Haikala, L., & Ukkonen, E. 2014, A&A, 562, A115
- Vink et al. (2001) Vink, J. S., de Koter, A., & Lamers, H. J. G. L. M. 2001, A&A, 369, 574
- Weidner & Kroupa (2004) Weidner, C. & Kroupa, P. 2004, MNRAS, 348, 187
- Weidner et al. (2010) Weidner, C., Kroupa, P. & Bonnell, I. A. D. 2010, MNRAS, 401, 275