Towards an efficient perovskite visible-light active photocatalyst
Abstract
The band gap of SrTiO3 retards its photocatalytic application. Regardless narrowing the band gap of the anion doped SrTiO3, the anion doping structures have low photoconversion efficiency. The co-cation dopings are used to modify the band gap and band edges positions of SrTiO3 to enhance the photocatalyitic properties by extending the absorption to longer visible-light. Using density functional calculations with the Heyd-Scuseria-Ernzerhof (HSE06) hybrid functional for exchange-correlation, the crystal and electronic structures as well as the optical properties of the mono and codped SrTiO3 are investigated. The (Mo, Zn/Cd) and (Ta, Ga/In) codoped SrTiO3 are explored in the way to retain the semiconductor characteristics of the latter. It is found that (Ta, Ga/In) codoping does not enhance the photocatalytic activity of SrTiO3 due to its large band gap. Moreover, the position of the conduction band edge of the (Mo, Cd) monodoping impedes the photocatalytic efficiency. The obtained results indicate that (Mo, Zn) codoped SrTiO3 can potentially improve the photocatalyitic activity.
I Introduction
Designing efficient materials to minimize or exclude utilizing hazardous substances is the heart of sustainable (green) life. Hydrogen production from solar water splitting as renewable green energy resources and minimizing environmental pollution by photoreduction of carbon dioxide via photocatalysis are few examples. Although photocatalysis efficiency has been extensively studied both experimentally and theoretically for decades, finding efficient photocatalyst is still the focus of many researchers. New course of metal-oxide materials has contributed to photocatalysis. However, most of the metal-oxide photocatalysts comprise large band gap causing lack of photoactivity under visible light. For instance, the ability of perovskites to absorb the visible spectrum is limited by their optical band gaps. Consequently, many experimental efforts to reduce perovskites optical gaps by chemical doping have been made A1 ; A2 ; A3 ; A4 .
SrTiO3 as a perovskite candidate is an oxide semicoductor with a band gap of eV at room temperature. SrTiO3 can be considered as a promising photocatalyst because of its ability to split water into H2 and O2 without the application of an external electric field A5 ; A6 ; A7 ; A8 . The large band gap (3.2 eV) activates the photocatalytic properties of SrTiO3 by absorbing only UV radiation, which represents % of solar spectrum. In order to enhance the photocatalytic efficiency of SrTiO3 in the visible light region, introducing doping states into the band gap and/or narrowing the latter are the common methods. Furthermore, the doping into a semiconductor can create a new optical absorption edge which is very important in the photocatalysis process.
Many experimental and theoretical publications have been performed to develop the photocatalytic efficiency of SrTiO3 via doping in either cationic sites (mostly Ti) or the oxygen anionic site. In the band structure of SrTiO3, oxygen 2p-orbitals dominate in the valence band (VB) whereas Ti 3d-orbitals prevail in the conduction band (CB). Generally, anion doping serves mostly to modify the VB of SrTiO3 due to different p-orbital energy of the dopant material, while cation doping usually produces gap states in the forbidden region or resonates with the bottom of the CB. For anionic dopant material, the N-doping has been tackled theoretically and experimentally. N-doping increases the photocatalytic activity by introducing mid-gap states which can prevent the charge carrier mobility resulting in decreasing the photoconversion efficiency A9 ; A10 ; A11 ; A12 . Moreover, C, F, P, S and B dopings have been studied to improve the photocatalytic properties, it is found that C doping at the Ti site decreases the band gap and thus improving their photocatalytic properties A12 ; A13 ; A14 . On the other hand, cation doping using transition metals can increase the visible light activity but cannot activate water splitting such as Cr A15 ; A16 ; A8 , Mn, Ru, Rh and Pd A2 ; A17 ; A18 ; A19 . Furthermore, anion-cation, anion-anion or cation-cation codoping pairs have been used to enhance the photoresponse A10 ; A17 ; A18 ; A19 ; A20 . However, to our knowledge, all the co-cation doping studies have been performed without giving attention to SrTiO3 semiconductor characteristics.
In this contribution, designing a novel and efficient visible-light active photocatalyst (SrTiO3) employing cation codoping is inspected taking into account the following criteria: the co-cation i) should not change the SrTiO3 semiconductor characteristics, ii) does not make any significant distortion in the clean SrTiO3 crystal, iii) reduces the band gap to absorb the visible light and iv) changes the band gap edge of the CB to fulfill the redox potential requirements for water splitting. Since the electronic configuration of Ti4+ is [Ar] 3d04s0, the most convenient cation dopant should have empty or completely filled valence d-orbital, i.e. d0 or d10 electronic configuration. Four co-cation dopings have been assumed to maximize the visible light activity of the photocatalyst that are (Mo6+, Zn2+/Cd2+) and (Ta5+, Ga3+/In3+).
The manuscript is organized as follows: in section II, the methods utilized in the calculations are represented. The pristine SrTiO3 is discussed as a reference system for the rest of the calculations in section III. Moreover, section III outlines various cation monodoping collection which is the entry of different cation co-doping combinations emphasizing the band structure and its effects on the optical properties and photocatalytic activity. Finally, section IV concludes.
II Calculation Methods
The spin polarized density functional theory (DFT) calculations are performed using the projector augmented wave (PAW) pseudopotentials in the Vienna ab initio Simulations Package (VASP) code B1 ; B2 . For the exchange and correlation energy density functional, the generalized gradient approximation (GGA) B3 ; B4 in the scheme of Perdew-Bueke-Ernzerhof (PBE) B5 is utilized to get the optimzed structures. The PAW potentials with the valance electron Sr (4s2 4p6 5s2), Ti (4s2 3d2), O (2s2 2p4), Mo (5s2 4d4), Zn (4s2 3d10), Cd (5s2 4d10), Ta (6s2 5d3), Ga (4s2 4p1) and In (5s2 5p1) are employed. The wave functions are expanded in plane waves up to cutoff energy of 600 eV. A Monkhorst-Pack point mesh B6 of 8 8 8 is used for geometry optimization until the largest force on the atoms becomes smaller than 0.01 eV/Å and the tolerance of total energy reaches 10-6 eV. A 2 2 2 supercell containing 40 atoms is structured to simulate SrTiO3. The stability, the electronic structures and the optical properties are carried out using the hybrid functional Heyd-Scuseria-Ernzerhof (HSE06) B7 ; B8 ; B9 . The exchange-correlation energy in the hybrid functional (HSE06) is formulated as:
| (1) |
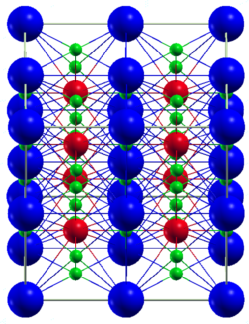
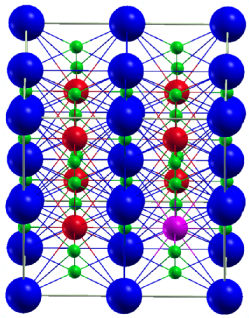
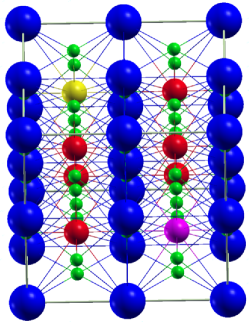
The mixing coefficient (0.28) and the screening () parameters are considered to get the closer to the experimental band gap value B10 ; B11 . A 3 3 3 kpoint in the Brioullioun zone is utilized in the HSE06 calculations. Using the frequency dependent dielectric function as implemented in VASP, the optical properties are investigated. Figure 1 illustrates the crystal structure of pristine, mono-doped, and codoped SrTiO3 which are used in this study
III Results and discussion
III.1 Pristine SrTiO3
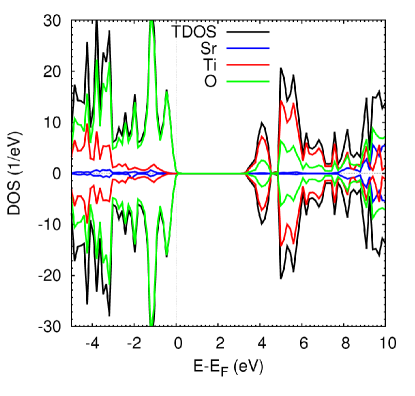
In order to study the effect of dopants on the electronic structure of SrTiO3, first the pristine SrTiO3 is addressed. The relaxed SrO and TiO bond lengths are 2.755 Å and 1.945 Å respectively, which are in good agreement with previous experimental results and theoretical calculations A1 ; A4 . The density of states (DOS) and projected density of states (PDOS) of pristine structure are depicted in Figure 2. The top of valance band is dominated by O states and the contribution of Ti states can be considered below eV which refers to the covalent bond TiO. However Ti states dominate in the bottom of conduction band and O states have good contributions in the whole range of conduction band. A small density of Sr states is observed in the whole energy range which reveals ionic interaction between Sr and TiO6 octahedron. The band gap is found to be eV which is in line with the experimental values A6 .
III.2 mono-doped SrTiO3
Mo/Ta doping
It is useful to discuss the influence of mono-doping on the SrTiO3 electronic structure to understand the co-doping effect. First a Ti atom is replaced by a Mo one in the pristine SrTiO3. The optimized structure shows that the MoO bond length ( Å) does not change significantly as compared to TiO in pristine crystal due to comparable ionic sizes of Mo6+ ( Å) and Ti4+ ( Å) C0 ; A3 ; C01 . To determine the stability of the mono-doped structures, the defect formation energy () has been calculated using the following expression:
| (2) |
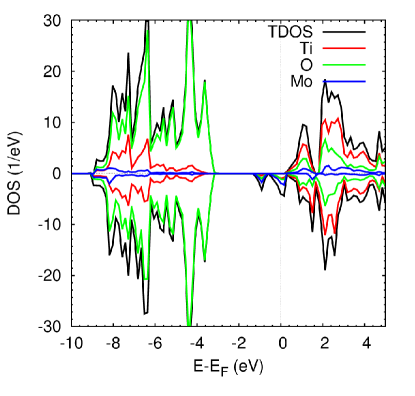
where and are the total energies of metal-doped SrTiO3 and pristine SrTiO3, respectively. The and stand for the chemical potential for Ti and dopant atom, respectively, which are assumed as the energy of one metal atom in their corresponding metal bulk structure C011 . The defect formation energy for Mo doping is found to be eV. Figure 3 (left) displays the calculated density of states (DOS) and the projected one of the Mo-doped SrTiO3, the band gap becomes eV which is less than that of the pristine structure ( eV). The Fermi energy is shifted towards the edge of the CB suggesting an n-type conducting character. This is due to the excess two electrons compiled by Mo atom (Mo is in its 6+ oxidation state). The magnetic moment of the Mo-doped SrTiO3 becomes . The mid gap states are created at eV below the conduction band. The band structure is shifted towards the low energy compared to the pristine structure and the created states arise from the contribution of the localized Mo states.
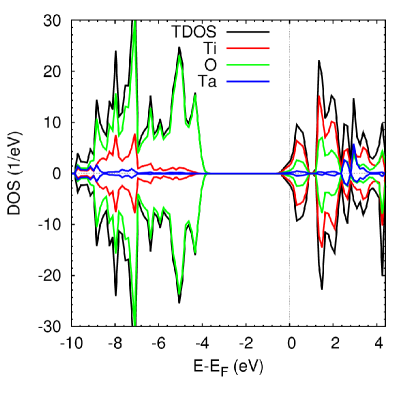
For Ta-doped structure, the bond length of TaO becomes ( Å) which is slightly larger than that of TiO due to the comparable ionic sizes of Ta5+ ( Å) and Ti4+. The calculated defect formation energy using eq. (2) for Ta-doping gives eV suggesting a more stable and lower energy cost than Mo-doped structures. The effect of Ta-doping on the electronic structure is illustrated in Figure 3 (right). The Fermi level located in the CB indicates an n-type conducting behavior (similar to Mo doping) due to the 5+ oxidation state of Ta. The band gap does not change as compared to the pristine structure. The low contribution of Ta-localized states appears in the CB but the O and Ti ones still prevail as seen in the pristine SrTiO3. Moreover, like Mo-doping, the band structure is moved towards the low energy.
Zn/Cd doping
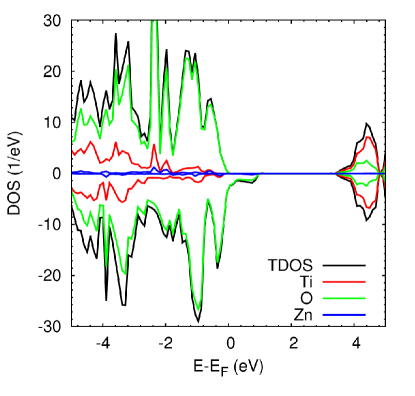
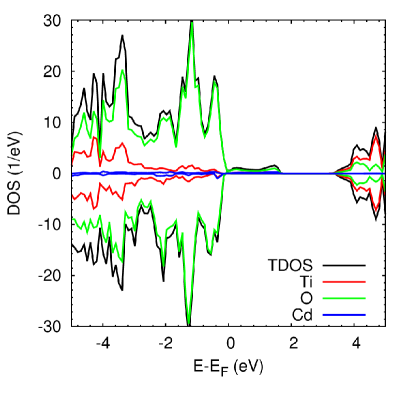
Since, the ionic size of Zn2+ ( Å) is slightly larger than that of Ti, there is a little local distortion of the crystal structure where the bond length of ZnO ( Å) becomes larger than that of TiO. The local distortion and the magnetic moment (2 ) of the structure is related to the oxidation state of Zn2+. The defect formation energy in this case is eV indicating less stablility of Zn-doped structure than Ta and Mo-doped ones. The localized Zn states contribute at the top of the valance band and the band gap becomes less than the pristine structure by eV as exhibited in Figure 4 (left). The Zn doping can experimentally improve the photocatalytic properties C1 ; C2 . In the case of Cd-doped SrTiO3, the ionic size of Cd2+ ( Å) is larger than that of Ti4+, which reflects the increasing in the bond length of CdO ( Å) compared to the bond length of TiO in the pristine structure. Cd2+ causes similar effect on the magnetic moment and distortion like Zn2+ does. The defect formation energy becomes eV. The contribution of Cd-states appears at the top of valance band with O states. This contribution of Cd-dopant material reduces the band gap to eV, see Figure 4 (right).
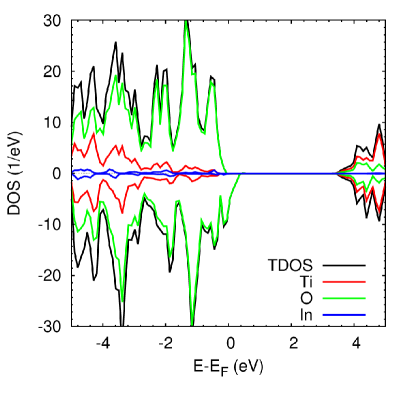
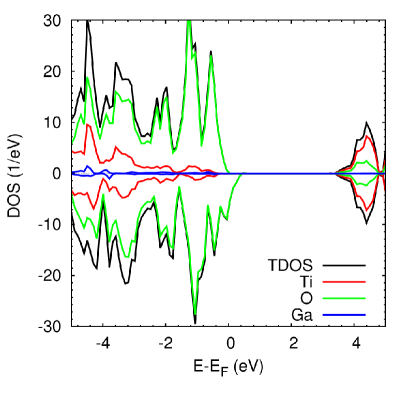
In/Ga doping
The last two single dopant atoms are In and Ga. The ionic size of In3+ ( Å) is larger than that of Ti4+. This size effect is manifested in the defect formation energy value ( eV) which is larger than Ta-doped SrTiO3. Furthermore, the bond length of InO becomes Å. The magnetic moment is 1 due to 3+ oxidation state of In. The influence of In-dopant on the electronic structure of SrTiO3 is shown in Figure 5 (right). The trivalent oxidation state for In creates a vacancy in the system and analysing the PDOS indicates that the In-states have insignificant contributions. The O states at the top of the valance band is disturbed along the spin down component and the band gap does not change compared to the pristine SrTiO3. Regarding Ga-doped SrTiO3, Ga3+ has ionic size ( Å) which is slightly larger than Ti4+. Hence, the GaO bond length ( Å) is slightly larger than TiO and the defect formation energy becomes eV. The magnetic moment and the band gap of Ga-doped SrTiO3 is very similar to In-doped one, see Figure 5 (left).
III.3 Codoped SrTiO3
(Mo, Zn/Cd) codoping
So far, the mono-doped SrTiO3 has been discussed in a bit details but the question now is whether the co-doping improves the properties of the pristine material. First, one can substantially look at the geometry and stability of the codoped material. In the case of (Mo/Zn) co-doping, both Mo and Zn dopants change the bond lengths of MoO and ZnO as compared to the corresponding ones in Mo and Zn mono-doped SrTiO3. The MoO becomes shorter ( Å) while ZnO turns out to be longer ( Å). The corresponding defect formation energy of the codoped SrTiO3 is given by:
| (3) |
where is the energy of the codoped SrTiO3 structure, and represent the chemical potential for first and second metals, respectively. The defect formation energy of the (Mo, Zn) codoped, eV, is very close to that of Zn-doped SrTiO3. Moreover, the stability of the codoped structure can be determined using the defect pair binding energy which is calculated by C03 ; C031 :
| (4) |
where and are the energies of the mono-doped first and second metals, respectively. The defect pair binding energy is calculated as eV where the positive value indicates that the codoped structure is sufficiently stable A1 .
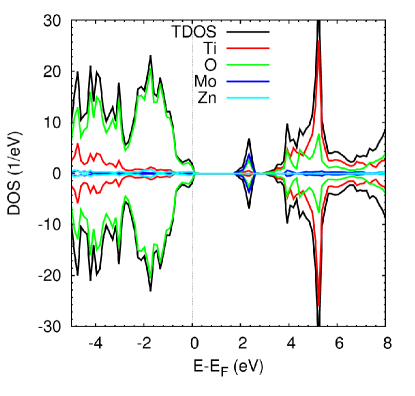
Second, it is necessary to explore how the electronic structure of SrTiO3 changes upon (Mo, Zn) co-doping. The Fermi energy is located right above the valance band, similar to the pristine structure. The band gap decreases significantly to eV as compared to the pristine SrTiO3, which allows the structure to absorb visible light. Furthermore, the band gap is similar to that of Mo-mono-doped SrTiO3. The top of the valance band consists of O and Zn states with a little contribution of Ti and Mo states. However, Mo dominates in the bottom of the conduction band with the O states. (Mo, Zn) codoped material reduces the charge carrier loss and forms a charge compensated (n-p compensated) without emerging gap states or splitting the valance band.
For (Mo, Cd) codoped SrTiO3, the bond length MoO in the codoped structure ( Å) is shorter than the corresponding
one in the Mo-mono-doped structure. Whereas, the CdO bond length in the codoped
structure ( Å) is longer than that in the Cd-mono-doped structure. The formation energy for (Mo, Cd) codoped, eV, is higher
than
that of (Mo, Zn) codoped SrTiO3 due to the large value of the formation energy of Cd. However the defect binding energy ( eV)
is lower than the corresponding one of the (Mo, Zn) co-doping.
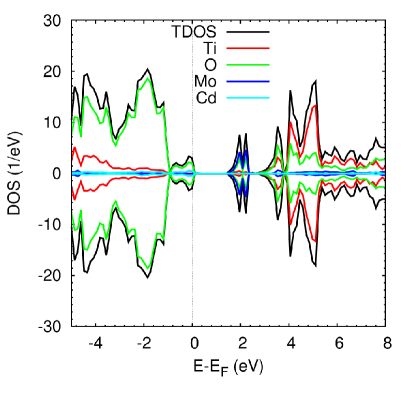
Figure 6 (right) reveals the density of states and the projected ones of the (Mo, Cd) codoped SrTiO3. The band gap becomes eV.
Cd and Ti states contribute at the top of the valance band with dominated O states. Mo and O states have good contributions
at the bottom of the conduction band with a lower contribution of the Ti states on contrast to the pristine junction where the latter
contribute at the top of
conduction band.
(Ta, In/Ga) codoping
Last but not least, (Ta, In/Ga) co-doping is explored in this subsection. The bond lengths of TaO and InO are Åand Å, respectively, which are slightly longer than the corresponding bond length in Ta and In mono-doped SrTiO3. The defect formation and pair binding energies are eV which are less than of (Mo, Zn/Cd) codoped SrTiO3. The band gap ( eV) becomes larger than the pristine structure. The In states contribute at the top of the valance band similar to Ti states but O states still dominate. The bottom of the conduction band consists of analogous contribution of the Ti and O states but lower contribution of the Ta states.
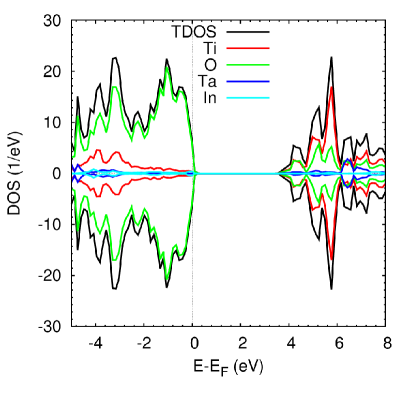
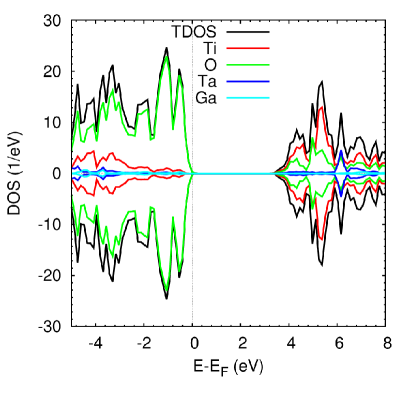
The bond lengths of TaO and GaO are Å which are a bit longer than the corresponding bond lengths in Ta and In mono-doped SrTiO3. The defect formation energy in this structure ( eV) is higher than (Ta, In) codoped analogue. However the defect pair binding energy ( eV) is lower than the (Ta, In) codoped system. The DOS of (Ta, Ga) codoped SrTiO3 shows that the band gap becomes ( eV) in line with that of (Ta, In) codoped system. The contribution of the Ga states at the top of valance band is small compared to Ti and O states. On the other hand, Ta contributes little to the bottom of the conduction band compared to Ti and O states. Ti states dominate in contrast to (Ta, In) codoped structure. Further, the band gap is larger than the pristine structure. Compared to the pristine structure, (Ta, In) and (Ta, Ga) co-doping cannot be used to extend the absorption edge to the longer-wavelength visible light. Fortunately, the gaps of the (Mo, Zn) and (Mo, Cd) codoped are smaller than the pristine SrTiO3. Zn 3d and Cd 4d are located at the top of the valance band and the Mo states prevail at the bottom of the former. Due to the movement of the conduction band bottom to the lower energy, the band gap tightens without any gap states. The mid-gap or localized states are not created due to the n-p compensated co-doping in all studied structures. Therefore, Mo together with Zn or Cd represent perfect co-doping candidates to enhance the photocatalytic properties. Since the ionic size plays an important role from the experimental point of view, the Mo6+ and Zn2+ dopants which are of comparable ionic radii to that of Ti4+ suggest appropriate co-doping materials. Notice that, the effect of dopant concentration on the electronic structure is done using 2 2 1 and 2 2 3 supercells. It is found that the behavior of DOS does not change as compared to that of 2 2 2 supercell in line with the effect of different dopant concentrations on SrTiO3 A1 ; A3 .
III.4 Optical properties
The optical absorption properties of a semiconductor photocatalyst is to a large extent linked with its electronic structure which, in turn, affect the photocatalytic activity C3 . Absorption in the visible light range is crucial for improving the photocatalytic activity of the doped SrTiO3. The optical properties are determined by the angular frequency () dependent complex dielectric function , which depends solely on the electronic structure. The imaginary part of the dielectric function, , can be calculated from the momentum matrix elements between the occupied and unoccupied states. In addition, the real part can be calculated from the imaginary part by the Kramer-Kronig relationship. The corresponding absorption spectrum, was evaluated as implemented in VASP A4 ; C4 :
| (5) |
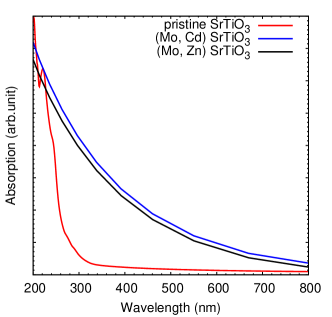
where is the optical absorption coefficient. It can be seen that the pristine SrTiO3 can only absorb the narrow UV light (360 nm) and shows no absorption activity in the visible light region, Figure 8. The calculated optical absorption spectra for (Mo, Cd) and (Mo, Zn) codoped SrTiO3 show absorption activity at the visible-light region in the range (450-800 nm). The optical absorption of compensated (Mo, Cd) codoped SrTiO3 exhibits much more favorable visible-light absorption than compensated (Mo,Zn) codoped system, these results agrees with the earlier discussion
III.5 Photocatalytic activity
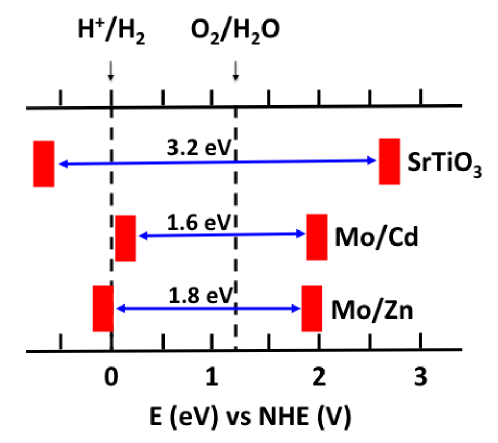
In this section, the desired thermodynamic conditions for the water splitting photocatalyst is discussed. The most influential criterion for the water splitting photocatalysis is the position of the relative band edges, i.e. the VB edge should lie below the H2O/O2 oxidation level and the CB edge is located above the H+/H2 reduction level. Assuming fixed VB edge position, the closer the CB edge to the H+/H2 reduction level is, the better the photocatalytic efficiency becomes as this reduces the band gap. Figure 9 shows that the calculated band edges positions of the pristine SrTiO3 reveal water splitting photocatalytic activity. However, the large band gap does not promote the visible light absorption. In the case of (Mo, Cd) and (Mo, Zn) codoped SrTiO3, The valance band edge for both codoped SrTiO3 are located below the H2O/O2 oxidation level indicating their ability to release O2 in water splitting process. For conduction band edge, (Mo, Cd) codoped SrTiO3 lies below the H+/H2 reduction level but, in the case of (Mo, Zn) dopant, it is very close to the reduction level suggesting that the former may not be capable of releasing hydrogen in the water splitting. Hence, the codoping of (Mo, Zn) can be considered a good photocatalytic material.
IV Conclusion
Density functional theory is used to examine the structure, stability, electronic structure and optical properties of the co-catoinic doping of SrTiO3 as well as those of monodopants. Based on the HSE hybrid exchange correlation functional, the calculated band gap of pristine SrTiO3 is in good agreement with the experimental finding. Although the Mo and Ta monodopants decrease the band gap of the pristine SrTiO3, the semiconductor properties are changed which change the characteristics of the structure. The (Ta, In/Ga) codoping is energetically more favorable than (Mo, Zn/Cd) system. However, codoping with (Ta, In/Ga) does not improve the photocatalyitic properties due to the larger band gap as compared to the pristine system. (Mo, Zn/Cd) codoping reduces the band gap of SrTiO3. Since Mo and Zn comprise comparable inoic sizes with Ti, the (Mo, Zn/Cd) co-cationic doping diminishes the band gap of pristine SrTiO3 without emerging any undesirable mid-gap states. (Mo, Cd) co-cationic doping has less band gap than (Mo, Zn) one but the CB edge position prevents (Mo, Cd) SrTiO3 of being a photocatalyst for water splitting. In this case, the bottom of the conduction band is shifted downwards while the valance band remains unaffected. Eventually, the calculations of the absorption coefficient verified the improvement of the (Mo, Zn) codoped SrTiO3 water splitting photocatalytic properties.
References
- (1) B. Modak, K. Srinivasu, and S. K. Ghosh, RSC Adv. 4, 45703 (2014).
- (2) H.-C. Chen, C.-W. Huang, J. C. S. Wu, and S.-T. Lin, J. Phys. Chem. C 116, 7897 (2012).
- (3) B. Modak, K. Srinivasu, and S. K. Ghosh, Phys. Chem. Chem. Phys 16, 24527 (2014).
- (4) W. Wei, Y. Dai, M. Guo, L. Yu, H. Jin, S. Han, and B. Huang, Phys. Chem. Chem. Phys 12, 7612 (2010).
- (5) Y. Xu and M. A. A. Schoonen, Am. Mineral. 85, 543 (2000).
- (6) M. Cardona, Phys. Rev. 140, A651 (1965).
- (7) H. Yu, S. Ouyang, S. Yan, Z. Li, T. Yu and Z. Zou, J. Mater. Chem. 21, 11347 (2011).
- (8) D. Wang, J. Ye, T. Kako, and T. Kimura, J. Phys. Chem. B 110, 15824 (2006).
- (9) J. Wang, S. Yin, M. Komatsu, Q. Zhang, F. Saito and T. Sato, J. Mater. Chem. 13, 2348 (2003).
- (10) P. Liu, J. Nisar, B. Pathak and R. Ahuja, Int. J. Hydrogen Energy 37, 11611 (2012).
- (11) J. Wang, S. Yin, M. Komatsu, Q. Zhang, F. Saito and T. Sato, J. Photochem. Photobiol. A 165, 149 (2004).
- (12) C. Zhang, Y. Jia, Y. Jing, Y. Yao, J. Ma and J. Sun, Comput. Mater. Sci. 79, 69 (2013).
- (13) H. W. Kang and S. B. Park, Chem. Eng. Sci. 100, 384 (2013).
- (14) N. Li and K. L. Yao, AIP Adv. 2, 032135 (2012).
- (15) W. A4, Y. Dai, H. Jin, and B. Huang, J. Phys. D 42, 055401 (2009).
- (16) J. W. Liu, G. Chen, Z. H. Li, and Z. G. Zhang, J. Solid State Chem. 179, 3704 (2006).
- (17) H. Irie, Y. Maruyama and K. Hashimoto, J. Phys. Chem. C 111, 1847 (2007).
- (18) R. Konta, T. Ishii, H. Kato and A. Kudo, J. Phys. Chem. B 108, 8992 (2004).
- (19) S. W. Bae, P. H. Borse and J. S. Lee, Appl. Phys. Lett. 92, 104107 (2008).
- (20) Y. Y. Mi, S. J. Wang, J. W. Chai, J. S. Pan, C. H. A. Huan, Y. P. Feng and C. K. Ong, Appl. Phys. Lett. 89, 231922 (2006).
- (21) G. Kresse and J. Hafner, Phys. Rev. B 47, 558 (1993).
- (22) G. Kresse and J. Furthmuller, Phys. Rev. B 54, 11169 (1996).
- (23) A. D. Becke, Phys. Rev. A 38, 3098 (1988).
- (24) J. P. Perdew, Phys. Rev. B 33, 8822 (1986).
- (25) J. P. Perdew, K. Burke, and M. Ernzerhof, Phys. Rev. Lett. 77, 3865 (1996).
- (26) H. J. Monkhorst and J. D. Pack, Phys. Rev. B: Solid State 13, 5188 (1976).
- (27) J. Heyd, G. E. Scuseria, and M. Ernzerhof, J. Chem. Phys. 118, 8207 (2003).
- (28) J. Paier, M. Marsman, K. Hummer, G. Kress, I. C. Gerber, and J. G. Angyan, J. Chem. Phys. 125, 249901 (2006).
- (29) J. Heyd, G. E. Scuseria, and M. Ernzerhof, J. Chem. Phys. 124, 219906 (2006).
- (30) P. Reunchan, N. Umezawa, S. Ouyang, and J. Ye, Phys. Chem. Chem. Phys. 14, 1876 (2012).
- (31) P. Reunchan, S. Ouyang, N. Umezawa, H. Xu, Y. Zhang, and J. Ye, J. Mater. Chem. A 1, 4221 (2013).
- (32) CRC Handbook of Chemistry and Physics, 87 th ed., edited by D. R. Lide (Taylor & Francis, London, 2006).
- (33) R. D. Shannon, Acta Crystallogr., Sect. A: Cryst. Phys., Diffr., Theor. Gen. Cryst. 32, 751 (1976).
- (34) Q. Meng, T. Wang, E. Liu, X. Ma, Q. Ge, and J. Gong, Phys. Chem. Chem. Phys. 15, 9549 (2013).
- (35) G.-Y. Wang, Y. Qin, J. Cheng, and Y.-j. Wang, Journal of Fuel Chemistry and Technology 38, 502 (2010).
- (36) J.-P. Zou, L.-Z. Zhang, S.L. Luo, L.-H. Leng, X.-B. Luo, M.-J. Zhang, Y. Luo, G.-C. Guo, International Journal of Hydrogen Energy 37, 17068 (2012).
- (37) R. Long and N. J. English, Chem. Mater. 22, 1616 (2010).
- (38) W.-J. Shi and S.-J. Xiong, Phys. Rev. B 84, 205210 (2011).
- (39) L. M. Sun, Y. Qi, C. J. Jia, and Z. Jin, W. L. Fan, Nanoscale 6, 2649 (2014).
- (40) S. Saha, T. P. Sinha, and A. Mookerjee, Phys. Rev. B 62, 8828 (2000).