Computational investigation of structure, dynamics and nucleation kinetics of a family of modified Stillinger-Weber model fluids in bulk and free-standing thin films
Abstract
In recent decades, computer simulations have found increasingly widespread use as powerful tools of studying phase transitions in wide variety of systems. In the particular and very important case of aqueous systems, the commonly used force-fields tend to offer quite different predictions with respect to a wide range of thermodynamic and kinetic properties, including the ease of ice nucleation, the propensity to freeze at a vapor-liquid interface, and the existence of a liquid-liquid phase transition. It is thus of fundamental and practical interest to understand how different features of a given water model affect its thermodynamic and kinetic properties. In this work, we use the forward-flux sampling technique to study the crystallization kinetics of a family of modified Stillinger-Weber (SW) potentials with energy () and length () scales taken from the monoatomic water (mW) model, but with different tetrahedrality parameters (). By increasing from 21 to 24, we observe the nucleation rate increases by 48 orders of magnitude at a supercooling of . Using classical nucleation theory, we are able to demonstrate that this change can largely be accounted for by the increase in , the thermodynamic driving force. We also perform rate calculations in freestanding thin films of the supercooled liquid, and observe a crossover from a surface-enhanced crystallization at to a bulk-dominated crystallization for .
I Introduction
Water is one of the most ubiquitous substances on earth. In spite of its abundance and importance, however, many questions about it warrant further scrutiny. One of the most notable examples is ice nucleation, which, despite its relevance to areas such as biology and meteorology, is far from fully understood. Ice nucleation plays a very important role in the atmosphere, and its kinetics affect the modulation of solar radiation and hydrological fluxes in the atmosphere Zender and Kiehl (1994); Hegg and Baker (2009); Herbert et al. (2015). Due to the exponential dependence of nucleation rate on temperature, it is only possible to make rate measurements across narrow ranges of temperature Butorin and Skripov (1972); Anderson et al. (1980); Hagen et al. (1981); Taborek (1985); Sassen and Dodd (1988); Krämer et al. (1999); Stöckel et al. (2005); Laksmono et al. (2015), with extrapolations to other temperatures prone to large uncertainties Haji-Akbari and Debenedetti (2015). Furthermore, the microscopic time and length scales relevant to ice nucleation are not accessible to experiments. This makes obtaining mechanistic information about freezing a very challenging task with existing experimental techniques.
In the absence of such high-resolution experiments, computer simulations are attractive alternatives as, by construction, they provide a detailed microscopic perspective of the nucleation process. However, computational studies of nucleation are very challenging and for realistic molecular models of water, the direct observation of homogeneous nucleation of ice in the absence of biasing potentials and external stimuli was achieved only recently Matsumoto et al. (2002). Since then, freezing molecular dynamics (MD) trajectories have been obtained for a variety of force fields Vrbka and Jungwirth (2006, 2007); Pluhaŕová et al. (2010); Moore and Molinero (2011); Yagasaki et al. (2014). Nevertheless, the statistical nature of freezing could not be properly sampled in those studies as only a few freezing trajectories were obtained. On the other hand, there is a large body of work involving the use of biasing potentials along pre-chosen reaction coordinates to drive crystallization and map its free energy landscape. Radhakrishnan and Trout (2003); Brukhno et al. (2008); Quigley and Rodger (2008); Reinhardt and Doye (2012); Palmer et al. (2014). Despite their utility in estimating quantities such as nucleation barriers, these bias-based techniques are not suitable for studying the kinetics of nucleation as they distort the underlying dynamics of the system. An unbiased statistically relevant approach would require collecting a large number of trajectories, an undertaking that is almost impossible with regular molecular dynamics simulations of realistic molecular models of water.
A more practical alternative is to use state-of-the-art path sampling techniques that sample the reactive trajectories in a targeted manner. One such technique is forward flux sampling (FFS) Allen et al. (2006), a powerful algorithm that has been recently used for studying a wide range of first-order transitions such as hydrophobic evaporation Sharma and Debenedetti (2012), droplet coalescence Rekvig and Frenkel (2007), wetting Savoy and Escobedo (2012), magnetic switching Vogler et al. (2013), protein folding Borrero and Escobedo (2007) and crystallization Sanz et al. (2007); Li et al. (2009, 2009, 2011, 2013); Thapar and Escobedo (2014); Haji-Akbari et al. (2014); Haji-Akbari and Debenedetti (2015). Li et al. and Haji-Akbari et al. employed this technique to study the kinetics of ice nucleation for the mW coarse-grained model of water, both in the bulk Li et al. (2011); Haji-Akbari et al. (2014) and in confined geometries Li et al. (2013); Haji-Akbari et al. (2014). Recently, Haji-Akbari and Debenedetti used a coarse-grained variant of FFS to perform the first direct calculation of nucleation rate for a molecular model of water Haji-Akbari and Debenedetti (2015), in this particular case the TIP4P/Ice model Abascal et al. (2005). Galli and collaborators have also used FFS to study nucleation kinetics in other tetrahedral liquids such as Si and Ge Li et al. (2009, 2009). Since FFS yields a large number of trajectories, the statistical nature of crystallization can be studied and precise nucleation rates can been obtained. In addition, such computational studies can be used for deducing useful mechanistic information about freezing Haji-Akbari and Debenedetti (2015). They can also be utilized as a comparative tool, in order to determine the effect of a design parameter, or an external stimulus on the kinetics and mechanism of nucleation Li et al. (2009, 2009, 2013); Haji-Akbari et al. (2014).
A notable example of applying FFS as a comparative tool is the quest for determining the role of a vapor-liquid interface on freezing, a question regarded as one of the ten most important unanswered questions about ice Bartels-Rausch (2013). In a seminal paper Tabazadeh et al. (2002), Tabazadeh et al. proposed that a vapor-liquid interface will enhance the crystallization of liquids such as water that partially wet their crystal. This has steered an ongoing controversy involving both experimental Duft and Leisner (2004); Shaw et al. (2005); Ómar F. Sigurbjörnsson and Signorell (2008); Gurganus et al. (2011) and computational Vrbka and Jungwirth (2006, 2007); Pluhaŕová et al. (2010); Li et al. (2013); Haji-Akbari et al. (2014) studies. Jungwirth et al. Vrbka and Jungwirth (2006, 2007); Pluhaŕová et al. (2010) used conventional molecular dynamics simulations to study free-standing thin films of a six-site model of water Nada and van der Eerden (2003) and observed an enhancement of crystallization close to the vapor-liquid interface. They attributed this enhancement to the lack of electrostatic neutrality close to the interface, leading to the emergence of a net electric field in the subsurface region. Electric fields are known to stimulate crystallization in water Svishchev and Kusalik (1994, 1996). Subsequently, Li et al. used FFS rate calculations to demonstrate that crystallization is favored at free interfaces of the tetrahedral liquids Si and Ge Li et al. (2009, 2009). They argued that density fluctuations at the interface facilitate the crystallization of liquids that are denser than their corresponding crystals. Accordingly, they hypothesized that surface-induced crystallization would also be observed for water, which also possesses a negatively-slope melting curve. In the case of water nano-droplets simulated using the coarse-grained mW potential Li et al. (2013), however, they observed a significant reduction in the nucleation rate with respect to the bulk, an observation rationalized by the fact that those nano-droplets were subject to large Laplace pressures. Haji-Akbari et al. Haji-Akbari et al. (2014) used conventional molecular dynamics simulations, FFS and umbrella sampling to study ice nucleation in freestanding thin films of mW water that, by construction, have zero Laplace pressure. However, they observed that crystallization was suppressed at the vapor-liquid interface. They attributed their observations to the fact that the nuclei that emerge in the interfacial region are more aspherical than their bulk counterparts. This work was an unequivocal counter-example to both the negative-slope melting curve and the partial wettability hypotheses, as the mW model satisfies both these criteria.
These apparent inconsistencies are partly due to the sensitivity of nucleation kinetics to thermodynamic features of the underlying force fields, such as the presence or absence of electrostatic interactions. Due to recent advances in computer architecture, and in molecular simulation techniques, it is now possible to systematically estimate the characteristic relaxation and nucleation times for different water models. In this context, there is a large variability. Some models such as TIP4P/Ice Abascal et al. (2005) and TIP4P/2005 Abascal and Vega (2005) almost never crystallize in molecular dynamics simulations, and there is an astronomical separation of relaxation and nucleation time scales in conventional MD simulations Haji-Akbari and Debenedetti (2015). At the other end of the spectrum, are the models such as the monoatomic water (mW) model Molinero and Moore (2009) that spontaneously crystallize at sufficiently low temperatures. This coarse-grained model of water was developed by re-parameterizing the Stillinger-Weber potential Stillinger and Weber (1985) that had been originally developed for group IV elements.
Another difference between different water models, is the presence of a second liquid-liquid critical point. The mW model does not exhibit a liquid-liquid transition in the supercooled regime Limmer and Chandler (2011), while this transition is observed in the molecular ST2 model Palmer et al. (2014). At present, it is not fully understood what features of these different water models lead to such stark differences in the separation of structural relaxation and crystallization time scales, or in the existence or absence of a second critical point. A systematic approach for addressing these fundamental questions is to investigate the sensitivity of these specific predictions to particular features of the underlying water-like models. In this work, we are interested in this very fundamental question, and we investigate the role of the tetrahedrality of a family of coarse-grained water models on the nucleation kinetics by studying the SW potentials with different tetrahedrality parameters. We are, in particular, interested in the effect of the tetrahedrality parameter on: (i) the nucleation kinetics, and (ii) the suppression or facilitation of crystallization at vapor-liquid interfaces.
This paper is organized as follows. Section II, Methods, is divided into four subsections. In Section II.1, we introduce the family of SW potentials considered in this work. Section II.2 and II.3 are dedicated to technical details of the molecular dynamics simulations and the FFS calculations, respectively. The particular order parameter used for tracking the progress of crystallization is discussed in Section II.4. Section III, Results and Discussion, is divided into three subsections. In Section III.1, the rate calculations are summarized. In Section III.2, we provide an in-depth analysis of the dependence of bulk nucleation rates on , the tetrahedrality parameter, while in Section III.3, the effect of on the facilitation or suppression of crystallization at a vapor-liquid interface is discussed. Finally, Section IV is reserved for our concluding remarks.
II Methods
II.1 The Stillinger-Weber potential
In this work, we consider a family of tetrahedral liquids, described by the Stillinger-Weber potential Stillinger and Weber (1985):
| (1) |
with
| (2) | |||||
| (3) | |||||
| (4) |
Here is the distance between the particles and and is the angle between the and displacement vectors. corresponds to the two-body interactions between two individual particles, while is a three-body term that is used for enforcing tetrahedrality in the liquid. The values of , , , , and are constant for different parameterizations of the SW potential, and are given in Table 1. The exponential terms in Eqs. (2) and (3) are to assure that both the potential and its derivatives go to zero at . The tetrahedrality parameter, , modulates the energetic penalty of deviating from , the ideal tetrahedral angle. In the original parameterization of the SW potential for Group IV elements, is 20, 21 and 26.2 for Ge, Si, and C, respectively. In the SW-based water potential, mW, . In this work, we investigated tetrahedral liquids with and 24, with kcal/mol and Å taken from the mW potential Molinero and Moore (2009).
| Parameter | Value | Parameter | Value |
|---|---|---|---|
| 7.049556277 | 4 | ||
| 0.6022245584 | 0 | ||
| 1.2 | 1.8 |
II.2 System Preparation and Molecular Dynamics Simulations
Molecular dynamics simulations are performed using LAMMPS Plimpton (1995). Newton’s equations of motion are integrated using the velocity-Verlet algorithm Swope et al. (1982) with a time step of 2 fs. Temperature is controlled using a Nosé-Hoover Nosé (1984); Hoover (1985) thermostat with ps. In simulations, pressure is controlled using a Parinello-Rahman barostat Parrinello and Rahman (1981) with ps.
Throughout this study, we carry out two types of MD simulations, all in boxes that are periodic in all three directions. For the bulk geometry, simulations are carried out in the isothermal-isobaric, , ensemble. Initial configurations are obtained by quenching and compressing a dilute simple cubic lattice of molecules to the target temperature and pressure. These simulations are carried out for a minimum of 40 ns, which is much longer than the characteristic structural relaxation times of all the systems considered in this work. The characteristic relaxation times, as computed from the decay of the self-intermediate scattering function, are in the order of a few picoseconds for all the systems considered in this work Haji-Akbari and Debenedetti (2015); Haji-Akbari et al. (2014). For the film geometry, simulations are carried out in the isothermal-isochoric, , ensemble. In this case, the cubic boxes of the configurations equilibrated in the bulk geometry are expanded along the direction by a factor of four, and the resulting configurations are equilibrated in MD simulations for an additional 40 ns. The resulting films are roughly 5-nm in thickness, and the expansion of the box along the direction assures that the films are not affected by their periodic images. For rate calculations, all simulations are carried out at a relative supercooling of, with , the equilibrium melting temperatures at zero pressure obtained from Ref. Molinero and Moore (2009) and given in Table 2. The rationale behind fixing , and not , will be explained in Section III.2.
| [K] | |
|---|---|
| 21 | 206 |
| 22 | 240 |
| 23.15 | 274 |
| 24 | 291 |
II.3 Forward-flux Sampling
Nucleation rates are computed using the forward-flux sampling technique Allen et al. (2006). In this method, the process of transitioning from , the metastable liquid basin, to , the crystalline basin is simulated in stages defined by an order parameter, , that evolves monotonically between the two basins. Individual stages are defined with the milestones with each stage involving the sampling of trajectories that start at , and cross the next milestone, , or return to , the original basin. Before starting the first stage, regular MD simulations are carried out in the basin in order to gather sufficient number of configurations at , the first milestone after the basin. The positioning of the individual milestone is so that the transition probability between successive milestones is between and , except for large ’s (close to ) for which the transition probabilities are close to unity. The FFS calculation is terminated when for every . The nucleation rate is then given by:
| (5) |
Here, is the flux of trajectories that cross after leaving (see below), and is the probability that a trajectory initiated from a configuration at reaches the crystalline basin, . The flux, , is computed from a series of MD simulations in using the following expression:
| (6) |
Here, is the total number of crossings (of ) originating in , is the average volume of the liquid and is the length of the underlying MD trajectory. For the bulk geometry, is the average volume of the simulation box. For thin films, is obtained by partitioning the simulation box into a grid of cubic cells of size 3.2 Å and enumerating the average number of cells that have at least eleven nonempty neighboring cells Haji-Akbari et al. (2014). For both geometries, these simulations are continued until a minimum of 700 configurations are obtained at .
To compute , the transition probability from to , a configuration at is randomly chosen, and its momenta are randomized using the Maxwell-Boltzmann distribution. The arising MD trajectory is integrated until it ’succeeds‘ by crossing , or it fails by returning back to . This procedure is repeated until a minimum of 700 configurations are collected at . is then estimated as the fraction of successful trajectories.
II.4 Order Parameter
As has been customary in crystallization studies Li et al. (2009, 2009, 2011, 2013); Haji-Akbari et al. (2014); Haji-Akbari and Debenedetti (2015), is chosen to be the number of molecules in the largest solid-like cluster in the system. To this end, all solid- and liquid-like molecules in the system are detected using the bond-orientational order parameter, proposed by Steinhardt et al. Steinhardt et al. (1983). For each molecule, , is given by:
| (7) |
with the number of nearest neighbors of (as defined per a distance cutoff) and and denote the azimuthal and polar angles associated with the displacement vector . A scalar invariant of is given by:
| (8) |
In accordance with earlier studies Li et al. (2011, 2013); Haji-Akbari et al. (2014); Haji-Akbari and Debenedetti (2015), we use a distance cutoff of Å for . For and 22, a larger nearest neighbor shell is utilized, with a distance cutoff of 3.45 Å. As shown in Fig. 1, the first neighbor shell expands as decreases. For and 22, FFS calculations never converge when a distance cutoff of 3.2 Å is utilized.
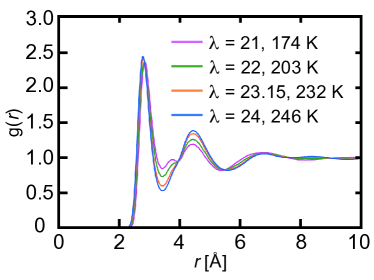
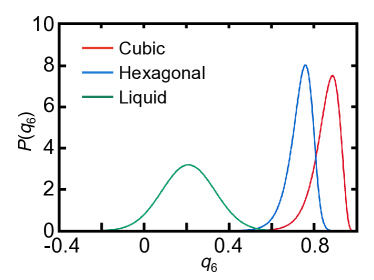
Fig. 2 depicts the histograms for the supercooled liquid, and the cubic and hexagonal crystals at and K. Similar histograms are observed for the other values investigated in this work. Note that there is very little overlap between the distribution in the liquid and the crystal, making a robust way of distinguishing solid- and liquid-like molecules. Accordingly, every molecule with is labelled as solid-like, and the solid-like molecules that are within the nearest neighbor shell of one another are grouped together to form clusters of solid-like molecules. In order to remove chains of locally tetrahedral molecules and to obtain more compact crystallites, we apply the chain exclusion algorithm developed by Reinhardt et al. Reinhardt et al. (2012) to the resulting clusters.
III Results and Discussions
III.1 Summary of Nucleation Rate Calculations
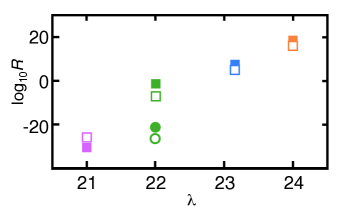
Table 3 and Fig. 3 summarize the rates computed from FFS. For , rates are obtained from Ref. Haji-Akbari et al. (2014). For , we carry out an additional set of rate calculations at K for reasons that will be explained in Section III.3. This corresponds to a relative supercooling of , slightly higher than the for other systems.
Table 4 summarizes the technical specifications of the basin simulations. Note that is fairly insensitive to . This is not surprising considering that strongly depends on the particular choice of the and milestones. Indeed, we always choose towards of the 0.1% tail of the histogram in the liquid basin. Considering the thermal nature of fluctuations in , such a uniform criterion will give rise to fluxes that are more or less of the same order of magnitude.
| Geometry | |||||
|---|---|---|---|---|---|
| 21 | 174 | Bulk | 0.565 | ||
| 21 | 174 | Film | |||
| 22 | 203 | Bulk | |||
| 22 | 203 | Film | |||
| 22 | 209 | Bulk | |||
| 22 | 209 | Film | |||
| 24 | 209 | Bulk | |||
| 24 | 209 | Film |
| [K] | Geometry | [ns] | [nm3] | |||||
|---|---|---|---|---|---|---|---|---|
| 21 | 174 | bulk | 1 | 5 | 664.90 | 114.653 | ||
| 21 | 174 | film | 2 | 8 | 755.00 | 139.926 | ||
| 22 | 203 | bulk | 2 | 6 | 144.00 | 118.356 | ||
| 22 | 203 | film | 3 | 8 | 127.09 | 122.236 | ||
| 22 | 209 | bulk | 2 | 7 | 585.50 | 118.297 | ||
| 22 | 209 | film | 3 | 8 | 436.58 | 143.651 | ||
| 24 | 246 | bulk | 5 | 10 | 96.00 | 125.830 | ||
| 24 | 246 | film | 5 | 10 | 111.76 | 127.320 |
III.2 Dependence of Bulk Nucleation Kinetics
As can be observed in Table 3 and Fig. 3, the nucleation rate is a strong function of . For a relative supercooling of , increases by orders of magnitude, from at to at . This trend is consistent with our intuition that nucleating a tetrahedral crystal must be easier from a more tetrahedral liquid (i.e., a liquid with higher ).
In order to obtain a more quantitative understanding, we employ the classical nucleation theory (CNT) Volmer and Weber (1926); Becker and Döring (1935); Turnbull and Fisher (1949); Debenedetti (1996), which is a particularly useful quantitative framework for studying nucleation. Despite its approximate nature, CNT provides a physically reasonable picture of the nucleation process and can thus be used not only for making sense of the observed/computed nucleation rates, but also for predicting rates under conditions at which direct rate measurements/calculations are not feasible. By assuming that a crystalline nucleus is in quasi-equilibrium with the surrounding liquid, CNT yields the following expression for , the nucleation rate:
| (9) |
Here, is the kinetic pre-factor given by:
| (10) |
with and , the self-diffusivity and the density of the liquid. is the atomic jump distance in the liquid and corresponds to the diffusion mean path. is the Zeldovich factor, which depends on both the thermodynamic driving force, , and the critical nucleus size :
| (11) |
Here, is the absolute value of the difference between the chemical potentials of the metastable liquid and the stable crystalline phase. The nucleation rate possesses an exponential dependence on , the nucleation barrier, a quantity that accordingly plays a crucial role in determining the magnitude of the nucleation rate. For a spherical nucleus, is given by:
| (12) |
Here is the solid-liquid surface tension and is the number density of the crystal. Assuming that , the melting enthalpy, and , the melting entropy, are not strong functions of temperature, Eq. (12) can be rewritten as:
| (13) |
Eq. (13) is the main motivation behind choosing over as the supercooling parameter in this study. The assumption of and being independent of temperature is, however, not very accurate for water considering its heat capacity anomaly. Therefore, we do not use Eq. (13) for any quantitative analysis.
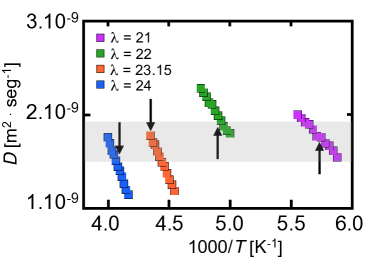
Using Eqs. (9), (10) and (12), it is possible to assess the relative contributions of the kinetic pre-factor and the nucleation barrier to the observed changes in . It is clear from Eq. (10) that the kinetic pre-factor, , is most sensitive to self-diffusivity, . Fig. 4 depicts vs. computed from simulations at 1 bar and using the well-known Einstein formula Helfand (1960). At fixed , does not change significantly with , and is always around . This makes , the kinetic pre-factor, insensitive to changes in at fixed . Therefore, any change in is almost exclusively a consequence of the change in the nucleation barrier.
It is interesting to note that a fixed would correspond to a higher absolute temperature in a liquid with higher , and yet, the self-diffusivity remains unchanged. In other words, increasing is qualitatively equivalent to decreasing temperature. This can be explained by noting that the liquid becomes more structured at higher ’s, due to the emergence of more locally tetrahedral arrangements. Such added structuring will make it more difficult for molecules to escape their tetrahedral cages. Therefore, the propensity to form more local tetrahedral arrangements offsets the faster dynamics at higher absolute temperatures, and keeps self-diffusivity almost unchanged as long as is constant. This picture is consistent with earlier observations that in supercooled water, the low-density liquid, which is highly tetrahedral, has much larger relaxation times- and much smaller diffusivities- in comparison to the less-tetrahedral high-density liquid at identical temperatures Errington and Debenedetti (2001).
The exponential term in Eq. (9), however, depends on two thermodynamic properties: , the free energy difference between the liquid and the solid, and , the liquid-solid surface tension. Slight changes in either of these quantities can alter the nucleation rate by several orders of magnitude. As noted earlier in the literature Haji-Akbari et al. (2014); Haji-Akbari and Debenedetti (2015), it is notoriously difficult to estimate in the supercooled regime, due to the difficulty of stabilizing a solid-liquid interface. On the contrary, is very easy to compute and is obtained from thermodynamic integration:
| (14) |
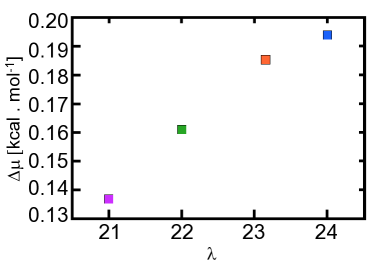
with and the molar enthalpies of the liquid and the hexagonal crystal, respectively. Those enthalpies are obtained from simulations from . As depicted in Fig. 5, is a strictly increasing function of at constant . This is in line with our intuition that a tetrahedral crystal will become more stable as increases. However, it is not known a priori whether such an increase in is sufficient for explaining the 48 orders of magnitude increase in the nucleation rate.
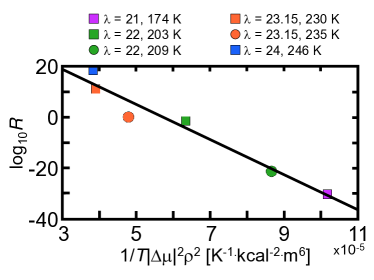
A systematic way of deciphering the relative contributions of and on is to assume that is constant and independent of and temperature. It then follows from Eq. (12) that a linear fit must exist between and :
| (15) |
Fig. 6 depicts vs. for the four bulk rate calculations performed in this work as well as the two rate calculations of Ref. Haji-Akbari et al. (2014) at and 0.858. The linear fit is reasonably good with . It is therefore safe to conclude that the observed change in nucleation rates can, for the most part, be explained by the change in . As a corollary, the possible contribution of to the rate is expected to be minimal. Indeed, one expects that will decrease upon increasing , as there will be higher structural similarity between the liquid and the crystal at more tetrahedral liquids. However, such a change does not appear to be very important, at least over the range of ’s considered in this work. It has indeed been observed that is a weak function of temperature for the mW model Espinosa et al. (2014), and our findings suggest that the same assertion might be true for the dependence of . Indeed, the obtained from Eq. (15) is , which is statistically indistinguishable from earlier estimates of Li et al. (2011), Limmer and Chandler (2012) and Espinosa et al. (2014) for in the mW system.
| 21 | 174 | 0.84 | |
| 22 | 203 | 0.84 | |
| 22 | 209 | 0.87 | |
| 23.15 | 232 | 0.84 | |
| 24 | 246 | 0.84 |
III.3 Freezing at Vapor-Liquid Interfaces
As evident in Table 3 and Fig. 3, a crossover exists between the bulk-dominated crystallization at and the surface-enhanced crystallization at . Table 5 summarizes for the films considered in this work. The sensitivity of the nucleation rate to the presence or absence of an interface tends to be stronger at lower ’s. For , for instance, nucleation in the film is almost five orders of magnitude slower than in the bulk, while at , it is five orders of magnitude faster. Contrast this to the bulk-to-film ratios at higher ’s in which the ratio is only around two orders of magnitude.
Earlier studies of surface crystallization in silicon, another tetrahedral liquid, have revealed that the facilitation or suppression of crystallization in the subsurface region might depend on temperature Li et al. (2009). In their simulations of silicon films using the Tersoff potential Tersoff (1989), Li et al. had discovered that surface-induced crystallization is only observed for , with surface crystallization being suppressed at lower temperatures. In order to confirm that our observation of the bulk-dominated crystallization at and K is robust, we carry out another set of rate calculations at K, which corresponds to a relative supercooling of . In those calculations, we still observe the suppression of nucleation at the vapor-liquid interface.
In Section I, we provide a thorough discussion of different attempts for establishing a correlation between the thermodynamic properties of a material and its propensity to surface-dominated crystallization. Features such as partial wettability of a crystal by its liquid Tabazadeh et al. (2002), as well as having a negatively-sloped melting curve Li et al. (2009) have been associated with surface-induced crystallization. Earlier studies of nucleation kinetics in freestanding thin mW films Haji-Akbari et al. (2014) have demonstrated that none of the above-mentioned features can be used as predictive indicators of surface-freezing as surface crystallization is suppressed in the mW system, despite satisfying both these criteria.
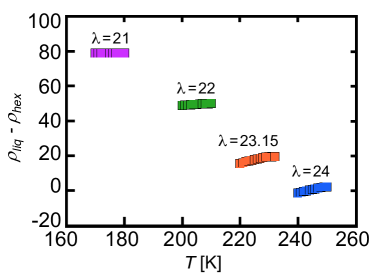
The inability of negative-slope melting curves to predict the enhancement of surface crystallization is further emphasized in this work. Fig. 7 depicts the density difference between the liquid and the hexagonal crystal for temperatures in the vicinity of . For , the liquid is always denser than the crystal, with the density difference increasing upon decreasing . For , however, there is almost no density difference between the liquid and the crystal. The increase in liquid density upon decreasing is consistent with the widening of the first peak of in Fig. 1 and is due to the merging of the first and second nearest neighbor shells at low tetrahedralities. It must be noted that no correspondence exists between the crossover in density difference at , and the crossover of surface crystallization kinetics at . From a molecular perspective, it is difficult to understand how a simple variable such as density difference would capture the effect of structural intricacies of the interfacial region on a phenomenon as complex as surface freezing.
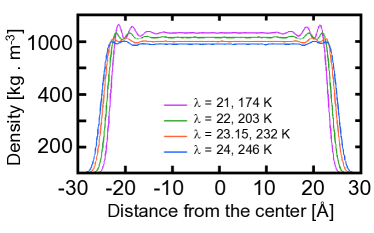
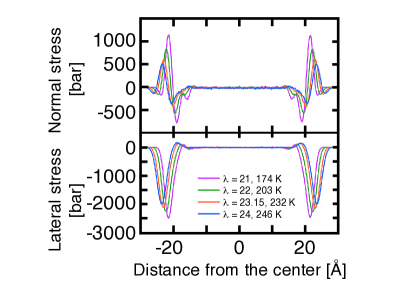
Another feature of a material that can potentially impact the crystallization kinetics close to the vapor-liquid interface is the microstructure of the interfacial region induced as a result of confinement. In order to understand the effect of on the molecular structure of the interfacial region, we compute density (Fig. 8) and lateral and normal stress profiles (Fig. 9) across the 5-nm films, using the approach discussed in Ref. Haji-Akbari and Debenedetti (2014). The films tend to become more structured as decreases. This is evident in the emergence of more peaks in the density profile (Fig. 8), and more prominently, a second peak in the normal stress profile (Fig. 9). Such enhanced structuring can, indeed, make a film more amenable to crystallization as the most structured film, i.e., , is the very film in which surface crystallization is enhanced. This picture is, however, incomplete as the emergence of the above-mentioned peaks first occurs at , and it is not clear how and why such an enhanced structuring at does not translate into the facilitation of crystallization at the surface. Note that the thickness of the interfacial region, defined as the region with anisotropic stress tensor, is virtually insensitive to and is around 12-13 Å in all the films considered in this work.
Another peculiarity that is noted in Table 5 is the especially strong suppression of crystallization at . We can explain this anomaly by the following two considerations. First, films are thinner at lower ’s due to the increase in as decreases. This increases the relative share of the interfacial region in the entire volume of the film as the width of the interfacial region is almost constant. As demonstrated in Ref. Haji-Akbari et al. (2014), the suppression of surface crystallization is more pronounced in thinner films. Secondly, the interfacial region is more anisotropic at , in the sense that the difference between the lateral and normal stress is larger. Therefore, whatever feature that suppresses surface crystallization for is likely to be stronger at . This will lead to a decrease in growth probabilities of large crystallites, due to the asymmetric growth of the confined crystallites discussed in Ref. Haji-Akbari et al. (2014). In this context, the side of the nucleus that is exposed to the highly anisotropic interfacial region might be less likely to absorb new liquid-like molecules at than higher values. The combination of these two effects can decrease the effective volumetric nucleation rate, , by larger quantities at in comparison to higher ’s.
IV Conclusions
In this work, we investigate the effect of , the tetrahedrality parameter, on the kinetics of crystal nucleation in a family of Stillinger-Weber potentials, with and taken from the mW potential, but with . We observe that the nucleation rate is a strong function of and changes by approximately 48 orders of magnitude upon changing from 21 to 24 at a relative supercooling of . By computing self-diffusivities at different ’s, we conclude that the kinetic pre-factor in CNT is virtually insensitive to , and the change in rate in predominantly a consequence of the change in the nucleation barrier. We also use thermodynamic integration to estimated , the thermodynamic driving force, for different ’s and observe that , increases upon increasing . By assuming the validity of classical nucleation theory, we demonstrate that the observed change in can, for the most part, be accurately explained by the corresponding change in , suggesting that any possible change of with is too small to affect the nucleation kinetics. We also examine the role of vapor-liquid interfaces on freezing, and observe a crossover between the bulk-dominated freezing at , and surface-dominated freezing at = 21. We observe that the interfacial region becomes more structured at lower ’s. However, this enhanced structuring starts at , which does not coincide with the observed crossover into surface-induced crystallization at . The existence of a negatively-sloped melting curve is not predictive either, as the liquid is denser than the crystal for . This underscores the difficulty of identifying the true cause of surface-induced crystallization, as the existing heuristics– i.e., the negative-slope melting curve, and the partial wettability of the crystal– seem to be incapable of explaining the trends observed here and in Ref. Haji-Akbari et al. (2014).
This current work is among the first to systematically investigate the effect of certain features of a water model on its thermodynamic and kinetic properties. This approach can also provide us with a more fundamental perspective of phase transitions in aqueous systems, and how they are affected by water anomalies. A similar approach has been recently used to investigate the effect of other features of water models, such as the hydrogen bond flexibility, on the existence of a second liquid-liquid critical point in the ST2 model Smallenburg and Sciortino (2015). Such studies will collectively enrich our knowledge of water and its structural, kinetic and thermodynamic peculiarities.
Acknowledgements.
P.G.D. gratefully acknowledges the support of the National Science Foundation (Grant No. CHE-1213343), the Carbon Mitigation Initiative at Princeton University (CMI), and the Argentine National Agency for Scientific and Technological Promotion (Grant. PICT-Raíces PICT 2010-1291). M.P.L. thanks financial support from ANPCyT - FONCyT (PICT 2010 N∘1291). M.M.G. acknowledges a fellowship from CONICET. M.P.L. is a member of CONICET. These calculations were performed on the Terascale Infrastructure for Groundbreaking Research in Engineering and Science (TIGRESS) at Princeton University. This work also used the Extreme Science and Engineering Discovery Environment (XSEDE), which is supported by National Science Foundation grant number ACI-1053575.References
- Zender and Kiehl (1994) C. S. Zender and J. T. Kiehl, J. Geophys. Res., 1994, 99, 25869–25880.
- Hegg and Baker (2009) D. A. Hegg and M. B. Baker, Rep. Prog. Phys., 2009, 72, 056801.
- Herbert et al. (2015) R. J. Herbert, B. J. Murray, S. J. Dobbie and T. Koop, Geophys. Res. Lett., 2015, 42, 1599—1605.
- Butorin and Skripov (1972) G. T. Butorin and V. P. Skripov, Kristallografiya, 1972, 17, 379—384.
- Anderson et al. (1980) R. J. Anderson, R. C. Miller, J. L. Kassner Jr and D. E. Hagen, J. Atmos. Sci., 1980, 37, 2508–2520.
- Hagen et al. (1981) D. E. Hagen, R. J. Anderson and J. L. Kassner Jr, J. Atmos. Sci., 1981, 38, 1236–1243.
- Taborek (1985) P. Taborek, Phys. Rev. B, 1985, 32, 5902–5906.
- Sassen and Dodd (1988) K. Sassen and G. C. Dodd, J. Atmos. Sci., 1988, 45, 1357–1369.
- Krämer et al. (1999) D. P. B. Krämer, O. Hübner, H. Vortisch, L. Wöste, T. Leisner, M. Schwell, E. Rühl and H. Baumgärtel, J. Chem. Phys., 1999, 111, 6521–6527.
- Stöckel et al. (2005) P. Stöckel, I. M. Weidinger, H. Baumgärtel and T. Leisner, J. Phys. Chem. A, 2005, 109, 2540–2546.
- Laksmono et al. (2015) H. Laksmono, T. A. McQueen, J. A. Sellberg, N. D. Loh, C. Huang, D. Schlesinger, R. G. Sierra, C. Y. Hampton, D. Nordlund, M. Beye, A. V. Martin, A. Barty, M. M. Seibert, M. Messerschmidt, G. J. Williams, S. Boutet, K. Amann-Winkel, T. Loerting, L. G. M. Pettersson, M. J. Bogan and A. Nilsson, J. Phys. Chem. Lett., 2015, 6, 2826–2832.
- Haji-Akbari and Debenedetti (2015) A. Haji-Akbari and P. G. Debenedetti, Proc. Natl. Acad. Sci. USA, 2015, 112, 10582–10588.
- Matsumoto et al. (2002) M. Matsumoto, S. Saito and I. Ohmine, Nature, 2002, 416, 409–413.
- Vrbka and Jungwirth (2006) L. Vrbka and P. Jungwirth, J. Phys. Chem. B, 2006, 110, 18126–18129.
- Vrbka and Jungwirth (2007) L. Vrbka and P. Jungwirth, J. Mol. Liq., 2007, 134, 64–70.
- Pluhaŕová et al. (2010) E. Pluhaŕová, L. Vrbka and P. Jungwirth, J. Phys. Chem. C, 2010, 114, 7831–7838.
- Moore and Molinero (2011) E. B. Moore and V. Molinero, Phys. Chem. Chem. Phys., 2011, 13, 20008–20016.
- Yagasaki et al. (2014) T. Yagasaki, M. Matsumoto and H. Tanaka, Phys. Rev. E, 2014, 89, 020301(R).
- Radhakrishnan and Trout (2003) R. Radhakrishnan and B. L. Trout, J. Am. Chem. Soc., 2003, 125, 7743–7747.
- Brukhno et al. (2008) A. V. Brukhno, J. Anwar, R. Davidchack and R. Hande, J. Phys.: Condens. Matter, 2008, 20, 494243.
- Quigley and Rodger (2008) D. Quigley and P. M. Rodger, J. Chem. Phys., 2008, 128, 154518.
- Reinhardt and Doye (2012) A. Reinhardt and J. P. K. Doye, J. Chem. Phys., 2012, 136, 054501.
- Palmer et al. (2014) J. C. Palmer, F. Martelli, Y. Liu, R. Car, A. Z. Panagiotopoulos and P. G. Debenedetti, Nature, 2014, 510, 385–388.
- Allen et al. (2006) R. J. Allen, D. Frenkel and P. R. ten Wolde, J. Chem. Phys., 2006, 124, 194111.
- Sharma and Debenedetti (2012) S. Sharma and P. G. Debenedetti, Proc. Natl. Acad. Sci. USA, 2012, 109, 4365—4370.
- Rekvig and Frenkel (2007) L. Rekvig and D. Frenkel, J. Chem. Phys., 2007, 127, 134701.
- Savoy and Escobedo (2012) E. S. Savoy and F. A. Escobedo, Langmuir, 2012, 28, 3412–3419.
- Vogler et al. (2013) C. Vogler, F. Bruckner, B. Bergmair, T. Huber, D. Suess and C. Dellago, Phys. Rev. B, 2013, 88, 134409.
- Borrero and Escobedo (2007) E. E. Borrero and F. A. Escobedo, J. Chem. Phys., 2007, 127, 164101.
- Sanz et al. (2007) E. Sanz, C. Valeriani, D. Frenkel and M. Dijkstra, Phys. Rev. Lett., 2007, 99, 055501.
- Li et al. (2009) T. Li, D. Donadio, L. M. Ghiringhelli and G. Galli, Nat. Mater., 2009, 8, 726–730.
- Li et al. (2009) T. Li, D. Donadio and G. Galli, J. Chem. Phys., 2009, 131, 224519.
- Li et al. (2011) T. Li, D. Donadio, G. Russo and G. Galli, Phys. Chem. Chem. Phys., 2011, 13, 19807–19813.
- Li et al. (2013) T. Li, D. Donadio and G. Galli, Nat. Comm., 2013, 4, 1887.
- Thapar and Escobedo (2014) V. Thapar and F. A. Escobedo, Phys. Rev. Lett., 2014, 112, 048301.
- Haji-Akbari et al. (2014) A. Haji-Akbari, R. S. DeFever, S. Sarupria and P. G. Debenedetti, Phys. Chem. Chem. Phys., 2014, 16, 25916–25927.
- Abascal et al. (2005) J. L. F. Abascal, E. Sanz, R. G. Fernández and C. Vega, J. Chem. Phys., 2005, 122, 234511.
- Bartels-Rausch (2013) T. Bartels-Rausch, Nature, 2013, 494, 27–29.
- Tabazadeh et al. (2002) A. Tabazadeh, Y. S. Djikaev and H. Reiss, Proc. Natl. Acad. Sci. USA, 2002, 99, 15873–15878.
- Duft and Leisner (2004) D. Duft and T. Leisner, Atmos. Chem. Phys. Disc., 2004, 4, 3077–3088.
- Shaw et al. (2005) R. A. Shaw, A. J. Durant and Y. Mi, J. Phys. Chem. B, 2005, 109, 9865–9868.
- Ómar F. Sigurbjörnsson and Signorell (2008) Ómar F. Sigurbjörnsson and R. Signorell, Phys. Rev. E, 2008, 77, 051601.
- Gurganus et al. (2011) C. Gurganus, A. B. Kostinski and R. A. Shaw, J. Phys. Chem. Lett., 2011, 2, 1449–1454.
- Nada and van der Eerden (2003) H. Nada and J. P. J. M. van der Eerden, J. Chem. Phys., 2003, 118, 7401–7413.
- Svishchev and Kusalik (1994) I. M. Svishchev and P. G. Kusalik, Phys. Rev. Lett., 1994, 73, 975–978.
- Svishchev and Kusalik (1996) I. M. Svishchev and P. G. Kusalik, J. Am. Chem. Soc., 1996, 118, 649–654.
- Abascal and Vega (2005) J. L. F. Abascal and C. Vega, J. Chem. Phys., 2005, 123, 234505.
- Molinero and Moore (2009) V. Molinero and E. B. Moore, J. Phys. Chem. B, 2009, 113, 4008–4016.
- Stillinger and Weber (1985) F. H. Stillinger and T. A. Weber, Phys. Rev. B, 1985, 31, 5262–5271.
- Limmer and Chandler (2011) D. T. Limmer and D. Chandler, J. Chem. Phys., 2011, 135, 134503.
- Plimpton (1995) S. J. Plimpton, J Comp. Phys., 1995, 117, 1–19.
- Swope et al. (1982) W. C. Swope, H. C. Andersen, P. H. Berens and K. R. Wilson, J. Chem. Phys., 1982, 76, 637–649.
- Nosé (1984) S. Nosé, Mol. Phys., 1984, 52, 255–268.
- Hoover (1985) W. G. Hoover, Phys Rev A, 1985, 31, 1695–1697.
- Parrinello and Rahman (1981) M. Parrinello and A. Rahman, J. Appl. Phys., 1981, 52, 7182–7190.
- Steinhardt et al. (1983) P. J. Steinhardt, D. R. Nelson and M. Ronchetti, Phys. Rev. B, 1983, 28, 784–805.
- Reinhardt et al. (2012) A. Reinhardt, J. P. K. Doye, E. G. Noya and C. Vega, J. Chem. Phys., 2012, 137, 194504.
- Volmer and Weber (1926) M. Volmer and A. Weber, Z. physik. Chem., 1926, 119, 277–301.
- Becker and Döring (1935) R. Becker and W. Döring, Ann. Phys., 1935, 416, 719–752.
- Turnbull and Fisher (1949) D. Turnbull and J. C. Fisher, J. Chem. Phys., 1949, 17, 71.
- Debenedetti (1996) P. G. Debenedetti, Metastable Liquids: Concepts and Principles, Princeton University Press, Princeton, NJ, 1996.
- Helfand (1960) E. Helfand, Phys. Rev., 1960, 119, 1–9.
- Errington and Debenedetti (2001) J. R. Errington and P. G. Debenedetti, Nature, 2001, 409, 318–321.
- Espinosa et al. (2014) J. R. Espinosa, E. Sanz, C. Valeriani and C. Vega, J. Chem. Phys., 2014, 141, 18C529.
- Limmer and Chandler (2012) D. T. Limmer and D. Chandler, J. Chem. Phys., 2012, 137, 044509.
- Tersoff (1989) J. Tersoff, Phys. Rev. B, 1989, 39, 5566(R).
- Haji-Akbari and Debenedetti (2014) A. Haji-Akbari and P. G. Debenedetti, J. Chem. Phys., 2014, 141, 024506.
- Smallenburg and Sciortino (2015) F. Smallenburg and F. Sciortino, Phys. Rev. Lett., 2015, 115, 015701.